
BIOSOL Final reportDEF - UGent · climate , science for a sustainable development (ssd) final...
95
FINAL REPORT PHASE I FORMATION MECHANISMS, MARKER COMPOUNDS AND SOURCE APPORTIONMENT FOR BIOGENIC ATMOSPHERIC AEROSOLS “BIOSOL” W. MAENHAUT, M. CLAEYS, I. JANSSENS, M. KULMALA
Transcript of BIOSOL Final reportDEF - UGent · climate , science for a sustainable development (ssd) final...
FINAL REPORT PHASE I
FORMATION MECHANISMS, MARKER COMPOUNDS AND SOURCE APPORTIONMENT FOR BIOGENIC
ATMOSPHERIC AEROSOLS
“BIOSOL”
W. MAENHAUT, M. CLAEYS, I. JANSSENS, M. KULMALA
Climate
SCIENCE FOR A SUSTAINABLE DEVELOPMENT (SSD)
FINAL REPORT
FORMATION MECHANISMS, MARKER COMPOUNDS AND SOURCE APPORTIONMENT FOR BIOGENIC
ATMOSPHERIC AEROSOLS “BIOSOL”
SD/AT/02A
Promotors
Willy MAENHAUT Ghent University (UGent)
Department of Analytical Chemistry Institute for Nuclear Sciences Research group
“Tropospheric Aerosol Research and Nuclear Microanalysis” Proeftuinstraat 86, B-9000 Gent
Tel: +32-9-264.65.96 - Fax: +32-9-264.66.99 [email protected]
Magda CLAEYS University of Antwerp (UA)
Department of Pharmaceutical Sciences Research group “Bio-organic Mass Spectrometry”
Universiteitsplein 1, B-2610 Antwerpen Tel: +32-3-820.27.07 - Fax: +32-3-820.27.40
Ivan JANSSENS University of Antwerp (UA)
Department of Biology Research group “Plant and Vegetation Ecology”
Universiteitsplein 1, B-2610 Antwerpen Tel: +32-3-820.22.55 - Fax: +32-3-820.22.71
Markku KULMALA University of Helsinki (UHEL)
Department of Physical Sciences, Division of Atmospheric Sciences Gustaf Hällströmin katu 2, FIN-00014 Helsinki, Finland
Tel: +358-9-191.50.756 - Fax: +358-9-191.50.717 [email protected]
Authors
Willy Maenhaut, Magda Claeys, Ivan Janssens, Markku Kulmala
Rue de la Science 8 Wetenschapsstraat 8 B-1000 Brussels Belgium Tel: +32 (0)2 238 34 11 – Fax: +32 (0)2 230 59 12 http://www.belspo.be Contact person: Martine Vanderstraeten +32 (0)2 238 36 10 Project Website : http://www.analchem.ugent.be/BIOSOL/ Neither the Belgian Science Policy nor any person acting on behalf of the Belgian Science Policy is responsible for the use which might be made of the following information. The authors are responsible for the content.
No part of this publication may be reproduced, stored in a retrieval system, or transmitted in any form or by any means, electronic, mechanical, photocopying, recording, or otherwise, without indicating the reference :
Willy Maenhaut, Magda Claeys, Markku Kulmala, Ivan Janssens. Formation mechanisms, marker compounds and source apportionment for biogenic atmospheric aerosols “BIOSOL” Final Report Phase 1. Brussels : Belgian Science Policy 2009 – 94 p. (Research Programme Science for a Sustainable Development )
Project SD/AT/02A – Formation mechanisms, marker compounds and source apportionment for biogenic atmospheric aerosols “BIOSOL”
SSD - Science for a Sustainable Development – Atmosphere 3
TABLE OF CONTENTS
ABSTRACT................................................................. 8
1. CONTEXT AND OBJECTIVES............................................ 14
2. METHODS AND APPROACHES .......................................... 18 2.1. Study of the formation mechanisms of SOA from isoprene (and other
BVOCs) by laboratory experiments .................................. 18 2.2. Field experiment at the forested site of K-puszta, Hungary ............... 19 2.3. Field experiment at the state forest “De Inslag”, Brasschaat, Belgium ...... 21 2.4. Field experiment at the forested site of SMEAR II, Hyytiälä, Finland........ 22 2.5. Field work during an oceanic cruise and at a remote island in the
southern Indian Ocean........................................... 23 2.6. Data analyses and interpretation for the laboratory and field experiments ..... 24 2.7. Modelling of the formation and growth of the fine particles and of the fine
biogenic atmospheric aerosol...................................... 24 2.8. Identification of particulate-phase oxidation products of isoprene (and
other BVOCs), which can be used as indicator compounds for source apportionment ................................................. 25
2.9. Determination of the contribution from the BVOCs to the organic aerosol for various sites in Europe ........................................ 26
3. STUDY OF THE FORMATION OF BIOGENIC SOA THROUGH SMOG CHAMBER EXPERIMENTS....................................................... 27 3.1. Formation mechanisms of SOA from isoprene ........................ 27 3.2. Formation mechanism of 2-methyltetrols from gaseous precursors ........ 30 3.3. Structure of marker compounds for the photo-oxidation of α-pinene ........ 31 3.4. Studies on organosulphates ...................................... 31
4. STUDY OF THE FORMATION OF BIOGENIC SOA THROUGH PLANT GROWTH CHAMBER EXPERIMENTS.............................................. 34
5. COMPREHENSIVE STUDIES DURING THE 2006 SUMMER CAMPAIGN AT THE FORESTED SITE OF K-PUSZTA, HUNGARY ................................ 36 5.1. Meteorology and air mass origin.................................... 36 5.2. VOC data and relation to temperature ................................ 36 5.3. Relation of the data for the PM and various aerosol components to
temperature ................................................... 39 5.4. Examination of the VOC data set by Principal Component Analysis.......... 42 5.5. Physical aerosol data ............................................ 43 5.6. Assessment of artifacts in the collection of particulate OC ................ 45 5.7. Aerosol chemical mass closure .................................... 46
6. STUDIES DURING 2007 AT THE STATE FOREST “DE INSLAG”, BRASSCHAAT, BELGIUM ........................................................... 49 6.1. In-situ data for particulate OC and EC ................................ 49 6.2. Data from the HVDS aerosol samples ................................ 50
Project SD/AT/02A – Formation mechanisms, marker compounds and source apportionment for biogenic atmospheric aerosols “BIOSOL”
SSD - Science for a Sustainable Development – Atmosphere 4
6.3. VOC data ..................................................... 51
7. STUDIES AT THE SMEAR II FOREST STATION IN HYYTIÄLÄ, FINLAND ........... 54 7.1. Summer campaign in 2005 ........................................ 54 7.2. Meteorology, air mass origin, and inorganic trace gases for the 2007
summer campaign .............................................. 54 7.3. BVOC data and relation to temperature for the 2007 summer campaign....... 58 7.4. In-situ data for the PM, BC, and particulate OC and EC during the 2007
summer campaign and their relation to temperature ..................... 59 7.5. Mass size distributions for the PM and OC during the 2007 summer
campaign and comparison with physical aerosol data.................... 60 7.6. Filter data for the PM, OC, EC, and WSOC during the 2007 summer
campaign and assessment of artifacts in the collection of particulate OC ..... 62 7.7. Data for inorganic species during the 2007 summer campaign ............. 64
8. STUDIES DURING AN OCEANIC CRUISE AND AT A REMOTE ISLAND IN THE SOUTHERN INDIAN OCEAN............................................. 65 8.1. Aerosol study during an oceanic cruise in the Northern Hemisphere......... 65 8.2. Aerosol study at Amsterdam Island.................................. 70
9. MODELLING OF THE FORMATION AND GROWTH OF THE FINE PARTICLES AND OF THE FINE BIOGENIC ATMOSPHERIC AEROSOL ........................... 73
10. PARTICULATE-PHASE OXIDATION PRODUCTS OF ISOPRENE (AND OTHER BVOCS), WHICH CAN BE USED AS INDICATOR COMPOUNDS FOR SOURCE APPORTIONMENT .................................................... 74
11. DETERMINATION OF THE CONTRIBUTION FROM THE BVOCS TO THE ORGANIC AEROSOL FOR VARIOUS SITES IN EUROPE ................................ 77
12. VALORISATION ACTIVITIES AND EXPLOITATION OF THE RESULTS............. 78 12.1. Follow-up committee meetings ..................................... 78 12.2. Workshops .................................................... 79 12.3. Other valorisation activities........................................ 79
13. PRELIMINARY CONCLUSIONS AND RECOMMENDATIONS .................... 81
ACKNOWLEDGEMENTS ..................................................... 84
REFERENCES ............................................................. 86
Project SD/AT/02A – Formation mechanisms, marker compounds and source apportionment for biogenic atmospheric aerosols “BIOSOL”
SSD - Science for a Sustainable Development – Atmosphere 5
ACRONYMS, ABBREVIATIONS AND UNITS
2-MG 2-methylglyceric acid ACCENT European Network for Atmospheric Composition Change (project funded by the
European Commission) AD aerodynamic diameter AIS Air Ion Spectrometer APCA absolute principal component analysis BC black carbon BIOSOL Formation mechanisms, marker compounds, and source apportionment for biogenic
atmospheric aerosols (SSD project) BIRA-IASB Belgian Institute for Space Aeronomy BSA n-butanesulphonic acid BVOC biogenic volatile organic compound C Coordinator (Partner 1) of BIOSOL, i.e., Willy Maenhaut and his team (UGent) CACGP Commission on Atmospheric Chemistry and Global Pollution Caltech California Institute of Technology, U.S.A. CARBOSOL Present and Retrospective State of Organic versus Inorganic Aerosol over Europe :
Implications for Climate (project funded by the European Commission) CCN cloud condensation nuclei CI chemical ionisation CMB chemical mass balance (receptor model) Da Dalton DMPS Differential Mobility Particle Sizer EAC 2007 European Aerosol Conference 2007 EC elemental carbon EI electron ionisation EMEP European Monitoring and Evaluation Programme [Co-operative programme for
monitoring and evaluation of the long-range transmissions of air pollutants in Europe] EPA Environmental Protection Agency, U.S.A. ESA n-ethanesulphonic acid ESF European Science Foundation ESI-MS electrospray ionisation - mass spectrometry EU European Union EUSAAR European Supersites for Atmospheric Aerosol Research (project funded by the
European Commission) FMI Finnish Meteorological Institute FS full scan GAW Global Atmosphere Watch GC-FID gas chromatography-flame ionisation detection GC/MS gas chromatography / mass spectrometry HULIS humic-like substances HVDS Hi-Vol dichotomous sampler HYSPLIT Hybrid Single-Particle Lagrangian Integrated Trajectory model IBOOT Impact of Biogenic emissions on Organic aerosols and Oxidants in the Troposphere
(SSD project) IC ion chromatography IfT Leibniz Institute for Tropospheric Research, Germany
Project SD/AT/02A – Formation mechanisms, marker compounds and source apportionment for biogenic atmospheric aerosols “BIOSOL”
SSD - Science for a Sustainable Development – Atmosphere 6
IGAC International Global Atmospheric Chemistry Project INBO Flemish Institute for Nature and Forest Research INTROP Interdisciplinary Tropospheric Research : from the Laboratory to Global Change IPCC Intergovernmental Panel on Climate Change ISONET Marie Curie Research and Training Network “Ecological and physiological functions of
biogenic isoprenoids and their impact on the environment” LC liquid chromatography LC/MS liquid chromatography / mass spectrometry LNE Ministry of the Flemish Community, Departement Leefmilieu, Natuur en Energie LSCE Laboratoire des Sciences du Climat et de l’Environnement, France MACR methacrolein MBO 2-methyl-3-buten-2-ol MBTCA 3-methyl-1,2,3-butanetricarboxylic acid MIRA Milieurapport Vlaanderem MOUDI microorifice uniform deposit impactor MPIC Max Planck Institute for Chemistry MS mass spectrometry MSA methanesulphonic acid MSTFA methyl-N trimethylsilyltrifluoroacetamide MVK methyl vinyl ketone MW molecular weight m-XP methyl-β-D-xylanopyranoside m/z mass over charge ratio NAAPS Navy Aerosol Analysis and Prediction System NH Northern Hemisphere NMR nuclear magnetic resonance NOx = NO + NO2 nss non-sea-salt OC (particulate) organic carbon OM (particulate) organic matter OOMPH Organics over the Ocean Modifying Particles in both Hemispheres (project funded by
the European Commission) OptEC optical elemental carbon OptOC optical (particulate) organic carbon P2 Partner 2 of BIOSOL, i.e., Magda Claeys and her team (UA) P3 Partner 3 of BIOSOL, i.e., Ivan Janssens and his team (UA) P4 Partner 4 of BIOSOL, i.e., Markku Kulmala and his team (UHEL) PCA Principal Component Analysis PIXE particle-induced X-ray emission spectrometry PM particulate mass PM10 particulate matter with aerodynamic diameter smaller than 10 µm PM2.5 particulate matter with aerodynamic diameter smaller than 2.5 µm PMF positive matrix factorization ppb parts per billion ppbv parts per billion (by volume) PSA n-propanesulphonic acid PSI Paul Scherrer Institute, Switzerland PTR-MS proton-transfer reaction - mass spectrometry
Project SD/AT/02A – Formation mechanisms, marker compounds and source apportionment for biogenic atmospheric aerosols “BIOSOL”
SSD - Science for a Sustainable Development – Atmosphere 7
RH relative humidity (of the air) RT retention time SDI small deposit area low pressure cascade impactor SIM selected ion monitoring SMEAR Station for Measuring Forest Ecosystem - Atmosphere Relations SOA secondary organic aerosol SOAMASS Characterization of secondary organic aerosol from photooxidation of isoprene and
alpha-pinene with mass spectrometric approaches (project funded by the European Commission)
SPO Federal Science Policy Office SSD Science for a Sustainable Development TAR Third Assessment Report (of the IPCC) TC total (particulate) carbon; TC = OC + EC ; also = Optical OC + Optical EC TEOM Tapered Element Oscillating Microbalance TFMM Task Force on Measurements and Modelling TMCS trimethylchlorosilane TOT thermal-optical transmission UA University of Antwerp UGent Ghent University UHEL University of Helsinki UHMA model University of Helsinki Multicomponent Aerosol model UoC University of Crete UTC Coordinated Universal Time VMM Flemish Environmental Agency VOC volatile organic compound VOCBAS Volatile Organic Compounds in the Biosphere-Atmosphere System WMO World Meteorological Organization WSOC water-soluble (particulate) organic carbon
Project SD/AT/02A – Formation mechanisms, marker compounds and source apportionment for biogenic atmospheric aerosols “BIOSOL”
SSD - Science for a Sustainable Development – Atmosphere 8
ABSTRACT Biogenic volatile organic compounds (BVOCs) play an important role in atmospheric chemistry and give rise to secondary aerosols, which have effects on climate and human health. Increased temperature and CO2 concentrations will lead to increased plant photosynthesis and growth rates and higher emissions of BVOCs, which in turn result in a higher aerosol load from natural sources and partly offset the decreased cooling from anthropogenic aerosols. However, a considerable lack of knowledge exists concerning the formation of new particles from BVOCs and the organic chemical composition of natural aerosols. The objectives of the BIOSOL project include (1) study of the formation mechanisms of secondary organic aerosol (SOA) from isoprene and other BVOCs, assessing their role in particle formation and growth, examining the relative importance of homoge-neous photo-oxidation and multi-phase processes, and modelling of the processes involved; (2) identification of particulate-phase oxidation products of isoprene and other BVOCs, which can be used as indicator compounds for source apportionment, and development/deployment of novel analytical techniques thereby; and (3) determi-nation of the contribution from the BVOCs to the organic aerosol for various sites in Europe. For reaching objective (1), during Phase I of BIOSOL experiments and measurements were performed in the laboratory (i.e., in smog chambers and plant growth chambers), at three forested European sites, and during an oceanic cruise in the Atlantic and at a remote island in the southern Indian Ocean. The BVOCs, their volatile organic oxidation products, and critical inorganic trace gases were determined, and aerosol samples were collected and subjected to comprehensive analyses; in addition, in-situ measurements of particle number concentrations and size distributions, of ion spectra, and of the particulate mass (PM) and particulate organic carbon (OC) were made, and radiation and standard meteorological measurements were performed. In co-operation with Caltech, a study was performed to obtain insights into the formation mechanisms of SOA from isoprene, in particular the mechanisms that result in the formation of 2-methyltetrols, 2-methylglyceric acid (2-MG), and humic-like substances (HULIS). An extensive series of smog chamber experiments was performed under various conditions, in particular at low- and high-NOx levels, and with and without seed aerosol. It was found that the chemical nature of the smog-chamber SOA was significantly different between the two NOx regimes. For the high-NOx conditions, the SOA components were acidic and formed upon the further oxidation of methacrolein (MACR); no other first-generation gas-phase products
Project SD/AT/02A – Formation mechanisms, marker compounds and source apportionment for biogenic atmospheric aerosols “BIOSOL”
SSD - Science for a Sustainable Development – Atmosphere 9
appeared to contribute to the high-NOx SOA formation. In contrast, the low-NOx SOA was neutral in nature owing to the formation of polyols and organic peroxides and MACR did not contribute to it. Acid-catalysis seemed to play a larger role under low-NOx conditions. It was found that organic peroxides contributed significantly to the low-NOx SOA mass [~61% for nucleation experiments (these are experiments without seed aerosol) and ~25% and 30% for dry seeded and acid seeded experi-ments, respectively]. Oligomerisation was an important isoprene SOA formation pathway under both low- and high-NOx conditions. The nature of the oligomers was, however, distinctly different in each NOx regime. The high-NOx oligomers were characterised as oligo-esters, where their formation could be explained by particle-phase esterification reactions involving 2-MG as the key monomeric unit. These oligo-esters accounted for a substantial fraction (~22-34%) of the high-NOx SOA mass. Tracer compounds for isoprene oxidation in the ambient atmosphere, which had been detected for samples from the Amazon Basin, were detected in the low-NOx chamber experiments with isoprene. They included C5-alkene triols and hemiacetal dimers, which were detected for the first time in a controlled laboratory experiment, suggesting that the oxidative conditions used in these experiments are relevant to remote regions of the world. It was elucidated that the hemiacetal dimers result from the reaction of 2-methyltetrols and C5-alkene triols. The detection of C5-alkene triols and unstable products, tentatively characterised as 2-methyltetrol performate derivatives, provides evidence for the rearrangement of hydroxyperoxy radicals or the decomposition/rearrangement of hydroperoxides, formed in the initial oxidation (by OH/O2) of isoprene, into C5-alkene triols and epoxydiols. Upon further acid-catalysed hydrolysis, the epoxydiol intermediates that result from this latter rearrangement/decomposition reaction likely form 2-methyltetrols in the particle phase. Based on the results of this study mechanisms could be proposed for the formation of isoprene SOA under both high- and low-NOx conditions. BIOSOL partner P2 collaborated in the interpretation of results on organosulphates which were obtained by Caltech and US EPA in smog chamber experiments with isoprene and α-pinene. In this study, experiments were done under different NOx conditions in the absence and presence of sulphuric acid seed aerosol. Over the full range of NOx conditions, resultant sulphate esters in isoprene and α-pinene SOA were identified and structurally elucidated. Sulphate esters were found to account for a larger fraction of the SOA mass with increased acidity of seed aerosol, providing an explanation for the “acid-effect” in SOA formation. Many of the isoprene and α-pinene sulphate esters identified in the chamber experiments were also found in aerosol collected from the southeastern US and K-puszta, Hungary, demonstrating the atmospheric relevance of these particle-phase reaction products. The isoprene and α-pinene photo-oxidation products of which organosulphate derivatives were identi-
Project SD/AT/02A – Formation mechanisms, marker compounds and source apportionment for biogenic atmospheric aerosols “BIOSOL”
SSD - Science for a Sustainable Development – Atmosphere 10
fied include 2-methyltetrols, 2-methyltetrol mono-nitrate derivatives, 2-MG, and α-pinanediol hydroxynitrate. In co-operation with the University of Kuopio, plant growth chamber experiments were carried out. SOA was produced from BVOCs emitted by Scots pine and Norway spruce after triggering the plants with methyl jasmonate. Some of the detected SOA compounds were identified as cis-pinic acid and cis-pinonic acid, which are known ozonolysis products of α-pinene. Also analogues of Δ3-carene, which was found to be a major monoterpene emitted from the Scots pine foliage, were observed. Further-more, some compounds were tentatively assigned to 10-hydroxy-cis-pinonic acid and its Δ3-carene analogue. A comprehensive field campaign was held at the forested site of K-puszta, Hungary, from 24 May to 29 June 2006. From the start of the campaign until 11 June, it was unusually cold with daily maximum temperatures between 12 and 23ºC, but from 12 June onward higher temperatures were noted with daily maxima from 24 to 36ºC. The air mass origin was also quite different during the two periods. During the cold period (24 May – 11 June 2006), the air masses came from the northwest and often origi-nated over the North Sea and/or the Atlantic Ocean. In contrast, during the warm period (12-29 June 2006), the air masses had essentially a continental character and they were more stagnant. From the data for the VOCs and their oxidation products it was quite clear that much higher levels were observed during the warm period than during the cold one. This difference is to be expected, given that both formation and emission of the VOCs by plants increase with light and temperature. The regression of the high-time resolution data for isoprene as a function of air temperature indicated that there was a factor of 4 increase in isoprene concentration per 10°C increase in temperature. This is much higher than the value typically observed for biological reactions (which is about 2). An increase with temperature was also observed for the 24-hr (or day-time or night-time) averaged concentrations of fine PM and fine OC (whereby fine = PM2.5) from the in-situ instruments and for the data of a number of components in the filter samples. The in-situ measurements of particle number concentrations and size distributions and of ion spectra indicated that there were particle production episodes around every second day, which is quite frequent. During these episodes the total particle concentration in the 10 nm – 1 µm size range rose from the background concentration of some thousand particles to tens of thousands particles per cm3. The lowest concentration detected was around 800 cm-3 and the highest one was over 40,000 cm-3. At first sight, there seemed to be no relation between the particle production events and the in-situ VOC, fine PM or fine OC levels. Elemental carbon (EC) represented only a minor fraction of the total carbon (TC, with TC = OC + EC), indicating that the K-puszta site was not much influenced by
Project SD/AT/02A – Formation mechanisms, marker compounds and source apportionment for biogenic atmospheric aerosols “BIOSOL”
SSD - Science for a Sustainable Development – Atmosphere 11
automotive emissions or other fossil fuel combustion. Around 60% of the fine OC was water-soluble, suggesting that a large fraction of the OC consisted of oxygenated organics, including SOA. Organic matter (OM), estimated as 1.8 OC, was the major aerosol component in both PM2.5 and PM10 and in both the cold and warm periods and accounted for between 40 and 50% of the gravimetric PM. Sulphate was the second component in PM2.5, with percentage contributions of 22-24%. Because of the high sulphate and OM concentrations in PM2.5, significant concentrations of organo-sulphates are expected, which may be important contributors to HULIS. This will be examined by detailed organic analyses. From the results for OC, EC, and the VOCs that were obtained in the course of 2007 at the forested site “De Inslag”, Brasschaat, it appeared that the site is substantially impacted by anthropogenic activities. This is in contrast to the two other forested sites studied in this project. From the detailed organic analysis of the aerosol samples from Brasschaat and comparison with the aerosol composition of the other two sites, we hope to obtain insights to what extent the anthropogenic emissions affect the composition of the biogenic SOA. From 1 to 31 August 2007, a comprehensive field campaign was held at the SMEAR II forested site in Hyytiälä, Finland. Overall, the weather was nice during the campaign with little rain. The mean daily temperature rose from 13.4°C on 1 August to around 20°C in the period of 6-13 August and decreased then down to 6.1°C on 31 August, with a secondary maximum of 17°C on 22-24 August. The air masses came mostly from the West, except in the period from 9 to 14 August, when they first showed a recirculation pattern and on 13 and 14 August came from the South. In the period of 10-13 August there was extensive biomass burning in the southern part of European Russia, which considering the air mass transport could have affected our measure-ments at SMEAR II. From the time series of the in-situ data for the BVOCs, it appeared that the highest levels of the monoterpenes were noted in the nights of 7, 8, and 9 August, thus right after the start of the warm period. When looking at daily averages, there was clearly some relation between the concentrations of the BVOCs and temperature, with higher levels at higher temperatures. The time series for in-situ fine PM and fine OC was different from that for the BVOCs. The OC levels (and to a lesser extent also the PM levels) kept increasing from the beginning of the campaign until 13 August and decreased afterwards, with a second maximum on 22 to 24 August. It seemed thus that there was little relation between the local concentrations of the BVOCs and fine OC at the SMEAR II site. It is thought that the levels of fine OC are more related to the total BVOC emissions upwind of the site during the last 5 days or so of air mass transport than to the local BVOC concentrations at SMEAR II itself. The mass size distributions for OC, as measured in separate day-time and night-time
Project SD/AT/02A – Formation mechanisms, marker compounds and source apportionment for biogenic atmospheric aerosols “BIOSOL”
SSD - Science for a Sustainable Development – Atmosphere 12
cascade impactor samples collected at ambient relative humidity (RH), peaked in the accumulation size range, but there was also a clear coarse mode with peak at around 3-4 µm aerodynamic diameter (AD). Two distinct submicrometer modes, with peaks at about 0.3 and 0.7 µm AD, termed “condensation” and “droplet” modes, were clearly present for the day-time samples, whereas in the night-time samples the two modes seemed to have consistently merged into one broad accumulation mode. The formation of the “droplet” mode is explained by activation of condensation mode particles to form fog or cloud drops followed by aqueous-phase chemistry in fogs or clouds and subsequent fog or cloud evaporation. As to the broad accumulation mode during the night, this is likely due to hygroscopic growth of the OC. The RH increased to 80-100% during the night, whereas it generally decreased to well below 60% during day-time. Like during the 2006 summer campaign at K-puszta, there was little EC in the aerosol at SMEAR II and most of the fine OC was water-soluble (i.e., 63%). The OC and EC data from the oceanic cruise in 2006 in the Northern Hemisphere (NH) indicated that there was a large impact from continental aerosol and from fossil-fuel combustion aerosol. This was in contrast with the OC and EC data from Amster-dam Island in the southern Indian Ocean. At the latter site, EC was below the detection limit and OC was substantially lower than during the NH cruise. A common feature of both marine study areas was that only around 30% of the fine OC was water-soluble. At forested sites that are little affected by anthropogenic activities, such as K-puszta and SMEAR II, and where a large fraction of the fine OC is presumably SOA, about twice as much of the OC is water-soluble. The percentage of 30% for our marine samples is similar to that found at urban sites, where most of the OC consists of primary organic aerosol from fossil fuel combustion. It seems that the fine OC for our two oceanic study areas was also mostly primary. It has been suggested that SOA from isoprene may be a large source of cloud condensation nuclei in some oceanic regions. There was clearly no evidence for SOA from isoprene nor from monoterpenes in the samples from the NH cruise. Whether SOA from these BVOCs is important at Amsterdam Island will be revealed by the planned detailed organic analyses of the samples from this site. With regard to objective (2) of BIOSOL, studies were conducted to structurally characterise major particulate-phase oxidation products of α-pinene that occur at significant concentrations in ambient fine aerosol. Using mass spectrometric techniques and synthesis of reference compounds, the structures of two major α-pinene SOA marker compounds with molecular weights (MWs) of 148 and 204 were firmly established as 3-hydroxyglutaric acid and 3-methyl-1,2,3-butanetri-carboxylic acid (MBTCA), respectively. A formation mechanism for MBTCA was proposed, which involves participation of the OH radical, but it cannot be ruled out
Project SD/AT/02A – Formation mechanisms, marker compounds and source apportionment for biogenic atmospheric aerosols “BIOSOL”
SSD - Science for a Sustainable Development – Atmosphere 13
that ozone is also involved. With the proposed pathway it is possible to explain smog chamber observations, which suggested that the MW 204 compound is formed at the expense of cis-pinic acid. The observations can be explained with cis-pinonic acid following two routes; namely, a short one leading to cis-pinic acid, and a longer one, leading to MBTCA. The formation of MBTCA likely takes place in the particle phase, but further work is required to confirm this hypothesis and obtain insights into the reaction mechanism. As to objective (3), most of the work for it is planned for Phase II of the BIOSOL project. In Phase I, we determined the contribution from the BVOCs to the organic aerosol for PM2.5 samples, which had been collected in summer 2003 in a mixed deciduous forest in Jülich. The average contribution of isoprene SOA was estimated at 2.5% of the OC and that of α-/β-pinene SOA at at least 2.4%, while the average contribution from wood smoke to the OC was estimated at 3.3% and that from fungal spores at 3.6%. The summed contribution of isoprene and α-/β-pinene SOA, wood combustion, and fungal spores to the PM2.5 OC of the Jülich samples was thus at least 12%. It is clear that most of the OC remained unaccounted. Organosulphates, HULIS, and other primary biogenic aerosol besides fungal spores probably made up for a substantial fraction of the unexplained OC. Keywords: atmosphere, biogenic volatile organic compounds, secondary organic aerosols, indicator compounds, smog chambers, forested sites.
Project SD/AT/02A – Formation mechanisms, marker compounds and source apportionment for biogenic atmospheric aerosols “BIOSOL”
SSD - Science for a Sustainable Development – Atmosphere 14
1. CONTEXT AND OBJECTIVES It is well established that trace gases and atmospheric aerosols are important to the global radiation, cloud formation, and human and animal health and welfare. Trace gases and atmospheric aerosols are tightly connected with each other via physical, chemical, meteorological, and biological processes occurring in the atmosphere and at the atmosphere-biosphere interface. Atmospheric aerosol particles influence the Earth's radiation balance directly by scattering and absorbing solar radiation, and indirectly by acting as cloud condensation nuclei (CCN) [e.g., Charlson et al., 1992; Novakov and Penner, 1993; Andreae et al., 2005; IPCC, 2007]. Progress has been made in evaluating the radiative effects of various aerosol components such as sulphate, organics, black carbon, sea-salt, and crustal species [Penner et al., 2001]. Despite these efforts, substantial uncertainties still remain in quantifying the contribution from each source, particularly to assess the relative contributions of biogenic and natural emissions. Knowledge of the effects of natural emissions of aerosols on the Earth's radiation balance is necessary in order to accurately predict and understand the true effect of anthropogenic emissions and land-use changes. In its Third Assessment Report (TAR), the Intergovernmental Panel on Climate Change revised its older prediction of the globally averaged surface temperature increase over the period 1990 to 2100 from 1.0-3.5 to 1.4-5.8 K [IPCC, 2001] and the results from the new Fourth Assessment Report [IPCC, 2007] essentially corroborate those given in the TAR. The increase in the upper limit of the prediction is largely due to the role of aerosols in the climate of the Earth: it is believed that reduction of pollution will result in reduced direct and indirect (via clouds) scattering of sunlight back to the space. However, as can be seen from the large uncertainty of the estimated temperature increase, there is insufficient knowledge about the role of natural and anthropogenic aerosols in climate processes. As stated by Andreae et al. [2005], the strong present-day aerosol cooling may imply a hot future. The terrestrial vegetation is a key player in future climate change processes; increased temperature and CO2 concentrations will lead to increased plant photosynthesis and growth rates and higher emissions of volatile organic compounds (VOCs), which in turn will result in a higher aerosol load from natural sources and partly offset the decreased cooling from anthropogenic aerosols. Organic material significantly contributes to the total fine aerosol mass, i.e., 20-50% at continental mid-latitudes [Saxena and Hildemann, 1996; Putaud et al., 2004], and a substantial fraction of the organic material results from the oxidation of VOCs and is thus secondary organic aerosol (SOA). However, our knowledge about the organic aerosol and SOA is still rather poor. A large fraction remains uncharacterised [e.g.,
Project SD/AT/02A – Formation mechanisms, marker compounds and source apportionment for biogenic atmospheric aerosols “BIOSOL”
SSD - Science for a Sustainable Development – Atmosphere 15
Turpin et al., 2000; Kubátová et al., 2002; Iinuma et al., 2004]. It is recognised that especially the characterisation of multifunctional organic molecules is a major analytical challenge [Brasseur et al., 2003]. Furthermore, organic aerosol has so far been poorly represented in current aerosol global climate models [for a review, see Kanakidou et al., 2005]. The latter models focus mainly on sulphur chemistry, especially when con-sidering the formation of new particles in the troposphere. Nucleation events, that is the formation of “nucleation mode” (3-20 nm diameter) particles, are usually discussed in terms of sulphuric acid nucleation, either as binary (H2SO4/H2O) or ternary (H2SO4/NH3/H2O) system. However, aerosol formation studies at rural sites indicate a link between new particle formation and oxidation of VOCs. Measurements of nanometer size particles at the SMEAR II station in southern Finland provide an example of particle formation events over a boreal pine forest [Mäkelä et al., 1997; Boy et al., 2004]. Similar observations have been made in other forested regions [Kulmala et al., 2004]. The observation of nucleation events took place in remote forested areas, where the release of highly reactive VOCs from trees followed by a rapid oxidation to less volatile products has to be considered a potential source of nucleating vapours. Unfortunately, the amount of condensable material needed to form nanometer particles is extremely small and the chemical identification of the nucleating species is therefore rather difficult. According to Kulmala et al. [2004], organic vapours could, in principle, participate in nucleation, but nucleation mechanisms that involve organics have not yet been identified. It is very likely, however, that organics contribute to growth of nucleated particles into the size range that they efficiently scatter solar radiation and can act as CCN [O’Dowd et al., 2002]. The effort to understand particle formation and growth from biogenic VOC oxidation is driven not only by the field observations mentioned above, but also by certain characteristics of this group of hydrocarbons. First, it is well established that terrestrial vegetation releases into the atmosphere a tremendous amount of organic compounds (e.g., isoprene, monoterpenes, sesquiterpenes, oxygen-containing compounds) [Guenther et al., 1995]. The large quantities of biogenic VOCs (BVOCs) emitted globally exceed the release of anthropogenic VOCs and have stimulated research into the atmospheric chemistry of these compounds. Secondly, the aerosol formation potential of BVOCs with more than six carbon atoms, as measured in smog chamber experi-ments, is generally high and, for specific biogenics, the major fraction of products can convert to the particle phase [Hoffmann et al., 1997; Griffin et al., 1999]. Based on information regarding fractional aerosol yields and on available emission inventories, the global production of SOA from oxidation of BVOCs is estimated at between 8 and 40 Tg per year [IPCC, 2001]. Since aerosol formation from BVOC oxidation represents a natural source contributing to the continental background aerosol, knowledge of its contribution to the particle burden of the troposphere is crucial in order to determine the
Project SD/AT/02A – Formation mechanisms, marker compounds and source apportionment for biogenic atmospheric aerosols “BIOSOL”
SSD - Science for a Sustainable Development – Atmosphere 16
relative importance of anthropogenic versus natural particle production. The gas phase chemistry in a forest ecosystem, which is driven by high concentrations of reactive precursor compounds and high UV radiation and leads to aerosol formation, is still poorly understood although some recent progress has been made [Holzinger et al., 2005]. Natural VOCs are also tightly linked with the oxidative capacity of the atmos-phere, which involves mainly hydroxyl radicals and ozone. Ozone and particulate concentrations are affected by NOx and both biogenic and anthropogenic VOC emissions. With the levels of NOx and anthropogenic VOCs decreasing, it may be expected in the future that the contribution of biogenic VOCs to ozone and the particle burden in the troposphere will become relatively more important. It should be pointed out, however, that quite a number of non-volatile oxidation products considered as key molecules in aerosol formation processes are of minor relevance for the tropospheric ozone production. There is a general consensus in the atmospheric chemistry community that monoter-penes, aromatic hydrocarbons, and possibly sesquiterpenes are significant contributors to SOA, while the contribution from isoprene, which is emitted in larger amounts than monoterpenes (estimated at 500 Tg vs 125 Tg [Guenther et al., 1995]), has generally been thought to be negligible based on the smog chamber experiments by Pandis et al. [1991]. However, during the past five years, evidence from both field and laboratory experiments has been obtained for isoprene contributing to SOA formation. Polyols (2-methyltetrols), a hydroxycarboxylic acid (2-methylglyceric acid), and C5-alkene triols, which have retained the C5-isoprene skeleton or a part of it, were characterised and detected in significant amounts in natural background PM2.5 (particulate matter with diameter smaller than 2.5 µm) aerosol from the Amazon basin, Brazil, from K-puszta, Hungary, and from Hyytiälä, Finland [Claeys et al., 2004a,b; Wang et al., 2005; Kourtchev et al., 2005]. In addition, a 2003 summer field campaign at K-puszta revealed that the 2-methyltetrols and 2-methylglyceric acid exhibit a diel pattern with the highest concentrations during day-time, consistent with their formation through fast photo-oxidation of locally emitted isoprene [Ion et al., 2005]. Furthermore, a field experiment carried out at a Japanese boreal forest site showed significant concentrations of carbonyl-containing oxidation products of isoprene in the PM2.5 aerosol with maxima in the evening [Matsunaga et al., 2003]. Laboratory studies supporting the contribution of isoprene oxidation to the organic fraction of ambient PM2.5 are the investigations showing that acidic seed aerosol catalysed the SOA-forming ozonolysis reaction of isoprene [Jang et al., 2002], that exposure to isoprene of quartz fibre filters impregnated with sulphuric acid leads to the formation of oligomeric humic-like substances (HULIS) [Limbeck et al., 2003], and that irradiation of isoprene/NOx/air mixtures in the presence of SO2 results in the formation of 2-methyltetrols, 2-methylglyceric acid, as well as other unidentified organic compounds, possibly oligomeric HULIS [Edney et al., 2005].
Project SD/AT/02A – Formation mechanisms, marker compounds and source apportionment for biogenic atmospheric aerosols “BIOSOL”
SSD - Science for a Sustainable Development – Atmosphere 17
All together, the impact of BVOCs on air quality and the formation of secondary products affecting our climate on a regional and global scale are far from being understood. A considerable lack of knowledge exists concerning the formation of new particles from BVOCs and the organic chemical composition of natural aerosols. As stated in the review by Kanakidou et al. [2005] on organic aerosol and global climate modelling, SOA formation is a complex and not yet sufficiently understood process. The objectives of the current project include (1) study of the formation mechanisms of SOA from isoprene (and other BVOCs), assessing their role in particle formation and growth, examining the relative importance of homogeneous photo-oxidation and multi-phase processes, evaluating the importance of HULIS formation, and modelling of the processes involved; (2) identification of particulate-phase oxidation products of isoprene (and other BVOCs), which can be used as indicator compounds for source apportion-ment, and development and deployment of novel analytical techniques and procedures thereby; and (3) determination of the contribution from the BVOCs to the organic aero-sol for various sites in Europe.
Project SD/AT/02A – Formation mechanisms, marker compounds and source apportionment for biogenic atmospheric aerosols “BIOSOL”
SSD - Science for a Sustainable Development – Atmosphere 18
2. METHODS AND APPROACHES 2.1. Study of the formation mechanisms of SOA from isoprene (and other
BVOCs) by laboratory experiments The methods and approaches for reaching objective (1) of this project were quite varied. Experiments and measurements were performed in the laboratory (i.e., in smog chambers and plant growth chambers), at three forested European sites, and during an oceanic cruise and at a remote island in the southern Indian Ocean. In this section 2.1, we present the methods and approaches for the laboratory experiments; the methods and approaches for other activities are presented in the subsequent sections. The smog chamber experiments were performed in co-operation with the groups of Prof. J.H. Seinfeld (California Institute of Technology (Caltech), U.S.A.), of Dr. T.E. Kleindienst (National Exposure Research Laboratory of the US Environmental Protection Agency (US EPA), U.S.A), of Prof. U. Baltensperger (Paul Scherrer Institute (PSI), Villigen, Switzerland), and of Prof. H. Herrmann (Leibniz Institute for Tropos-pheric Research (IfT), Leipzig, Germany). The actual smog chamber experiments and all in-situ (on-line) measurements were made by these teams, but samples were collected for chemical analysis by BIOSOL partner 2 (P2). For details on the chambers and the in-situ (on-line) measurements, reference is made to Surratt et al. [2006], Edney et al. [2005], Paulsen et al. [2005], Iinuma et al. [2007], and to references cited in these papers. P2 performed analyses on aerosol (and other) samples collected from these chambers by gas chromatography-flame ionisation detection (GC-FID), gas chromatograhy / mass spectrometry (GC/MS) and liquid chromatography / mass spectrometry (LC/MS) techniques. For GC-FID a 800 Top gas chromatograph (Carlo Erba, Milan, Italy) was used, while for GC/MS a TRACE GC2000 gas chromatograph connected with a Polaris Q ion trap mass spectrometer (Thermo Fisher, San Jose, CA, USA) was employed. GC/MS analysis was performed in the electron ionisation (EI) or chemical ionisation (CI) modes. For LC/MS analysis, a Surveyor Plus system (Thermo Fisher) was coupled to an LXQ linear ion trap mass spectrometer (Thermo Fisher), and electrospray ionisation in the negative ion mode was used [(–)ESI]. Prior to analysis, the samples were extracted with a mixture of methanol and dichloro-methane (1:1, v/v) or with methanol. In addition, prior to GC-FID or GC/MS, the sample extracts were derivatised (e.g., trimethylsilylated) to convert the polar compounds into volatile derivatives. The capillary columns used for GC-FID and GC/MS contained a 95% dimethyl, 5% phenyl polysiloxane stationary phase. The reversed phase C18-column employed for LC/MS was a dC18 Atlantis column (Waters); this column contains difunctionally bonded C18 alkyl residues in order to allow the analysis of very polar analytes. Additional details on the GC-FID, GC/MS, and
Project SD/AT/02A – Formation mechanisms, marker compounds and source apportionment for biogenic atmospheric aerosols “BIOSOL”
SSD - Science for a Sustainable Development – Atmosphere 19
LC/MS methods used by P2 can be found in Surratt et al. [2006, 2007], Szmigielski et al. [2007a], Maenhaut and Claeys [2007], and Gómez-González et al. [2008]. For the plant growth chamber experiments, it was planned to make use of the growth chambers of BIOSOL partner 3 (P3). Unfortunately, these chambers were badly damaged by a storm in January 2007, so that there is a serious delay in their use. The experiments in them will only be started in Phase II of BIOSOL. On the other hand, P2 started a co-operation with the group of Dr. J. Joutsensaari (University of Kuopio, Finland), whereby use is made of the Kuopio growth chambers. The actual experiments were made by this team, but samples were collected for LC/MS analysis by P2. Young Scots pine and Norway spruce plants (2-year old) were housed in a plant chamber and BVOC emissions were triggered by methyl jasmonate. Subsequently, the emitted BVOCs were transferred to a 2 m3 Teflon reaction chamber with a pressurised air stream and oxidised with ozone (200 ppb). Simultaneously, particle formation and growth was monitored by measuring aerosol particle number size distributions using a differential mobility particle sizer (DMPS). After a reaction time of ca. 60 min the SOA formed was collected on a Teflon or quartz fibre filter. The filters were extracted with methanol:dichloromethane (1:1, v/v) under ultrasonic agitation, and the extract was analysed with the LC/(-)ESI-MS technique. Chromatographic separation of the SOA components was achieved with a dC18 Atlantis column (Waters). 2.2. Field experiment at the forested site of K-puszta, Hungary From 20 May to 1 July 2006, a field campaign was conducted at the K-puszta back-ground station in Hungary. This station is a mixed deciduous/coniferous forest site [Ion et al., 2005] and is located at 46º58'N, 19º35'E, 136 m above sea level. It is about 15 km to the NW of the town of Kecskemèt and about 80 km SE of Budapest. The station is one of the 20 high-quality ground-based stations within the European Union (EU) funded project “European Supersites for Atmospheric Aerosol Research” (EUSAAR) and is also involved in the Global Atmospheric Watch (GAW) network and in the European Monitoring and Evaluation Programme (EMEP). The actual field work at the site took place from 24 May to 29 June 2006. Besides the 4 BIOSOL partners also two Hungarian teams participated in the field work, i.e., the team of Prof. A. Gelencsér from the University of Pannonia (Veszprém) and that of Prof. I. Salma from Eötvös University (Budapest). Isoprene (C5H8), other BVOCs including monoterpenes (C10H16) and the hemi-terpene 2-methyl-3-buten-2-ol (MBO), and their volatile organic oxidation products were determined by proton-transfer reaction - mass spectrometry (PTR-MS) [Lindinger et al., 1998]. Critical inorganic trace gases (i.e., O3 and NOx) were
Project SD/AT/02A – Formation mechanisms, marker compounds and source apportionment for biogenic atmospheric aerosols “BIOSOL”
SSD - Science for a Sustainable Development – Atmosphere 20
determined by instrumentation, which was available at the site. Particle number concentrations and size distributions (in the size range from 10 nm to 1 µm) were measured with a DMPS and ion spectra (for diameter from 0.5 to 40 nm) were determined with an Air Ion Spectrometer (AIS); Both the DMPS and AIS were home-built instruments of BIOSOL partner 4 (P4). The particulate mass (PM), aerosol black carbon (BC), and particulate-phase organic carbon (OC) and elemental carbon (EC) were determined in situ and in real time with a Rupprecht and Patashnick tapered element oscillating microbalance (TEOM, model 1400A), a Magee Scientific aethalo-meter (tape-feeder model AE 14U), and an OCEC Field instrument from Sunset Laboratory, respectively. All three instruments were equipped with a PM2.5 inlet. The TEOM was a standard TEOM, with the filter heated at 50ºC. The OCEC Field instrument was equipped with a parallel plate denuder to remove VOCs from the incoming air stream. The OCEC Field instrument of Sunset Laboratory is based on the same principles as the lab instrument from the same company and makes use of a thermal-optical transmission (TOT) technique to measure total carbon (TC) and to discriminate between thermal EC and thermal OC [Birch and Cary, 1996]. In addition, the Field instrument provides data for optical EC (OptEC), which are obtained from the transmitted laser light (660 nm) intensity through the sampling filter. From the difference between TC and OptEC, optical OC (OptOC) is then deduced. The in-situ measurements with the TEOM and aethalometer were done with a time resolution of 5 min and those with the OCEC Field instrument with a time resolution of one hour. Aerosol samples (normally separate day and night samples, with start at 7:00 and 19:00, respectively) for comprehensive organic and inorganic analyses were collected with a variety of filter samplers, including low-volume PM2.5 and PM10 collectors [Maenhaut et al., 2008] and a Hi-Vol dichotomous sampler (HVDS) [Solomon et al., 1983], which provides two size fractions (fine: <2.5 µm aerodynamic diameter (AD) and coarse (>2.5 µm AD)), and with a 10-stage microorifice uniform deposit impactor (MOUDI) [Marple et al., 1991] with 3-stage nano-MOUDI extension. In order to restrict and/or to assess the artifacts in the filter sampling for particulate OC, a cylindrical diffusion denuder for VOCs was deployed in front of the filter [Mikuška et al., 2003; Maenhaut et al., 2004] and/or a tandem (double) filter system with front and back quartz fibre filters [Maenhaut and Claeys, 2007] was used. All together, 3 low-volume PM2.5 samplers with quartz fibre filters were deployed, all of them with tandem filters, one with normally day/night time resolution, the other two with normally 24-hour time resolution, with one of these (P25DWW) operated with a diffusion denuder for VOCs upstream of the front filter and the other (P25UWW) without such denuder.
Project SD/AT/02A – Formation mechanisms, marker compounds and source apportionment for biogenic atmospheric aerosols “BIOSOL”
SSD - Science for a Sustainable Development – Atmosphere 21
Standard meteorological measurements (of, e.g., temperature, relative humidity, and wind speed and direction) were also performed. Depending upon the sampler type and/or collection surface, the aerosol samples were (or will be) analysed for the PM, OC and EC, water-soluble OC (WSOC), various individual water-soluble and organic-solvent extractable species, and a suite of elements. The analytical methods include gravimetry (for the PM), a TOT tech-nique (for OC and EC), ion chromatography (IC) for the inorganic components, and GC/MS, LC/MS, and IC for the organic species [Maenhaut and Claeys, 2007, and references therein]. For measuring WSOC, use was made of a Shimadzu TOC-V CPH analyser and the elements were determined by particle-induced X-ray emission spectrometry (PIXE) [Maenhaut and Claeys, 2007]. The analyses for the PM, OC, EC, WSOC, inorganic ionic components, and elements have all been completed, but the detailed analyses for the organic species still have to be started. Prior to the 2006 campaign, a 2003 campaign was conducted at the K-puszta site by the BIOSOL partners C and P2 [Maenhaut and Claeys, 2007]. This earlier campaign was an aerosol measurement and collection campaign only. A HVDS was deployed in the 2003 campaign too and these samples were subjected to additional analyses for detailed organic compounds as part of the current project. 2.3. Field experiment at the state forest “De Inslag”, Brasschaat, Belgium The state forest “De inslag” is located at 51º18'33”N, 4º35'14”E, 15 m above sea level, in Brasschaat, Belgium. It is a 78-year old mixed pine-oak forest and is situated at about 12 km NE of the center of the city of Antwerp and at about 9 km to the east of the Antwerp harbour area. The field work at this site was done in co-operation with the Flemish Research Institute for Nature and Forest (Ir. J. Neirynck); it started on 25 April 2007 and ended on 12 November 2007. Three of the 4 BIOSOL partners (C, P2, and P3) participated in the field work. In-situ measurements for OC, EC, and TC (all in PM2.5) were done with a Sunset Laboratory OCEC Field instrument from 25 April to 13 July 2007 (1st period) and from 19 September to 12 November 2007 (2nd period); in between 13 July and 19 September 2007, the instrument was shipped off to Finland and back for use in the field campaign at the SMEAR II site (see section 2.4). The time resolution of the operation with the OCEC Field instrument was 1 hour during the 1st part of the measurements and 2 hours during the 2nd part. From 5 June until 13 July 2007, a HVDS sampler was deployed for separate day and night aerosol collections in two size fractions (fine: <2.5 µm AD; coarse: >2.5 µm AD). The inlet for the OCEC Field instrument and the HVDS sampler were located on a tower at about 9 m above ground level. For measuring biogenic and other VOCs, a PTR-MS instrument was deployed at
Project SD/AT/02A – Formation mechanisms, marker compounds and source apportionment for biogenic atmospheric aerosols “BIOSOL”
SSD - Science for a Sustainable Development – Atmosphere 22
the site from 25 April until the end of October 2007. However, because of instrument problems, good accurate data are only available for the period from the end of July until mid-September 2007. Two intakes were installed on the tower for the PTR-MS measurements, one at 24 m above ground level, the other at 40 m above ground. Because of the problems with the PTR-MS instrument, there are unfortunately no overlapping aerosol and PTR-MS measurements for the site. The samples of the HVDS were analysed for OC and EC by TOT and also for WSOC. They will also be analysed for detailed organic compounds by LC/MS. 2.4. Field experiment at the forested site of SMEAR II, Hyytiälä, Finland From 29 July to 2 September 2007, a field campaign was conducted at the Station for Measuring Forest-Atmosphere Relations (SMEAR II) in Hyytiälä, Finland. This station is a boreal coniferous forest station [Boy et al., 2004] and is located at 61°51' N, 24°17' E, 181 m above sea level. The largest city near the station is Tampere, ca. 60 km S-SW of the measurement site. Similarly as K-puszta, SMEAR II is a EUSAAR station. The actual field work at the site took place from 1 to 31 August 2007. Three of the 4 BIOSOL partners (C, P3, and P4) participated in the field work. The field work for the campaign consisted of in-situ measurements on gases and aerosols and of collection of various types of aerosol samples. Isoprene, other BVOCs, and their volatile organic oxidation products were determined by PTR-MS; critical inorganic trace gases (e.g., O3, NOx, SO2) were determined by instrumentation available at the site; particle number concentrations and size distributions were measured with DMPS systems; ion spectra were determined with an AIS; the PM, BC, and particulate-phase OC (and EC) were determined in situ and in real time with a TEOM, an aethalometer, and an OCEC Field instrument, respectively. The real-time measurements were thus similar as for the 2006 campaign at K-puszta; however, the ones for trace gases and various auxiliary parameters were much more extensive than at K-puszta. The time resolution for the OCEC Field instrument was 1, 2, or 4 hours, depending upon the OC levels, whereas the time resolution of the other in-situ measurements was 10 min or better. As far as the aerosol collections were concerned, the same samplers were deployed as for the 2006 campaign at K-puszta (see section 2.2) and in addition also a small deposit area low pressure cascade impactor (SDI) [Maenhaut et al., 1996]. The latter device was used with quartz fibre filter impaction substrates for OC and EC analyses by TOT and thus for obtaining the detailed mass size distrution of OC and EC. The collections with the various samplers were mostly done with day/night time resolution, with the day-
Project SD/AT/02A – Formation mechanisms, marker compounds and source apportionment for biogenic atmospheric aerosols “BIOSOL”
SSD - Science for a Sustainable Development – Atmosphere 23
time samplings from 7:30 to 19:40 local time (UTC+3) and the night-time samplings from 20:20 to 6:40 local time. Depending upon the sampler type and/or collection surface, the aerosol samples were (or will be) analysed for the PM, OC and EC, WSOC, and various individual water-soluble and organic-solvent extractable species, using the same analytical techniques as for the samples from the 2006 K-pustza campaign (see section 2.2). The analyses for the PM, OC, EC, WSOC, and inorganic ionic components have all been completed, but the detailed analyses for the organic species still have to be started. Prior to the 2007 campaign, a less comprehensive campaign was conducted in summer 2005 (i.e., from 28 July to 11 August) at SMEAR II by the BIOSOL partners P2, P4, and C. The work of that campaign also forms part of the current project. Details on the measurements, aerosol collections, and chemical analyses of that 2005 campaign are given in Kourtchev et al. [2008a,b]. 2.5. Field work during an oceanic cruise and at a remote island in the southern
Indian Ocean These experiments are at the same time conducted within the framework of the EU-funded project “Organics over the Ocean Modifying Particles in both Hemispheres” (OOMPH) and are carried out in co-operation with research teams of France (Dr. J. Sciare, Laboratoire des Sciences du Climat et de l’Environnement (LSCE), Gif-sur-Yvette) and of Greece (Prof. N. Mihalopoulos, University of Crete (UoC), Heraklion). At the outset, it was planned to have aerosol samples collected during two oceanic cruises, one in the Northern and one in the Southern Hemisphere. The cruise in the Northern Hemisphere took place with the F.S. Meteor in the Mauritanian upwelling region of the tropical North Atlantic from 12 July to 6 August 2006. At the request of Prof. Mihalopoulos, Hi-Vol samples on quartz fibre filter substrates were collected during this cruise by the team of Dr. A. Baker (University of East Anglia, U.K.). The sampler was a 3-stage Hi-Vol cascade impactor [Baker, 2004], providing three size fractions (>2 µm, 1.3-2 µm, and <1.3 µm), and a total of 21 daily samples were collected. The coarse (>2 µm) and medium (1.3-2 µm) size fractions were collected on impaction substrates, and the fine (<1.3 µm) fraction on a back-up filter. The three size fractions of all samples from this cruise were analysed for OC and EC, the fine and coarse size fractions also for WSOC, and the fine fractions also by GC/MS and LC/MS.
Project SD/AT/02A – Formation mechanisms, marker compounds and source apportionment for biogenic atmospheric aerosols “BIOSOL”
SSD - Science for a Sustainable Development – Atmosphere 24
As far as the cruise in the Southern Hemisphere is concerned: It was decided not to collect Hi-Vol samples on this cruise, but instead at Amsterdam Island (37.52ºS, 77.32ºE), which is located in the southern Indian Ocean about half-way between the southern edge of Africa and the southern edge of Australia. UGent provided a HVDS to LSCE for deployment by LSCE personnel at the site. The sampler was located on the north side of the island at about 30 m above sea level and the horizontal distance of the HVDS from the sea was around 45 m. A total of 18 HVDS collections (of 5 days) were done in two size fractions (fine: <2.5 µm, and coarse: >2.5 µm) on double Gelman Pall quartz fibre filters, i.e., from 3 December 2006 until 4 March 2007. The samples are subjected to the same types of analyses as these from the Atlantic cruise, but in addition also to analyses for water-soluble inorganic and organic species by IC. At this stage, the analyses for OC, EC, and WSOC are completed, but the other analyses are still going on. 2.6. Data analyses and interpretation for the laboratory and field experiments For both the laboratory and field measurements, the relationships between the concentrations of the BVOCs, their volatile oxidation products, critical inorganic trace gases, other atmospheric and radiative parameters, particle (and ion) numbers and sizes, and the aerosol composition as a function of size (in particular the concentration of particulate-phase BVOC oxidation products) are thoroughly examined. This involves approaches as used by Boy et al. [2004] and Edney et al. [2005]. A major aim of this work is to gain improved insights into the relative importance of homogeneous photo-oxidation and multi-phase processes and in the importance of HULIS formation. 2.7. Modelling of the formation and growth of the fine particles and of the fine
biogenic atmospheric aerosol The data sets obtained are used for modelling the formation and growth of the fine particles and of the fine biogenic atmospheric aerosol. For this purpose, extensive use is made of the modelling capabilities of the Finnish partner (i.e., partner 4), and especially of aerosol dynamics and atmospheric chemistry models, such as the University of Helsinki Multicomponent Aerosol (UHMA) model [Pirjola 1999; Lehtinen and Kulmala, 2003; Laakso et al., 2004; Korhonen et al., 2004]. In these models, aerosol formation and growth, including aerosol dynamics to evaluate sink terms for condensable molecules and gas phase chemistry to include source terms for these molecules, will be used. Furthermore, process models are coupled with dispersion models. In the chemistry part of the models, the chemistry of O3, NOx, VOC, and other relevant species are related to aerosol formation. The effects of meteorological dynamics on aerosol processes are studied by applying the aerosol dynamic models in
Project SD/AT/02A – Formation mechanisms, marker compounds and source apportionment for biogenic atmospheric aerosols “BIOSOL”
SSD - Science for a Sustainable Development – Atmosphere 25
a Lagrangian approach including wave motions and atmospheric mixing. The concen-trations of non-measured critical species, such as the OH and HO2 radicals, are hereby estimated, as done by Boy et al. [2005]. 2.8. Identification of particulate-phase oxidation products of isoprene (and other
BVOCs), which can be used as indicator compounds for source apportion-ment
An important objective of the project is to develop an approach for assessing the contribution of the BVOCs to the atmospheric aerosol. For conservative particulate-phase species and components (i.e., which do not undergo chemical transformation within the atmosphere), one can determine source emission factors and so-called source profiles (that is the composition of the particles emitted by each source) and apply a chemical mass balance (CMB) receptor model. For organics and also certain inorganic species, such as sulphate (which is formed within the atmosphere from SO2), the situation is more complex. However, numerous examples indicate that CMB modelling is also feasible in such cases. A classical example of organic aerosol source apportionment by CMB is the work of Schauer et al. [1996]. As an alternative to CMB, at least when multi-sample, multi-species data sets are available, one can use multivariate receptor modelling, such as absolute principal component analysis (APCA) or the more recent positive matrix factorization (PMF) [Paatero and Tapper, 1994]. These approaches require suitable indicator compounds (but no source profiles) for the contributing aerosol sources. For the identification of particulate-phase oxidation products of isoprene (and other BVOCs) useful for source apportionment, archived and newly collected aerosol samples from both laboratory experiments and field campaigns were examined. Unknown compounds, which occur at important levels in gas or liquid chromatograms of the sample extracts, were structurally characterised. For the structural elucidation of unknown compounds, use was made of GC/MS in combination with derivatisation and ion trap MSn techniques as well as of LC/MS employing electrospray ionisation and the ion trap MSn capability. The latter technique is also used to elucidate the complex chemical structures of the HULIS, which represent an important fraction of natural biogenic aerosol [Zappoli et al., 1999]. On the basis of the results, it will be deduced which oxidation products (besides the 2-methyltetrols) are sufficiently stable to serve as marker compounds for the determination of the SOA contribution, which is derived from isoprene. Although the emphasis in this work is placed on oxidation products of isoprene, other unknown compounds, which occur at important levels and which, for example, might be formed by photo-oxidation of other BVOCs, such as the mono- and sesquiterpenes, are characterised as well. Besides advanced multidimensional MS
Project SD/AT/02A – Formation mechanisms, marker compounds and source apportionment for biogenic atmospheric aerosols “BIOSOL”
SSD - Science for a Sustainable Development – Atmosphere 26
approaches, also nuclear magnetic resonance (NMR) is used for the structural eluci-dation [Claeys et al., 2007; Szmigielski et al., 2007a]. On the basis of the results obtained from the field campaign samples and those from the various laboratory measurements, it will be attempted to construct appropriate source profiles (that is with percentages of the appropriate indicator compounds in the OC generated from the BVOCs), which can be useful for source apportionment, including CMB receptor modelling. 2.9. Determination of the contribution from the BVOCs to the organic aerosol for
various sites in Europe It is the aim to use the marker compounds, which were or will be identified as described in section 2.8, for quantitative calculation of the contribution of the SOA from isoprene (and other BVOCs) to the OC and PM. This source apportionment work will be done for the K-puszta and Hyytiälä background stations and the anthropogenically influenced state forest “De Inslag” in Brasschaat, but in addition also for field campaigns in Ghent (particularly for summer) and in Austria (in co-operation with Prof. H. Puxbaum, Technical University of Vienna). In addition to the contribution of SOA from BVOCs, also the contribution from biomass burning and, if possible, also that of the bioaerosol (or biological aerosol) will be determined. To estimate the contribution from biomass burning, levoglucosan can be used as indicator compound [Zdráhal et al., 2002]. For a winter field campaign in 1998 in Ghent, it was roughly estimated that 35% of the OC was due to biomass burning, but recent emission data for wood combustion [Fine et al., 2004] suggest that the uncertainty on this amounts to a factor of 2 and that the real contribution is likely lower. In rural aerosol samples, which were collected in a 2003 summer campaign in K-puszta and in the summer of 2004 in Hyytiälä, substantial levels of levoglucosan were observed, and this suggests that the contribution from biomass burning at these sites and in summer is certainly not negligible. As far as the bioaerosol is concerned: over land surfaces a quarter of the total airborne particulate matter may be made up of biological material in the form of pollen, fungal spores, bacteria, viruses, or fragments of plant and animal matter [Jaenicke, 2005], but quantitative determination of the contribution is a difficult task, among others because of the lack of appropriate marker compounds. In most aerosol samples, which so far were examined by the teams of the coordinator and partner 2, the sugar alcohols arabitol and mannitol are present [Pashynska et al., 2002; Claeys et al., 2004a], which are attributed to fungal spores [Lewis and Smith, 1967]. In co-operation with the Technical University of Vienna, it is examined to what extent those sugar alcohols can be used to determine the contribution from fungal spores to the OC.
Project SD/AT/02A – Formation mechanisms, marker compounds and source apportionment for biogenic atmospheric aerosols “BIOSOL”
SSD - Science for a Sustainable Development – Atmosphere 27
3. STUDY OF THE FORMATION OF BIOGENIC SOA THROUGH SMOG CHAMBER EXPERIMENTS
3.1. Formation mechanisms of SOA from isoprene In co-operation with Caltech, a study was performed to obtain insights into the forma-tion mechanisms of SOA from isoprene, in particular the mechanisms that result in the formation of 2-methyltetrols, 2-methylglyceric acid (2-MG), and HULIS. An extensive series of smog chamber experiments was performed under various conditions, in particular at low- and high-NOx levels, and with and without seed aerosol. The results from the chamber experiments were compared with results for fine aerosol that had been collected in the Amazon forest. It was found that the chemical nature of the smog-chamber SOA was significantly different between the two NOx regimes. For the high-NOx conditions, the SOA components were acidic and formed upon the further oxidation of methacrolein (MACR), where currently no other first-generation gas-phase products appear to contribute to SOA formation. The low-NOx SOA was found to be neutral in nature owing to the formation of polyols and organic peroxides. MACR was found not to contribute to SOA formation under low-NOx conditions, which is likely due to hydroperoxide formation. Based on SOA growths, acid-catalysis seemed to play a larger role under low-NOx conditions. By using a conventional iodometric-spectro-scopic method, it was found that organic peroxides (likely dominated by hydro-peroxides) contributed significantly to the low-NOx SOA mass [~61% for nucleation experiments (these are experiments without seed aerosol) and ~25% and 30% for dry seeded and acid seeded experiments, respectively]. Oligomerisation was observed to be an important isoprene SOA formation pathway for both low- and high-NOx conditions. The nature of the oligomers, however, was distinctly different in each NOx regime. The high-NOx oligomers have an obvious monomeric unit, where observable 102 Da differences were detected with the on-line and off-line mass spectrometry techniques. These high-NOx oligomers were charac-terised as oligo-esters, where their formation could be explained by particle-phase esterification reactions involving 2-methylglyceric acid as the key monomeric unit. These oligo-esters accounted for a substantial fraction (~22-34%) of the SOA mass formed from isoprene oxidation under high-NOx conditions. Tracer compounds for isoprene oxidation in the ambient atmosphere, which had been detected for samples from the Amazon Basin, were detected in the low-NOx chamber experiments with isoprene. They included C5-alkene triols and hemiacetal
Project SD/AT/02A – Formation mechanisms, marker compounds and source apportionment for biogenic atmospheric aerosols “BIOSOL”
SSD - Science for a Sustainable Development – Atmosphere 28
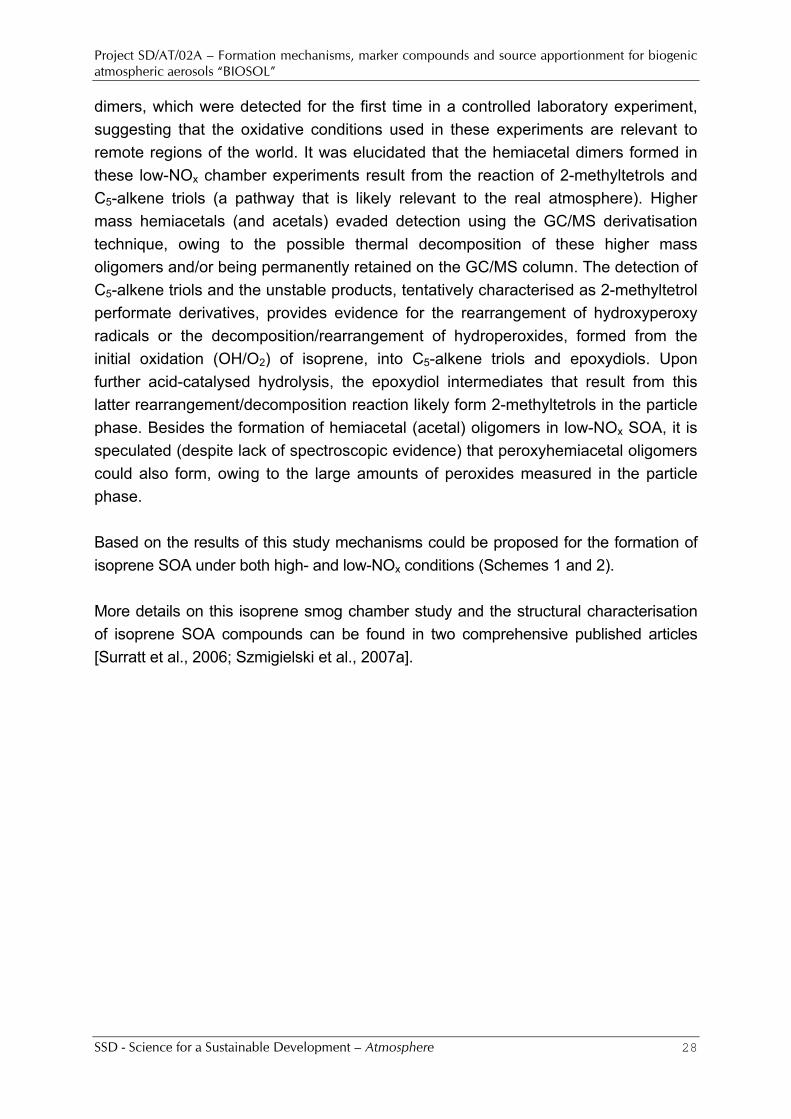
dimers, which were detected for the first time in a controlled laboratory experiment, suggesting that the oxidative conditions used in these experiments are relevant to remote regions of the world. It was elucidated that the hemiacetal dimers formed in these low-NOx chamber experiments result from the reaction of 2-methyltetrols and C5-alkene triols (a pathway that is likely relevant to the real atmosphere). Higher mass hemiacetals (and acetals) evaded detection using the GC/MS derivatisation technique, owing to the possible thermal decomposition of these higher mass oligomers and/or being permanently retained on the GC/MS column. The detection of C5-alkene triols and the unstable products, tentatively characterised as 2-methyltetrol performate derivatives, provides evidence for the rearrangement of hydroxyperoxy radicals or the decomposition/rearrangement of hydroperoxides, formed from the initial oxidation (OH/O2) of isoprene, into C5-alkene triols and epoxydiols. Upon further acid-catalysed hydrolysis, the epoxydiol intermediates that result from this latter rearrangement/decomposition reaction likely form 2-methyltetrols in the particle phase. Besides the formation of hemiacetal (acetal) oligomers in low-NOx SOA, it is speculated (despite lack of spectroscopic evidence) that peroxyhemiacetal oligomers could also form, owing to the large amounts of peroxides measured in the particle phase. Based on the results of this study mechanisms could be proposed for the formation of isoprene SOA under both high- and low-NOx conditions (Schemes 1 and 2). More details on this isoprene smog chamber study and the structural characterisation of isoprene SOA compounds can be found in two comprehensive published articles [Surratt et al., 2006; Szmigielski et al., 2007a].
Project SD/AT/02A – Formation mechanisms, marker compounds and source apportionment for biogenic atmospheric aerosols “BIOSOL”
SSD - Science for a Sustainable Development – Atmosphere 29
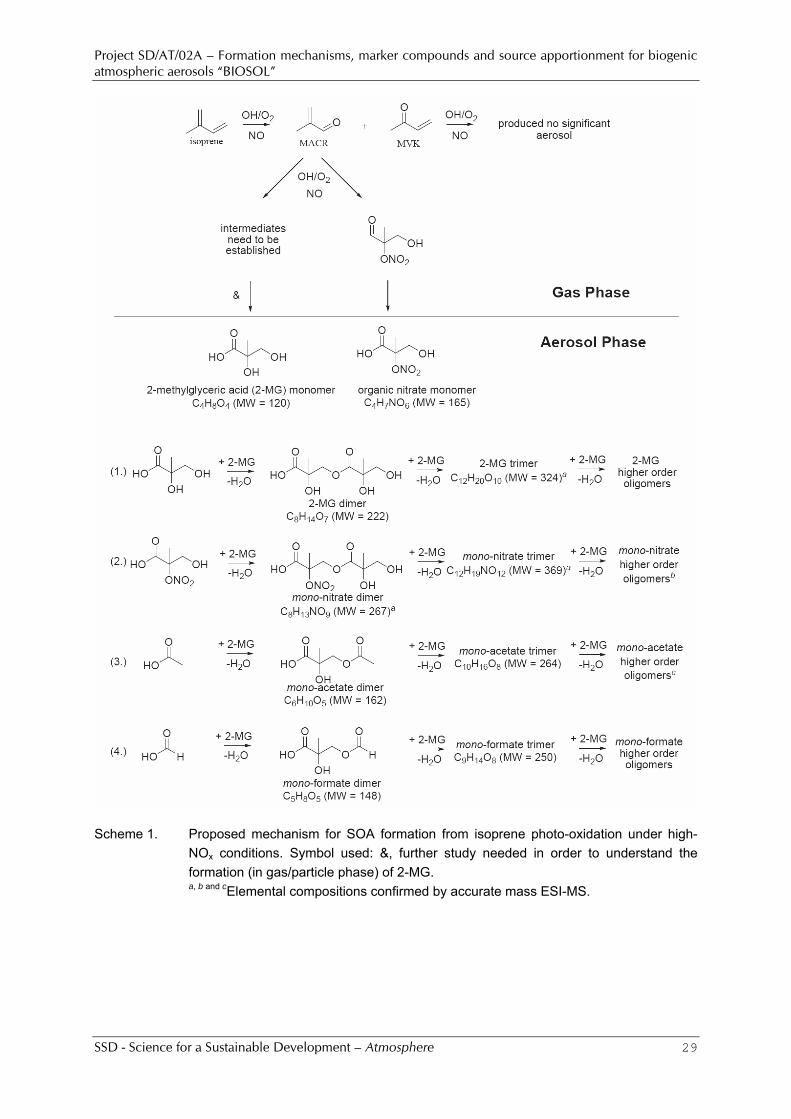
Scheme 1. Proposed mechanism for SOA formation from isoprene photo-oxidation under high-
NOx conditions. Symbol used: &, further study needed in order to understand the formation (in gas/particle phase) of 2-MG.
a, b and cElemental compositions confirmed by accurate mass ESI-MS.
Project SD/AT/02A – Formation mechanisms, marker compounds and source apportionment for biogenic atmospheric aerosols “BIOSOL”
SSD - Science for a Sustainable Development – Atmosphere 30
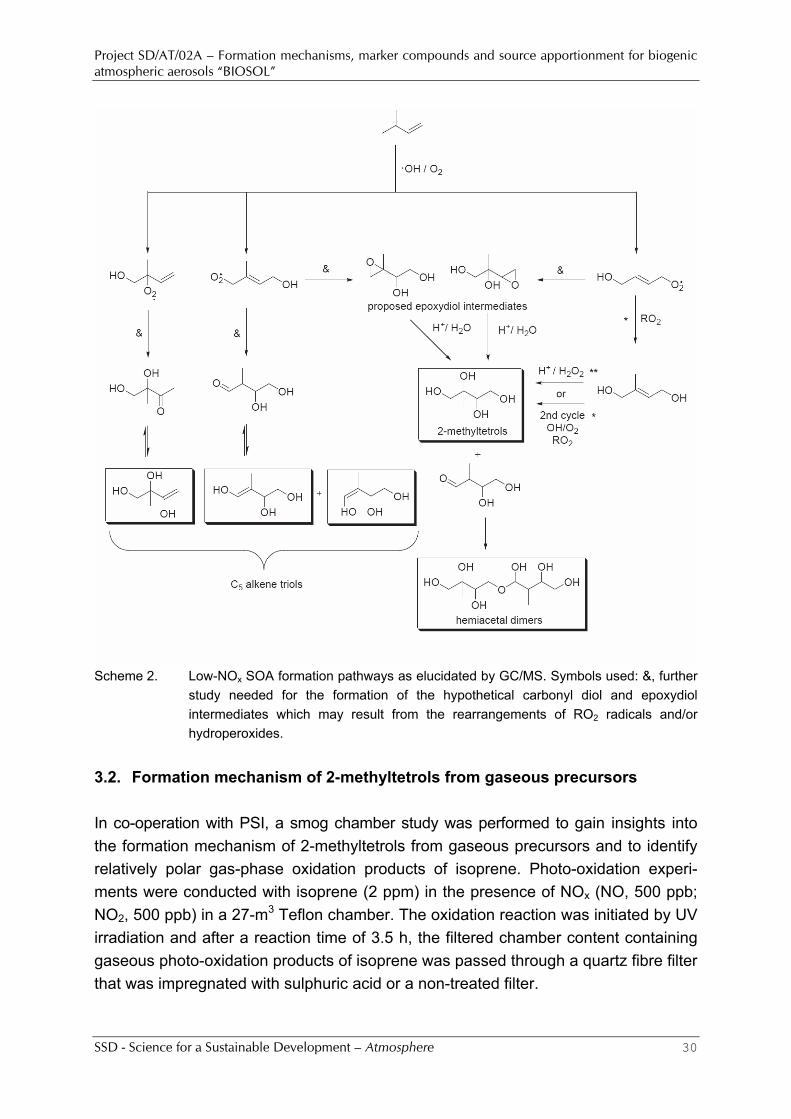
Scheme 2. Low-NOx SOA formation pathways as elucidated by GC/MS. Symbols used: &, further
study needed for the formation of the hypothetical carbonyl diol and epoxydiol intermediates which may result from the rearrangements of RO2 radicals and/or hydroperoxides.
3.2. Formation mechanism of 2-methyltetrols from gaseous precursors In co-operation with PSI, a smog chamber study was performed to gain insights into the formation mechanism of 2-methyltetrols from gaseous precursors and to identify relatively polar gas-phase oxidation products of isoprene. Photo-oxidation experi-ments were conducted with isoprene (2 ppm) in the presence of NOx (NO, 500 ppb; NO2, 500 ppb) in a 27-m3 Teflon chamber. The oxidation reaction was initiated by UV irradiation and after a reaction time of 3.5 h, the filtered chamber content containing gaseous photo-oxidation products of isoprene was passed through a quartz fibre filter that was impregnated with sulphuric acid or a non-treated filter.
Project SD/AT/02A – Formation mechanisms, marker compounds and source apportionment for biogenic atmospheric aerosols “BIOSOL”
SSD - Science for a Sustainable Development – Atmosphere 31
It was found that the 2-methyltetrol concentration is significantly increased in the sulphuric acid-treated filter compared to the non-treated filter. These results support that formation of 2-methyltetrols in SOA from the photo-oxidation of isoprene involves acid-catalysed hydrolysis of gaseous epoxydiols, as proposed in previous work. In addition, a relatively polar photo-oxidation product of isoprene was collected on the sulphuric acid-treated filter. This compound was tentatively identified as a novel C5-hydroxydicarbonyl compound (molecular weight (MW): 116; 4-hydroxy-1,3-diketo-2-methylpentane) based on its chromatographic behaviour and detailed interpretation of electron and chemical ionisation mass spectral data. 3.3. Structure of marker compounds for the photo-oxidation of α-pinene In co-operation with US EPA, a smog chamber study was carried out to elucidate the structures of marker compounds for the photo-oxidation of α-pinene, which were also dectected in fine aerosol that had been collected during the 2003 summer campaign in K-puszta, Hungary. The results of this study are presented in Chapter 10. 3.4. Studies on organosulphates P2 collaborated in the interpretation of results on organosulphates which were obtained by Caltech and US EPA in smog chamber experiments with isoprene and α-pinene. In this study, experiments were done under different NOx conditions in the absence and presence of sulphuric acid seed aerosol. Over the full range of NOx conditions, resultant sulphate esters in isoprene and α-pinene SOA were identified and structurally elucidated. Sulphate esters were found to account for a larger fraction of the SOA mass with increased acidity of seed aerosol, providing an explanation for the “acid-effect” in SOA formation. Many of the isoprene and α-pinene sulphate esters identified in the chamber experiments were also found in aerosol collected from the southeastern US and K-puszta, Hungary, demonstrating the atmospheric relevance of these particle-phase reaction products. The isoprene and α-pinene photo-oxidation products of which organosulphate derivatives were identified include 2-methyltetrols (1), 2-methyltetrol mono-nitrate derivatives (2), 2-methylglyceric acid (3), and α-pinanediol hydroxynitrate (4).
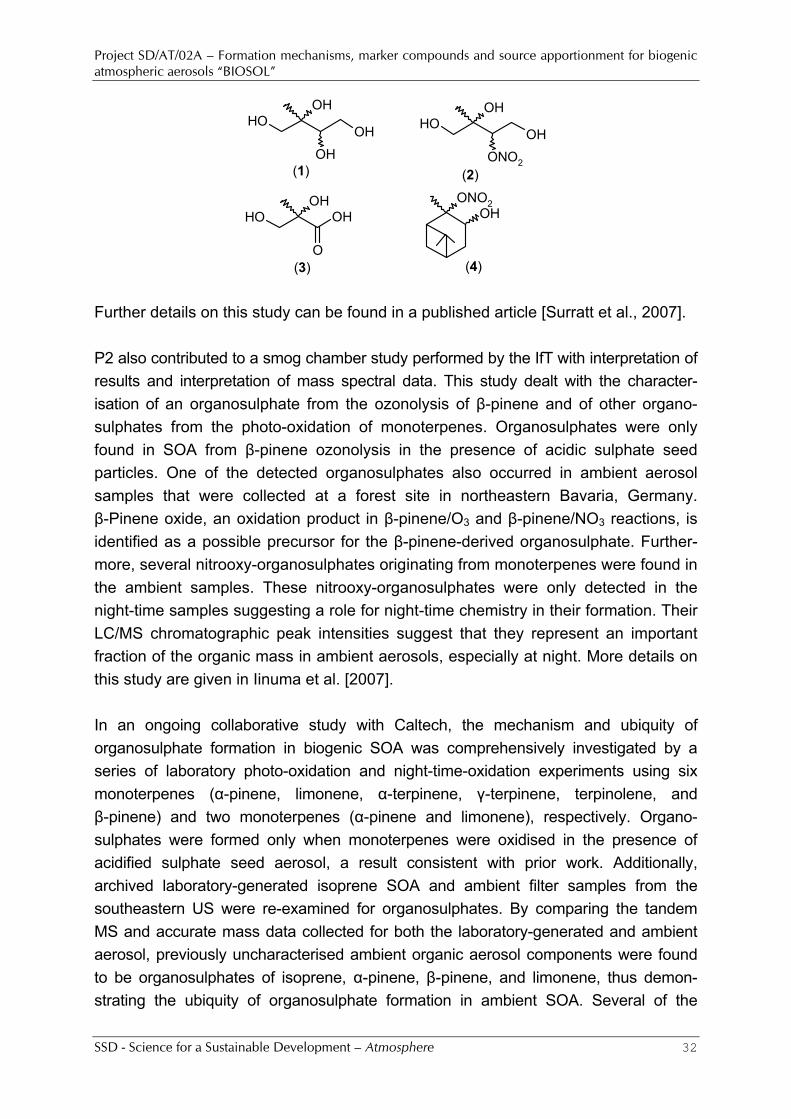
Project SD/AT/02A – Formation mechanisms, marker compounds and source apportionment for biogenic atmospheric aerosols “BIOSOL”
SSD - Science for a Sustainable Development – Atmosphere 32
OH OHOH
O
OHOH
OH
ONO2
OHOH
OH
OH
ONO2OH
(1)
(3)
(2)
(4) Further details on this study can be found in a published article [Surratt et al., 2007]. P2 also contributed to a smog chamber study performed by the IfT with interpretation of results and interpretation of mass spectral data. This study dealt with the character-isation of an organosulphate from the ozonolysis of β-pinene and of other organo-sulphates from the photo-oxidation of monoterpenes. Organosulphates were only found in SOA from β-pinene ozonolysis in the presence of acidic sulphate seed particles. One of the detected organosulphates also occurred in ambient aerosol samples that were collected at a forest site in northeastern Bavaria, Germany. β-Pinene oxide, an oxidation product in β-pinene/O3 and β-pinene/NO3 reactions, is identified as a possible precursor for the β-pinene-derived organosulphate. Further-more, several nitrooxy-organosulphates originating from monoterpenes were found in the ambient samples. These nitrooxy-organosulphates were only detected in the night-time samples suggesting a role for night-time chemistry in their formation. Their LC/MS chromatographic peak intensities suggest that they represent an important fraction of the organic mass in ambient aerosols, especially at night. More details on this study are given in Iinuma et al. [2007]. In an ongoing collaborative study with Caltech, the mechanism and ubiquity of organosulphate formation in biogenic SOA was comprehensively investigated by a series of laboratory photo-oxidation and night-time-oxidation experiments using six monoterpenes (α-pinene, limonene, α-terpinene, γ-terpinene, terpinolene, and β-pinene) and two monoterpenes (α-pinene and limonene), respectively. Organo-sulphates were formed only when monoterpenes were oxidised in the presence of acidified sulphate seed aerosol, a result consistent with prior work. Additionally, archived laboratory-generated isoprene SOA and ambient filter samples from the southeastern US were re-examined for organosulphates. By comparing the tandem MS and accurate mass data collected for both the laboratory-generated and ambient aerosol, previously uncharacterised ambient organic aerosol components were found to be organosulphates of isoprene, α-pinene, β-pinene, and limonene, thus demon-strating the ubiquity of organosulphate formation in ambient SOA. Several of the
Project SD/AT/02A – Formation mechanisms, marker compounds and source apportionment for biogenic atmospheric aerosols “BIOSOL”
SSD - Science for a Sustainable Development – Atmosphere 33
organosulphates of isoprene and of the monoterpenes characterised in this study provide ambient tracer compounds for the occurrence of biogenic SOA formation under acidic conditions. Furthermore, the night-time-oxidation experiments conducted under highly acidic conditions reveal one viable mechanism for the formation of previously identified nitrooxy-organosulphates found in ambient night-time aerosol samples. The detailed interpretation of the mass spectral data is in progress.
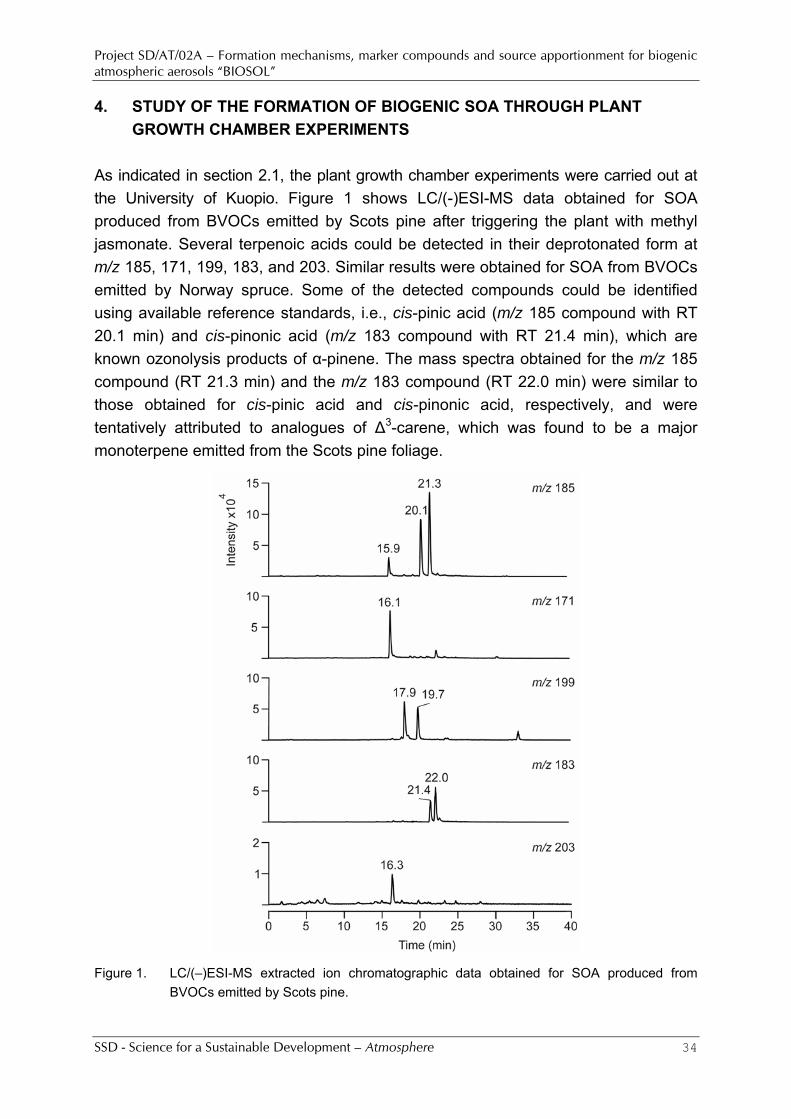
Project SD/AT/02A – Formation mechanisms, marker compounds and source apportionment for biogenic atmospheric aerosols “BIOSOL”
SSD - Science for a Sustainable Development – Atmosphere 34
4. STUDY OF THE FORMATION OF BIOGENIC SOA THROUGH PLANT GROWTH CHAMBER EXPERIMENTS
As indicated in section 2.1, the plant growth chamber experiments were carried out at the University of Kuopio. Figure 1 shows LC/(-)ESI-MS data obtained for SOA produced from BVOCs emitted by Scots pine after triggering the plant with methyl jasmonate. Several terpenoic acids could be detected in their deprotonated form at m/z 185, 171, 199, 183, and 203. Similar results were obtained for SOA from BVOCs emitted by Norway spruce. Some of the detected compounds could be identified using available reference standards, i.e., cis-pinic acid (m/z 185 compound with RT 20.1 min) and cis-pinonic acid (m/z 183 compound with RT 21.4 min), which are known ozonolysis products of α-pinene. The mass spectra obtained for the m/z 185 compound (RT 21.3 min) and the m/z 183 compound (RT 22.0 min) were similar to those obtained for cis-pinic acid and cis-pinonic acid, respectively, and were tentatively attributed to analogues of Δ3-carene, which was found to be a major monoterpene emitted from the Scots pine foliage.
Figure 1. LC/(–)ESI-MS extracted ion chromatographic data obtained for SOA produced from
BVOCs emitted by Scots pine.
Project SD/AT/02A – Formation mechanisms, marker compounds and source apportionment for biogenic atmospheric aerosols “BIOSOL”
SSD - Science for a Sustainable Development – Atmosphere 35
The m/z 199 compounds were tentatively assigned to 10-hydroxy-cis-pinonic acid (RT 17.9 min) and its Δ3-carene analogue (RT 19.7 min). The m/z 203 compound (RT 16.3 min) showed features similar to 3-methyl-1,2,3-butanetricarboxylic acid, which has recently been reported as a stable end-oxidation product of α-pinene [Szmigielski et al., 2007b]. The m/z 185 (RT 15.9 min) and m/z 171 (RT 16.1 min) compounds were found to correspond to unknown compounds. Research is in progress to further characterise the unknown compounds.
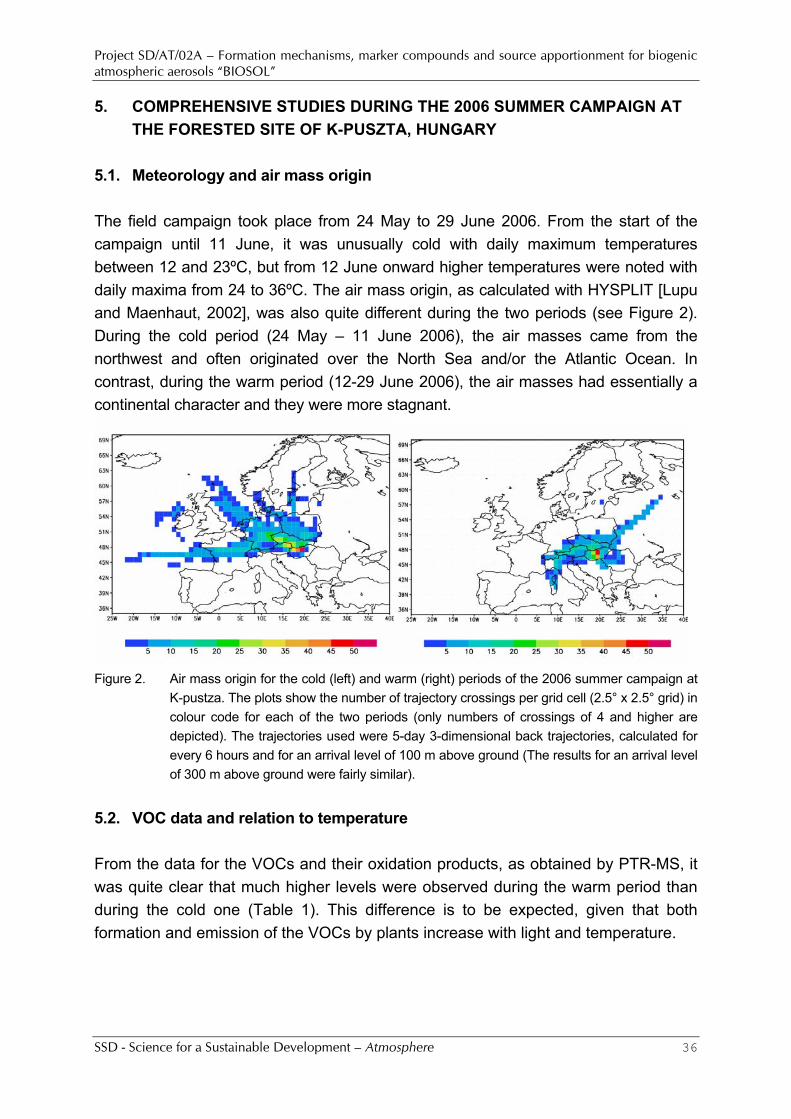
Project SD/AT/02A – Formation mechanisms, marker compounds and source apportionment for biogenic atmospheric aerosols “BIOSOL”
SSD - Science for a Sustainable Development – Atmosphere 36
5. COMPREHENSIVE STUDIES DURING THE 2006 SUMMER CAMPAIGN AT THE FORESTED SITE OF K-PUSZTA, HUNGARY
5.1. Meteorology and air mass origin The field campaign took place from 24 May to 29 June 2006. From the start of the campaign until 11 June, it was unusually cold with daily maximum temperatures between 12 and 23ºC, but from 12 June onward higher temperatures were noted with daily maxima from 24 to 36ºC. The air mass origin, as calculated with HYSPLIT [Lupu and Maenhaut, 2002], was also quite different during the two periods (see Figure 2). During the cold period (24 May – 11 June 2006), the air masses came from the northwest and often originated over the North Sea and/or the Atlantic Ocean. In contrast, during the warm period (12-29 June 2006), the air masses had essentially a continental character and they were more stagnant.
Figure 2. Air mass origin for the cold (left) and warm (right) periods of the 2006 summer campaign at
K-pustza. The plots show the number of trajectory crossings per grid cell (2.5° x 2.5° grid) in colour code for each of the two periods (only numbers of crossings of 4 and higher are depicted). The trajectories used were 5-day 3-dimensional back trajectories, calculated for every 6 hours and for an arrival level of 100 m above ground (The results for an arrival level of 300 m above ground were fairly similar).
5.2. VOC data and relation to temperature From the data for the VOCs and their oxidation products, as obtained by PTR-MS, it was quite clear that much higher levels were observed during the warm period than during the cold one (Table 1). This difference is to be expected, given that both formation and emission of the VOCs by plants increase with light and temperature.
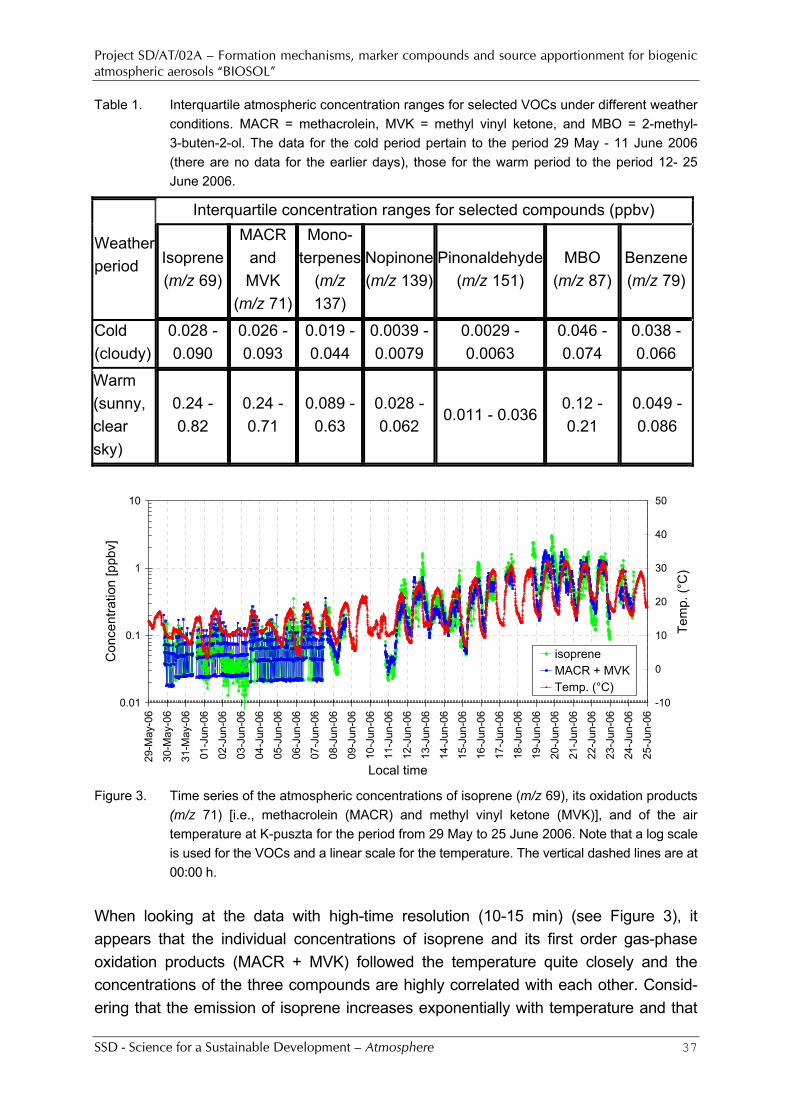
Project SD/AT/02A – Formation mechanisms, marker compounds and source apportionment for biogenic atmospheric aerosols “BIOSOL”
SSD - Science for a Sustainable Development – Atmosphere 37
Table 1. Interquartile atmospheric concentration ranges for selected VOCs under different weather conditions. MACR = methacrolein, MVK = methyl vinyl ketone, and MBO = 2-methyl-3-buten-2-ol. The data for the cold period pertain to the period 29 May - 11 June 2006 (there are no data for the earlier days), those for the warm period to the period 12- 25 June 2006.
Interquartile concentration ranges for selected compounds (ppbv)
Weather period Isoprene
(m/z 69)
MACR and MVK
(m/z 71)
Mono-terpenes
(m/z 137)
Nopinone(m/z 139)
Pinonaldehyde (m/z 151)
MBO (m/z 87)
Benzene(m/z 79)
Cold (cloudy)
0.028 - 0.090
0.026 - 0.093
0.019 - 0.044
0.0039 - 0.0079
0.0029 - 0.0063
0.046 -0.074
0.038 - 0.066
Warm (sunny, clear sky)
0.24 - 0.82
0.24 - 0.71
0.089 - 0.63
0.028 - 0.062
0.011 - 0.0360.12 -0.21
0.049 - 0.086
0.01
0.1
1
10
29-M
ay-0
6
30-M
ay-0
6
31-M
ay-0
6
01-J
un-0
6
02-J
un-0
6
03-J
un-0
6
04-J
un-0
6
05-J
un-0
6
06-J
un-0
6
07-J
un-0
6
08-J
un-0
6
09-J
un-0
6
10-J
un-0
6
11-J
un-0
6
12-J
un-0
6
13-J
un-0
6
14-J
un-0
6
15-J
un-0
6
16-J
un-0
6
17-J
un-0
6
18-J
un-0
6
19-J
un-0
6
20-J
un-0
6
21-J
un-0
6
22-J
un-0
6
23-J
un-0
6
24-J
un-0
6
25-J
un-0
6
Local time
Con
cent
ratio
n [p
pbv]
-10
0
10
20
30
40
50
Tem
p. (°
C)
isopreneMACR + MVKTemp. (°C)
Figure 3. Time series of the atmospheric concentrations of isoprene (m/z 69), its oxidation products
(m/z 71) [i.e., methacrolein (MACR) and methyl vinyl ketone (MVK)], and of the air temperature at K-puszta for the period from 29 May to 25 June 2006. Note that a log scale is used for the VOCs and a linear scale for the temperature. The vertical dashed lines are at 00:00 h.
When looking at the data with high-time resolution (10-15 min) (see Figure 3), it appears that the individual concentrations of isoprene and its first order gas-phase oxidation products (MACR + MVK) followed the temperature quite closely and the concentrations of the three compounds are highly correlated with each other. Consid-ering that the emission of isoprene increases exponentially with temperature and that
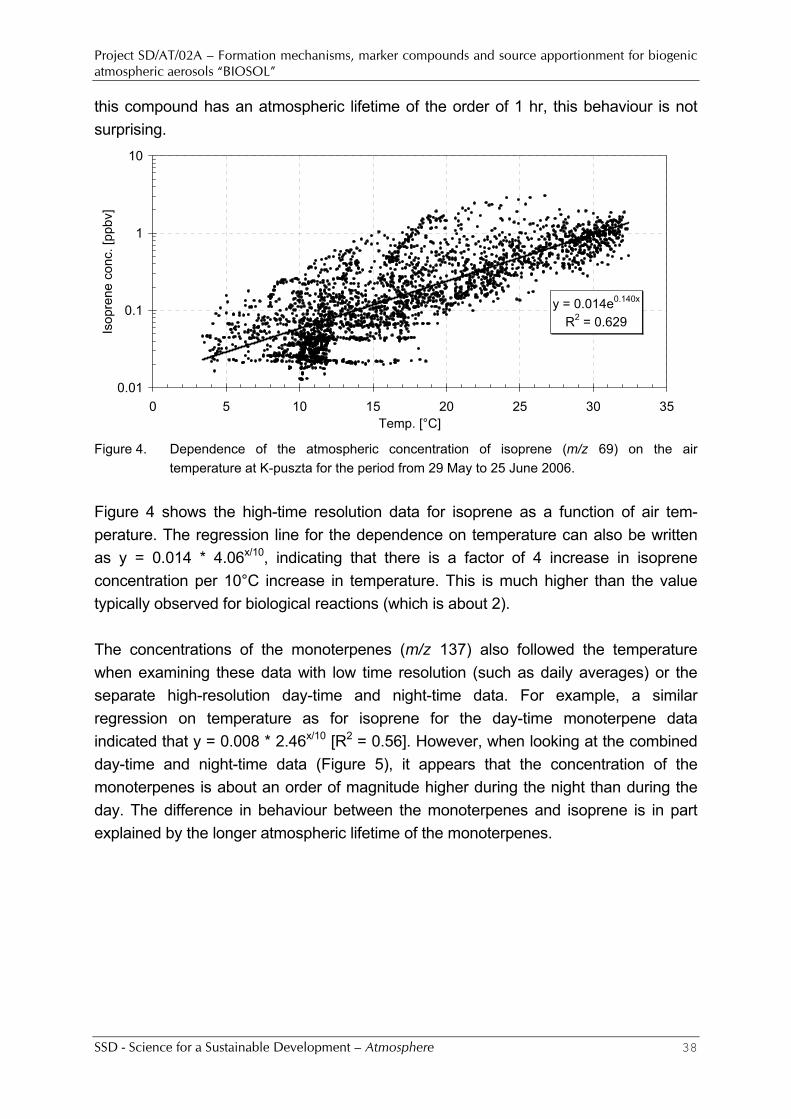
Project SD/AT/02A – Formation mechanisms, marker compounds and source apportionment for biogenic atmospheric aerosols “BIOSOL”
SSD - Science for a Sustainable Development – Atmosphere 38
this compound has an atmospheric lifetime of the order of 1 hr, this behaviour is not surprising.
y = 0.014e0.140x
R2 = 0.629
0.01
0.1
1
10
0 5 10 15 20 25 30 35Temp. [°C]
Isop
rene
con
c. [p
pbv]
Figure 4. Dependence of the atmospheric concentration of isoprene (m/z 69) on the air
temperature at K-puszta for the period from 29 May to 25 June 2006. Figure 4 shows the high-time resolution data for isoprene as a function of air tem-perature. The regression line for the dependence on temperature can also be written as y = 0.014 * 4.06x/10, indicating that there is a factor of 4 increase in isoprene concentration per 10°C increase in temperature. This is much higher than the value typically observed for biological reactions (which is about 2). The concentrations of the monoterpenes (m/z 137) also followed the temperature when examining these data with low time resolution (such as daily averages) or the separate high-resolution day-time and night-time data. For example, a similar regression on temperature as for isoprene for the day-time monoterpene data indicated that y = 0.008 * 2.46x/10 [R2 = 0.56]. However, when looking at the combined day-time and night-time data (Figure 5), it appears that the concentration of the monoterpenes is about an order of magnitude higher during the night than during the day. The difference in behaviour between the monoterpenes and isoprene is in part explained by the longer atmospheric lifetime of the monoterpenes.
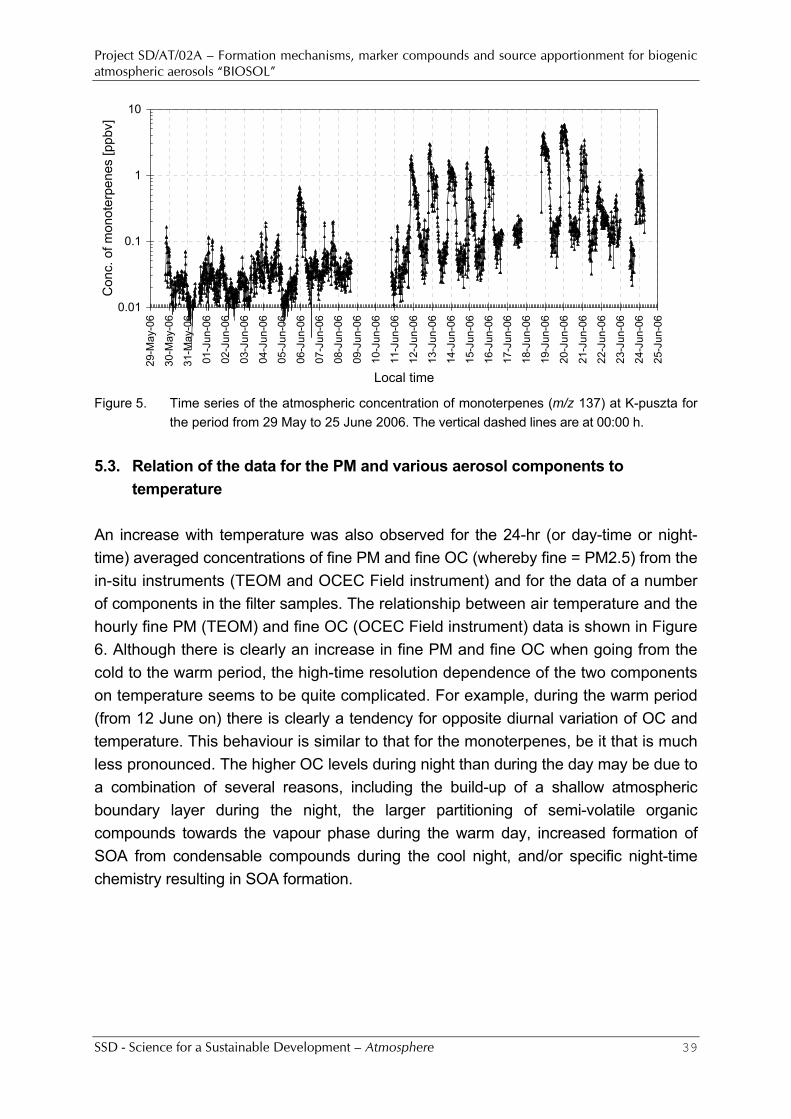
Project SD/AT/02A – Formation mechanisms, marker compounds and source apportionment for biogenic atmospheric aerosols “BIOSOL”
SSD - Science for a Sustainable Development – Atmosphere 39
0.01
0.1
1
10
29-M
ay-0
6
30-M
ay-0
6
31-M
ay-0
6
01-J
un-0
6
02-J
un-0
6
03-J
un-0
6
04-J
un-0
6
05-J
un-0
6
06-J
un-0
6
07-J
un-0
6
08-J
un-0
6
09-J
un-0
6
10-J
un-0
6
11-J
un-0
6
12-J
un-0
6
13-J
un-0
6
14-J
un-0
6
15-J
un-0
6
16-J
un-0
6
17-J
un-0
6
18-J
un-0
6
19-J
un-0
6
20-J
un-0
6
21-J
un-0
6
22-J
un-0
6
23-J
un-0
6
24-J
un-0
6
25-J
un-0
6
Local time
Con
c. o
f mon
oter
pene
s [p
pbv]
Figure 5. Time series of the atmospheric concentration of monoterpenes (m/z 137) at K-puszta for
the period from 29 May to 25 June 2006. The vertical dashed lines are at 00:00 h. 5.3. Relation of the data for the PM and various aerosol components to
temperature An increase with temperature was also observed for the 24-hr (or day-time or night-time) averaged concentrations of fine PM and fine OC (whereby fine = PM2.5) from the in-situ instruments (TEOM and OCEC Field instrument) and for the data of a number of components in the filter samples. The relationship between air temperature and the hourly fine PM (TEOM) and fine OC (OCEC Field instrument) data is shown in Figure 6. Although there is clearly an increase in fine PM and fine OC when going from the cold to the warm period, the high-time resolution dependence of the two components on temperature seems to be quite complicated. For example, during the warm period (from 12 June on) there is clearly a tendency for opposite diurnal variation of OC and temperature. This behaviour is similar to that for the monoterpenes, be it that is much less pronounced. The higher OC levels during night than during the day may be due to a combination of several reasons, including the build-up of a shallow atmospheric boundary layer during the night, the larger partitioning of semi-volatile organic compounds towards the vapour phase during the warm day, increased formation of SOA from condensable compounds during the cool night, and/or specific night-time chemistry resulting in SOA formation.
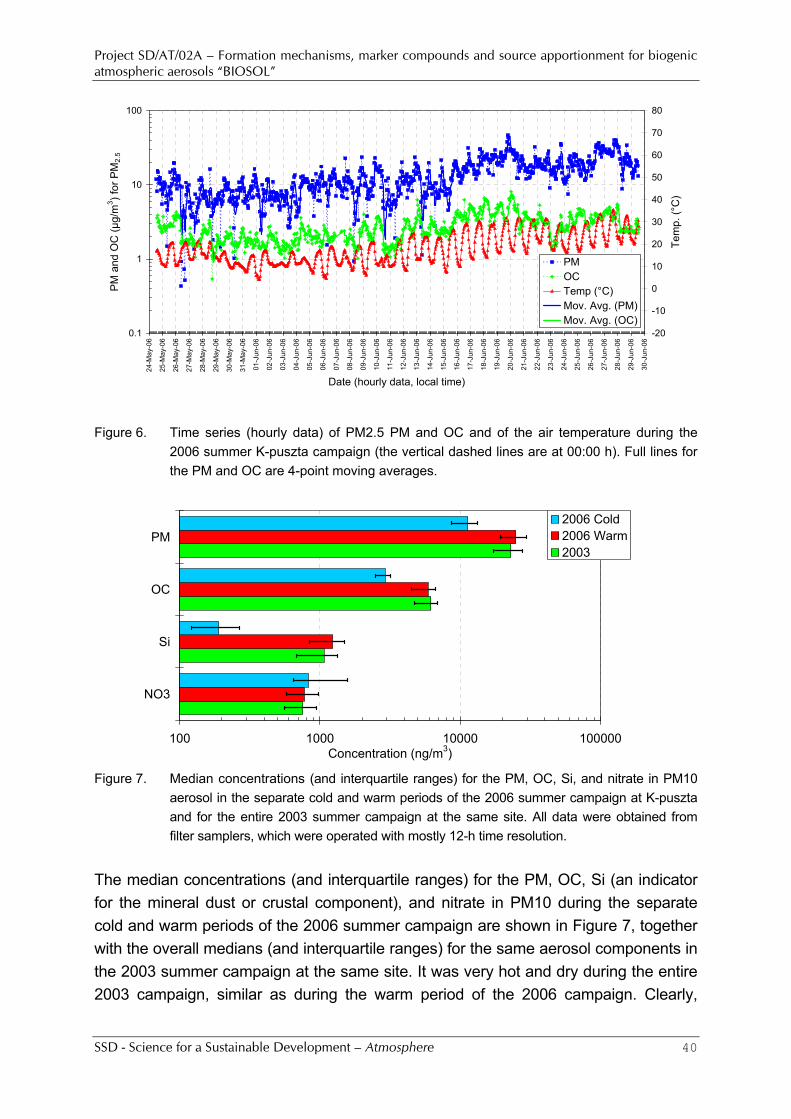
Project SD/AT/02A – Formation mechanisms, marker compounds and source apportionment for biogenic atmospheric aerosols “BIOSOL”
SSD - Science for a Sustainable Development – Atmosphere 40
Figure 6. Time series (hourly data) of PM2.5 PM and OC and of the air temperature during the
2006 summer K-puszta campaign (the vertical dashed lines are at 00:00 h). Full lines for the PM and OC are 4-point moving averages.
100 1000 10000 100000
NO3
Si
OC
PM
Concentration (ng/m3)
2006 Cold2006 Warm2003
Figure 7. Median concentrations (and interquartile ranges) for the PM, OC, Si, and nitrate in PM10
aerosol in the separate cold and warm periods of the 2006 summer campaign at K-puszta and for the entire 2003 summer campaign at the same site. All data were obtained from filter samplers, which were operated with mostly 12-h time resolution.
The median concentrations (and interquartile ranges) for the PM, OC, Si (an indicator for the mineral dust or crustal component), and nitrate in PM10 during the separate cold and warm periods of the 2006 summer campaign are shown in Figure 7, together with the overall medians (and interquartile ranges) for the same aerosol components in the 2003 summer campaign at the same site. It was very hot and dry during the entire 2003 campaign, similar as during the warm period of the 2006 campaign. Clearly,
0.1
1
10
100
24-M
ay-0
6
25-M
ay-0
6
26-M
ay-0
6
27-M
ay-0
6
28-M
ay-0
6
29-M
ay-0
6
30-M
ay-0
6
31-M
ay-0
6
01-J
un-0
6
02-J
un-0
6
03-J
un-0
6
04-J
un-0
6
05-J
un-0
6
06-J
un-0
6
07-J
un-0
6
08-J
un-0
6
09-J
un-0
6
10-J
un-0
6
11-J
un-0
6
12-J
un-0
6
13-J
un-0
6
14-J
un-0
6
15-J
un-0
6
16-J
un-0
6
17-J
un-0
6
18-J
un-0
6
19-J
un-0
6
20-J
un-0
6
21-J
un-0
6
22-J
un-0
6
23-J
un-0
6
24-J
un-0
6
25-J
un-0
6
26-J
un-0
6
27-J
un-0
6
28-J
un-0
6
29-J
un-0
6
30-J
un-0
6
Date (hourly data, local time)
PM a
nd O
C (µ
g/m
3 ) for
PM
2.5
-20
-10
0
10
20
30
40
50
60
70
80
Tem
p. (°
C)
PMOCTemp (°C)Mov. Avg. (PM)Mov. Avg. (OC)
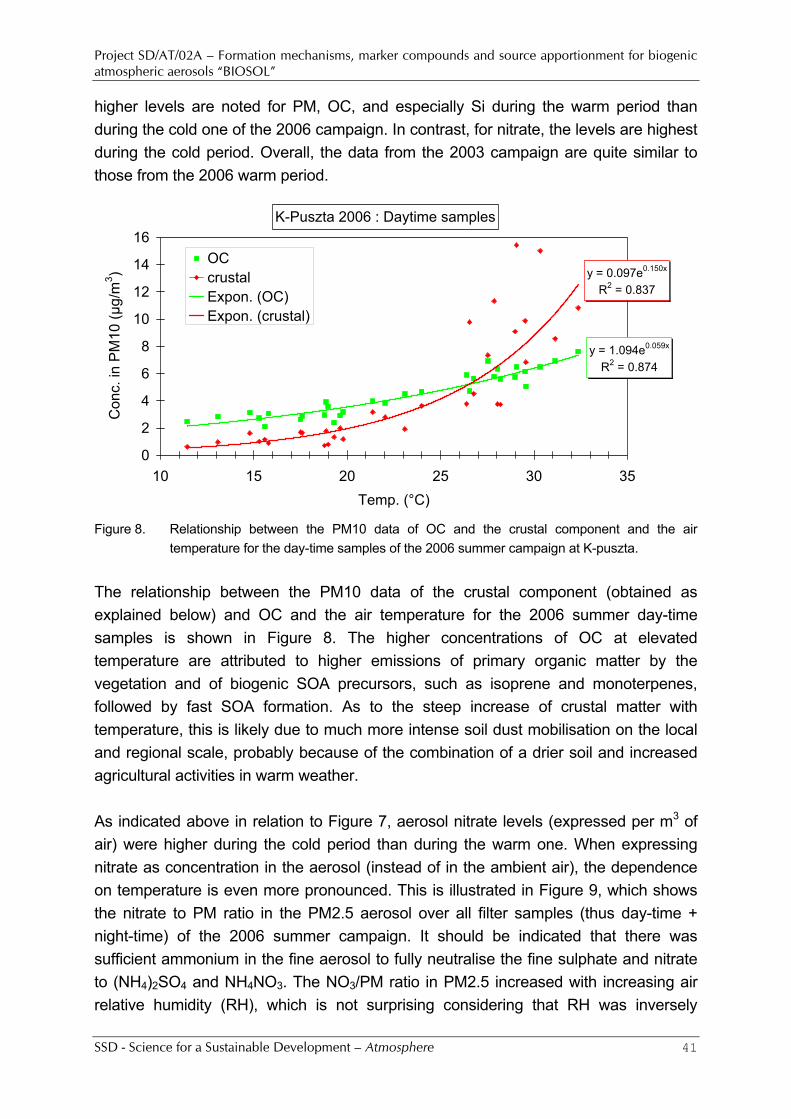
Project SD/AT/02A – Formation mechanisms, marker compounds and source apportionment for biogenic atmospheric aerosols “BIOSOL”
SSD - Science for a Sustainable Development – Atmosphere 41
higher levels are noted for PM, OC, and especially Si during the warm period than during the cold one of the 2006 campaign. In contrast, for nitrate, the levels are highest during the cold period. Overall, the data from the 2003 campaign are quite similar to those from the 2006 warm period.
K-Puszta 2006 : Daytime samples
y = 1.094e0.059x
R2 = 0.874
y = 0.097e0.150x
R2 = 0.837
0
2
4
6
8
10
12
14
16
10 15 20 25 30 35Temp. (°C)
Con
c. in
PM
10 (µ
g/m
3 )
OCcrustalExpon. (OC)Expon. (crustal)
Figure 8. Relationship between the PM10 data of OC and the crustal component and the air
temperature for the day-time samples of the 2006 summer campaign at K-puszta. The relationship between the PM10 data of the crustal component (obtained as explained below) and OC and the air temperature for the 2006 summer day-time samples is shown in Figure 8. The higher concentrations of OC at elevated temperature are attributed to higher emissions of primary organic matter by the vegetation and of biogenic SOA precursors, such as isoprene and monoterpenes, followed by fast SOA formation. As to the steep increase of crustal matter with temperature, this is likely due to much more intense soil dust mobilisation on the local and regional scale, probably because of the combination of a drier soil and increased agricultural activities in warm weather. As indicated above in relation to Figure 7, aerosol nitrate levels (expressed per m3 of air) were higher during the cold period than during the warm one. When expressing nitrate as concentration in the aerosol (instead of in the ambient air), the dependence on temperature is even more pronounced. This is illustrated in Figure 9, which shows the nitrate to PM ratio in the PM2.5 aerosol over all filter samples (thus day-time + night-time) of the 2006 summer campaign. It should be indicated that there was sufficient ammonium in the fine aerosol to fully neutralise the fine sulphate and nitrate to (NH4)2SO4 and NH4NO3. The NO3/PM ratio in PM2.5 increased with increasing air relative humidity (RH), which is not surprising considering that RH was inversely
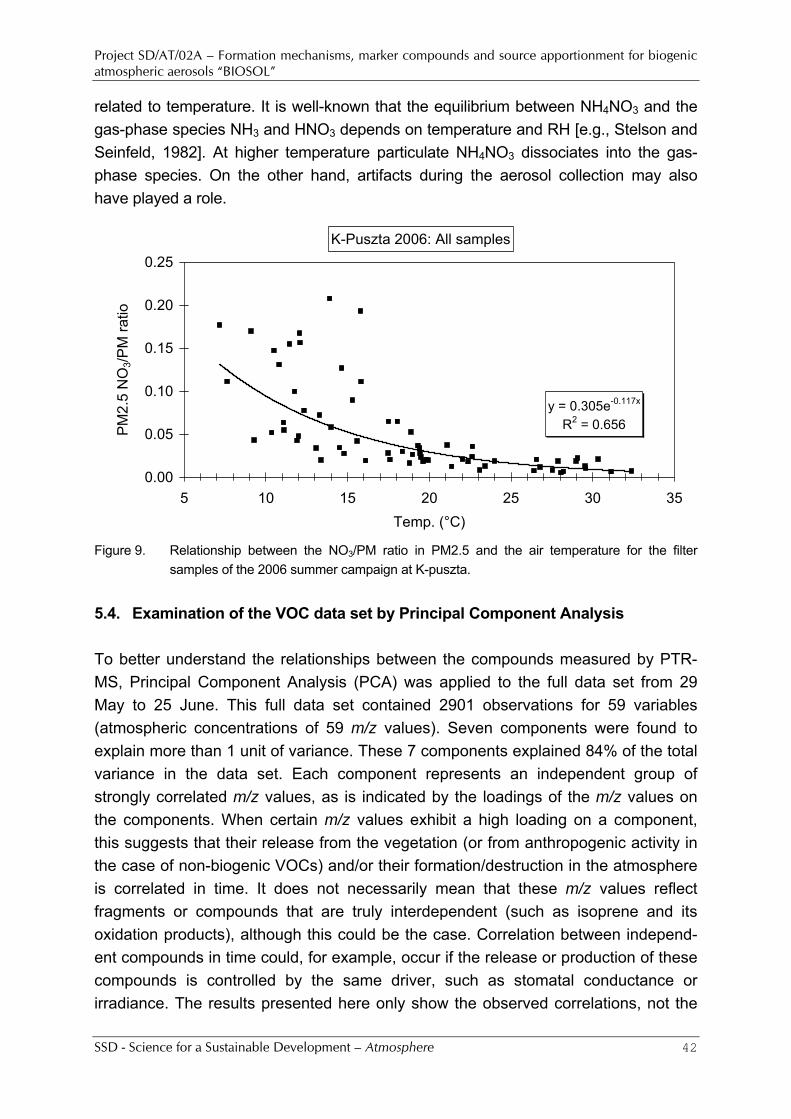
Project SD/AT/02A – Formation mechanisms, marker compounds and source apportionment for biogenic atmospheric aerosols “BIOSOL”
SSD - Science for a Sustainable Development – Atmosphere 42
related to temperature. It is well-known that the equilibrium between NH4NO3 and the gas-phase species NH3 and HNO3 depends on temperature and RH [e.g., Stelson and Seinfeld, 1982]. At higher temperature particulate NH4NO3 dissociates into the gas-phase species. On the other hand, artifacts during the aerosol collection may also have played a role.
K-Puszta 2006: All samples
y = 0.305e-0.117x
R2 = 0.656
0.00
0.05
0.10
0.15
0.20
0.25
5 10 15 20 25 30 35Temp. (°C)
PM
2.5
NO
3/PM
ratio
Figure 9. Relationship between the NO3/PM ratio in PM2.5 and the air temperature for the filter
samples of the 2006 summer campaign at K-puszta. 5.4. Examination of the VOC data set by Principal Component Analysis To better understand the relationships between the compounds measured by PTR-MS, Principal Component Analysis (PCA) was applied to the full data set from 29 May to 25 June. This full data set contained 2901 observations for 59 variables (atmospheric concentrations of 59 m/z values). Seven components were found to explain more than 1 unit of variance. These 7 components explained 84% of the total variance in the data set. Each component represents an independent group of strongly correlated m/z values, as is indicated by the loadings of the m/z values on the components. When certain m/z values exhibit a high loading on a component, this suggests that their release from the vegetation (or from anthropogenic activity in the case of non-biogenic VOCs) and/or their formation/destruction in the atmosphere is correlated in time. It does not necessarily mean that these m/z values reflect fragments or compounds that are truly interdependent (such as isoprene and its oxidation products), although this could be the case. Correlation between independ-ent compounds in time could, for example, occur if the release or production of these compounds is controlled by the same driver, such as stomatal conductance or irradiance. The results presented here only show the observed correlations, not the
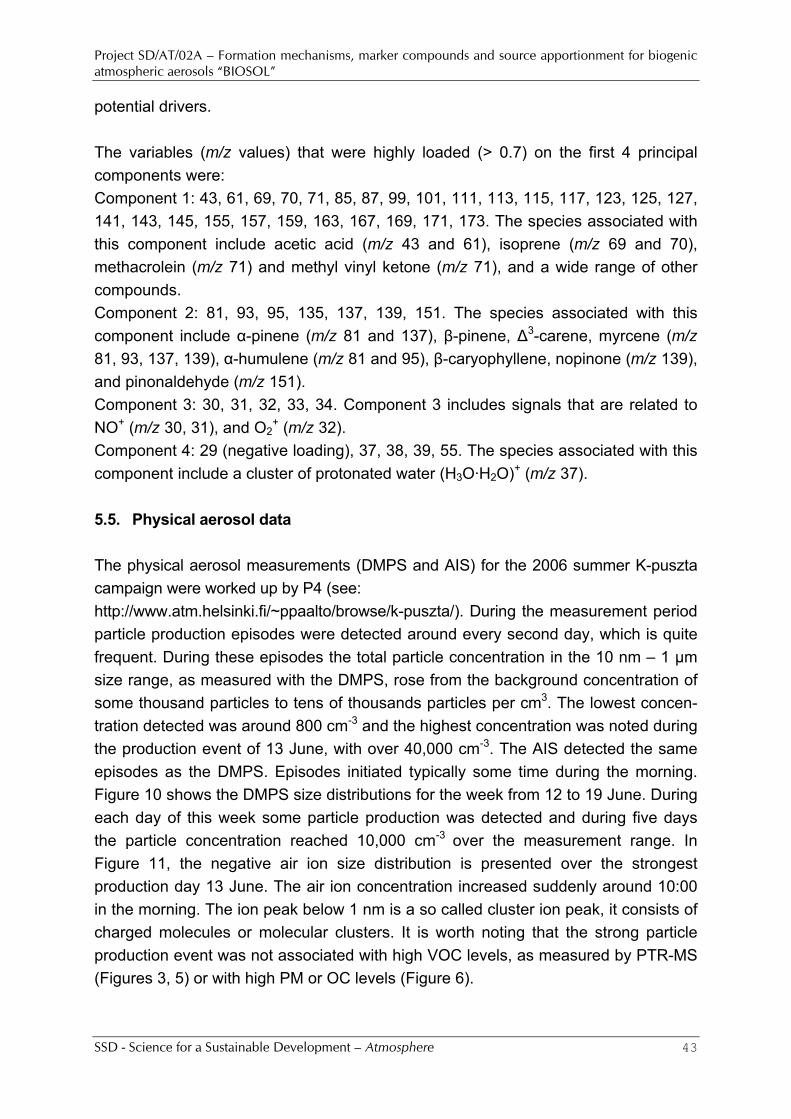
Project SD/AT/02A – Formation mechanisms, marker compounds and source apportionment for biogenic atmospheric aerosols “BIOSOL”
SSD - Science for a Sustainable Development – Atmosphere 43
potential drivers. The variables (m/z values) that were highly loaded (> 0.7) on the first 4 principal components were: Component 1: 43, 61, 69, 70, 71, 85, 87, 99, 101, 111, 113, 115, 117, 123, 125, 127, 141, 143, 145, 155, 157, 159, 163, 167, 169, 171, 173. The species associated with this component include acetic acid (m/z 43 and 61), isoprene (m/z 69 and 70), methacrolein (m/z 71) and methyl vinyl ketone (m/z 71), and a wide range of other compounds. Component 2: 81, 93, 95, 135, 137, 139, 151. The species associated with this component include α-pinene (m/z 81 and 137), β-pinene, Δ3-carene, myrcene (m/z 81, 93, 137, 139), α-humulene (m/z 81 and 95), β-caryophyllene, nopinone (m/z 139), and pinonaldehyde (m/z 151). Component 3: 30, 31, 32, 33, 34. Component 3 includes signals that are related to NO+ (m/z 30, 31), and O2
+ (m/z 32). Component 4: 29 (negative loading), 37, 38, 39, 55. The species associated with this component include a cluster of protonated water (H3O·H2O)+ (m/z 37). 5.5. Physical aerosol data The physical aerosol measurements (DMPS and AIS) for the 2006 summer K-puszta campaign were worked up by P4 (see: http://www.atm.helsinki.fi/~ppaalto/browse/k-puszta/). During the measurement period particle production episodes were detected around every second day, which is quite frequent. During these episodes the total particle concentration in the 10 nm – 1 µm size range, as measured with the DMPS, rose from the background concentration of some thousand particles to tens of thousands particles per cm3. The lowest concen-tration detected was around 800 cm-3 and the highest concentration was noted during the production event of 13 June, with over 40,000 cm-3. The AIS detected the same episodes as the DMPS. Episodes initiated typically some time during the morning. Figure 10 shows the DMPS size distributions for the week from 12 to 19 June. During each day of this week some particle production was detected and during five days the particle concentration reached 10,000 cm-3 over the measurement range. In Figure 11, the negative air ion size distribution is presented over the strongest production day 13 June. The air ion concentration increased suddenly around 10:00 in the morning. The ion peak below 1 nm is a so called cluster ion peak, it consists of charged molecules or molecular clusters. It is worth noting that the strong particle production event was not associated with high VOC levels, as measured by PTR-MS (Figures 3, 5) or with high PM or OC levels (Figure 6).
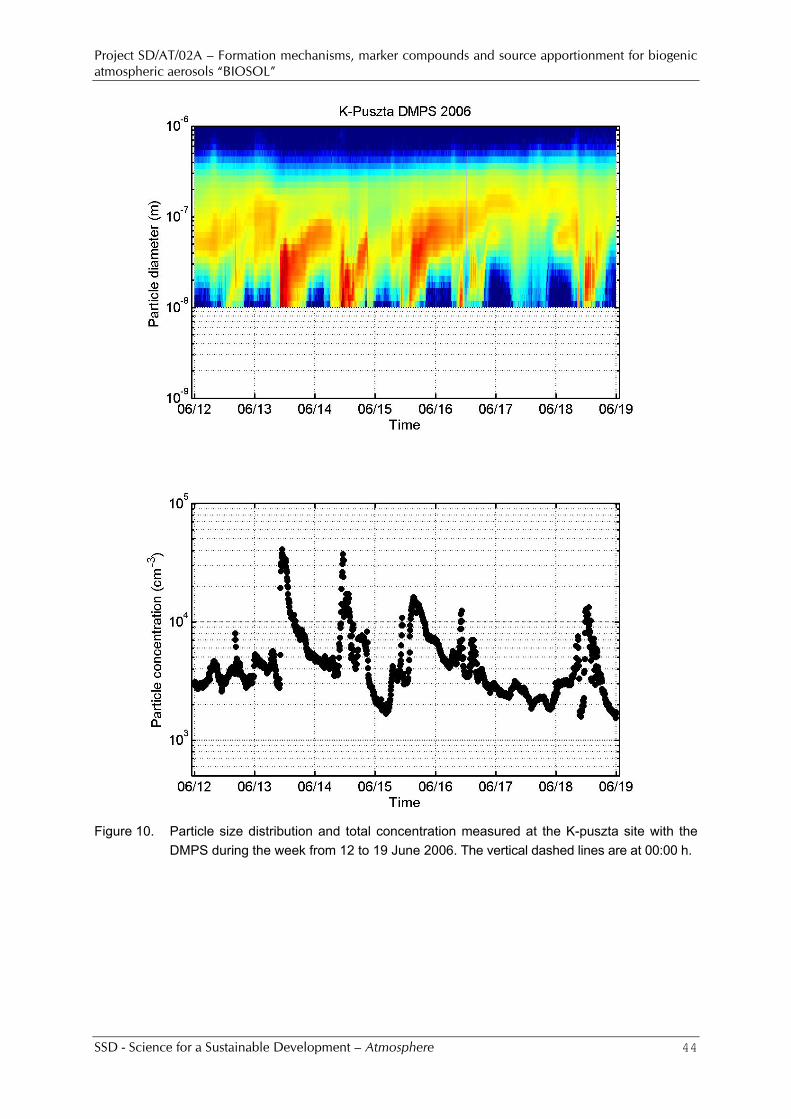
Project SD/AT/02A – Formation mechanisms, marker compounds and source apportionment for biogenic atmospheric aerosols “BIOSOL”
SSD - Science for a Sustainable Development – Atmosphere 44
Figure 10. Particle size distribution and total concentration measured at the K-puszta site with the
DMPS during the week from 12 to 19 June 2006. The vertical dashed lines are at 00:00 h.
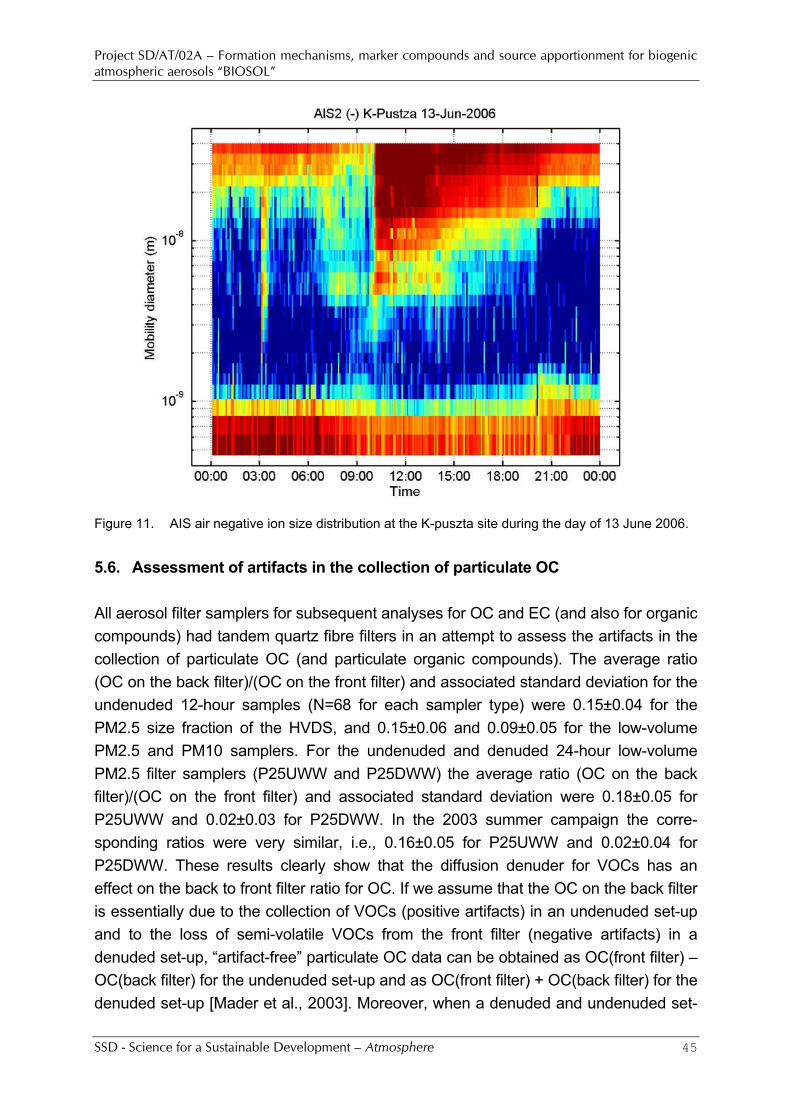
Project SD/AT/02A – Formation mechanisms, marker compounds and source apportionment for biogenic atmospheric aerosols “BIOSOL”
SSD - Science for a Sustainable Development – Atmosphere 45
Figure 11. AIS air negative ion size distribution at the K-puszta site during the day of 13 June 2006. 5.6. Assessment of artifacts in the collection of particulate OC All aerosol filter samplers for subsequent analyses for OC and EC (and also for organic compounds) had tandem quartz fibre filters in an attempt to assess the artifacts in the collection of particulate OC (and particulate organic compounds). The average ratio (OC on the back filter)/(OC on the front filter) and associated standard deviation for the undenuded 12-hour samples (N=68 for each sampler type) were 0.15±0.04 for the PM2.5 size fraction of the HVDS, and 0.15±0.06 and 0.09±0.05 for the low-volume PM2.5 and PM10 samplers. For the undenuded and denuded 24-hour low-volume PM2.5 filter samplers (P25UWW and P25DWW) the average ratio (OC on the back filter)/(OC on the front filter) and associated standard deviation were 0.18±0.05 for P25UWW and 0.02±0.03 for P25DWW. In the 2003 summer campaign the corre-sponding ratios were very similar, i.e., 0.16±0.05 for P25UWW and 0.02±0.04 for P25DWW. These results clearly show that the diffusion denuder for VOCs has an effect on the back to front filter ratio for OC. If we assume that the OC on the back filter is essentially due to the collection of VOCs (positive artifacts) in an undenuded set-up and to the loss of semi-volatile VOCs from the front filter (negative artifacts) in a denuded set-up, “artifact-free” particulate OC data can be obtained as OC(front filter) – OC(back filter) for the undenuded set-up and as OC(front filter) + OC(back filter) for the denuded set-up [Mader et al., 2003]. Moreover, when a denuded and undenuded set-
Project SD/AT/02A – Formation mechanisms, marker compounds and source apportionment for biogenic atmospheric aerosols “BIOSOL”
SSD - Science for a Sustainable Development – Atmosphere 46
up are operated in parallel, the corrected OC data from the two set-ups should be the same. Applying the correction to the OC data from the parallel undenuded and denuded 24-hour low-volume PM2.5 filter samplers resulted in an average ratio (corrected OC from P25UWW)/(corrected OC from P25DWW) of 0.97±0.28, which indicates that the above assumptions were valid for these samples [In the 2003 campaign a poorer ratio of 1.16±0.11 was obtained]. We assumed that the above assumptions were also valid for the undenuded 12-hour samplers, and corrected OC were calculated for these samples as OC(front filter) – OC(back filter). The OC data listed and used for the K-puszta site in this report are such corrected data, except when indicated otherwise. EC represented only a minor fraction of the TC (with TC = OC + EC), indicating that the K-puszta site was not much influenced by automotive emissions or other fossil fuel combustion. For the hourly PM2.5 OCEC data presented in Figure 6, the average ratio and associated standard deviation for OptEC/TC were 0.15±0.05. For the filter samples even lower EC/TC ratios were obtained. For example, based on the 68 HVDS samples for the 2006 campaign, the average ratios and associated standard deviations for EC/TC (using uncorrected OC data) were 0.063±0.030 for the fine front filters and 0.026±0.038 for the coarse front filters. The corresponding data for the 2003 campaign were similar, i.e., 0.049±0.014 for fine and 0.036±0.013 for coarse. Most of the PM10 OC was in the fine (PM2.5) size fraction during the 2006 campaign, on average 72±10% [N=68]. For comparison, of the PM10 PM, on average, 67±8% [N=68] was in the PM2.5 size fraction (based on the PM data from the samplers with Nuclepore polycarbonate filters). The data from the MOUDI/nano-MOUDI combination indicated that there was very little mass in the ultrafine (<0.1 µm) size fraction, i.e., on average, only 3% of the PM10 PM. It also appeared from the detailed mass size distributions for the PM that no real separate Aitken or nucleation mode could be discerned; rather the mass size distribution in the ultrafine size range appeared to be a tail of the accumu-lation mode. The WSOC analyses of the HVDS samples indicated that most of the fine OC was water-soluble. Using uncorrected OC data, 57±9% [N=68] of the OC was WSOC for the fine front filters and 73±12% [N=68] for the fine back filters during the 2006 campaign. The corresponding percentages for the 2003 campaign were 61±9% for the fine front filters and 87±15% for the fine back filters. 5.7. Aerosol chemical mass closure The data from the 12-hour low-volume PM2.5 and PM10 samplers of the 2006 summer campaign at K-puszta were used for aerosol chemical mass closure calculations, that is to assess to what extent the gravimetrically measured PM agreed with the sum of the measured chemical components. As gravimetric PM data we
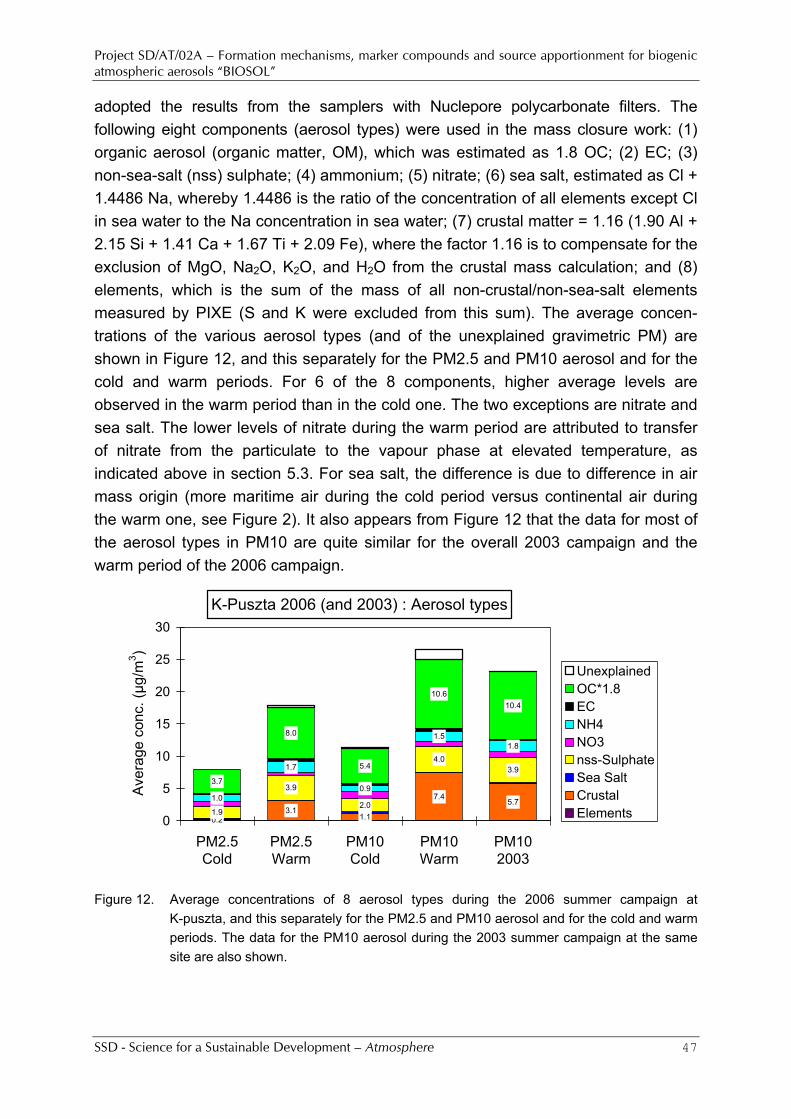
Project SD/AT/02A – Formation mechanisms, marker compounds and source apportionment for biogenic atmospheric aerosols “BIOSOL”
SSD - Science for a Sustainable Development – Atmosphere 47
adopted the results from the samplers with Nuclepore polycarbonate filters. The following eight components (aerosol types) were used in the mass closure work: (1) organic aerosol (organic matter, OM), which was estimated as 1.8 OC; (2) EC; (3) non-sea-salt (nss) sulphate; (4) ammonium; (5) nitrate; (6) sea salt, estimated as Cl + 1.4486 Na, whereby 1.4486 is the ratio of the concentration of all elements except Cl in sea water to the Na concentration in sea water; (7) crustal matter = 1.16 (1.90 Al + 2.15 Si + 1.41 Ca + 1.67 Ti + 2.09 Fe), where the factor 1.16 is to compensate for the exclusion of MgO, Na2O, K2O, and H2O from the crustal mass calculation; and (8) elements, which is the sum of the mass of all non-crustal/non-sea-salt elements measured by PIXE (S and K were excluded from this sum). The average concen-trations of the various aerosol types (and of the unexplained gravimetric PM) are shown in Figure 12, and this separately for the PM2.5 and PM10 aerosol and for the cold and warm periods. For 6 of the 8 components, higher average levels are observed in the warm period than in the cold one. The two exceptions are nitrate and sea salt. The lower levels of nitrate during the warm period are attributed to transfer of nitrate from the particulate to the vapour phase at elevated temperature, as indicated above in section 5.3. For sea salt, the difference is due to difference in air mass origin (more maritime air during the cold period versus continental air during the warm one, see Figure 2). It also appears from Figure 12 that the data for most of the aerosol types in PM10 are quite similar for the overall 2003 campaign and the warm period of the 2006 campaign.
K-Puszta 2006 (and 2003) : Aerosol types
0.23.1
1.1
7.45.7
1.9
3.9
2.0
4.03.9
1.0
1.7
0.9
1.51.8
3.7
8.0
5.4
10.610.4
0
5
10
15
20
25
30
PM2.5Cold
PM2.5Warm
PM10Cold
PM10Warm
PM102003
Ave
rage
con
c. (µ
g/m
3 )
UnexplainedOC*1.8ECNH4NO3nss-SulphateSea SaltCrustalElements
Figure 12. Average concentrations of 8 aerosol types during the 2006 summer campaign at
K-puszta, and this separately for the PM2.5 and PM10 aerosol and for the cold and warm periods. The data for the PM10 aerosol during the 2003 summer campaign at the same site are also shown.
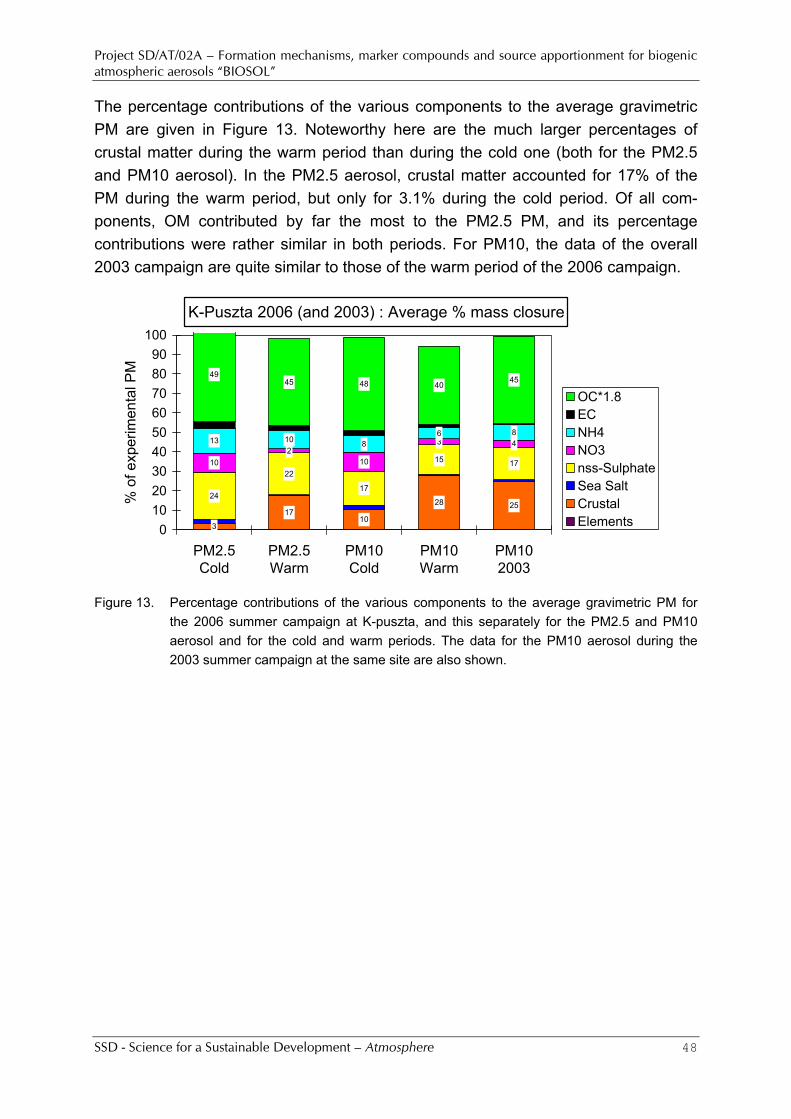
Project SD/AT/02A – Formation mechanisms, marker compounds and source apportionment for biogenic atmospheric aerosols “BIOSOL”
SSD - Science for a Sustainable Development – Atmosphere 48
The percentage contributions of the various components to the average gravimetric PM are given in Figure 13. Noteworthy here are the much larger percentages of crustal matter during the warm period than during the cold one (both for the PM2.5 and PM10 aerosol). In the PM2.5 aerosol, crustal matter accounted for 17% of the PM during the warm period, but only for 3.1% during the cold period. Of all com-ponents, OM contributed by far the most to the PM2.5 PM, and its percentage contributions were rather similar in both periods. For PM10, the data of the overall 2003 campaign are quite similar to those of the warm period of the 2006 campaign.
K-Puszta 2006 (and 2003) : Average % mass closure
3
1710
28 2524
22
17
15 17102
10
3 413 10 86 8
4945 48 40
45
0102030405060708090
100
PM2.5Cold
PM2.5Warm
PM10Cold
PM10Warm
PM102003
% o
f exp
erim
enta
l PM
OC*1.8ECNH4NO3nss-SulphateSea SaltCrustalElements
Figure 13. Percentage contributions of the various components to the average gravimetric PM for
the 2006 summer campaign at K-puszta, and this separately for the PM2.5 and PM10 aerosol and for the cold and warm periods. The data for the PM10 aerosol during the 2003 summer campaign at the same site are also shown.
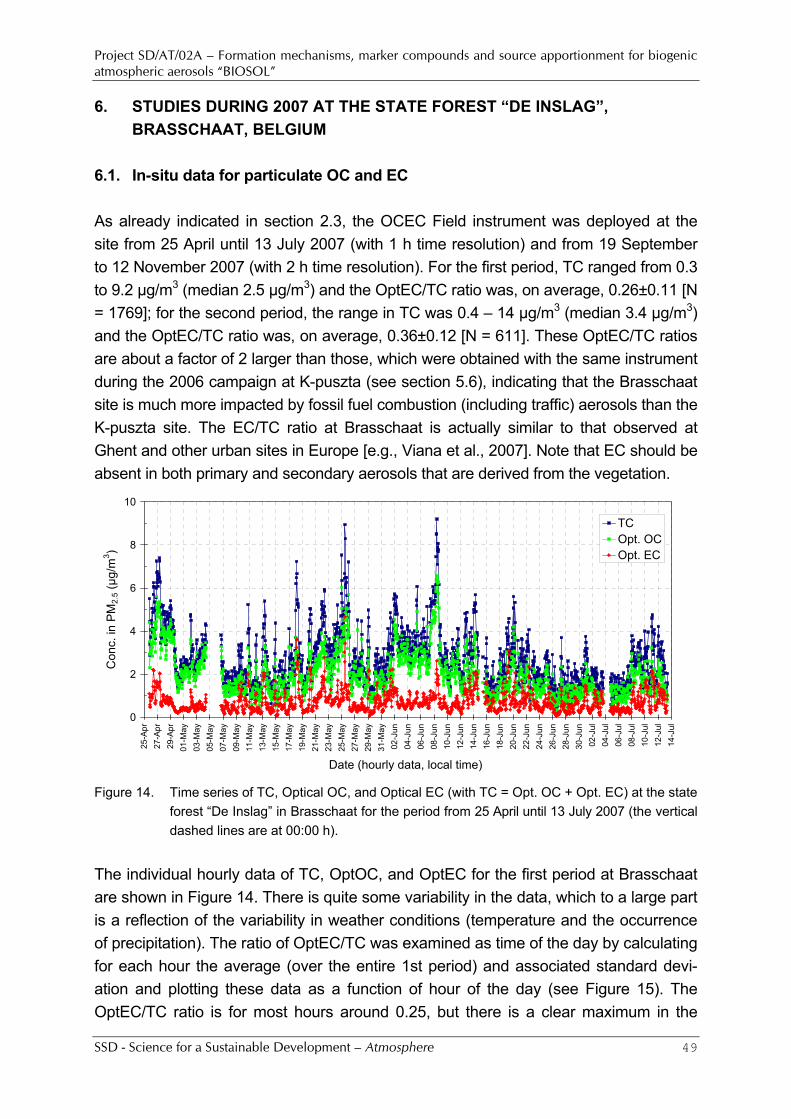
Project SD/AT/02A – Formation mechanisms, marker compounds and source apportionment for biogenic atmospheric aerosols “BIOSOL”
SSD - Science for a Sustainable Development – Atmosphere 49
6. STUDIES DURING 2007 AT THE STATE FOREST “DE INSLAG”, BRASSCHAAT, BELGIUM
6.1. In-situ data for particulate OC and EC As already indicated in section 2.3, the OCEC Field instrument was deployed at the site from 25 April until 13 July 2007 (with 1 h time resolution) and from 19 September to 12 November 2007 (with 2 h time resolution). For the first period, TC ranged from 0.3 to 9.2 µg/m3 (median 2.5 µg/m3) and the OptEC/TC ratio was, on average, 0.26±0.11 [N = 1769]; for the second period, the range in TC was 0.4 – 14 µg/m3 (median 3.4 µg/m3) and the OptEC/TC ratio was, on average, 0.36±0.12 [N = 611]. These OptEC/TC ratios are about a factor of 2 larger than those, which were obtained with the same instrument during the 2006 campaign at K-puszta (see section 5.6), indicating that the Brasschaat site is much more impacted by fossil fuel combustion (including traffic) aerosols than the K-puszta site. The EC/TC ratio at Brasschaat is actually similar to that observed at Ghent and other urban sites in Europe [e.g., Viana et al., 2007]. Note that EC should be absent in both primary and secondary aerosols that are derived from the vegetation.
0
2
4
6
8
10
25-A
pr27
-Apr
29-A
pr01
-May
03-M
ay05
-May
07-M
ay09
-May
11-M
ay13
-May
15-M
ay17
-May
19-M
ay21
-May
23-M
ay25
-May
27-M
ay29
-May
31-M
ay02
-Jun
04-J
un06
-Jun
08-J
un10
-Jun
12-J
un14
-Jun
16-J
un18
-Jun
20-J
un22
-Jun
24-J
un26
-Jun
28-J
un30
-Jun
02-J
ul04
-Jul
06-J
ul08
-Jul
10-J
ul12
-Jul
14-J
ul
Date (hourly data, local time)
Con
c. in
PM
2.5 (
µg/m
3 )
TCOpt. OCOpt. EC
Figure 14. Time series of TC, Optical OC, and Optical EC (with TC = Opt. OC + Opt. EC) at the state
forest “De Inslag” in Brasschaat for the period from 25 April until 13 July 2007 (the vertical dashed lines are at 00:00 h).
The individual hourly data of TC, OptOC, and OptEC for the first period at Brasschaat are shown in Figure 14. There is quite some variability in the data, which to a large part is a reflection of the variability in weather conditions (temperature and the occurrence of precipitation). The ratio of OptEC/TC was examined as time of the day by calculating for each hour the average (over the entire 1st period) and associated standard devi-ation and plotting these data as a function of hour of the day (see Figure 15). The OptEC/TC ratio is for most hours around 0.25, but there is a clear maximum in the
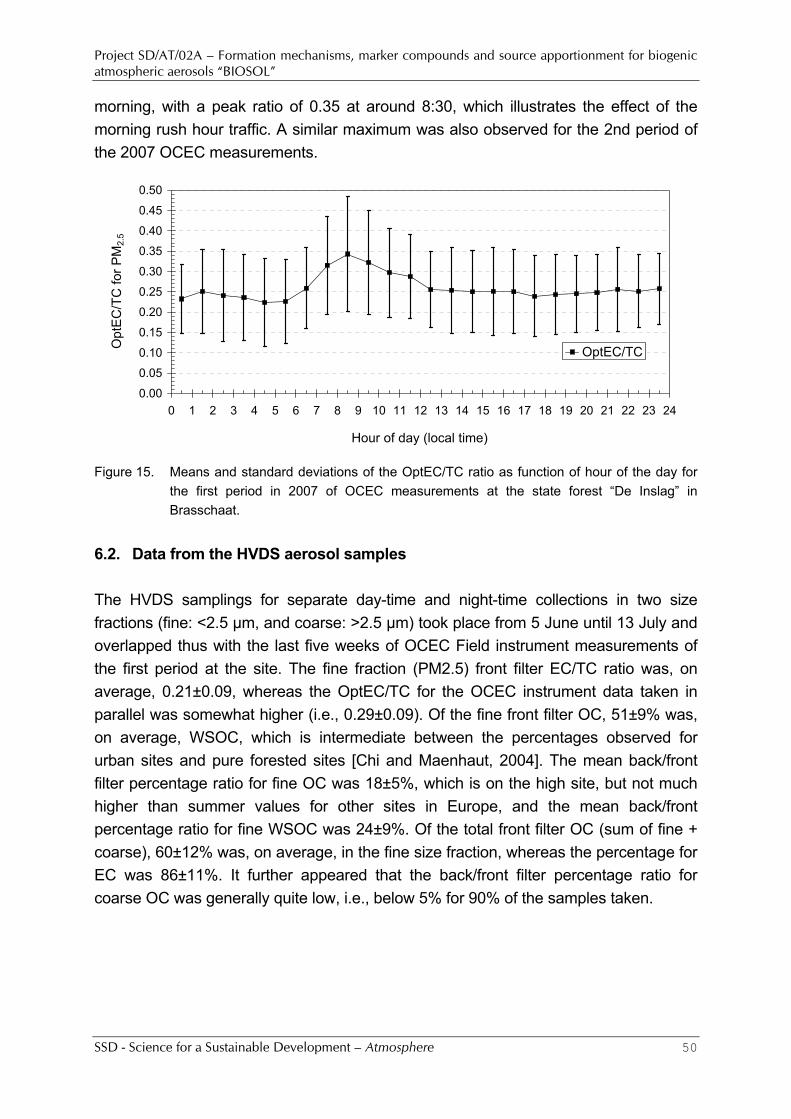
Project SD/AT/02A – Formation mechanisms, marker compounds and source apportionment for biogenic atmospheric aerosols “BIOSOL”
SSD - Science for a Sustainable Development – Atmosphere 50
morning, with a peak ratio of 0.35 at around 8:30, which illustrates the effect of the morning rush hour traffic. A similar maximum was also observed for the 2nd period of the 2007 OCEC measurements.
0.00
0.05
0.10
0.15
0.20
0.25
0.30
0.35
0.40
0.45
0.50
0 1 2 3 4 5 6 7 8 9 10 11 12 13 14 15 16 17 18 19 20 21 22 23 24
Hour of day (local time)
Opt
EC
/TC
for P
M2.
5
OptEC/TC
Figure 15. Means and standard deviations of the OptEC/TC ratio as function of hour of the day for
the first period in 2007 of OCEC measurements at the state forest “De Inslag” in Brasschaat.
6.2. Data from the HVDS aerosol samples The HVDS samplings for separate day-time and night-time collections in two size fractions (fine: <2.5 µm, and coarse: >2.5 µm) took place from 5 June until 13 July and overlapped thus with the last five weeks of OCEC Field instrument measurements of the first period at the site. The fine fraction (PM2.5) front filter EC/TC ratio was, on average, 0.21±0.09, whereas the OptEC/TC for the OCEC instrument data taken in parallel was somewhat higher (i.e., 0.29±0.09). Of the fine front filter OC, 51±9% was, on average, WSOC, which is intermediate between the percentages observed for urban sites and pure forested sites [Chi and Maenhaut, 2004]. The mean back/front filter percentage ratio for fine OC was 18±5%, which is on the high site, but not much higher than summer values for other sites in Europe, and the mean back/front percentage ratio for fine WSOC was 24±9%. Of the total front filter OC (sum of fine + coarse), 60±12% was, on average, in the fine size fraction, whereas the percentage for EC was 86±11%. It further appeared that the back/front filter percentage ratio for coarse OC was generally quite low, i.e., below 5% for 90% of the samples taken.
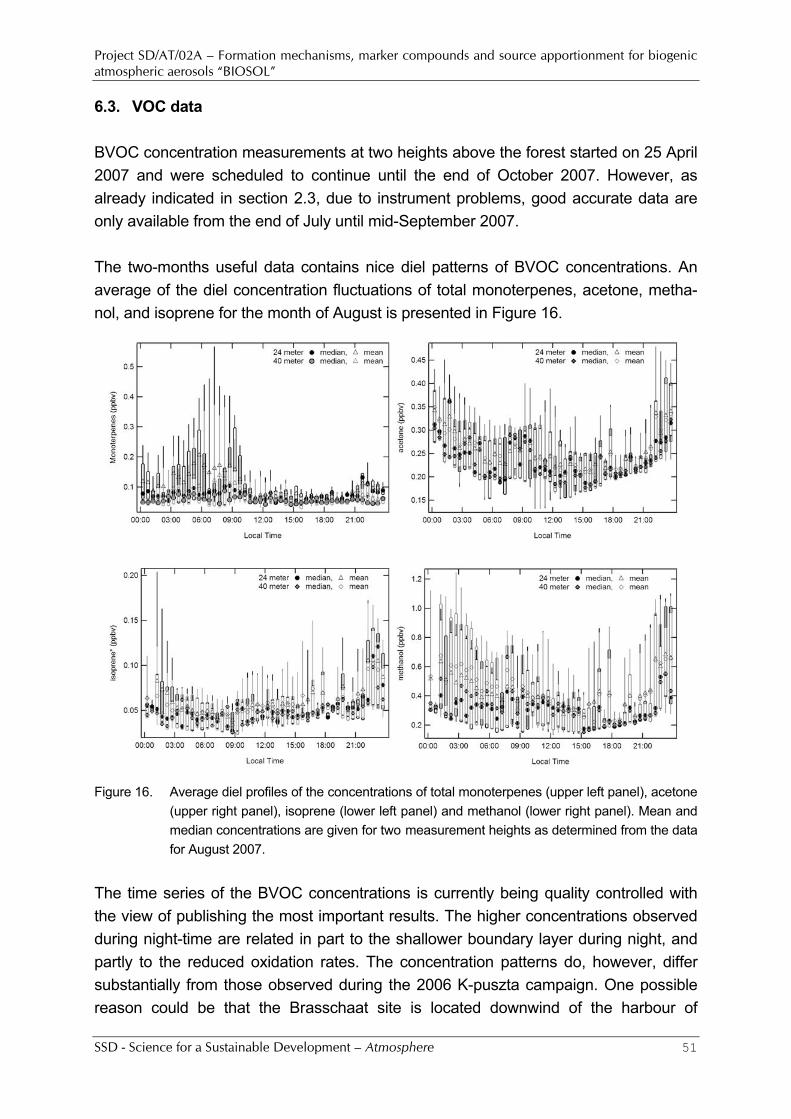
Project SD/AT/02A – Formation mechanisms, marker compounds and source apportionment for biogenic atmospheric aerosols “BIOSOL”
SSD - Science for a Sustainable Development – Atmosphere 51
6.3. VOC data BVOC concentration measurements at two heights above the forest started on 25 April 2007 and were scheduled to continue until the end of October 2007. However, as already indicated in section 2.3, due to instrument problems, good accurate data are only available from the end of July until mid-September 2007. The two-months useful data contains nice diel patterns of BVOC concentrations. An average of the diel concentration fluctuations of total monoterpenes, acetone, metha-nol, and isoprene for the month of August is presented in Figure 16.
Figure 16. Average diel profiles of the concentrations of total monoterpenes (upper left panel), acetone
(upper right panel), isoprene (lower left panel) and methanol (lower right panel). Mean and median concentrations are given for two measurement heights as determined from the data for August 2007.
The time series of the BVOC concentrations is currently being quality controlled with the view of publishing the most important results. The higher concentrations observed during night-time are related in part to the shallower boundary layer during night, and partly to the reduced oxidation rates. The concentration patterns do, however, differ substantially from those observed during the 2006 K-puszta campaign. One possible reason could be that the Brasschaat site is located downwind of the harbour of
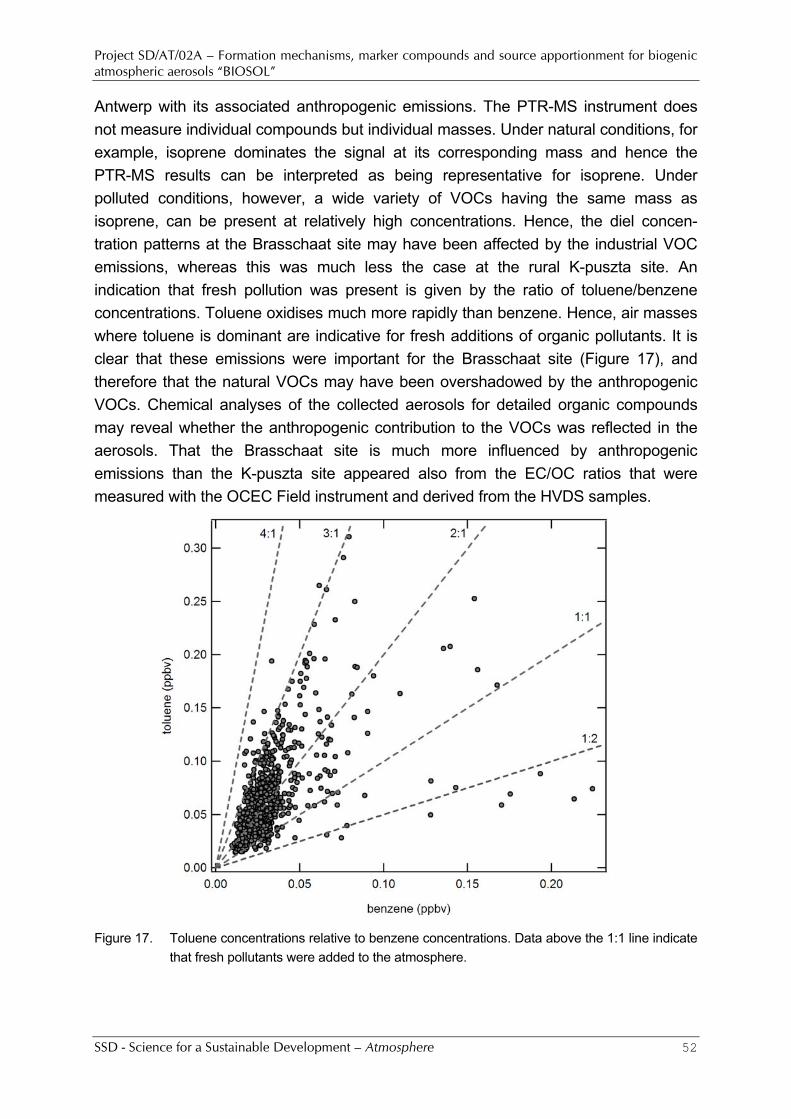
Project SD/AT/02A – Formation mechanisms, marker compounds and source apportionment for biogenic atmospheric aerosols “BIOSOL”
SSD - Science for a Sustainable Development – Atmosphere 52
Antwerp with its associated anthropogenic emissions. The PTR-MS instrument does not measure individual compounds but individual masses. Under natural conditions, for example, isoprene dominates the signal at its corresponding mass and hence the PTR-MS results can be interpreted as being representative for isoprene. Under polluted conditions, however, a wide variety of VOCs having the same mass as isoprene, can be present at relatively high concentrations. Hence, the diel concen-tration patterns at the Brasschaat site may have been affected by the industrial VOC emissions, whereas this was much less the case at the rural K-puszta site. An indication that fresh pollution was present is given by the ratio of toluene/benzene concentrations. Toluene oxidises much more rapidly than benzene. Hence, air masses where toluene is dominant are indicative for fresh additions of organic pollutants. It is clear that these emissions were important for the Brasschaat site (Figure 17), and therefore that the natural VOCs may have been overshadowed by the anthropogenic VOCs. Chemical analyses of the collected aerosols for detailed organic compounds may reveal whether the anthropogenic contribution to the VOCs was reflected in the aerosols. That the Brasschaat site is much more influenced by anthropogenic emissions than the K-puszta site appeared also from the EC/OC ratios that were measured with the OCEC Field instrument and derived from the HVDS samples.
Figure 17. Toluene concentrations relative to benzene concentrations. Data above the 1:1 line indicate
that fresh pollutants were added to the atmosphere.
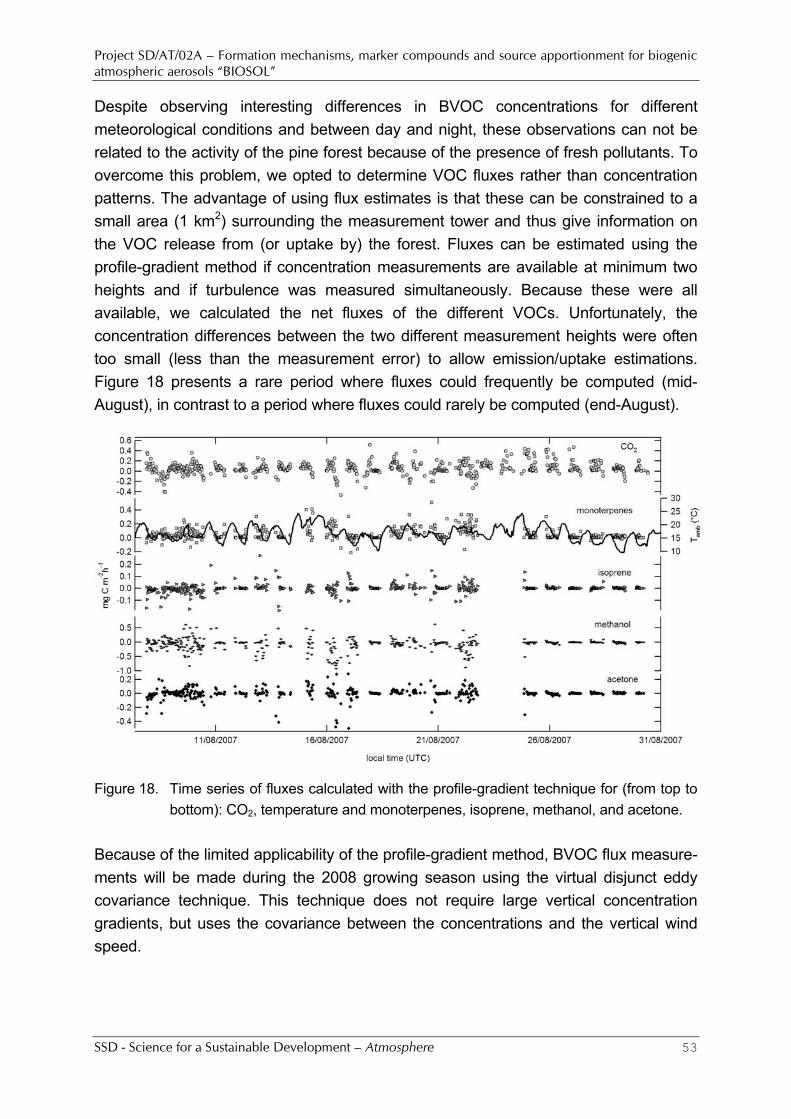
Project SD/AT/02A – Formation mechanisms, marker compounds and source apportionment for biogenic atmospheric aerosols “BIOSOL”
SSD - Science for a Sustainable Development – Atmosphere 53
Despite observing interesting differences in BVOC concentrations for different meteorological conditions and between day and night, these observations can not be related to the activity of the pine forest because of the presence of fresh pollutants. To overcome this problem, we opted to determine VOC fluxes rather than concentration patterns. The advantage of using flux estimates is that these can be constrained to a small area (1 km2) surrounding the measurement tower and thus give information on the VOC release from (or uptake by) the forest. Fluxes can be estimated using the profile-gradient method if concentration measurements are available at minimum two heights and if turbulence was measured simultaneously. Because these were all available, we calculated the net fluxes of the different VOCs. Unfortunately, the concentration differences between the two different measurement heights were often too small (less than the measurement error) to allow emission/uptake estimations. Figure 18 presents a rare period where fluxes could frequently be computed (mid-August), in contrast to a period where fluxes could rarely be computed (end-August).
Figure 18. Time series of fluxes calculated with the profile-gradient technique for (from top to
bottom): CO2, temperature and monoterpenes, isoprene, methanol, and acetone. Because of the limited applicability of the profile-gradient method, BVOC flux measure-ments will be made during the 2008 growing season using the virtual disjunct eddy covariance technique. This technique does not require large vertical concentration gradients, but uses the covariance between the concentrations and the vertical wind speed.
Project SD/AT/02A – Formation mechanisms, marker compounds and source apportionment for biogenic atmospheric aerosols “BIOSOL”
SSD - Science for a Sustainable Development – Atmosphere 54
7. STUDIES AT THE SMEAR II FOREST STATION IN HYYTIÄLÄ, FINLAND 7.1. Summer campaign in 2005 The comprehensive experiments at the SMEAR II site in Hyytiälä took place in August 2007. However, as indicated in section 2.4, already in summer of 2005 a less compre-hensive campaign was conducted, for which the work also forms part of the current project. The results are described in detail in Kourtchev et al. [2008a,b]. Here only a brief summary is given. The median total concentration of terpenoic acids [i.e., pinic acid, norpinic acid, and two novel compounds, 3-hydroxyglutaric acid and 3-methyl-1,2,3-butanetricarboxylic acid (this compound was previously and also in Kourtchev et al. [2008a] incorrectly identified as 2-hydroxyl-4-isopropyladipic acid) was 65 ng m-3, while that of the isoprene oxidation products (i.e., 2-methyltetrols and C5-alkene triols) was 17.2 ng m–3. The 2-methyltetrols exhibited day/night variations with maxima during day-time, while the α-/β-pinene oxidation products did not show any diel variation. The sampling period was marked by a relatively high condensation sink, caused by pre-existing aerosol particles, and no nucleation events. In general, the concentration trends of the SOA compounds reflected those of the inorganic trace gases, meteorological parameters, and condensation sink. Both the isoprene and α-/β-pinene SOA products were strongly influenced by SO2, which is consistent with earlier reports that acidity plays a role in SOA formation. The results support previous proposals that oxygenated VOCs contribute to particle growth processes above the boreal forest. 7.2. Meteorology, air mass origin, and inorganic trace gases for the 2007
summer campaign The field work for the 2007 summer field campaign took place from 1 to 31 August 2007. A summary of selected meteorological and inorganic trace gas data for the month of August is given in Table 2. The data in this Table are based on daily averages (in case of precipitation, daily sums). The temperature and trace gas data in the Table are for a height of 8.4 m above the base of the mast on which the sensors were installed. There were sensors at 7 levels above mast base, ranging from 4.2 to 74 m. The highest sensor level within the forest canopy was at 8.4 m above mast base (near the top of the canopy) and the lowest sensor level above the canopy was at 16.8 m above mast base. The aerosol instruments and collectors of BIOSOL partner C were all installed at about 8 m above mast base on a separate tower. Figure 19 shows the time series of the 15-min averaged temperature data at 6 levels above mast base and of the RH. There were 14 days with rain throughout the month (i.e., on 1, 3, 12, 15 through 19, and 26 through 31 August). However, on most of these days, the total
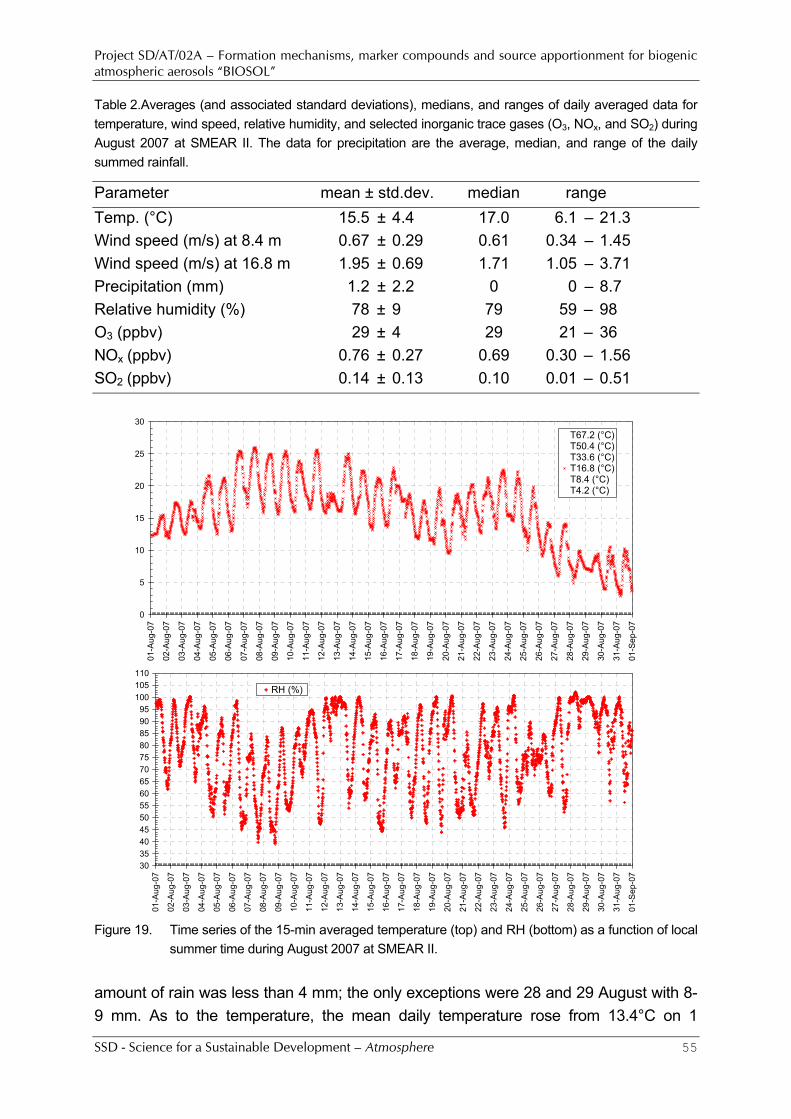
Project SD/AT/02A – Formation mechanisms, marker compounds and source apportionment for biogenic atmospheric aerosols “BIOSOL”
SSD - Science for a Sustainable Development – Atmosphere 55
Table 2.Averages (and associated standard deviations), medians, and ranges of daily averaged data for temperature, wind speed, relative humidity, and selected inorganic trace gases (O3, NOx, and SO2) during August 2007 at SMEAR II. The data for precipitation are the average, median, and range of the daily summed rainfall.
Parameter mean ± std.dev. median range Temp. (°C) 15.5 ± 4.4 17.0 6.1 – 21.3 Wind speed (m/s) at 8.4 m 0.67 ± 0.29 0.61 0.34 – 1.45 Wind speed (m/s) at 16.8 m 1.95 ± 0.69 1.71 1.05 – 3.71 Precipitation (mm) 1.2 ± 2.2 0 0 – 8.7 Relative humidity (%) 78 ± 9 79 59 – 98 O3 (ppbv) 29 ± 4 29 21 – 36 NOx (ppbv) 0.76 ± 0.27 0.69 0.30 – 1.56 SO2 (ppbv) 0.14 ± 0.13 0.10 0.01 – 0.51
0
5
10
15
20
25
30
01-A
ug-0
7
02-A
ug-0
7
03-A
ug-0
7
04-A
ug-0
7
05-A
ug-0
7
06-A
ug-0
7
07-A
ug-0
7
08-A
ug-0
7
09-A
ug-0
7
10-A
ug-0
7
11-A
ug-0
7
12-A
ug-0
7
13-A
ug-0
7
14-A
ug-0
7
15-A
ug-0
7
16-A
ug-0
7
17-A
ug-0
7
18-A
ug-0
7
19-A
ug-0
7
20-A
ug-0
7
21-A
ug-0
7
22-A
ug-0
7
23-A
ug-0
7
24-A
ug-0
7
25-A
ug-0
7
26-A
ug-0
7
27-A
ug-0
7
28-A
ug-0
7
29-A
ug-0
7
30-A
ug-0
7
31-A
ug-0
7
01-S
ep-0
7
T67.2 (°C)T50.4 (°C)T33.6 (°C)T16.8 (°C)T8.4 (°C)T4.2 (°C)
3035404550556065707580859095
100105110
01-A
ug-0
7
02-A
ug-0
7
03-A
ug-0
7
04-A
ug-0
7
05-A
ug-0
7
06-A
ug-0
7
07-A
ug-0
7
08-A
ug-0
7
09-A
ug-0
7
10-A
ug-0
7
11-A
ug-0
7
12-A
ug-0
7
13-A
ug-0
7
14-A
ug-0
7
15-A
ug-0
7
16-A
ug-0
7
17-A
ug-0
7
18-A
ug-0
7
19-A
ug-0
7
20-A
ug-0
7
21-A
ug-0
7
22-A
ug-0
7
23-A
ug-0
7
24-A
ug-0
7
25-A
ug-0
7
26-A
ug-0
7
27-A
ug-0
7
28-A
ug-0
7
29-A
ug-0
7
30-A
ug-0
7
31-A
ug-0
7
01-S
ep-0
7
RH (%)
Figure 19. Time series of the 15-min averaged temperature (top) and RH (bottom) as a function of local
summer time during August 2007 at SMEAR II. amount of rain was less than 4 mm; the only exceptions were 28 and 29 August with 8-9 mm. As to the temperature, the mean daily temperature rose from 13.4°C on 1
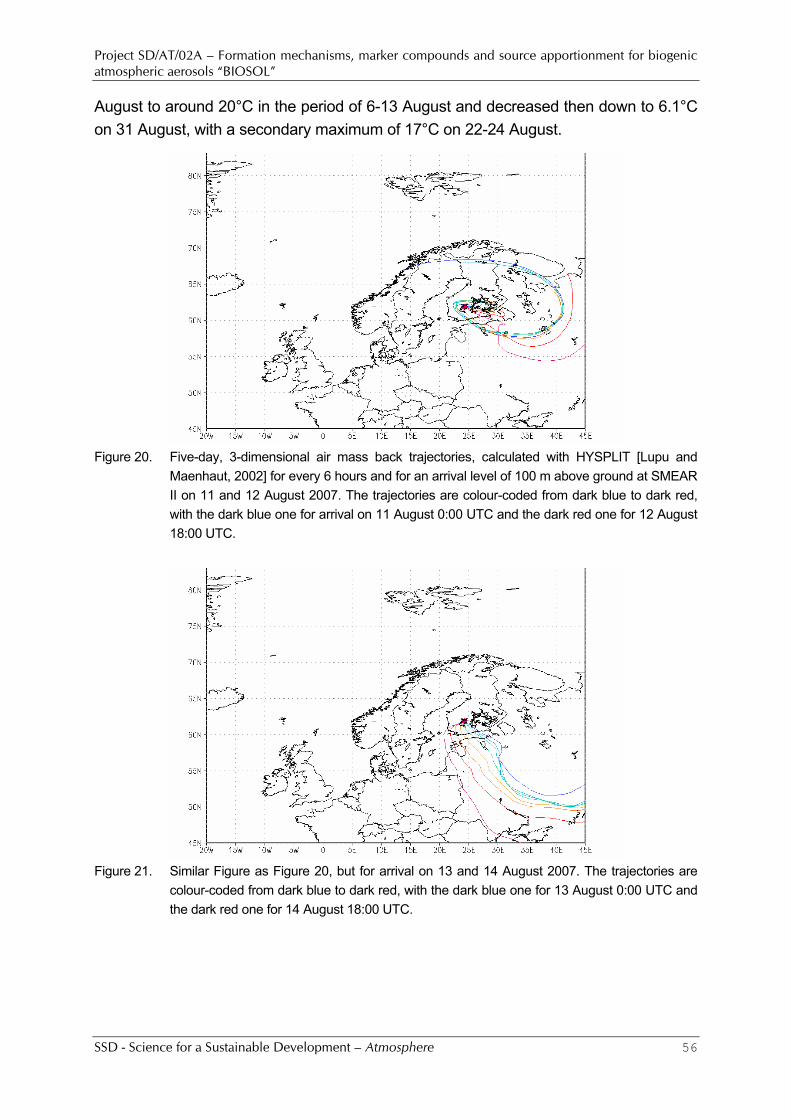
Project SD/AT/02A – Formation mechanisms, marker compounds and source apportionment for biogenic atmospheric aerosols “BIOSOL”
SSD - Science for a Sustainable Development – Atmosphere 56
August to around 20°C in the period of 6-13 August and decreased then down to 6.1°C on 31 August, with a secondary maximum of 17°C on 22-24 August.
Figure 20. Five-day, 3-dimensional air mass back trajectories, calculated with HYSPLIT [Lupu and
Maenhaut, 2002] for every 6 hours and for an arrival level of 100 m above ground at SMEAR II on 11 and 12 August 2007. The trajectories are colour-coded from dark blue to dark red, with the dark blue one for arrival on 11 August 0:00 UTC and the dark red one for 12 August 18:00 UTC.
Figure 21. Similar Figure as Figure 20, but for arrival on 13 and 14 August 2007. The trajectories are
colour-coded from dark blue to dark red, with the dark blue one for 13 August 0:00 UTC and the dark red one for 14 August 18:00 UTC.
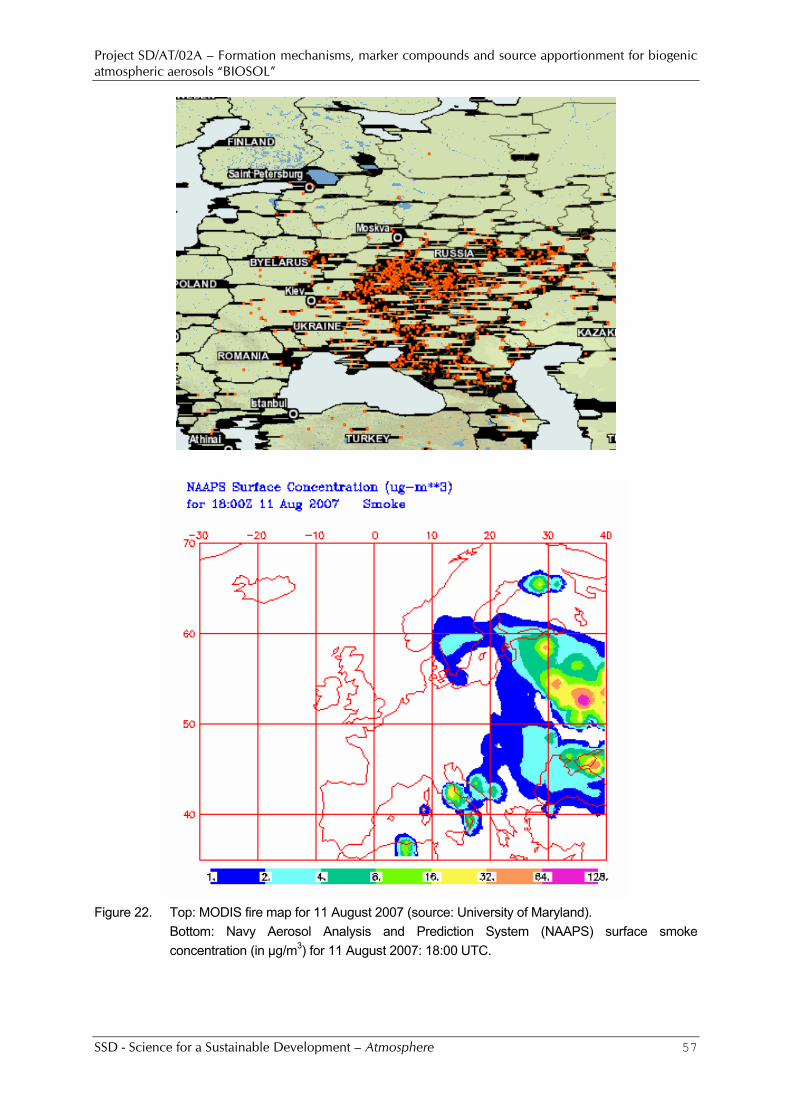
Project SD/AT/02A – Formation mechanisms, marker compounds and source apportionment for biogenic atmospheric aerosols “BIOSOL”
SSD - Science for a Sustainable Development – Atmosphere 57
Figure 22. Top: MODIS fire map for 11 August 2007 (source: University of Maryland). Bottom: Navy Aerosol Analysis and Prediction System (NAAPS) surface smoke
concentration (in µg/m3) for 11 August 2007: 18:00 UTC.
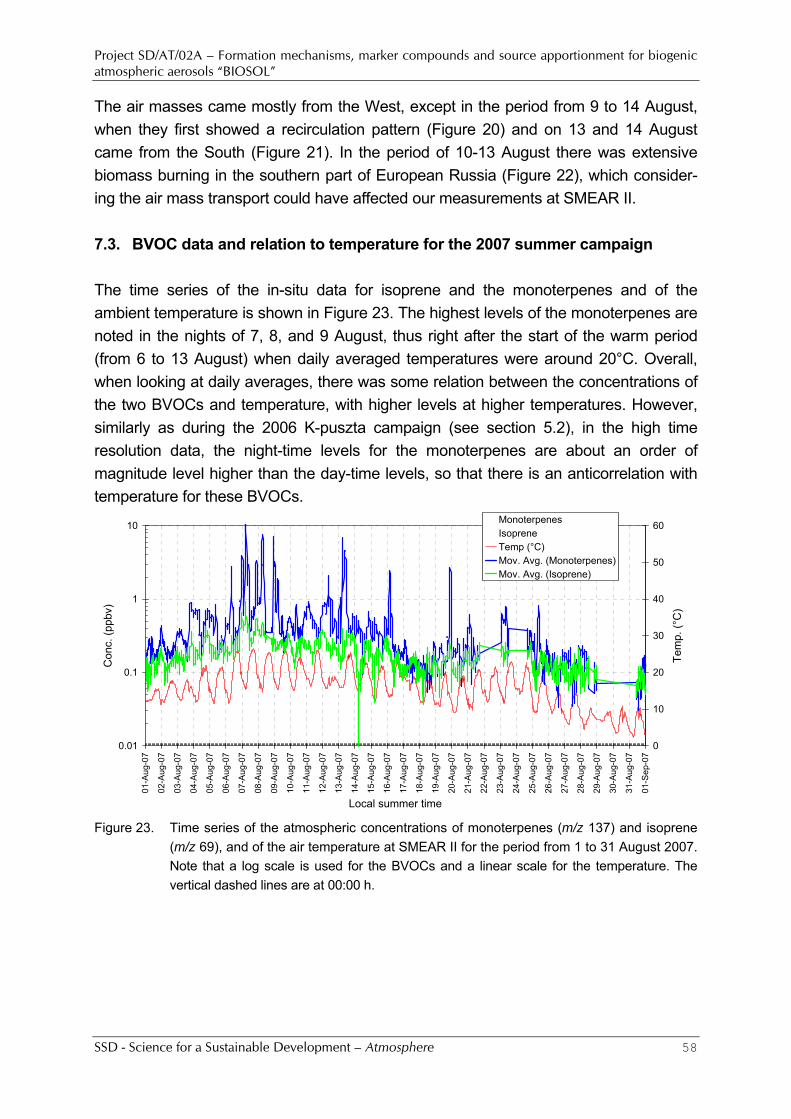
Project SD/AT/02A – Formation mechanisms, marker compounds and source apportionment for biogenic atmospheric aerosols “BIOSOL”
SSD - Science for a Sustainable Development – Atmosphere 58
The air masses came mostly from the West, except in the period from 9 to 14 August, when they first showed a recirculation pattern (Figure 20) and on 13 and 14 August came from the South (Figure 21). In the period of 10-13 August there was extensive biomass burning in the southern part of European Russia (Figure 22), which consider-ing the air mass transport could have affected our measurements at SMEAR II. 7.3. BVOC data and relation to temperature for the 2007 summer campaign The time series of the in-situ data for isoprene and the monoterpenes and of the ambient temperature is shown in Figure 23. The highest levels of the monoterpenes are noted in the nights of 7, 8, and 9 August, thus right after the start of the warm period (from 6 to 13 August) when daily averaged temperatures were around 20°C. Overall, when looking at daily averages, there was some relation between the concentrations of the two BVOCs and temperature, with higher levels at higher temperatures. However, similarly as during the 2006 K-puszta campaign (see section 5.2), in the high time resolution data, the night-time levels for the monoterpenes are about an order of magnitude level higher than the day-time levels, so that there is an anticorrelation with temperature for these BVOCs.
0.01
0.1
1
10
01-A
ug-0
7
02-A
ug-0
7
03-A
ug-0
7
04-A
ug-0
7
05-A
ug-0
7
06-A
ug-0
7
07-A
ug-0
7
08-A
ug-0
7
09-A
ug-0
7
10-A
ug-0
7
11-A
ug-0
7
12-A
ug-0
7
13-A
ug-0
7
14-A
ug-0
7
15-A
ug-0
7
16-A
ug-0
7
17-A
ug-0
7
18-A
ug-0
7
19-A
ug-0
7
20-A
ug-0
7
21-A
ug-0
7
22-A
ug-0
7
23-A
ug-0
7
24-A
ug-0
7
25-A
ug-0
7
26-A
ug-0
7
27-A
ug-0
7
28-A
ug-0
7
29-A
ug-0
7
30-A
ug-0
7
31-A
ug-0
7
01-S
ep-0
7
Local summer time
Con
c. (p
pbv)
0
10
20
30
40
50
60
Tem
p. (°
C)
MonoterpenesIsopreneTemp (°C)Mov. Avg. (Monoterpenes)Mov. Avg. (Isoprene)
Figure 23. Time series of the atmospheric concentrations of monoterpenes (m/z 137) and isoprene
(m/z 69), and of the air temperature at SMEAR II for the period from 1 to 31 August 2007. Note that a log scale is used for the BVOCs and a linear scale for the temperature. The vertical dashed lines are at 00:00 h.
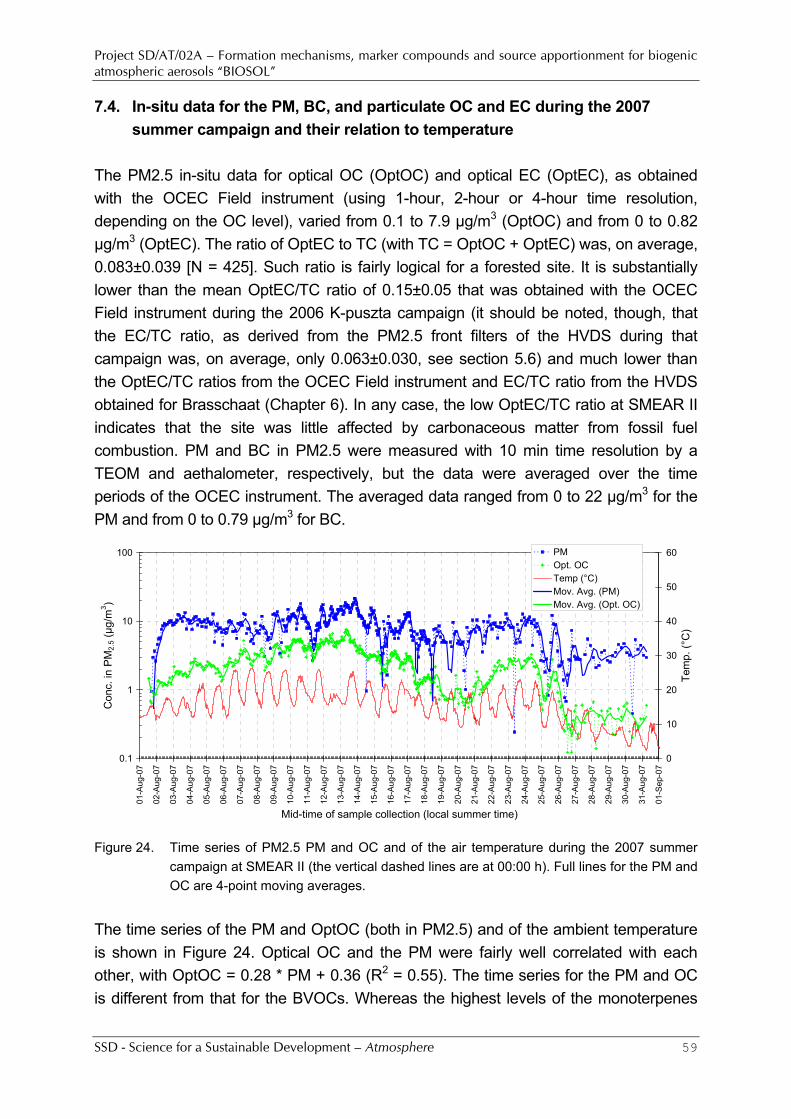
Project SD/AT/02A – Formation mechanisms, marker compounds and source apportionment for biogenic atmospheric aerosols “BIOSOL”
SSD - Science for a Sustainable Development – Atmosphere 59
7.4. In-situ data for the PM, BC, and particulate OC and EC during the 2007 summer campaign and their relation to temperature
The PM2.5 in-situ data for optical OC (OptOC) and optical EC (OptEC), as obtained with the OCEC Field instrument (using 1-hour, 2-hour or 4-hour time resolution, depending on the OC level), varied from 0.1 to 7.9 µg/m3 (OptOC) and from 0 to 0.82 µg/m3 (OptEC). The ratio of OptEC to TC (with TC = OptOC + OptEC) was, on average, 0.083±0.039 [N = 425]. Such ratio is fairly logical for a forested site. It is substantially lower than the mean OptEC/TC ratio of 0.15±0.05 that was obtained with the OCEC Field instrument during the 2006 K-puszta campaign (it should be noted, though, that the EC/TC ratio, as derived from the PM2.5 front filters of the HVDS during that campaign was, on average, only 0.063±0.030, see section 5.6) and much lower than the OptEC/TC ratios from the OCEC Field instrument and EC/TC ratio from the HVDS obtained for Brasschaat (Chapter 6). In any case, the low OptEC/TC ratio at SMEAR II indicates that the site was little affected by carbonaceous matter from fossil fuel combustion. PM and BC in PM2.5 were measured with 10 min time resolution by a TEOM and aethalometer, respectively, but the data were averaged over the time periods of the OCEC instrument. The averaged data ranged from 0 to 22 µg/m3 for the PM and from 0 to 0.79 µg/m3 for BC.
0.1
1
10
100
01-A
ug-0
7
02-A
ug-0
7
03-A
ug-0
7
04-A
ug-0
7
05-A
ug-0
7
06-A
ug-0
7
07-A
ug-0
7
08-A
ug-0
7
09-A
ug-0
7
10-A
ug-0
7
11-A
ug-0
7
12-A
ug-0
7
13-A
ug-0
7
14-A
ug-0
7
15-A
ug-0
7
16-A
ug-0
7
17-A
ug-0
7
18-A
ug-0
7
19-A
ug-0
7
20-A
ug-0
7
21-A
ug-0
7
22-A
ug-0
7
23-A
ug-0
7
24-A
ug-0
7
25-A
ug-0
7
26-A
ug-0
7
27-A
ug-0
7
28-A
ug-0
7
29-A
ug-0
7
30-A
ug-0
7
31-A
ug-0
7
01-S
ep-0
7
Mid-time of sample collection (local summer time)
Con
c. in
PM
2.5 (
µg/m
3 )
0
10
20
30
40
50
60
Tem
p. (°
C)
PMOpt. OCTemp (°C)Mov. Avg. (PM)Mov. Avg. (Opt. OC)
Figure 24. Time series of PM2.5 PM and OC and of the air temperature during the 2007 summer
campaign at SMEAR II (the vertical dashed lines are at 00:00 h). Full lines for the PM and OC are 4-point moving averages.
The time series of the PM and OptOC (both in PM2.5) and of the ambient temperature is shown in Figure 24. Optical OC and the PM were fairly well correlated with each other, with OptOC = 0.28 * PM + 0.36 (R2 = 0.55). The time series for the PM and OC is different from that for the BVOCs. Whereas the highest levels of the monoterpenes
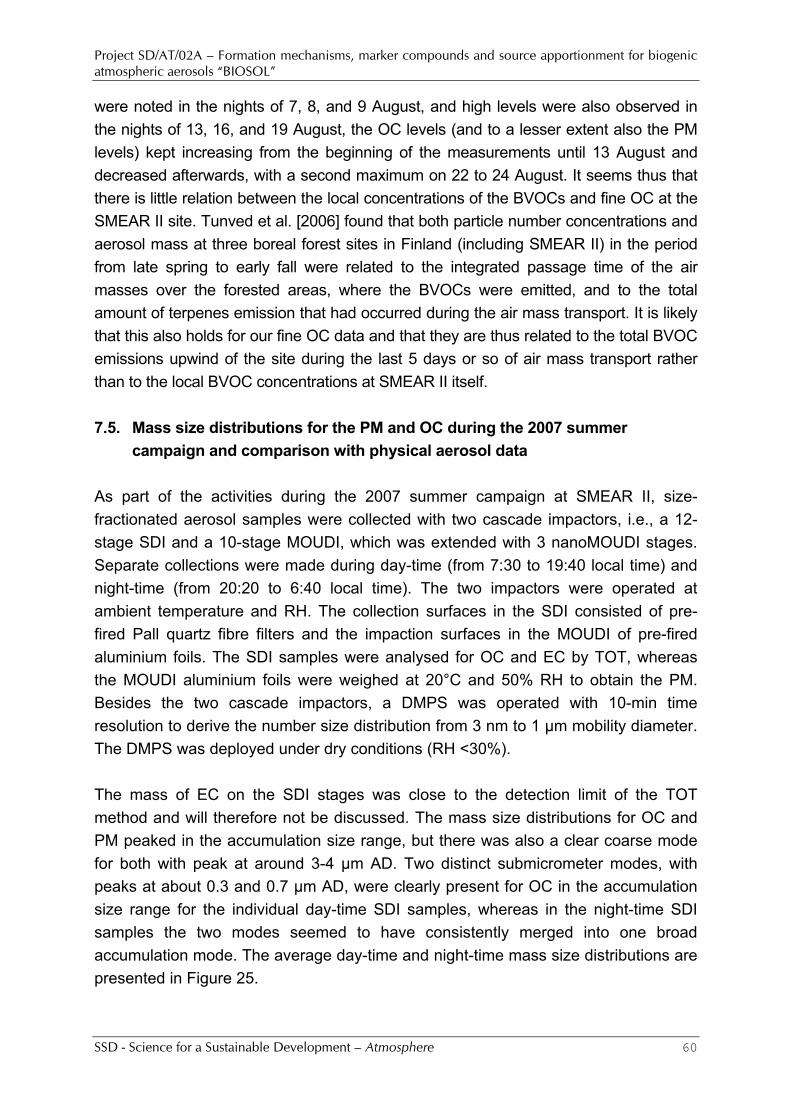
Project SD/AT/02A – Formation mechanisms, marker compounds and source apportionment for biogenic atmospheric aerosols “BIOSOL”
SSD - Science for a Sustainable Development – Atmosphere 60
were noted in the nights of 7, 8, and 9 August, and high levels were also observed in the nights of 13, 16, and 19 August, the OC levels (and to a lesser extent also the PM levels) kept increasing from the beginning of the measurements until 13 August and decreased afterwards, with a second maximum on 22 to 24 August. It seems thus that there is little relation between the local concentrations of the BVOCs and fine OC at the SMEAR II site. Tunved et al. [2006] found that both particle number concentrations and aerosol mass at three boreal forest sites in Finland (including SMEAR II) in the period from late spring to early fall were related to the integrated passage time of the air masses over the forested areas, where the BVOCs were emitted, and to the total amount of terpenes emission that had occurred during the air mass transport. It is likely that this also holds for our fine OC data and that they are thus related to the total BVOC emissions upwind of the site during the last 5 days or so of air mass transport rather than to the local BVOC concentrations at SMEAR II itself. 7.5. Mass size distributions for the PM and OC during the 2007 summer
campaign and comparison with physical aerosol data As part of the activities during the 2007 summer campaign at SMEAR II, size-fractionated aerosol samples were collected with two cascade impactors, i.e., a 12-stage SDI and a 10-stage MOUDI, which was extended with 3 nanoMOUDI stages. Separate collections were made during day-time (from 7:30 to 19:40 local time) and night-time (from 20:20 to 6:40 local time). The two impactors were operated at ambient temperature and RH. The collection surfaces in the SDI consisted of pre-fired Pall quartz fibre filters and the impaction surfaces in the MOUDI of pre-fired aluminium foils. The SDI samples were analysed for OC and EC by TOT, whereas the MOUDI aluminium foils were weighed at 20°C and 50% RH to obtain the PM. Besides the two cascade impactors, a DMPS was operated with 10-min time resolution to derive the number size distribution from 3 nm to 1 µm mobility diameter. The DMPS was deployed under dry conditions (RH <30%). The mass of EC on the SDI stages was close to the detection limit of the TOT method and will therefore not be discussed. The mass size distributions for OC and PM peaked in the accumulation size range, but there was also a clear coarse mode for both with peak at around 3-4 µm AD. Two distinct submicrometer modes, with peaks at about 0.3 and 0.7 µm AD, were clearly present for OC in the accumulation size range for the individual day-time SDI samples, whereas in the night-time SDI samples the two modes seemed to have consistently merged into one broad accumulation mode. The average day-time and night-time mass size distributions are presented in Figure 25.
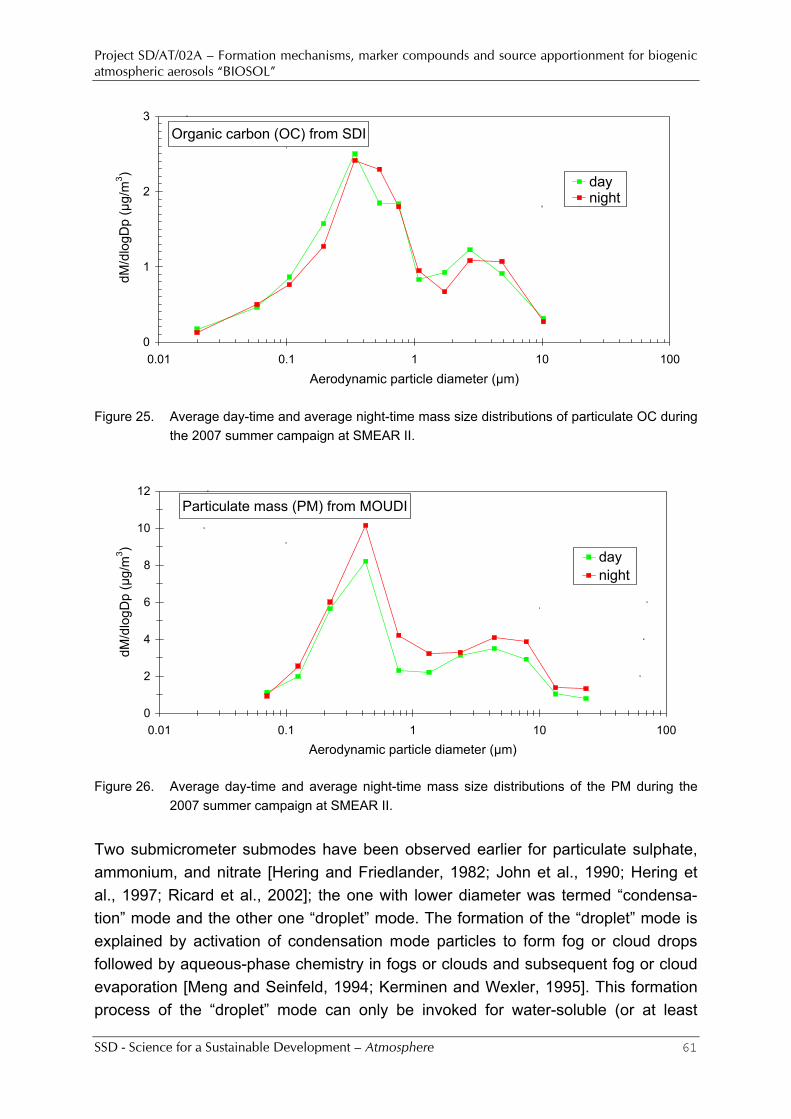
Project SD/AT/02A – Formation mechanisms, marker compounds and source apportionment for biogenic atmospheric aerosols “BIOSOL”
SSD - Science for a Sustainable Development – Atmosphere 61
Organic carbon (OC) from SDI
0
1
2
3
0.01 0.1 1 10 100Aerodynamic particle diameter (µm)
dM/d
logD
p (µ
g/m
3 )
daynight
Figure 25. Average day-time and average night-time mass size distributions of particulate OC during
the 2007 summer campaign at SMEAR II.
Particulate mass (PM) from MOUDI
0
2
4
6
8
10
12
0.01 0.1 1 10 100Aerodynamic particle diameter (µm)
dM/d
logD
p (µ
g/m
3 )
daynight
Figure 26. Average day-time and average night-time mass size distributions of the PM during the
2007 summer campaign at SMEAR II. Two submicrometer submodes have been observed earlier for particulate sulphate, ammonium, and nitrate [Hering and Friedlander, 1982; John et al., 1990; Hering et al., 1997; Ricard et al., 2002]; the one with lower diameter was termed “condensa-tion” mode and the other one “droplet” mode. The formation of the “droplet” mode is explained by activation of condensation mode particles to form fog or cloud drops followed by aqueous-phase chemistry in fogs or clouds and subsequent fog or cloud evaporation [Meng and Seinfeld, 1994; Kerminen and Wexler, 1995]. This formation process of the “droplet” mode can only be invoked for water-soluble (or at least
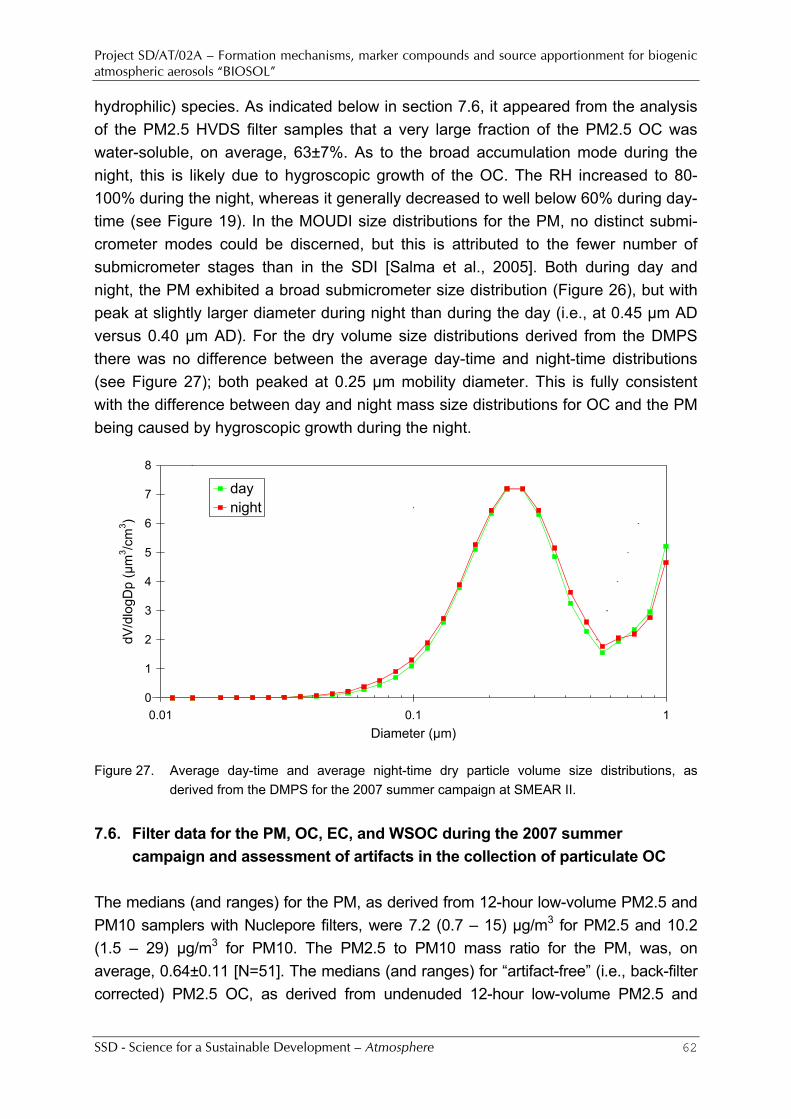
Project SD/AT/02A – Formation mechanisms, marker compounds and source apportionment for biogenic atmospheric aerosols “BIOSOL”
SSD - Science for a Sustainable Development – Atmosphere 62
hydrophilic) species. As indicated below in section 7.6, it appeared from the analysis of the PM2.5 HVDS filter samples that a very large fraction of the PM2.5 OC was water-soluble, on average, 63±7%. As to the broad accumulation mode during the night, this is likely due to hygroscopic growth of the OC. The RH increased to 80-100% during the night, whereas it generally decreased to well below 60% during day-time (see Figure 19). In the MOUDI size distributions for the PM, no distinct submi-crometer modes could be discerned, but this is attributed to the fewer number of submicrometer stages than in the SDI [Salma et al., 2005]. Both during day and night, the PM exhibited a broad submicrometer size distribution (Figure 26), but with peak at slightly larger diameter during night than during the day (i.e., at 0.45 µm AD versus 0.40 µm AD). For the dry volume size distributions derived from the DMPS there was no difference between the average day-time and night-time distributions (see Figure 27); both peaked at 0.25 µm mobility diameter. This is fully consistent with the difference between day and night mass size distributions for OC and the PM being caused by hygroscopic growth during the night.
0
1
2
3
4
5
6
7
8
0.01 0.1 1Diameter (µm)
dV/d
logD
p (µ
m3 /c
m3 )
daynight
Figure 27. Average day-time and average night-time dry particle volume size distributions, as
derived from the DMPS for the 2007 summer campaign at SMEAR II. 7.6. Filter data for the PM, OC, EC, and WSOC during the 2007 summer
campaign and assessment of artifacts in the collection of particulate OC The medians (and ranges) for the PM, as derived from 12-hour low-volume PM2.5 and PM10 samplers with Nuclepore filters, were 7.2 (0.7 – 15) µg/m3 for PM2.5 and 10.2 (1.5 – 29) µg/m3 for PM10. The PM2.5 to PM10 mass ratio for the PM, was, on average, 0.64±0.11 [N=51]. The medians (and ranges) for “artifact-free” (i.e., back-filter corrected) PM2.5 OC, as derived from undenuded 12-hour low-volume PM2.5 and
Project SD/AT/02A – Formation mechanisms, marker compounds and source apportionment for biogenic atmospheric aerosols “BIOSOL”
SSD - Science for a Sustainable Development – Atmosphere 63
PM10 samplers with tandem quartz fibre filters, were 2.8 (0 – 6.0) µg/m3 for PM2.5 and 3.4 (0 – 8.6) µg/m3 for PM10. The PM2.5 to PM10 mass ratio for OC, was, on average, 0.72±0.23 [N=50]. On the basis of the individual OC and PM data from the samplers just mentioned, average OC/PM ratios of 0.41±0.12 and of 0.37±0.10 were calculated for PM2.5 and PM10, respectively, indicating that the PM was dominated by organic aerosol. If we apply an OC-to-OM conversion factor of 1.8, as done for K-puszta (section 5.7), this would lead to a concentration of OM in the PM of 74% for PM2.5 and 67% for PM10. As far as artifacts for the particulate OC are concerned, the average ratios (OC on the back filter)/(OC on the front filter) for the undenuded 12-hour samples were 0.17±0.04 for the PM2.5 size fraction of the HVDS, and 0.09±0.08 and 0.11±0.09 for the low-volume PM2.5 and PM10 samplers. For the undenuded and denuded 24-hour low-volume PM2.5 filter samplers (F25UWW and F25DWW) the average ratios and associated standard deviations of (OC on the back filter)/(OC on the front filter) were 0.11±0.06 for F25UWW and 0.05±0.02 for F25DWW. All these ratios are fairly similar to those obtained for the 2006 summer campaign at K-puszta (see section 5.6), be it that there was a tendency for the undenuded samplers to exhibit slightly higher ratios in that campaign. From the data for F25UWW and F25DWW an average ratio (cor-rected OC from F25UWW)/(corrected OC from F25DWW) of 1.11±0.10 was obtained, indicating that like for the 2006 K-puszta campaign, the assumptions of Mader et al. [2003] were valid and that it was appropriate to calculate “artifact-free” particulate OC for the undenuded samplers as the difference between front filter OC and back filter OC. As indicated above in section 7.4, the average ratio of OptEC/TC in PM2.5, as obtained from the OCEC Field instrument, was 0.083±0.039. Like at K-puszta, from the filter samplers somewhat lower EC/TC ratios were obtained, be it that the difference was smaller now. For example, in the HVDS samples from the 2007 campaign at SMEAR II, the average ratios and associated standard deviations for EC/TC (using uncorrected OC data) were 0.060±0.020 for the fine front filters and 0.027±0.015 for the coarse front filters. The WSOC analyses of the HVDS samples indicated that most of the fine OC was water-soluble. Using uncorrected OC data, 63±7% [N=51] of the OC was WSOC for the fine front filters and 70±12% [N=51] for the fine back filters during the 2007 campaign. The corresponding percentages for the HVDS samples of the 2006 K-puszta campaign were 57±9% for the fine front filters and 73±12% for the fine back filters.
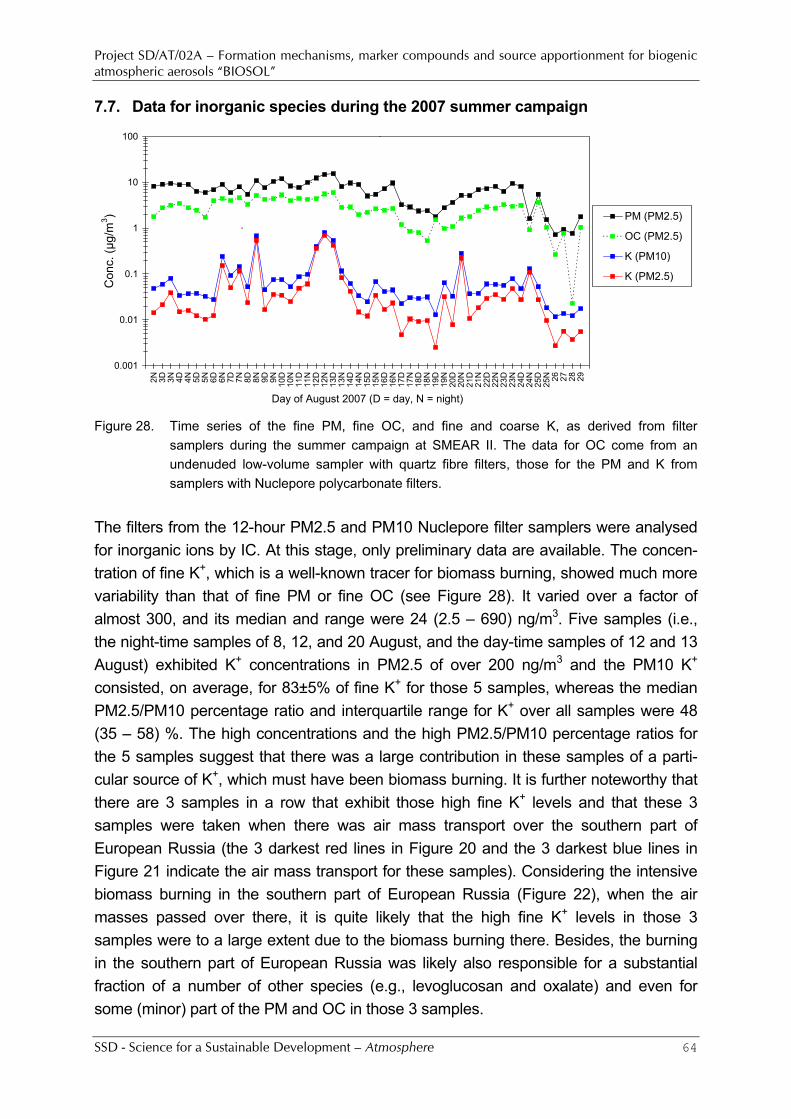
Project SD/AT/02A – Formation mechanisms, marker compounds and source apportionment for biogenic atmospheric aerosols “BIOSOL”
SSD - Science for a Sustainable Development – Atmosphere 64
7.7. Data for inorganic species during the 2007 summer campaign
0.001
0.01
0.1
1
10
100
2N 3D 3N 4D 4N 5D 5N 6D 6N 7D 7N 8D 8N 9D 9N 10D
10N
11D
11N
12D
12N
13D
13N
14D
14N
15D
15N
16D
16N
17D
17N
18D
18N
19D
19N
20D
20N
21D
21N
22D
22N
23D
23N
24D
24N
25D
25N 26 27 28 29
Day of August 2007 (D = day, N = night)
Con
c. (µ
g/m
3 ) PM (PM2.5)
OC (PM2.5)
K (PM10)
K (PM2.5)
Figure 28. Time series of the fine PM, fine OC, and fine and coarse K, as derived from filter
samplers during the summer campaign at SMEAR II. The data for OC come from an undenuded low-volume sampler with quartz fibre filters, those for the PM and K from samplers with Nuclepore polycarbonate filters.
The filters from the 12-hour PM2.5 and PM10 Nuclepore filter samplers were analysed for inorganic ions by IC. At this stage, only preliminary data are available. The concen-tration of fine K+, which is a well-known tracer for biomass burning, showed much more variability than that of fine PM or fine OC (see Figure 28). It varied over a factor of almost 300, and its median and range were 24 (2.5 – 690) ng/m3. Five samples (i.e., the night-time samples of 8, 12, and 20 August, and the day-time samples of 12 and 13 August) exhibited K+ concentrations in PM2.5 of over 200 ng/m3 and the PM10 K+ consisted, on average, for 83±5% of fine K+ for those 5 samples, whereas the median PM2.5/PM10 percentage ratio and interquartile range for K+ over all samples were 48 (35 – 58) %. The high concentrations and the high PM2.5/PM10 percentage ratios for the 5 samples suggest that there was a large contribution in these samples of a parti-cular source of K+, which must have been biomass burning. It is further noteworthy that there are 3 samples in a row that exhibit those high fine K+ levels and that these 3 samples were taken when there was air mass transport over the southern part of European Russia (the 3 darkest red lines in Figure 20 and the 3 darkest blue lines in Figure 21 indicate the air mass transport for these samples). Considering the intensive biomass burning in the southern part of European Russia (Figure 22), when the air masses passed over there, it is quite likely that the high fine K+ levels in those 3 samples were to a large extent due to the biomass burning there. Besides, the burning in the southern part of European Russia was likely also responsible for a substantial fraction of a number of other species (e.g., levoglucosan and oxalate) and even for some (minor) part of the PM and OC in those 3 samples.
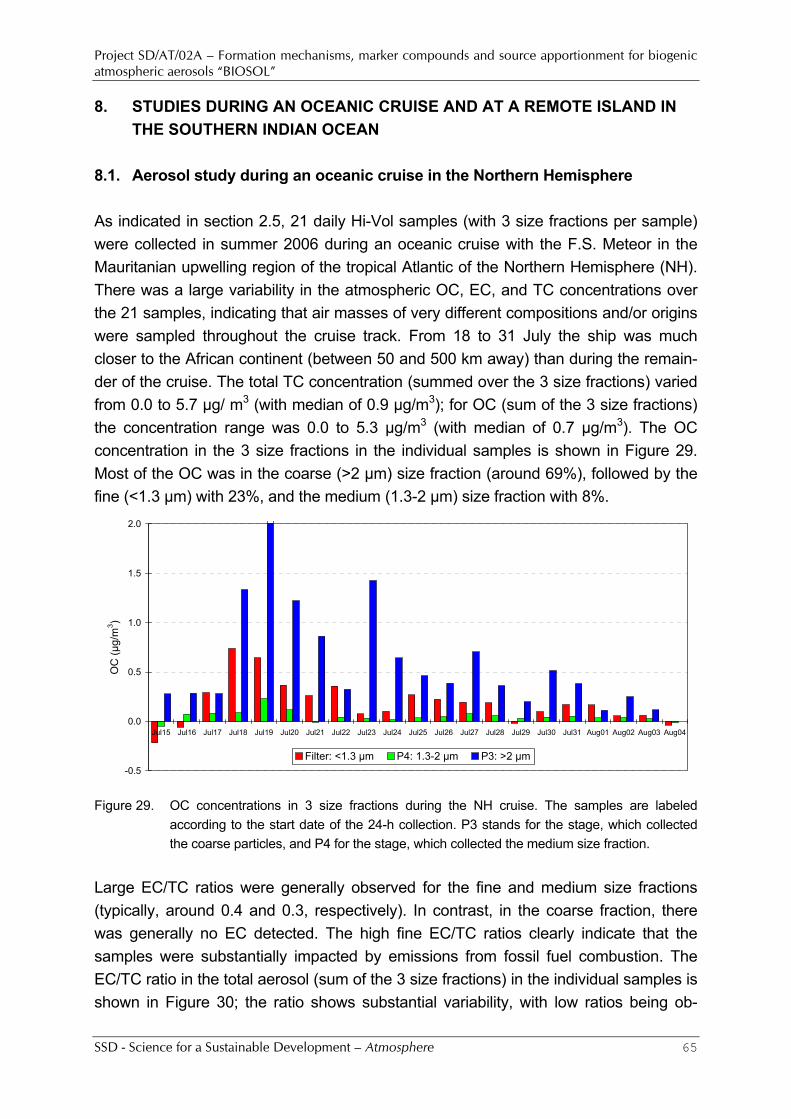
Project SD/AT/02A – Formation mechanisms, marker compounds and source apportionment for biogenic atmospheric aerosols “BIOSOL”
SSD - Science for a Sustainable Development – Atmosphere 65
8. STUDIES DURING AN OCEANIC CRUISE AND AT A REMOTE ISLAND IN THE SOUTHERN INDIAN OCEAN
8.1. Aerosol study during an oceanic cruise in the Northern Hemisphere As indicated in section 2.5, 21 daily Hi-Vol samples (with 3 size fractions per sample) were collected in summer 2006 during an oceanic cruise with the F.S. Meteor in the Mauritanian upwelling region of the tropical Atlantic of the Northern Hemisphere (NH). There was a large variability in the atmospheric OC, EC, and TC concentrations over the 21 samples, indicating that air masses of very different compositions and/or origins were sampled throughout the cruise track. From 18 to 31 July the ship was much closer to the African continent (between 50 and 500 km away) than during the remain-der of the cruise. The total TC concentration (summed over the 3 size fractions) varied from 0.0 to 5.7 µg/ m3 (with median of 0.9 µg/m3); for OC (sum of the 3 size fractions) the concentration range was 0.0 to 5.3 µg/m3 (with median of 0.7 µg/m3). The OC concentration in the 3 size fractions in the individual samples is shown in Figure 29. Most of the OC was in the coarse (>2 µm) size fraction (around 69%), followed by the fine (<1.3 µm) with 23%, and the medium (1.3-2 µm) size fraction with 8%.
-0.5
0.0
0.5
1.0
1.5
2.0
Jul15 Jul16 Jul17 Jul18 Jul19 Jul20 Jul21 Jul22 Jul23 Jul24 Jul25 Jul26 Jul27 Jul28 Jul29 Jul30 Jul31 Aug01 Aug02 Aug03 Aug04
OC
(µg/
m3 )
Filter: <1.3 µm P4: 1.3-2 µm P3: >2 µm
Figure 29. OC concentrations in 3 size fractions during the NH cruise. The samples are labeled
according to the start date of the 24-h collection. P3 stands for the stage, which collected the coarse particles, and P4 for the stage, which collected the medium size fraction.
Large EC/TC ratios were generally observed for the fine and medium size fractions (typically, around 0.4 and 0.3, respectively). In contrast, in the coarse fraction, there was generally no EC detected. The high fine EC/TC ratios clearly indicate that the samples were substantially impacted by emissions from fossil fuel combustion. The EC/TC ratio in the total aerosol (sum of the 3 size fractions) in the individual samples is shown in Figure 30; the ratio shows substantial variability, with low ratios being ob-
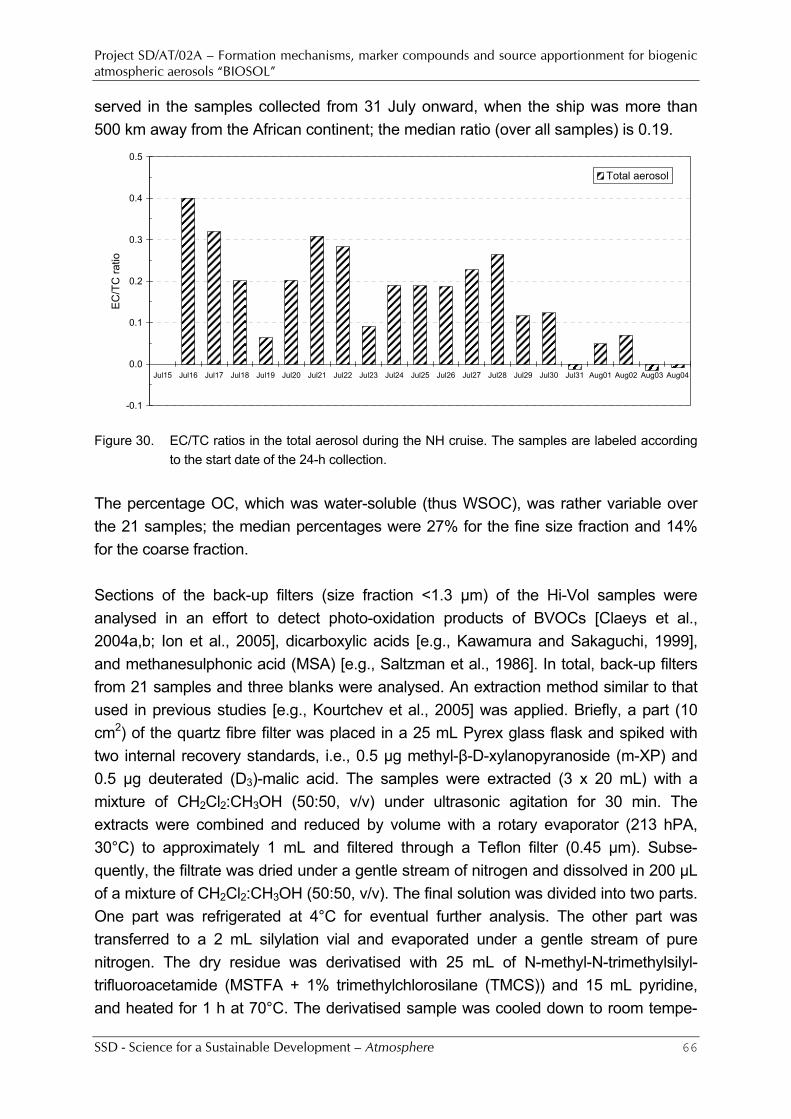
Project SD/AT/02A – Formation mechanisms, marker compounds and source apportionment for biogenic atmospheric aerosols “BIOSOL”
SSD - Science for a Sustainable Development – Atmosphere 66
served in the samples collected from 31 July onward, when the ship was more than 500 km away from the African continent; the median ratio (over all samples) is 0.19.
-0.1
0.0
0.1
0.2
0.3
0.4
0.5
Jul15 Jul16 Jul17 Jul18 Jul19 Jul20 Jul21 Jul22 Jul23 Jul24 Jul25 Jul26 Jul27 Jul28 Jul29 Jul30 Jul31 Aug01 Aug02 Aug03 Aug04
EC
/TC
ratio
Total aerosol
Figure 30. EC/TC ratios in the total aerosol during the NH cruise. The samples are labeled according
to the start date of the 24-h collection. The percentage OC, which was water-soluble (thus WSOC), was rather variable over the 21 samples; the median percentages were 27% for the fine size fraction and 14% for the coarse fraction. Sections of the back-up filters (size fraction <1.3 µm) of the Hi-Vol samples were analysed in an effort to detect photo-oxidation products of BVOCs [Claeys et al., 2004a,b; Ion et al., 2005], dicarboxylic acids [e.g., Kawamura and Sakaguchi, 1999], and methanesulphonic acid (MSA) [e.g., Saltzman et al., 1986]. In total, back-up filters from 21 samples and three blanks were analysed. An extraction method similar to that used in previous studies [e.g., Kourtchev et al., 2005] was applied. Briefly, a part (10 cm2) of the quartz fibre filter was placed in a 25 mL Pyrex glass flask and spiked with two internal recovery standards, i.e., 0.5 µg methyl-β-D-xylanopyranoside (m-XP) and 0.5 µg deuterated (D3)-malic acid. The samples were extracted (3 x 20 mL) with a mixture of CH2Cl2:CH3OH (50:50, v/v) under ultrasonic agitation for 30 min. The extracts were combined and reduced by volume with a rotary evaporator (213 hPA, 30°C) to approximately 1 mL and filtered through a Teflon filter (0.45 µm). Subse-quently, the filtrate was dried under a gentle stream of nitrogen and dissolved in 200 µL of a mixture of CH2Cl2:CH3OH (50:50, v/v). The final solution was divided into two parts. One part was refrigerated at 4°C for eventual further analysis. The other part was transferred to a 2 mL silylation vial and evaporated under a gentle stream of pure nitrogen. The dry residue was derivatised with 25 mL of N-methyl-N-trimethylsilyl-trifluoroacetamide (MSTFA + 1% trimethylchlorosilane (TMCS)) and 15 mL pyridine, and heated for 1 h at 70°C. The derivatised sample was cooled down to room tempe-
Project SD/AT/02A – Formation mechanisms, marker compounds and source apportionment for biogenic atmospheric aerosols “BIOSOL”
SSD - Science for a Sustainable Development – Atmosphere 67
rature and immediately analysed by GC/MS. For qualitative analysis the full scan (FS) mode was used in the mass range m/z 50-650, while for quantitative analysis the instrument was operated in the selected ion monitoring (SIM) mode. Base ion frag-ments occurring at m/z 204 and 217 were used for monitoring m-XP and levoglucosan; m/z 219 and 277 for 2-methyltetrols; m/z 231 for C5-alkene triols; m/z 233 and 307 for malic acid; m/z 236 and 310 for (D3)-malic acid; m/z 171 and 315 for pinic acid; m/z 349 for 3-hydroxyglutaric acid; m/z 405 for 3-methyl-1,2,3-butanetricarboxylic acid and m/z 217 and 319 for arabitol and mannitol. The GC/MS analysis results in both the FS and SIM modes did not reveal the presence of the targeted polar organic compounds in the analysed samples. An attempt was made to detect water-soluble dicarboxylic acids using a procedure described in previous studies [Kawamura, 1993; Kawamura and Ikushima, 1993]. Briefly, a part (10 cm2) of five selected back-up filters with the highest OC loadings was cut in small pieces and spiked with an internal recovery standard, i.e., 0.5 µg deuterated (D3)-malic acid. The filters were subsequently extracted with organic-free water (3 x 10 mL), which was prepared by oxidising the organic impurities in Milli-Q water with UV light. The extracts (water-soluble organics) were passed through a Teflon filter (0.45 µm) to remove filter debris and then concentrated to 100 μL using a rotary evaporator. The residue was further dried under a nitrogen stream and reacted with 14% BF3/n-butanol at 100°C in order to convert carboxyl groups to n-butyl esters and aldehyde groups to di-n-butoxy acetals. The derivatives were extracted with n-hexane after adding pure water and then analysed with GC/MS in the EI mode and using the FS mode in the mass range m/z 50-650. As in the analyses described above, no evidence could be obtained for the presence of dicarboxylic acids in the filter samples. This is in contrast to previous studies conducted in marine environ-ments, e.g., over the Pacific Ocean [Kawamura and Sakaguchi, 1999], where dicarboxylic acids were found at relatively large concentrations contributing up to 13% to the total aerosol carbon. The discrepancy with our study could be explained by the rather low loading of the filters for the NH cruise. While in the Pacific Ocean study [Kawamura and Sakaguchi, 1999] the air volume, aerosol deposit area, and area used for an extraction were 4300 m3, 500 cm2, and 60 cm2, respectively, these values were much lower in the present study, and were 1300 m3, 330 cm2, and 10 cm2, respectively.
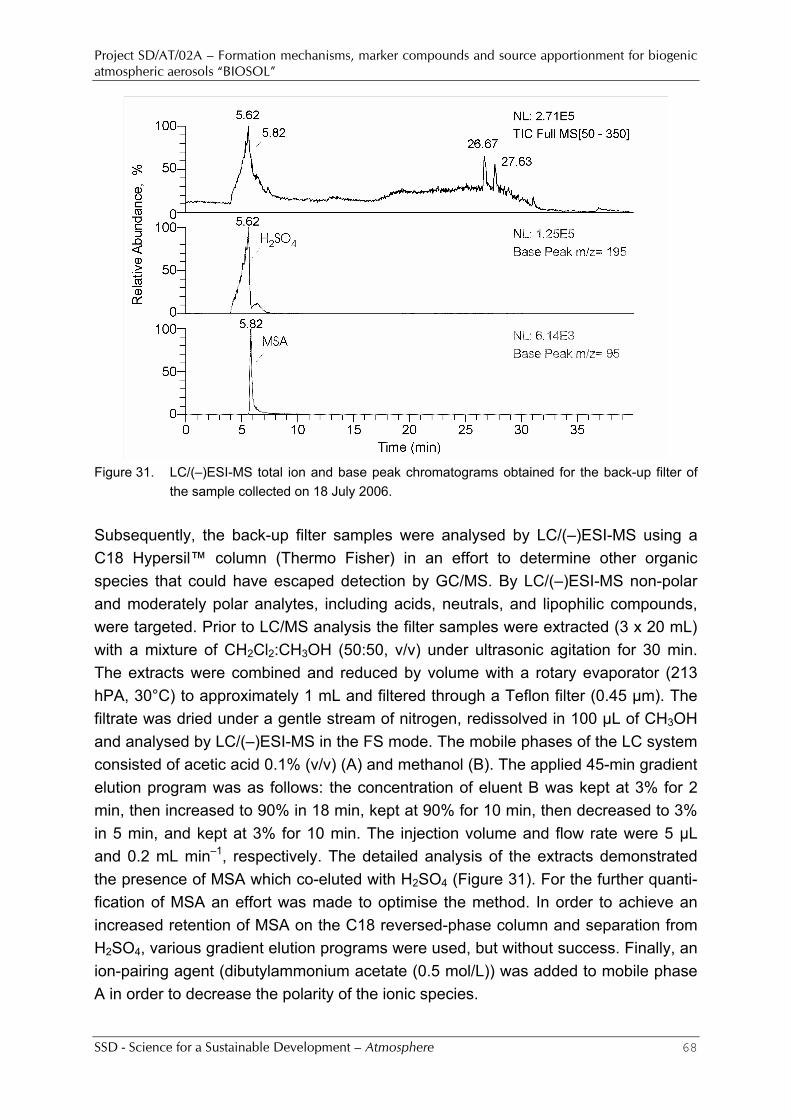
Project SD/AT/02A – Formation mechanisms, marker compounds and source apportionment for biogenic atmospheric aerosols “BIOSOL”
SSD - Science for a Sustainable Development – Atmosphere 68
Figure 31. LC/(–)ESI-MS total ion and base peak chromatograms obtained for the back-up filter of
the sample collected on 18 July 2006. Subsequently, the back-up filter samples were analysed by LC/(–)ESI-MS using a C18 Hypersil™ column (Thermo Fisher) in an effort to determine other organic species that could have escaped detection by GC/MS. By LC/(–)ESI-MS non-polar and moderately polar analytes, including acids, neutrals, and lipophilic compounds, were targeted. Prior to LC/MS analysis the filter samples were extracted (3 x 20 mL) with a mixture of CH2Cl2:CH3OH (50:50, v/v) under ultrasonic agitation for 30 min. The extracts were combined and reduced by volume with a rotary evaporator (213 hPA, 30°C) to approximately 1 mL and filtered through a Teflon filter (0.45 µm). The filtrate was dried under a gentle stream of nitrogen, redissolved in 100 µL of CH3OH and analysed by LC/(–)ESI-MS in the FS mode. The mobile phases of the LC system consisted of acetic acid 0.1% (v/v) (A) and methanol (B). The applied 45-min gradient elution program was as follows: the concentration of eluent B was kept at 3% for 2 min, then increased to 90% in 18 min, kept at 90% for 10 min, then decreased to 3% in 5 min, and kept at 3% for 10 min. The injection volume and flow rate were 5 μL and 0.2 mL min–1, respectively. The detailed analysis of the extracts demonstrated the presence of MSA which co-eluted with H2SO4 (Figure 31). For the further quanti-fication of MSA an effort was made to optimise the method. In order to achieve an increased retention of MSA on the C18 reversed-phase column and separation from H2SO4, various gradient elution programs were used, but without success. Finally, an ion-pairing agent (dibutylammonium acetate (0.5 mol/L)) was added to mobile phase A in order to decrease the polarity of the ionic species.
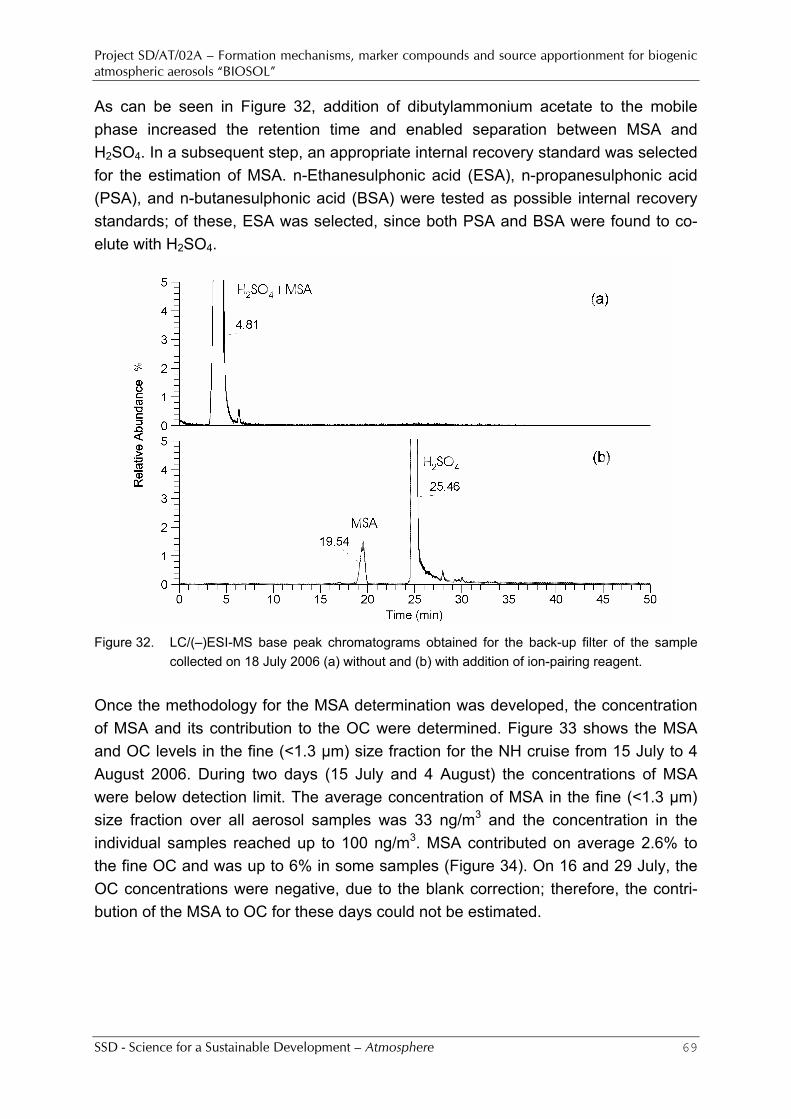
Project SD/AT/02A – Formation mechanisms, marker compounds and source apportionment for biogenic atmospheric aerosols “BIOSOL”
SSD - Science for a Sustainable Development – Atmosphere 69
As can be seen in Figure 32, addition of dibutylammonium acetate to the mobile phase increased the retention time and enabled separation between MSA and H2SO4. In a subsequent step, an appropriate internal recovery standard was selected for the estimation of MSA. n-Ethanesulphonic acid (ESA), n-propanesulphonic acid (PSA), and n-butanesulphonic acid (BSA) were tested as possible internal recovery standards; of these, ESA was selected, since both PSA and BSA were found to co-elute with H2SO4.
Figure 32. LC/(–)ESI-MS base peak chromatograms obtained for the back-up filter of the sample
collected on 18 July 2006 (a) without and (b) with addition of ion-pairing reagent. Once the methodology for the MSA determination was developed, the concentration of MSA and its contribution to the OC were determined. Figure 33 shows the MSA and OC levels in the fine (<1.3 µm) size fraction for the NH cruise from 15 July to 4 August 2006. During two days (15 July and 4 August) the concentrations of MSA were below detection limit. The average concentration of MSA in the fine (<1.3 µm) size fraction over all aerosol samples was 33 ng/m3 and the concentration in the individual samples reached up to 100 ng/m3. MSA contributed on average 2.6% to the fine OC and was up to 6% in some samples (Figure 34). On 16 and 29 July, the OC concentrations were negative, due to the blank correction; therefore, the contri-bution of the MSA to OC for these days could not be estimated.
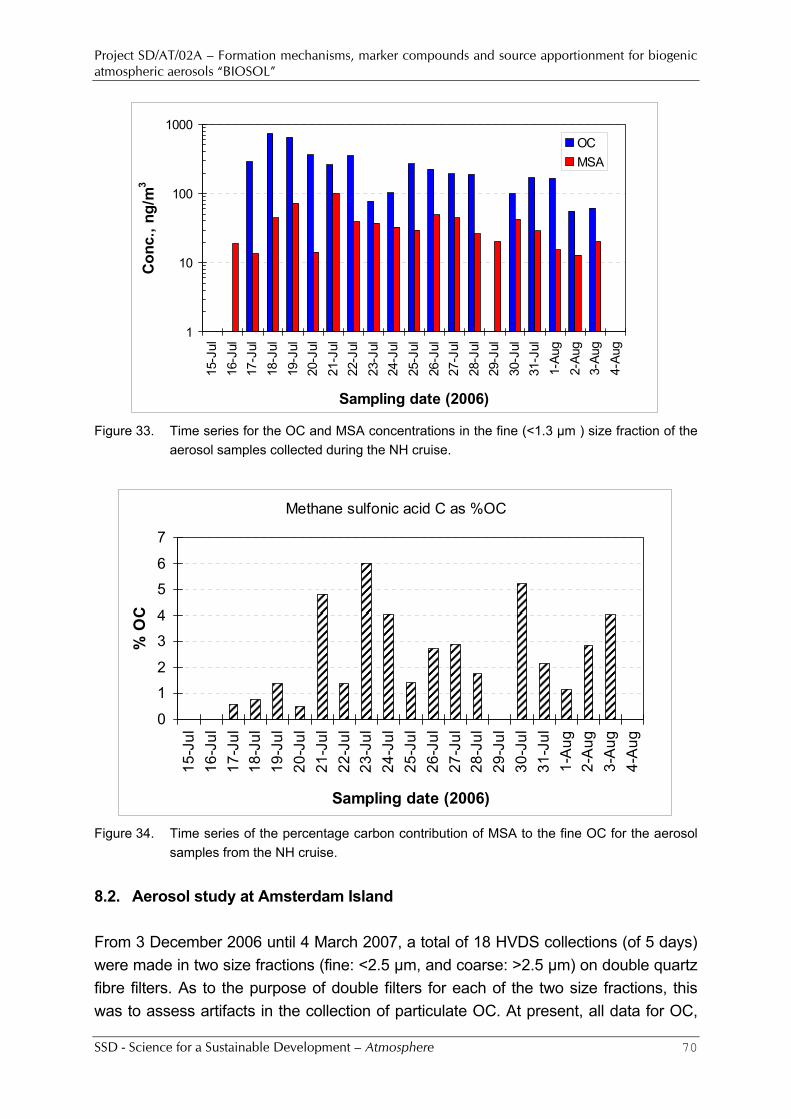
Project SD/AT/02A – Formation mechanisms, marker compounds and source apportionment for biogenic atmospheric aerosols “BIOSOL”
SSD - Science for a Sustainable Development – Atmosphere 70
1
10
100
1000
15-J
ul16
-Jul
17-J
ul18
-Jul
19-J
ul20
-Jul
21-J
ul22
-Jul
23-J
ul24
-Jul
25-J
ul26
-Jul
27-J
ul28
-Jul
29-J
ul30
-Jul
31-J
ul1-
Aug
2-Au
g3-
Aug
4-Au
g
Sampling date (2006)
Con
c., n
g/m
3OCMSA
Figure 33. Time series for the OC and MSA concentrations in the fine (<1.3 µm ) size fraction of the
aerosol samples collected during the NH cruise.
Methane sulfonic acid C as %OC
0
1
2
3
4
5
6
7
15-J
ul16
-Jul
17-J
ul18
-Jul
19-J
ul20
-Jul
21-J
ul22
-Jul
23-J
ul24
-Jul
25-J
ul26
-Jul
27-J
ul28
-Jul
29-J
ul30
-Jul
31-J
ul1-
Aug
2-A
ug3-
Aug
4-A
ug
Sampling date (2006)
% O
C
Figure 34. Time series of the percentage carbon contribution of MSA to the fine OC for the aerosol
samples from the NH cruise. 8.2. Aerosol study at Amsterdam Island From 3 December 2006 until 4 March 2007, a total of 18 HVDS collections (of 5 days) were made in two size fractions (fine: <2.5 µm, and coarse: >2.5 µm) on double quartz fibre filters. As to the purpose of double filters for each of the two size fractions, this was to assess artifacts in the collection of particulate OC. At present, all data for OC,
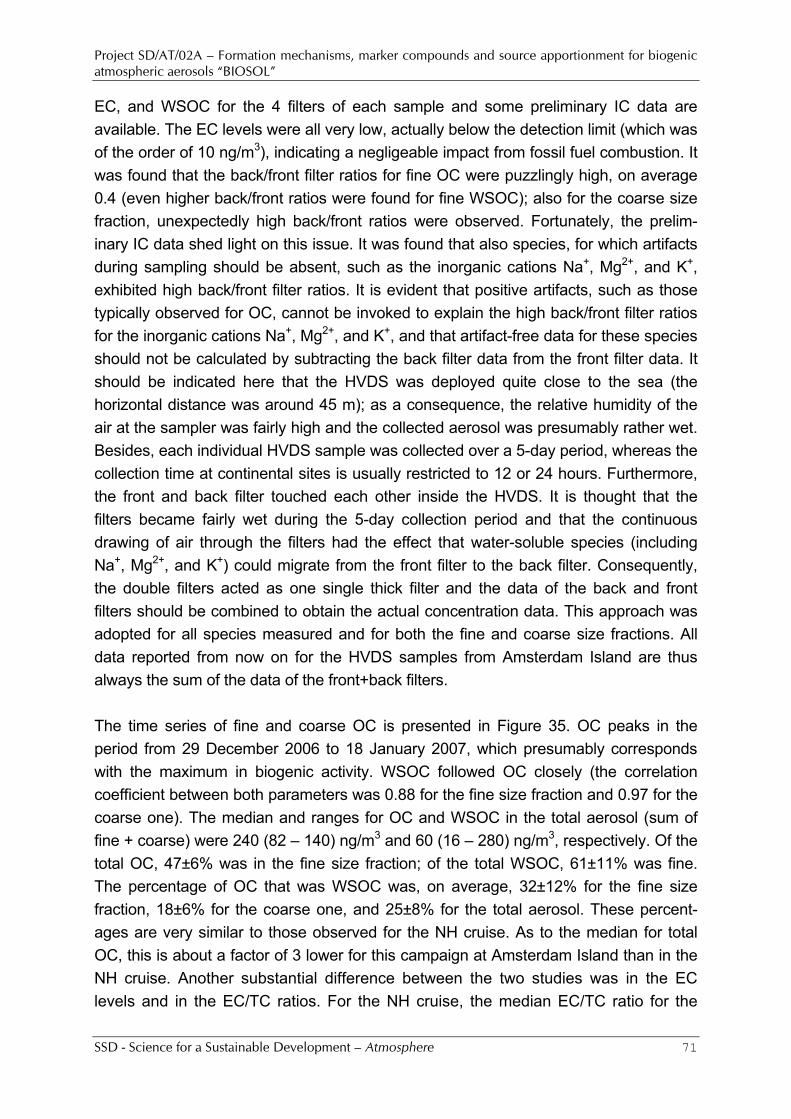
Project SD/AT/02A – Formation mechanisms, marker compounds and source apportionment for biogenic atmospheric aerosols “BIOSOL”
SSD - Science for a Sustainable Development – Atmosphere 71
EC, and WSOC for the 4 filters of each sample and some preliminary IC data are available. The EC levels were all very low, actually below the detection limit (which was of the order of 10 ng/m3), indicating a negligeable impact from fossil fuel combustion. It was found that the back/front filter ratios for fine OC were puzzlingly high, on average 0.4 (even higher back/front ratios were found for fine WSOC); also for the coarse size fraction, unexpectedly high back/front ratios were observed. Fortunately, the prelim-inary IC data shed light on this issue. It was found that also species, for which artifacts during sampling should be absent, such as the inorganic cations Na+, Mg2+, and K+, exhibited high back/front filter ratios. It is evident that positive artifacts, such as those typically observed for OC, cannot be invoked to explain the high back/front filter ratios for the inorganic cations Na+, Mg2+, and K+, and that artifact-free data for these species should not be calculated by subtracting the back filter data from the front filter data. It should be indicated here that the HVDS was deployed quite close to the sea (the horizontal distance was around 45 m); as a consequence, the relative humidity of the air at the sampler was fairly high and the collected aerosol was presumably rather wet. Besides, each individual HVDS sample was collected over a 5-day period, whereas the collection time at continental sites is usually restricted to 12 or 24 hours. Furthermore, the front and back filter touched each other inside the HVDS. It is thought that the filters became fairly wet during the 5-day collection period and that the continuous drawing of air through the filters had the effect that water-soluble species (including Na+, Mg2+, and K+) could migrate from the front filter to the back filter. Consequently, the double filters acted as one single thick filter and the data of the back and front filters should be combined to obtain the actual concentration data. This approach was adopted for all species measured and for both the fine and coarse size fractions. All data reported from now on for the HVDS samples from Amsterdam Island are thus always the sum of the data of the front+back filters. The time series of fine and coarse OC is presented in Figure 35. OC peaks in the period from 29 December 2006 to 18 January 2007, which presumably corresponds with the maximum in biogenic activity. WSOC followed OC closely (the correlation coefficient between both parameters was 0.88 for the fine size fraction and 0.97 for the coarse one). The median and ranges for OC and WSOC in the total aerosol (sum of fine + coarse) were 240 (82 – 140) ng/m3 and 60 (16 – 280) ng/m3, respectively. Of the total OC, 47±6% was in the fine size fraction; of the total WSOC, 61±11% was fine. The percentage of OC that was WSOC was, on average, 32±12% for the fine size fraction, 18±6% for the coarse one, and 25±8% for the total aerosol. These percent-ages are very similar to those observed for the NH cruise. As to the median for total OC, this is about a factor of 3 lower for this campaign at Amsterdam Island than in the NH cruise. Another substantial difference between the two studies was in the EC levels and in the EC/TC ratios. For the NH cruise, the median EC/TC ratio for the
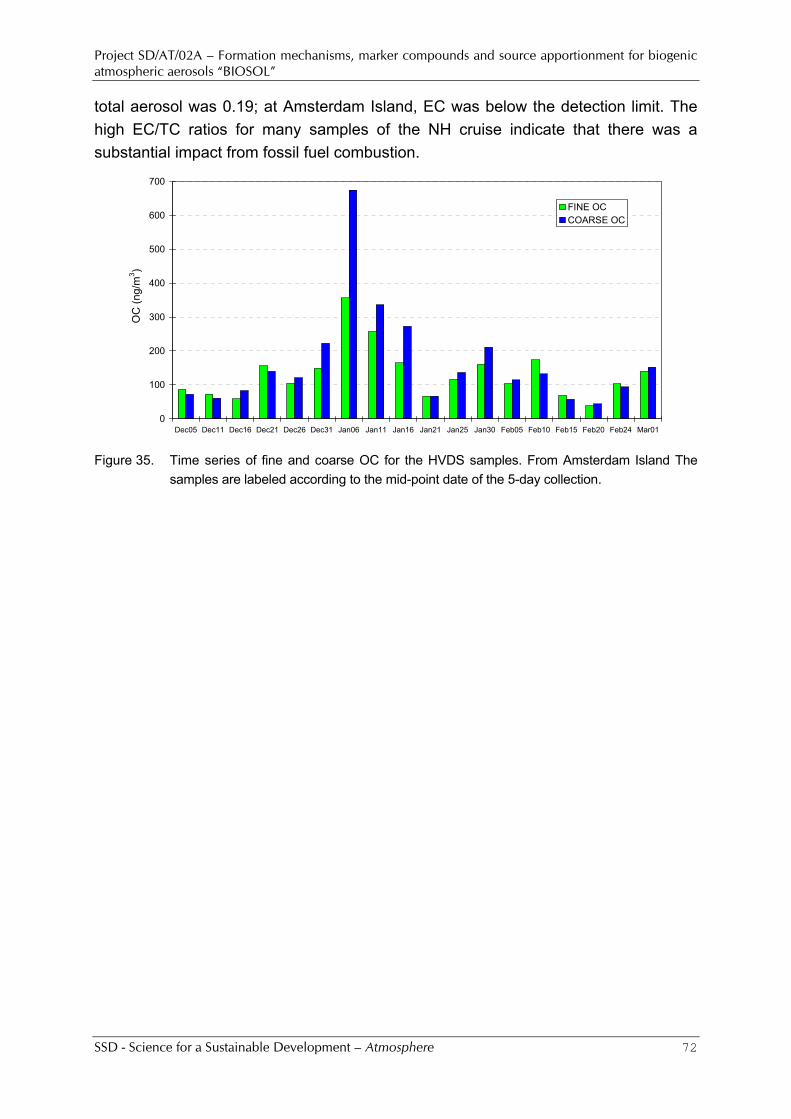
Project SD/AT/02A – Formation mechanisms, marker compounds and source apportionment for biogenic atmospheric aerosols “BIOSOL”
SSD - Science for a Sustainable Development – Atmosphere 72
total aerosol was 0.19; at Amsterdam Island, EC was below the detection limit. The high EC/TC ratios for many samples of the NH cruise indicate that there was a substantial impact from fossil fuel combustion.
0
100
200
300
400
500
600
700
Dec05 Dec11 Dec16 Dec21 Dec26 Dec31 Jan06 Jan11 Jan16 Jan21 Jan25 Jan30 Feb05 Feb10 Feb15 Feb20 Feb24 Mar01
OC
(ng/
m3 )
FINE OCCOARSE OC
Figure 35. Time series of fine and coarse OC for the HVDS samples. From Amsterdam Island The
samples are labeled according to the mid-point date of the 5-day collection.
Project SD/AT/02A – Formation mechanisms, marker compounds and source apportionment for biogenic atmospheric aerosols “BIOSOL”
SSD - Science for a Sustainable Development – Atmosphere 73
9. MODELLING OF THE FORMATION AND GROWTH OF THE FINE PARTICLES AND OF THE FINE BIOGENIC ATMOSPHERIC AEROSOL
This work is carried out by BIOSOL partner P4, but experimental data input is provided by all partners. P4 performed preparatory work to apply the UHMA model to the data sets from K-puszta (Chapter 5) and Hyytiälä (Chapter 7). The basic idea is to look at the connection between different vapours and aerosol production and to see how different hypotheses are able to explain particle formation and growth. This has been explained, e.g., by Kulmala et al. [2006] and Sihto et al. [2006]. If we look at the formation rate of 1 nm particles, J1 is the particle formation rate at 1 nm, corresponding to the size region at which the atmospheric nucleation is generally assumed to take place. In particular, the values nJ1 = 1 or nJ1 = 2 in the correlation
between J1 and [ ] 142SOH Jn would imply the activation of pre-existing clusters (nJ1 = 1)
or kinetic nucleation of sulphuric acid (nJ1 = 2) to be the dominating mechanisms for atmospheric new particle formation, as proposed by Kulmala et al. [2006]. In these cases the new particle formation rate (i.e., the atmospheric nucleation rate) can be simply written as:
[ ]421 SOHAJ = or
[ ]2421 SOHKJ =
where A and K are now coefficients containing the details of the nucleation pro-cesses. According to Sihto et al. [2006], these nucleation mechanisms seem to be the best candidates for the atmospheric nucleation observed in Hyytiälä. Exponents larger than 2, on the other hand, may indicate that the atmospheric nucleation is thermodynamically limited.
Project SD/AT/02A – Formation mechanisms, marker compounds and source apportionment for biogenic atmospheric aerosols “BIOSOL”
SSD - Science for a Sustainable Development – Atmosphere 74
10. PARTICULATE-PHASE OXIDATION PRODUCTS OF ISOPRENE (AND OTHER BVOCS), WHICH CAN BE USED AS INDICATOR COMPOUNDS FOR SOURCE APPORTIONMENT
The studies mentioned in Chapter 3 also relate to this task. In addition, studies were performed aimed at the characterisation of particulate-phase oxidation products of isoprene, α-pinene, and unsaturated fatty acids that are present in significant concen-trations in ambient fine aerosol and can serve as SOA marker compounds. In close collaboration with US EPA, P2 conducted studies to structurally characterise major particulate-phase oxidation products of α-pinene that occur at significant concentrations in ambient fine aerosol. It has been firmly established that cis-pinic, cis-norpinic, and cis-pinonic acid are major products formed from α-pinene by reaction with O3. However, several ambient aerosol studies have shown that the atmospheric concentrations of major α-pinene SOA products (i.e., cis-pinic and cis-pinonic acid) are rather low during summer episodes, while evidence was obtained that highly oxygenated products are formed that could also be generated by irradi-ating α-pinene in the presence of NOx through reactions that involve O3 and OH radicals. Using GC/MS with prior derivatisation to volatile derivatives and LC/(–)ESI-MS, detailed interpretation of the MS data, and synthesis of reference compounds, the structures of two major α-pinene SOA marker compounds with MWs of 148 and 204 were firmly established as 3-hydroxyglutaric acid and 3-methyl-1,2,3-butanetri-carboxylic acid (MBTCA), respectively. The proposed formation mechanism for MBTCA is given in Scheme 3. It involves participation of the OH radical, but it cannot be ruled out that ozone is also involved. With the pathway of Scheme 3 it is possible to explain the smog chamber observations reported by Claeys et al. [2007], which suggested that the MW 204 compound was formed at the expense of cis-pinic acid. The observations can be explained with cis-pinonic acid following two routes; namely, a short one leading to cis-pinic acid, and a longer one, leading to MBTCA. The formation of MBTCA likely takes place in the particle phase, but further work is required to confirm this hypothesis and obtain insights into the reaction mechanism. More details on this work are given in Claeys et al. [2007] and Szmigielski et al. [2007b].
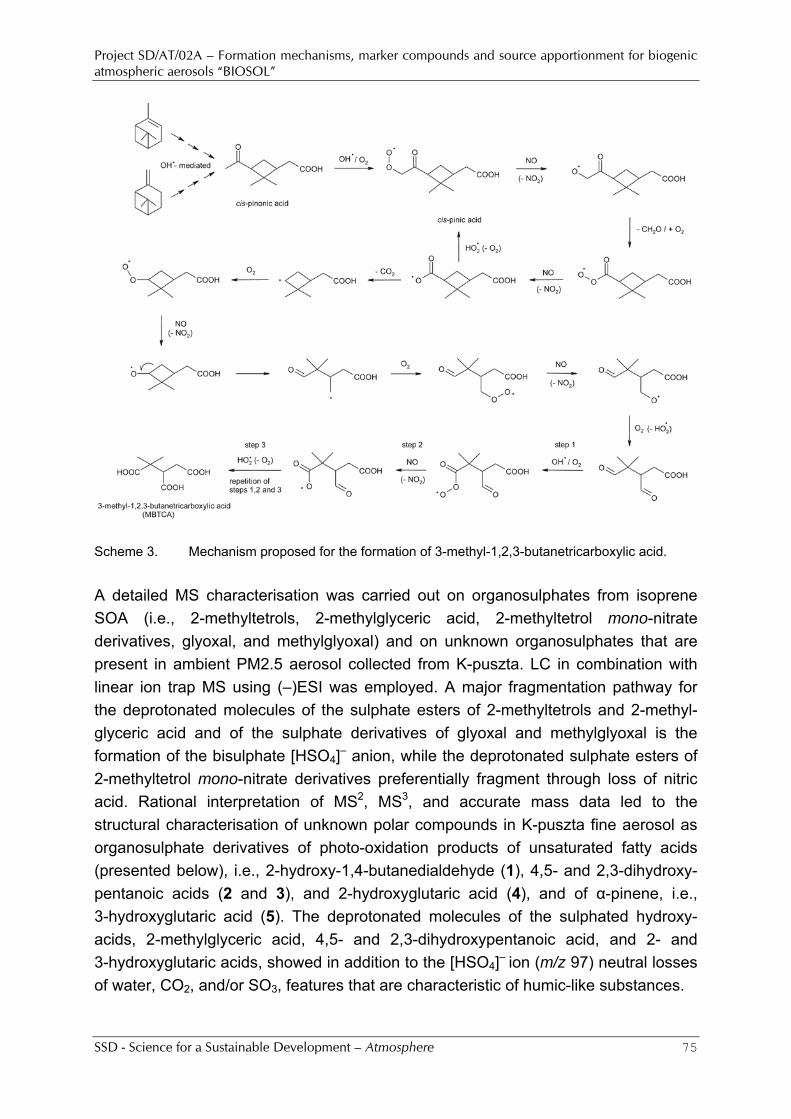
Project SD/AT/02A – Formation mechanisms, marker compounds and source apportionment for biogenic atmospheric aerosols “BIOSOL”
SSD - Science for a Sustainable Development – Atmosphere 75
Scheme 3. Mechanism proposed for the formation of 3-methyl-1,2,3-butanetricarboxylic acid. A detailed MS characterisation was carried out on organosulphates from isoprene SOA (i.e., 2-methyltetrols, 2-methylglyceric acid, 2-methyltetrol mono-nitrate derivatives, glyoxal, and methylglyoxal) and on unknown organosulphates that are present in ambient PM2.5 aerosol collected from K-puszta. LC in combination with linear ion trap MS using (–)ESI was employed. A major fragmentation pathway for the deprotonated molecules of the sulphate esters of 2-methyltetrols and 2-methyl-glyceric acid and of the sulphate derivatives of glyoxal and methylglyoxal is the formation of the bisulphate [HSO4]– anion, while the deprotonated sulphate esters of 2-methyltetrol mono-nitrate derivatives preferentially fragment through loss of nitric acid. Rational interpretation of MS2, MS3, and accurate mass data led to the structural characterisation of unknown polar compounds in K-puszta fine aerosol as organosulphate derivatives of photo-oxidation products of unsaturated fatty acids (presented below), i.e., 2-hydroxy-1,4-butanedialdehyde (1), 4,5- and 2,3-dihydroxy-pentanoic acids (2 and 3), and 2-hydroxyglutaric acid (4), and of α-pinene, i.e., 3-hydroxyglutaric acid (5). The deprotonated molecules of the sulphated hydroxy-acids, 2-methylglyceric acid, 4,5- and 2,3-dihydroxypentanoic acid, and 2- and 3-hydroxyglutaric acids, showed in addition to the [HSO4]– ion (m/z 97) neutral losses of water, CO2, and/or SO3, features that are characteristic of humic-like substances.
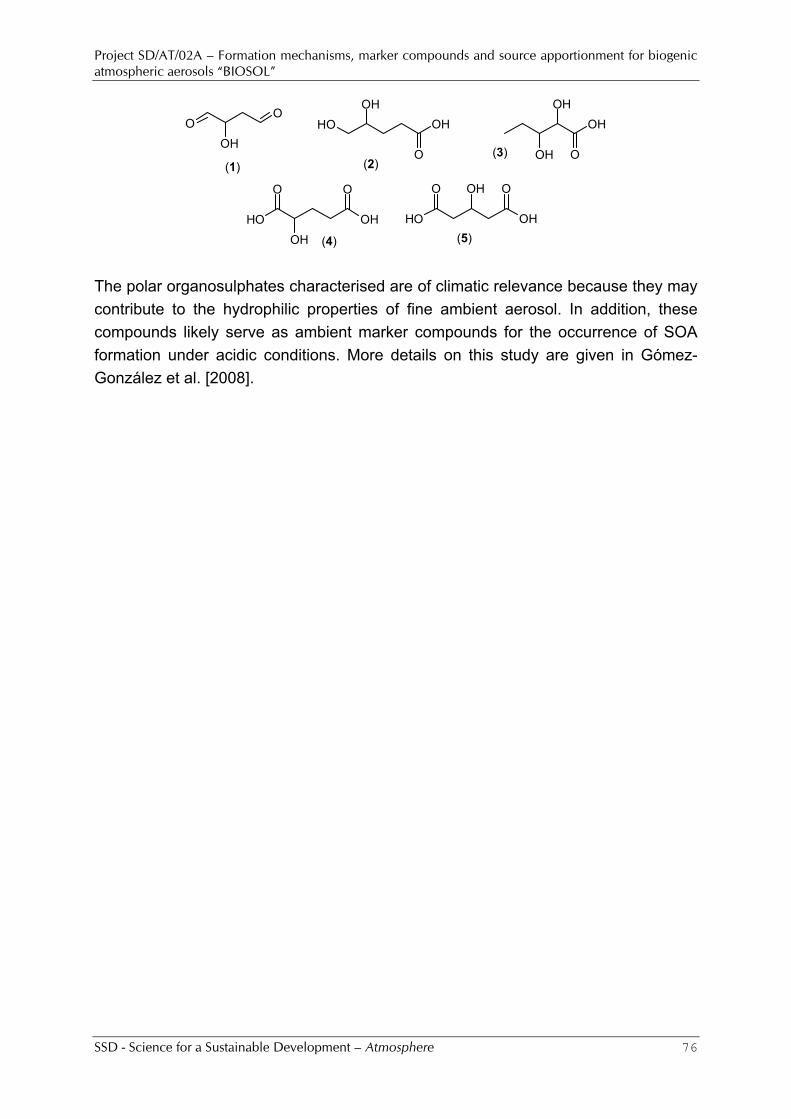
Project SD/AT/02A – Formation mechanisms, marker compounds and source apportionment for biogenic atmospheric aerosols “BIOSOL”
SSD - Science for a Sustainable Development – Atmosphere 76
OO
OHOH
O
OH
OH OH
O
OH
OH
OH
O O
OH
OH
OH
O O
OH
OH
(1) (2)(3)
(4) (5) The polar organosulphates characterised are of climatic relevance because they may contribute to the hydrophilic properties of fine ambient aerosol. In addition, these compounds likely serve as ambient marker compounds for the occurrence of SOA formation under acidic conditions. More details on this study are given in Gómez-González et al. [2008].
Project SD/AT/02A – Formation mechanisms, marker compounds and source apportionment for biogenic atmospheric aerosols “BIOSOL”
SSD - Science for a Sustainable Development – Atmosphere 77
11. DETERMINATION OF THE CONTRIBUTION FROM THE BVOCS TO THE ORGANIC AEROSOL FOR VARIOUS SITES IN EUROPE
This work was only planned from the second half of 2007 on. However, in the course of the 2006, P2 was invited by the Technical University of Vienna (Prof. H. Puxbaum) to co-operate in a manuscript on research that was carried within the EU-funded project CARBOSOL. The manuscript [Puxbaum et al., 2007] dealt with the impact of biomass burning along a traject from West to East (from the Azores to K-puszta) in Europe. As part of this work P2 also contributed to the development of a new method for saccharides (including levoglucosan) in aerosol samples. A manuscript on this work was published [Caseiro et al., 2007]. Furthermore, P2 co-operated with the Vienna group in assessing the contribution from primary biogenic (biological) particles (i.e., fungal spores) to the organic aerosol. A manuscript on this work was also published [Bauer et al., 2008]. In the first three months of 2008, we determined the contribution from the BVOCs to the organic aerosol for PM2.5 samples, which had been collected in summer 2003 in a mixed deciduous forest in Jülich [Maenhaut and Claeys 2007; Kourtchev et al., 2008c]. The approach used was similar to that used by Kleindienst et al. [2007]. The concentrations of the biogenic SOA and other organic components in the ambient samples were estimated by making use of concentration ratios of [tracer com-pounds]/OC, which were observed in laboratory (smog chamber) irradiations of single biogenic VOCs (or for the biomass burning organic component of the levoglucosan/OC ratios obtained in laboratory experiments with burning of soft wood, hard wood or other biomass). Using conversion factors reported by Kleindienst et al. [2007] and Lewan-dowski et al. [2008], the average contribution of isoprene SOA was estimated at 2.5% of the OC in the Jülich samples and that of α-/β-pinene SOA at at least 2.4%. By making use of the concentrations of 9.3% levoglucosan and 52% OC in wood smoke as given by Schmidl et al. [2008], the average contribution from wood smoke to the OC was estimated at 3.3%, while the contribution from fungal spores to the OC was estimated at 3.6%, using the concentrations of 1.2 pg arabitol and 13 pg OC per fungal spore reported by Bauer et al. [2008]. The summed contribution of isoprene and α-/β-pinene SOA, wood combustion, and fungal spores to the PM2.5 OC of the Jülich samples was thus at least 12%. It is clear that most of the OC remained unaccounted. Organosulphates, HULIS, and other primary biogenic aerosol besides fungal spores probably made up for a substantial fraction of the unexplained OC.
Project SD/AT/02A – Formation mechanisms, marker compounds and source apportionment for biogenic atmospheric aerosols “BIOSOL”
SSD - Science for a Sustainable Development – Atmosphere 78
12. VALORISATION ACTIVITIES AND EXPLOITATION OF THE RESULTS 12.1. Follow-up committee meetings Of the four formal Follow-up committee meetings planned during Phase I of the BIOSOL project, only two were actually held, both in 2007. A main reason why there was no such meeting in the first year of the project is that it took until the end of July 2006 before the contract with the Follow-up committee was finalised and signed by all parties involved. This was mainly due to the lack of response of the members from Switzerland and Norway to the draft contract. These two members were ultimately not retained in the Committee, which now contains 3 Belgian member institutions (LNE, VMM, and BIRA-IASB) and 4 non-Belgian members (from Greece, Germany, Finland, and Austria). The first formal Follow-up committee meeting took place on 20 March 2007 and the second one in the morning of 22 November 2007. Besides the formal meetings, there were several interactions with the various Com-mittee members by E-mail and telephone and during international conferences and workshops. C had several contacts (in person, by E-mail, and by phone) with the VMM members of the Follow-up committee; C also attended on 19 November 2006 a VMM meeting in Antwerp, where the 3 VMM members of the Committee were present, and he had interactions with them there. As far as the non-Belgian members of the Committee are concerned: The Greek member and a post-doctoral co-worker of the German member were present at the Joint IGAC/CACGP/WMO Symposium in September 2006 in Cape Town, South Africa. This symposium was also attended by C and P2 and they had discussions with the two persons. At the end of November 2006, C and the German Committee member attended an EMEP/TFMM workshop in Paris and had extensive discussions about BIOSOL. On 5-6 July 2007, C and P2 visited IfT (the home institution of the German Committee member), gave invited seminars there, and had extensive discussions with the German committee member and his co-workers. C and P2 had interactions with the Committee member from Finland in Helsinki (on 8 August 2007) during a visit to the Finnish Meteorological Institute (FMI). C, P2, co-workers of P4, the Austrian and Finnish Committee members, and co-workers of the German Committee member attended the European Aerosol Con-ference 2007 (EAC 2007), which was held in September 2007 in Salzburg, Austria, and there were various interactions then. There were also interactions between C, P2, and P3 and a co-worker of the German Committee member during the VOCBAS-INTROP meeting “Biogenic volatile organic compounds. Sources and fates in a changing world”, which took place in October 2007 in Montpellier, France. In addition to the Follow-up committee meetings, there were also formal and other
Project SD/AT/02A – Formation mechanisms, marker compounds and source apportionment for biogenic atmospheric aerosols “BIOSOL”
SSD - Science for a Sustainable Development – Atmosphere 79
meetings (and interactions by E-mail) with the partners of the Belgian Federal Science Policy Office funded project IBOOT (Impact of Biogenic emissions on Organic aero-sols and Oxidants in the Troposphere). On 21 November 2006, a technical meeting of the SSD projects BIOSOL and IBOOT was held at the University of Antwerp and this meeting was also attended by one member of the Follow-up committee, i.e., by Crist Amelynck (BIRA-IASB). A second joint BIOSOL-IBOOT meeting was held in the afternoon of 22 November 2007. C sent published and accepted BIOSOL manuscripts, pdf files of BIOSOL poster presentations and BIOSOL reports, and minutes of the meetings to all members of the Follow-up committee and also to the partners of the SSD project IBOOT. 12.2. Workshops An international workshop/school on mechanism development within the framework of the INTROP ESF Scientific Programme was planned in fall 2007. According to IBOOT, who took the lead in this, there was no possibility to organise this workshop. On the other hand, workshops were organised by BIOSOL partners. In the course of 2006, P4 organised, in co-operation with Prof. P.H. McMurry of the University of Minnesota, U.S.A., the “Second International Workshop on the Formation and Growth of Atmospheric Aerosols”. This workshop took place in Minneapolis, MN, September 8-9, 2006, and drew about 60 participants. On 5-7 September 2007, a workshop was held for the EU project OOMPH in Ghent. This workshop was organised by C and P2 (who were both partners in OOMPH). In this workshop, C and P2 presented results from their OOMPH-related work that forms part of BIOSOL and other participants presented the progress of their work in the project. The workshop was not only attended by partners of the OOMPH project, but also by other participants of the Southern Hemisphere cruise, including participants who studied aerosols on the cruise with an Aerodyne Aerosol Mass Spectrometer. 27 participants attended this workshop. 12.3. Other valorisation activities Several manuscripts on the BIOSOL work were written for peer-reviewed journals; they are included in the list of References. Besides, more than 30 oral or poster presenta-tions on BIOSOL work were given at national and international workshops and conferences.
Project SD/AT/02A – Formation mechanisms, marker compounds and source apportionment for biogenic atmospheric aerosols “BIOSOL”
SSD - Science for a Sustainable Development – Atmosphere 80
Furthermore, C provided input for the MIRA-T 2006 report and contributed to the EMEP/TFMM PM Assessment report. C also wrote the national contribution from Belgium for the EMEP/TFMM PM Assessment report [Maenhaut, 2007]. On the invitation of the journal Atmospheric Environment C wrote a New Directions article for this journal [Maenhaut, 2008]. P2 contributed to (and appeared in) a scientific programme for the Czech TV on applications of mass spectrometry in environmental and global change research. P2 and P3 taught for doctoral students in an ISONET-VOCBAS Short Course, entitled “Stable Isotopes, Plant VOCs and Secondary Organic Aerosols in Biosphere-Atmos-phere Carbon Exchange”, which was held in Kuopio, Finland, November 28-30, 2006. In May 2007, a Website was activated for the BIOSOL project. The URL for it is: http://www.analchem.ugent.be/BIOSOL/
Project SD/AT/02A – Formation mechanisms, marker compounds and source apportionment for biogenic atmospheric aerosols “BIOSOL”
SSD - Science for a Sustainable Development – Atmosphere 81
13. PRELIMINARY CONCLUSIONS AND RECOMMENDATIONS Based on findings of the smog chamber study with isoprene, detailed reaction mechanisms for SOA formation from isoprene photo-oxidation under high- and low-NOx conditions could be established. While the formation of isoprene SOA under high-NOx conditions is fairly well understood, only partial information has been obtained on the complex chemical composition of isoprene low-NOx SOA. Suitable analytical techniques need to be developed in order to elucidate the neutral-unstable products of low-NOx SOA. In collaboration with the Caltech group, further attempts will be made to characterise isoprene low-NOx SOA. Sulphate esters of isoprene and α-pinene oxidation products have been identified for the first time in smog chamber and ambient aerosol. Organosulphate formation may be an important process not only for isoprene and α-pinene, but also for other biogenic terpenes, and is likely a major source of HULIS in ambient aerosol during summer. Major tracer compounds found in ambient aerosol from different sites include organosulphates from the photo-oxidation of isoprene (i.e., 2-methyltetrols, 2-methylglyceric acid, 2-methyltetrol mono-nitrates, glyoxal, and methylglyoxal) and of α-pinene (i.e., α-pinanediol mono-nitrates; MW 295). While the formation of organosulphate from isoprene is fairly well understood, the mechanism by which the organosulphates from α-pinene with MW 295 are formed is much less clear. There-fore, additional smog chamber experiments under different conditions will be carried out in collaboration with the Caltech group in order to obtain insights into the forma-tion mechanism of the MW 295 compounds from α-pinene and other monoterpenes and efforts will be made to establish their chemical structures. Overall, the on-line measurements for BVOCs, their gas-phase oxidation products, and the physical and chemical aerosol parameters and the various aerosol col-lections for the 2006 summer campaign at K-puszta worked out quite well. During the first half of the more than 5-week long field campaign, the weather was unusually cold and rather cloudy, but during the second half it was much warmer and overall sunnier. The atmospheric concentrations of the BVOCs and their volatile oxidation products and of the PM, OC, and most major aerosol types were larger during the warm period than during the cold one. Furthermore, the concentrations of isoprene, monoterpenes, and their volatile oxidation products exhibited strong diurnal patterns. The diurnal patterns for isoprene and its volatile oxidation products were relatively similar, with highest concentrations during the day-time, but for the monoterpenes, highest levels were noted during the night. PCA on the data set revealed 7 compo-nents. Isoprene and its oxidation products MACR and MVK were highly loaded on the first component, while the monoterpenes and some of their oxidation products
Project SD/AT/02A – Formation mechanisms, marker compounds and source apportionment for biogenic atmospheric aerosols “BIOSOL”
SSD - Science for a Sustainable Development – Atmosphere 82
were highly correlated with the second component. The physical aerosol measurements with the DMPS and AIS of the 2006 summer K-puszta campaign indicated that there was a particle production event about every second day, which is quite frequent. There seemed to be no relation between these events and the real-time data for the BVOCs, their volatile oxidation products, PM, and OC. The relations between the various real-time data should (and will) be further examined. In the detailed examination of various interrelationships, we will also include the available data for the meteorological parameters or inorganic trace gases and data, which still have to be obtained, such as these for important organic aerosol constituents, be it that the latter will only be with day/night time resolution. From the chemical analyses, obtained so far for the aerosol samples from the 2006 summer K-puszta campaign, it appeared that OM, calculated as 1.8 OC, was the major aerosol component in both PM2.5 and PM10 and in both the cold and warm periods and accounted for between 40 and 50% of the gravimetric PM. Sulphate was the second component in PM2.5, with percentage contributions of 24% and 22% during the cold and warm periods, respectively. Because of the high sulphate and OM concen-trations in PM2.5, significant concentrations of organosulphates are expected, which may be important contributors to HULIS. This should be examined by detailed organic analyses. From the results for OC, EC, and the VOCs that were obtained in the course of 2007 at the forested site “De Inslag”, Brasschaat, it appeared that the site is substantially impacted by anthropogenic activities. This is in contrast to the two other forested sites studied in this project. From the detailed organic analysis of the aerosol samples from Brasschaat and comparison with the aerosol composition of the other two sites, we hope to obtain insights to what extent the anthropogenic emissions affect the composition of the biogenic SOA. There appeared to be little relationship between particulate OC and the BVOCs during the 2007 summer campaign at SMEAR II. The highest BVOC concentrations were observed in the first days of the warm period with daily average temperatures of 20°C (from 6 to 13 August), whereas OC only peaked on 13 August. There was thus a delay of several days between high BVOC and high OC levels. It seems that the particulate OC levels are not so much controlled by the local BVOC emissions at the SMEAR II site, but rather by the integrated BVOC emissions into the air masses along their transport path upwind of the site.
Project SD/AT/02A – Formation mechanisms, marker compounds and source apportionment for biogenic atmospheric aerosols “BIOSOL”
SSD - Science for a Sustainable Development – Atmosphere 83
The OC and EC data from the oceanic cruise in 2006 in the Northern Hemisphere indicated that there was a large impact from continental aerosol and from fossil-fuel combustion aerosol. This was in contrast to the OC and EC data from Amsterdam Island in the southern Indian Ocean. At the latter site, EC was below detection limit and OC was substantially lower than during the NH cruise. A common feature of both marine study areas was that only around 30% of the fine OC was water-soluble. At forested sites that are little affected by anthropogenic activities, such as K-puszta and SMEAR II, and where a large fraction of the fine OC is presumably SOA, the per-centage of WSOC in the OC is around 60%. The percentage of 30% for our marine samples is similar to that found at urban sites [Chi and Maenhaut, 2004], where most of the OC consists of primary organic aerosol from fossil fuel combustion. It seems that the fine OC for our two oceanic study areas was also mostly primary. Meskhidze and Nenes [2006] suggested that SOA from isoprene was a large source of cloud condensation nuclei above a phytoplankton bloom area in the southern Atlantic Ocean. There was clearly no evidence for SOA from isoprene nor from monoter-penes in the samples from the NH cruise. Whether SOA from these BVOCs is important at Amsterdam Island will be revealed by the planned detailed organic analyses of the samples from this site. Based on chemical considerations, the synthesis of reference compounds, and the interpretation of mass spectra, the structures of two major marker compounds for the photo-oxidation of α-pinene have been firmly established as 3-hydroxyglutaric acid and 3-methyl-1,2,3-butanetricarboxylic acid. The structures of organosulphate tracer compounds from the photo-oxidation of isoprene have been fairly well characterised; however, those of the MW 295 compounds from the photo-oxidation of α-pinene (i.e., α-pinanediol mono-nitrates) still need to be elucidated and further work is planned on this topic. In addition to organosulphates from isoprene and α-pinene, unknown polar organosulphates with hydrophilic properties similar to those of isoprene SOA from the photo-oxidation of unsaturated fatty acids have been tentatively identified. The structural characterisation of polar oxygenated SOA tracer products is obviously a very complex and demanding task; nevertheless, we believe that we are now at a stage where we have a fairly good idea about the structures of atmospherically relevant tracer compounds from the photo-oxidation of BVOCs. This progress has only been achieved during the second year of the BIOSOL project, so that the measurement of these tracer compounds in samples collected during the 2006 summer campaign at K-puszta has been postponed.
Project SD/AT/02A – Formation mechanisms, marker compounds and source apportionment for biogenic atmospheric aerosols “BIOSOL”
SSD - Science for a Sustainable Development – Atmosphere 84
ACKNOWLEDGEMENTS This project was funded by the Belgian Federal Science Policy Office (SPO). Financial support was also received from other sources, i.e., the “Fonds voor Wetenschappelijk Onderzoek - Vlaanderen”, the Special Research Funds of Ghent University and the University of Antwerp, and the 6th Framework Programme of the European Commission through the project “Organics over the Ocean Modifying Particles in both Hemispheres (OOMPH)” (Contract: 018419) and through the Marie Curie Action project “Characterization of secondary organic aerosol from photo-oxidation of isoprene and alpha-pinene with mass spectrometric approaches (SOAMASS)” (Project No.: 39787). Funds were also received from the European Commission projects “European Network for Atmospheric Composition Change (ACCENT)” and EUSAAR for access to the SMEAR II site in 2007 through the ACCENT programme “Access to Infrastructures”. For the research team of Willy Maenhaut (C), contributions were provided by Jan Cafmeyer, Xuguang Chi, Lucian Copolovici, Sheila Dunphy, Mustafa Koçak, Nico Raes, and Wan Wang. In the team of Magda Claeys (P2), contributions were provided by Yadian Gómez-González, Ivan Kourtchev, Rafal Szmigielski, Katarzyna Szmigielska, and Reinhilde Vermeylen. Gunter Eerdekens, Bert Gielen, Katarzyna Szmigielska, and Inge Van de Putte contributed in the team of Ivan Janssens (P3). And in the team of Markku Kulmala (P4) there were contributions from Pasi Aalto, Maija Kajos, Petri Keronen, Heikki Laakso, Tuomo Nieminen, Jevgeni Parshintsev, Toivo Pohja, Ilona Riipinen, Janne Rinne, Martta Salonen, Sanna-Liisa Sihto, Henri Vuollekoski, and Taina Yli-Juuti. We benefited from co-operation with the following universities and institutes: - Departments of Chemical Engineering and Environmental Science and
Engineering, California Institute of Technology (Caltech), Pasadena, CA, U.S.A.: J.H. Seinfeld, J.D. Surratt, and others;
- National Exposure Research Laboratory, US Environmental Protection Agency (EPA), Research Triangle Park, NC, U.S.A.: T.E. Kleindienst, E.O. Edney, and others;
- Leibniz Institute for Tropospheric Research (IfT), Leipzig, Germany: H. Herrmann, Y. Iinuma, and others;
- Laboratory of Atmospheric Chemistry, Paul Scherrer Institute (PSI), Villigen, Switzerland: U. Baltensperger, J. Dommen, and others;
- Department of Physics, University of Kuopio, Kuopio, Finland: J. Joutsensaari and others;
Project SD/AT/02A – Formation mechanisms, marker compounds and source apportionment for biogenic atmospheric aerosols “BIOSOL”
SSD - Science for a Sustainable Development – Atmosphere 85
- Department of Earth and Environmental Sciences, University of Pannonia, Veszprém, Hungary: A. Gelencsér and others;
- Institute of Chemistry, Eötvös University, Budapest, Hungary: I. Salma and co-workers;
- Institute of Analytical Chemistry, Academy of Sciences of the Czech Republic, Brno, Czech Republic: Z. Večeřa and co-workers;
- Flemish Research Institute for Nature and Forest (INBO), Geraardsbergen, Belgium: J. Neirynck and others;
- Atmospheric Chemistry Division, Max Planck Institute for Chemistry (MPIC), Mainz, Germany: J. Williams and others (and also some other universities and institutions within the framework of the EU OOMPH project);
- Laboratoire des Sciences du Climat et de l’Environnement (LSCE), Centre des Faibles Radioactivités, CNRS-CEA, Gif-sur-Yvette, France: J. Sciare and others;
- Department of Chemistry, University of Crete (UoC), Heraklion, Greece: N. Mihalo-poulos and co-workers;
- Institute for Analytical Chemistry, Vienna University of Technology, Vienna, Austria: H. Puxbaum, H. Bauer, and others;
- Institute for Experimental Physics, University of Vienna, Vienna, Austria: R. Hitzen-berger and co-workers;
- Department of Inorganic and Analytical Chemistry, University of Mainz, Mainz, Germany: T. Hoffmann and co-workers;
- Department of Chemistry, University of Antwerp, Antwerp, Belgium: Frank Block-huys and Kris Van Alsenoy;
- Research Team Medicinal Chemistry, Department of Pharmaceutical Sciences, University of Antwerp, Antwerp, Belgium: Pieter Van der Veken.
The financial support by the funding agencies and the work and/or assistance of the internal and external contributors is very much appreciated.
Project SD/AT/02A – Formation mechanisms, marker compounds and source apportionment for biogenic atmospheric aerosols “BIOSOL”
SSD - Science for a Sustainable Development – Atmosphere 86
REFERENCES Andreae, M.O., C.D. Jones and P.M. Cox. 2005. Strong present-day aerosol cooling
implies a hot future, Nature, 435: 1187-1190. Baker, A.R. 2004. Inorganic iodine speciation in tropical Atlantic aerosol, Geophys. Res.
Lett., 31, L23S02, doi:10.1029/2004GL020144. Bauer, H., M. Claeys, R. Vermeylen, E. Schueller, G. Weinke, A. Berger and H.
Puxbaum. 2008. Short communication: Arabitol and mannitol as tracers for the quantification of airborne fungal spores, Atmos. Environ., 42: 588-593.
Birch, M.E. and R.A. Cary. 1996. Elemental carbon-based method for monitoring occupational exposures to particulate diesel exhaust, Aerosol Sci. Technol., 25: 221-241.
Boy, M., T. Petäjä, M. Dal Maso, Ü. Rannik, J. Rinne, P. Aalto, A. Laaksonen, P. Vaattovaara, J. Joutsensaari, T. Hoffmann, J. Warnke, M. Apostolaki, E.G. Stephanou, M. Tsapakis, A. Kouvarakis, C. Pio, A. Carvalho, A. Rompp, G. Moortgat, C. Spirig, A. Guenther, J. Greenberg, P. Ciccioli and M. Kulmala. 2004. Overview of the field measurement campaign in Hyytiälä, August 2001 in the framework of the EU project OSOA, Atmos. Chem. Phys., 4: 657-678.
Boy, M., M. Kulmala, T.M. Ruuskanen, M. Pihlatie, A. Reissell, P.P. Aalto, P. Keronen, M. Dal Maso, H. Hellen, H. Hakola, R. Jansson, M. Hanke and F. Arnold. 2005. Sulphuric acid closure and contribution to nucleation mode particle growth, Atmos. Chem. Phys., 5: 863-878.
Brasseur, G.P., R.G. Prinn and A.A.P. Pszenny (eds.). 2003. Atmospheric Chemistry in a Changing World: An Integration and Synthesis of a Decade of Tropospheric Chemistry Research, Springer Verlag, Heidelberg, Germany.
Caseiro, A., I.L. Marr, M. Claeys, A. Kasper-Giebl, H. Puxbaum and C.A. Pio. 2007. Determination of saccharides in atmospheric aerosol using anion-exchange HPLC and pulsed amperometric detection, J. Chromatogr. A, 1171: 37-45.
Charlson, R.J., S.E. Schwartz, J.M. Hales, R.D. Cess, J.A. Coakley, J.E. Hansen and D.J. Hofmann. 1992. Climate forcing by anthropogenic aerosols, Science, 255: 423-430.
Chi, X. and W. Maenhaut. 2004. Organic carbon, elemental carbon and water-soluble organic carbon in the PM2.5 aerosol at different sampling sites, In: Abstract Book of the Eighth International Conference on Carbonaceous Particles in the Atmosphere, September 14-16, 2004, Vienna, Austria, p. 113.
Claeys, M., B. Graham, G. Vas, W. Wang, R. Vermeylen, V. Pashynska, J. Cafmeyer, P. Guyon, M.O. Andreae, P. Artaxo and W. Maenhaut. 2004a. Formation of secondary organic aerosols through photooxidation of isoprene, Science, 303: 1173-1176.
Project SD/AT/02A – Formation mechanisms, marker compounds and source apportionment for biogenic atmospheric aerosols “BIOSOL”
SSD - Science for a Sustainable Development – Atmosphere 87
Claeys, M., W. Wang, A.C. Ion, I. Kourtchev, A. Gelencsér and W. Maenhaut. 2004b. Formation of secondary organic aerosols from isoprene and its gas-phase oxidation products through reaction with hydrogen peroxide, Atmos. Environ., 38: 4093-4098.
Claeys, M., R. Szmigielski, I. Kourtchev, P. Van der Veken, R. Vermeylen, W. Maenhaut, M. Jaoui, T. Kleindienst, M. Lewandowski, J.H. Offenberg and E.O. Edney. 2007. Hydroxydicarboxylic acids: markers for secondary organic aerosol from the photooxidation of α-pinene, Environ. Sci. Technol., 41: 1628-1634.
Edney, E.O., T.E. Kleindienst, M. Jaoui, M. Lewandowski, J.H. Offenberg, W. Wang and M. Claeys. 2005. Formation of 2-methyl tetrols and 2-methylglyceric acid in secondary organic aerosol from laboratory irradiated isoprene/NOx/SO2/air mixtures and their detection in ambient PM2.5 samples collected in the eastern United States, Atmos. Environ., 39: 5281-5289.
Fine, P.M., G.R. Cass and B.R.T. Simoneit. 2004. Chemical characterization of fine particle emissions from the fireplace combustion of wood types grown in the Midwestern and Western United States, Environ. Engin. Sci., 21: 387-409.
Gómez-González, Y., J.D. Surratt, F. Cuyckens, R. Szmigielski, R. Vermeylen, M. Jaoui, M. Lewandowski, J.H. Offenberg, T.E. Kleindienst, E.O. Edney, F. Blockhuys, C. Van Alsenoy, W. Maenhaut and M. Claeys. 2008. Characterization of organo-sulfates from the photooxidation of isoprene and unsaturated fatty acids in ambient aerosol using liquid chromatography/(–)electrospray ionization mass spectrometry, J. Mass Spectrom., 43: 371-382.
Griffin, R.J., D.R. Cocker, J.H. Seinfeld and D. Dabdub. 1999. Estimate of global atmospheric organic aerosol from oxidation of biogenic hydrocarbons, Geophys. Res. Lett., 26: 2721-2724.
Guenther, A., C.N. Hewitt, D. Erickson, R. Fall, C. Geron, T. Graedel, P. Harley, L. Klinger, M. Lerdau, W.A. Mckay, T. Pierce, B. Scholes, R. Steinbrecher, R. Tallam-raju, J. Taylor and P. Zimmerman. 1995. A global-model of natural volatile organic-compound emissions, J. Geophys. Res., 100: 8873-8892.
Hering, S.V. and S.K. Friedlander. 1982. Origins of aerosol sulfur size distributions in the Los-Angeles basin, Atmos. Environ., 16: 2647-2656.
Hering, S., A. Eldering and J.H. Seinfeld. 1997. Bimodal character of accumulation mode aerosol mass distributions in Southern California, Atmos. Environ., 31: 1-11.
Hoffmann, T., J.R. Odum, F. Bowman, D. Collins, D. Klockow, R.C. Flagan and J.H. Seinfeld. 1997. Formation of organic aerosols from the oxidation of biogenic hydro-carbons, J. Atmos. Chem., 26: 189-222.
Holzinger, R., A. Lee, K.T. Paw and A.H. Goldstein. 2005. Observations of oxidation products above a forest imply biogenic emissions of very reactive compounds, Atmos. Chem. Phys., 5: 67-75.
Project SD/AT/02A – Formation mechanisms, marker compounds and source apportionment for biogenic atmospheric aerosols “BIOSOL”
SSD - Science for a Sustainable Development – Atmosphere 88
Iinuma, Y., O. Böge, T. Gnauk and H. Herrmann. 2004. Aerosol-chamber study of the alpha-pinene/O3 reaction: influence of particle acidity on aerosol yields and products, Atmos. Environ., 38: 761-773.
Iinuma, Y., C. Müller, T. Berndt, O. Böge, M. Claeys and H. Herrmann. 2007. Evi-dence for the existence of organosulfates from β-pinene ozonolysis in ambient secondary organic aerosol, Environ. Sci. Technol., 41: 6678-6683.
Ion, A.C., R. Vermeylen, I. Kourtchev, J. Cafmeyer, X. Chi, A. Gelencsér, W. Maen-haut and M. Claeys. 2005. Polar organic compounds in rural PM2.5 aerosols from K-puszta, Hungary, during a 2003 summer field campaign: sources and diel variations, Atmos. Chem. Phys., 5: 1805-1814.
IPCC 2001. Climate Change 2001: The Scientific Basis. Contribution of Working Group I to the Third Assessment Report of the Intergovernmental Panel on Climate Change, Houghton, J.T. et al. (eds.). Cambridge Univ. Press, Cambridge.
IPCC 2007. Climate Change 2007 - The Physical Science Basis. Contribution of Working Group I to the Fourth Assessment Report of the Intergovernmental Panel on Climate Change, Solomon, S. et al. (eds.). Cambridge Univ. Press, Cambridge, United Kingdom and New York, NY.
Jaenicke, R. 2005. Abundance of cellular material and proteins in the atmosphere, Science, 308: 73.
Jang, M.S., N.M. Czoschke, S. Lee and R.M. Kamens. 2002. Heterogeneous atmos-pheric aerosol production by acid-catalyzed particle-phase reactions, Science, 298: 814-817.
John, W., S.M. Wall, J.L. Ondo and W. Winklmayr. 1990. Modes in the size distri-butions of atmospheric inorganic aerosol, Atmos. Environ., A24: 2349-2359.
Kanakidou, M., J.H. Seinfeld, S.N. Pandis, I. Barnes, F.J. Dentener, M.C. Facchini, R. Van Dingenen, B. Ervens, A. Nenes, C.J. Nielsen, E. Swietlicki, J.P. Putaud, Y. Balkanski, S. Fuzzi, J. Horth, G.K. Moortgat, R. Winterhalter, C.E.L. Myhre, K. Tsigaridis, E. Vignati, E.G. Stephanou and J. Wilson. 2005. Organic aerosol and global climate modelling: a review, Atmos. Chem. Phys., 5: 1053-1123.
Kawamura, K. 1993. Identification of C2-C10 ω-oxocarboxylic acids, pyruvic acid, and C2-C3 α-dicarbonyls in wet precipitation and aerosol samples by capillary GC and GC/MS, Anal. Chem., 65: 3505-3511.
Kawamura, K. and K. Ikushima. 1993. Seasonal changes in the distribution of dicar-boxylic acids in the urban atmosphere, Environ. Sci. Technol., 27: 2227-2235.
Kawamura, K. and F. Sakaguchi. 1999. Molecular distributions of water soluble dicarboxylic acids in marine aerosols over the Pacific Ocean including tropics, J. Geophys. Res., 104: 3501-3509.
Kerminen, V.M. and A.S. Wexler. 1995. Growth laws for atmospheric aerosol-par-ticles - an examination of the bimodality of the accumulation-mode, Atmos. Environ., 29: 3263-3275.
Project SD/AT/02A – Formation mechanisms, marker compounds and source apportionment for biogenic atmospheric aerosols “BIOSOL”
SSD - Science for a Sustainable Development – Atmosphere 89
Kleindienst, T.E., M. Jaoui, M. Lewandowski, J.H. Offenberg, C.W. Lewis, P.V. Bhave and E.O. Edney. 2007. Estimates of the contributions of biogenic and anthropogenic hydrocarbons to secondary organic aerosol at a southeastern US location, Atmos. Environ., 41: 8288-8300.
Korhonen, H., K.E.J. Lehtinen and M. Kulmala. 2004. Multicomponent aerosol dy-namics model UHMA: model development and validation, Atmos. Chem. Phys., 4: 757-771.
Kourtchev, I., T. Ruuskanen, W. Maenhaut, M. Kulmala and M. Claeys. 2005. Obser-vation of 2-methyltetrols and related photo-oxidation products of isoprene in boreal forest aerosols from Hyytiälä, Finland, Atmos. Chem. Phys., 5: 2761-2770.
Kourtchev, I., T.M. Ruuskanen, P. Keronen, L. Sogacheva, M. Dal Maso, A. Reissell, X. Chi, R. Vermeylen, M. Kulmala, W. Maenhaut and M. Claeys. 2008a. Determination of isoprene and α-/β-pinene oxidation products in boreal forest aerosols from Hyy-tiälä, Finland: Diel variations and possible link with particle formation events, Plant Biology, 10: 138-149.
Kourtchev, I., T.M. Ruuskanen, P. Keronen, L. Sogacheva, M. Dal Maso, A. Reissell, X. Chi, R. Vermeylen, M. Kulmala, W. Maenhaut and M. Claeys. 2008b. Determination of isoprene and α-/β-pinene oxidation products in boreal forest aerosols from Hyy-tiälä, Finland (vol 10, pg 138, 2008), Plant Biology, 10: 280. [NOTE: this paper contains corrections for Kourtchev et al., 2008a].
Kourtchev, I., J. Warnke, W. Maenhaut, T. Hoffmann and M. Claeys. 2008c. Polar organic marker compounds in PM2.5 aerosol from a mixed forest site in western Germany. Chemosphere, 73: 1308-1314.
Kubátová, A., R. Vermeylen, M. Claeys, J. Cafmeyer and W. Maenhaut. 2002. Organic compounds in urban aerosols from Gent, Belgium: Characterization, sources, and seasonal differences, J. Geophys. Res., 107(D21): 8343, doi:10.1029/2001JD000556.
Kulmala. M., H. Vehkamaki, T. Petäjä, M. Dal Maso, A. Lauri, V.M. Kerminen, W. Birmili and P.H. McMurry. 2004. Formation and growth rates of ultrafine atmospheric par-ticles: a review of observations, J. Aerosol Sci., 35: 143-176.
Kulmala, M., K.E.J. Lehtinen and A. Laaksonen. 2006. Cluster activation theory as an explanation of the linear dependence between formation rate of 3 nm particles and sulphuric acid concentration, Atmos. Chem. Phys., 6: 787-793.
Laakso, L., T. Anttila, K.E.J. Lehtinen, P.P. Aalto, M. Kulmala, U. Horrak, J. Paatero, M. Hanke and F. Arnold. 2004. Kinetic nucleation and ions in boreal forest particle formation events, Atmos. Chem. Phys., 4: 2353-2366.
Lehtinen, K.E.J. and M. Kulmala. 2003. A model for particle formation and growth in the atmosphere with molecular resolution in size, Atmos. Chem. Phys., 3: 251-257.
Project SD/AT/02A – Formation mechanisms, marker compounds and source apportionment for biogenic atmospheric aerosols “BIOSOL”
SSD - Science for a Sustainable Development – Atmosphere 90
Lewandowski, M., M. Jaoui, J.H. Offenberg, T.E. Kleindienst, E.O. Edney, R.J. Sheesley and J.J. Schauer. 2008. Primary and secondary contributions to ambient PM in the midwestern United States, Environ. Sci. Technol., 42: 3303-3309.
Lewis, D.H. and D.C. Smith. 1967. Sugar alcohols (polyols) in fungi and green plants. I. distribution physiology and metabolism, New Phytol., 66: 143-184.
Limbeck, A., M. Kulmala and H. Puxbaum. 2003. Secondary organic aerosol formation in the atmosphere via heterogeneous reaction of gaseous isoprene on acidic par-ticles, Geophys. Res. Lett., 30 (19), 1996, doi:10.1029/2003GL017738.
Lindinger, W., A. Hansel and A. Jordan. 1998. On-line monitoring of volatile organic compounds at pptv levels by means of proton-transfer-reaction mass spectrometry (PTR-MS) - Medical applications, food control and environmental research, Int. J. Mass Spectrom., 173: 191-241.
Lupu, A. and W. Maenhaut. 2002. Application and comparison of two statistical trajectory techniques for identification of source regions of atmospheric aerosol species, Atmos. Environ., 36: 5607-5618.
Mader, B.T., J.J. Schauer, J.H. Seinfeld, R.C. Flagan, J.Z. Yu, H. Yang, H.J. Lim, B.J. Turpin, J.T. Deminter, G. Heidemann, M.S. Bae, P. Quinn, T. Bates, D.J. Eatough, B.J. Huebert, T. Bertram and S. Howell. 2003. Sampling methods used for the collection of particle-phase organic and elemental carbon during ACE-Asia, Atmos. Environ., 37: 1435-1449.
Maenhaut, W. 2007. Atmospheric particulate matter in Belgium, In: EMEP Particulate Matter Assessment Report, Aas, W., P. Bruckmann, R. Derwent, N. Poisson, J.-P. Putaud, L. Rouil, S. Vidic and K.-E. Yttri (eds.). EMEP/CCC-Report 8/2007, O-7726, Norwegian Institute for Air Research, Kjeller, Norway, pp. 95-108.
Maenhaut, W. 2008. New Directions: Future needs for global monitoring and research of aerosol chemical composition, Atmos. Environ., 42: 1070-1072.
Maenhaut, W. and M. Claeys. 2007. Characterisation and sources of carbonaceous atmospheric aerosols, Belgian Science Policy, Scientific Support Plan for a Sustain-able Development Policy (SPSD II), Research Project EV/11, Final report, 92 pages. (D/2007/1191/52).
Maenhaut, W., R. Hillamo, T. Mäkelä, J.L. Jaffrezo, M.H. Bergin and C.I. Davidson. 1996. A new cascade impactor for aerosol sampling with subsequent PIXE analysis, Nucl. Instr. and Meth., B109/110: 482-487.
Maenhaut, W., X. Chi, J. Cafmeyer, I. Salma, P. Mikuška, A. Broškovičová and Z. Večeřa. 2004. Investigations during summer field campaigns in central Europe on the performance of a diffusion denuder for the elimination of sampling artifacts for carbonaceous aerosols, J. Aerosol Sci., Abstracts of the European Aerosol Conference 2004: S1069-S1070.
Project SD/AT/02A – Formation mechanisms, marker compounds and source apportionment for biogenic atmospheric aerosols “BIOSOL”
SSD - Science for a Sustainable Development – Atmosphere 91
Maenhaut, W., N. Raes, X. Chi, J. Cafmeyer and W. Wang. 2008. Chemical compo-sition and mass closure for PM2.5 and PM10 aerosols at K-puszta, Hungary, in summer 2006, X-Ray Spectrom., 37: 193-197.
Marple, V.A., K.L. Rubow and S.M. Behm. 1991. A microorifice uniform deposit impactor (MOUDI): description, calibration and use, Aerosol Sci. Technol., 14: 434-446.
Mäkelä, J.M., P. Aalto, V. Jokinen, T. Pohja, A. Nissinen, S. Palmroth, T. Markkanen, K. Seitsonen, H. Lihavainen and M. Kulmala. 1997. Observations of ultrafine aerosol particle formation and growth in boreal forest, Geophys. Res. Lett., 24: 1219-1222.
Matsunaga, S., M. Mochida and K. Kawamura. 2003. Growth of organic aerosols by biogenic semi-volatile carbonyls in the forestal atmosphere, Atmos. Environ., 37: 2045-2050.
Meng, Z.Y. and J.H. Seinfeld, 1994. On the source of the submicrometer droplet mode of urban and regional aerosols, Aerosol Sci. Technol., 20: 253-265.
Meskhidze, N. and A. Nenes. 2006. Phytoplankton and cloudiness in the Southern Ocean, Science, 314: 1419-1423.
Mikuška, P., Z. Večeřa, A. Broškovičová, M. Stepán, X. Chi and W. Maenhaut. 2003. Development of a diffusion denuder for the elimination of sampling artifacts for carbonaceous aerosols, J. Aerosol Sci., Abstracts of the European Aerosol Conference 2003: S761-S762. (ISSN: 0021-8502).
Novakov, T. and J.E. Penner. 1993. Large contribution of organic aerosols to cloud-condensation-nuclei concentrations, Nature, 365: 823-826.
O’Dowd, C.D., P. Aalto, K. Hameri, M. Kulmala and T. Hoffmann. 2002. Aerosol formation - Atmospheric particles from organic vapours, Nature, 416: 497-498.
Paatero, P. and U. Tapper. 1994. Positive Matrix Factorization: a non-negative factor model with optimal utilization of error estimates of data values, Environmetrics, 5: 111-126.
Pandis, S.N., S.E. Paulson, J.H. Seinfeld and R.C. Flagan. 1991. Aerosol formation in the photooxidation of isoprene and beta-pinene, Atmos. Environ., 25A: 997-1008.
Pashynska, V., R. Vermeylen, G. Vas, W. Maenhaut and M. Claeys. 2002. Develop-ment of a gas chromatography/ion trap mass spectrometry method for determi-nation of levoglucosan and saccharidic compounds in atmospheric aerosols. Application to urban aerosols, J. Mass Spectrom., 37: 1249-1257.
Paulsen, D., J. Dommen, M. Kalberer, A.S.H. Prevot, R. Richter, M. Sax, M. Stein-bacher, E. Weingartner and U. Baltensperger. 2005. Secondary organic aerosol formation by irradiation of 1,3,5-trimethylbenzene-NOx-H2O in a new reaction chamber for atmospheric chemistry and physics, Environ. Sci. Technol., 39: 2668-2678.
Project SD/AT/02A – Formation mechanisms, marker compounds and source apportionment for biogenic atmospheric aerosols “BIOSOL”
SSD - Science for a Sustainable Development – Atmosphere 92
Penner, J.E. et al. 2001. Aerosols, their direct and indirect effects, In: Climate Change 2001: The Scientific Basis. Contribution of Working Group I to the Third Assessment Report of the Intergovernmental Panel on Climate Change, Houghton, J.T. et al. (eds.). Cambridge Univ. Press, Cambridge.
Pirjola, L. 1999. Effects of the increased UV radiation and biogenic VOC emissions on ultrafine sulphate aerosol formation, J. Aerosol Sci., 30: 355-367.
Putaud, J.-P., F. Raes, R. Van Dingenen, U. Baltensperger, E. Brüggemann, M.-C. Facchini, S. Decesari, S. Fuzzi, R. Gehrig, C. Hüglin, P. Laj, G. Lorbeer, W. Maenhaut, N. Mihalopoulos, K. Müller, X. Querol, S. Rodriguez, J. Schneider, G. Spindler, H. ten Brink, K. Tørseth and A. Wiedensohler. 2004. A European Aerosol Phenomenology. 2: chemical characteristics of particulate matter at kerbside, urban, rural and background sites in Europe, Atmos. Environ., 38: 2579-2595.
Puxbaum, H., A. Caseiro, A. Sánchez-Ochoa, A. Kasper-Giebl, M. Claeys, A. Gelencsér, S. Preunkert, M. Legrand and C. Pio. 2007. Levoglucosan levels at background sites in Europe for assessing the impact of biomass combustion on the European aerosol background, J. Geophys. Res., 112, D23S05, doi:10.1029/2006JD008114.
Ricard, V., J.-L. Jaffrezo, V. M. Kerminen, R.E. Hillamo, K. Teinila and W. Maenhaut. 2002. Size distributions and modal parameters of aerosol constituents in northern Finland during the European Arctic Aerosol Study, J. Geophys. Res., 107, No. D14, 4208, doi:10.1029/2001JD001130.
Salma, I., R. Ocskay, N. Raes and W. Maenhaut. 2005. Fine structure of mass size distributions in urban environment, Atmos. Environ., 39: 5363-5374.
Saltzman, E.S., D.L. Savoie, J.M. Prospero and R.G. Zika. 1986. Methanesulfonic acid and non-sea-salt sulfate in Pacific air: regional and seasonal variations, J. Atmos. Chem., 4: 227-240.
Saxena, P. and L.M. Hildemann. 1996. Water-soluble organics in atmospheric particles: A critical review of the literature and application of thermodynamics to identify candidate compounds, J. Atmos. Chem., 24: 57-109.
Schauer, J.J., W.F. Rogge, L.M. Hildemann, M.A. Mazurek, G.R. Cass and B.R.T. Simoneit. 1996. Source apportionment of airborne particulate matter using organic compounds as tracers, Atmos. Environ., 30: 3837-3855.
Schmidl C., L.L. Marr, A. Caseiro, P. Kotianova, A. Berner, H. Bauer, A. Kasper-Giebl and H. Puxbaum. 2008. Chemical characterisation of fine particle emissions from wood stove combustion of common woods growing in mid-European Alpine regions, Atmos. Environ., 42: 126-141.
Project SD/AT/02A – Formation mechanisms, marker compounds and source apportionment for biogenic atmospheric aerosols “BIOSOL”
SSD - Science for a Sustainable Development – Atmosphere 93
Sihto, S.L., M. Kulmala, V.M. Kerminen, M. Dal Maso, T. Petäjä, I. Riipinen, H. Korhonen, F. Arnold, R. Janson, M. Boy, A. Laaksonen and K.E.J. Lehtinen. 2006. Atmospheric sulphuric acid and aerosol formation: implications from atmospheric measurements for nucleation and early growth mechanisms, Atmos. Chem. Phys., 6: 4079-4091.
Solomon, P.A., J.L. Moyers and R.A. Fletcher. 1983. High-volume dichotomous sampler virtual impactor for the fractionation and collection of particles according to aerodynamic size, Aerosol Sci. Technol., 2: 455-464.
Stelson, A.W. and J.H. Seinfeld.1982. Relative-humidity and temperature-dependence of the ammonium-nitrate dissociation-constant, Atmos. Environ., 16: 983-992.
Surratt, J.D., S.M. Murphy, J.H. Kroll, N.L. Ng, L. Hildebrant, A. Sorooshian, R. Szmigielski, R. Vermeylen, W. Maenhaut, M. Claeys, R.C. Flagan and J.H. Seinfeld. 2006. Chemical composition of secondary organic aerosol formed from the photo-oxidation of isoprene, J. Phys. Chem. A, 110: 9665-9690.
Surratt, J.D., J.H. Kroll, T.E. Kleindienst, E.O. Edney, M. Claeys, A. Sorooshian, N.L. Ng, J.H. Offenberg, M. Lewandowski, M. Jaoui, R.C. Flagan and J.H. Seinfeld. 2007. Evidence for organosulfates in secondary organic aerosol, Environ. Sci. Technol., 41: 517-527.
Szmigielski, R., J.D. Surratt, R. Vermeylen, K. Szmigielska, J.H. Kroll, N.L. Ng, S.M. Murphy, A. Sorooshian, J.H. Seinfeld and M. Claeys. 2007a. Characterization of 2-methylglyceric acid oligomers in secondary organic aerosol formed from the photooxidation of isoprene using trimethylsilylation and gas chromatography / ion trap mass spectrometry, J. Mass Spectrom., 42: 101-116.
Szmigielski, R., J.D. Surratt, Y. Gómez-González, P. Van der Veken, I. Kourtchev, R. Vermeylen, F. Blockhuys, M. Jaoui, T.E. Kleindienst, M. Lewandowski, J.H. Offenberg, E.O. Edney, J.H. Seinfeld, W. Maenhaut and M. Claeys. 2007b. 3-methyl-1,2,3-butanetricarboxylic acid: An atmospheric tracer for terpene secondary organic aerosol, Geophys. Res. Lett., 34, L24811, doi:10.1029/2007GL031338.
Tunved, P., H.C. Hansson, V.M. Kerminen, J. Strom, M. Dal Maso, H. Lihavainen, Y. Viisanen, P.P. Aalto, M. Komppula and M. Kulmala. 2006. High natural aerosol loading over boreal forests, Science, 312: 261-263.
Turpin, B.J., P. Saxena and E. Andrews. 2000. Measuring and simulating particulate organics in the atmosphere: problems and prospects, Atmos. Environ., 34: 2983-3013.
Viana, M., W. Maenhaut, H.M. ten Brink, X. Chi, E. Weijers, X. Querol, A. Alastuey, P. Mikuška and Z. Večeřa. 2007. Comparative analysis of organic and elemental carbon concentrations in carbonaceous aerosols in three European cities, Atmos. Environ., 41: 5972-5983.
Project SD/AT/02A – Formation mechanisms, marker compounds and source apportionment for biogenic atmospheric aerosols “BIOSOL”
SSD - Science for a Sustainable Development – Atmosphere 94
Wang, W., I. Kourtchev, B. Graham, J. Cafmeyer, W. Maenhaut and M. Claeys. 2005. Characterization of oxygenated derivatives of isoprene related to 2-methyl-tetrols in Amazonian aerosols using trimethylsilylation and gas chromatogra-phy/ion trap mass spectrometry, Rapid Commun. Mass Spectrom., 19: 1343-1351.
Zappoli, S., A. Andracchio, S. Fuzzi, M.C. Facchini, A. Gelencser, G. Kiss, Z. Krivacsy, A. Molnar, E. Meszaros, H.C. Hansson, K. Rosman and Y. Zebuhr. 1999. Inorganic, organic and macromolecular components of fine aerosol in different areas of Europe in relation to their water solubility, Atmos. Environ., 33: 2733-2743.
Zdráhal, Z., J. Oliveira, R. Vermeylen, M. Claeys and W. Maenhaut. 2002. Improved method for quantifying levoglucosan and related monosaccharide anhydrides in atmospheric aerosols and application to samples from urban and tropical loca-tions, Environ. Sci. Technol., 36: 747-753.