Biosensors and Bioelectronics...Sensitivity evaluation of NBD-SCN towards cysteine/homocysteine and...
7
Sensitivity evaluation of NBD-SCN towards cysteine/homocysteine and its bioimaging applications Yen-Hao Chen a , Jia-Chun Tsai a , Tsan-Hwang Cheng b , Shyng-Shiou Yuan c , Yun-Ming Wang a,d,n a Department of Biological Science and Technology, Institute of Molecular Medicine and Bioengineering, National Chiao Tung University, 75 Bo-Ai Street, Hsinchu 300, Taiwan b Department of Biological Science and Technology, Chung Hwa University of Medical Technology, 89, Wunhua 1st Street, Rende, Tainan 717, Taiwan c Translational Research Center, Cancer Center, and Department of Obstetrics and Gynecology, Kaohsiung Medical University Hospital, Kaohsiung Medical University, Kaohsiung 807, Taiwan d Department of Biomedical Science and Environmental Biology, Kaohsiung Medical University, Kaohsiung 807, Taiwan article info Article history: Received 12 November 2013 Received in revised form 19 December 2013 Accepted 3 January 2014 Available online 11 January 2014 Keywords: Cysteine Homocysteine ICT NBD Fluorescent probe abstract A push–pull fluorogenic reagent, NBD-SCN, was applied for specific detection of cysteine (Cys) and homocysteine (Hcy). Replacing thiocyanato group with Cys/Hcy increased the push–pull characteristic of the probe and resulted in emission of fluorescence. The fluorescent response of the probe toward Cys/ Hcy was significantly higher than toward glutathione and other amino acids. The probe showed a 470- and 745-fold fluorescence enhancement at 550 nm and detection limit of 2.99 and 1.43 nM for Cys and Hcy, respectively. Time-dependent fluorescence assays showed that the fluorescence intensity reached a plateau within 20 s after addition of Cys and within 10 min after addition of Hcy. Furthermore, the fluorescence images of Cys/Hcy in Raw 264.7 cells were obtained after adding this probe to the cells. These results indicate that NBD-SCN not only possesses good selectivity and sensitivity for Cys/Hcy but also can penetrate cells for Cys/Hcy bioimaging. & 2014 Elsevier B.V. All rights reserved. 1. Introduction Biological low molecular weight thiols, such as cysteine (Cys), homocysteine (Hcy), and glutathione (GSH), play important roles in biological systems (Ball et al., 2006; Hong et al., 2006; Schulz et al., 2000; Seshadri et al., 2002; Wood et al., 2003; Zhang et al., 2004). Cys and Hcy are biologically essential molecules required for the growth of cells and tissues in living organisms (Wood et al., 2003). However, abnormal concentrations of Cys and Hcy are associated with various diseases such as growth retardation in children, hair depigmentation, liver damage, edema, muscle and fat loss, Alzheimer 0 s disease, cardiovascular disease, neural tube defect and coronary heart disease (Heafield et al., 1990; Jacobsen, 1998; Nygard et al., 1997; Shahrokhian, 2001). Therefore, the development of probes for rapid detection of Cys/Hcy is important to investigate their functions in cells and disease diagnoses. To date, several analytical methods such as high performance liquid chromatography (HPLC) (Chen et al., 2008; Guo et al., 2013; Ivanova et al., 2000; Nolina et al., 2007; Ogasawaraa et al., 2007; Wada et al., 2013), mass spectrometry (MacCoss et al., 1999; Rafii et al., 2007; Sass and Endres, 1997; Yana et al., 2007), and electrochemistry (Salimi and Hallaj, 2005; Salimi and Pourbeyram, 2003; Tanga et al., 2010) have been reported for the determination of thiols. Among these analytical methods, fluorimetry is particularly attractive due to its simplicity and sensitivity. Of importance, fluorescent method can be applied in intracellular detection. Various fluorescent probes for thiols have been reported in the past few years. These probes based on different detecting strategies, such as Michael addition (Chen et al., 2010; Huo et al., 2009, 2010; Jung et al., 2012; Lin et al., 2009; Wang et al., 2012a; Yang et al., 2011, 2013; Yi et al., 2009; Yin et al., 2013; Zhang et al., 2012a; Zhou et al., 2012), cyclization reaction (Das et al., 2012; Ma et al., 2011; Madhu et al., 2013; Sun et al., 2011; Zhang et al., 2010), cleavage reaction (Bouffard et al., 2008; Shao et al., 2011, 2012; Wang et al., 2012b; Zhang et al., 2012c), displacement of coordination by thiols (Chen et al., 2013; Han et al., 2009; Huang et al., 2013; Leung et al., 2013) and many other methods (Fujikawa et al., 2008; Lee et al., 2010; Murale et al., 2013; Niu et al., 2012; Tang et al., 2007; Zhang et al., 2007, 2012b) have been reported. However, many of them were reported to have a long response time under physiological condition and high background fluorescence. A change in fluorescent emission profile of a fluorophore can be achieved by the alteration of the electronic features of the substituents, Contents lists available at ScienceDirect journal homepage: www.elsevier.com/locate/bios Biosensors and Bioelectronics 0956-5663/$ - see front matter & 2014 Elsevier B.V. All rights reserved. http://dx.doi.org/10.1016/j.bios.2014.01.009 n Corresponding author at: Department of Biological Science and Technology, Institute of Molecular Medicine and Bioengineering, National Chiao Tung Univer- sity, 75 Bo-Ai Street, Hsinchu 300, Taiwan. Tel.: þ886 3 5712121x56972; fax: þ886 3 5729288. E-mail address: [email protected] (Y.-M. Wang). Biosensors and Bioelectronics 56 (2014) 117–123
Transcript of Biosensors and Bioelectronics...Sensitivity evaluation of NBD-SCN towards cysteine/homocysteine and...

Sensitivity evaluation of NBD-SCN towards cysteine/homocysteineand its bioimaging applications
Yen-Hao Chen a, Jia-Chun Tsai a, Tsan-Hwang Cheng b, Shyng-Shiou Yuan c,Yun-Ming Wang a,d,n
a Department of Biological Science and Technology, Institute of Molecular Medicine and Bioengineering, National Chiao Tung University,75 Bo-Ai Street, Hsinchu 300, Taiwanb Department of Biological Science and Technology, Chung Hwa University of Medical Technology, 89, Wunhua 1st Street, Rende, Tainan 717, Taiwanc Translational Research Center, Cancer Center, and Department of Obstetrics and Gynecology, Kaohsiung Medical University Hospital,Kaohsiung Medical University, Kaohsiung 807, Taiwand Department of Biomedical Science and Environmental Biology, Kaohsiung Medical University, Kaohsiung 807, Taiwan
a r t i c l e i n f o
Article history:Received 12 November 2013Received in revised form19 December 2013Accepted 3 January 2014Available online 11 January 2014
Keywords:CysteineHomocysteineICTNBDFluorescent probe
a b s t r a c t
A push–pull fluorogenic reagent, NBD-SCN, was applied for specific detection of cysteine (Cys) andhomocysteine (Hcy). Replacing thiocyanato group with Cys/Hcy increased the push–pull characteristic ofthe probe and resulted in emission of fluorescence. The fluorescent response of the probe toward Cys/Hcy was significantly higher than toward glutathione and other amino acids. The probe showed a 470-and 745-fold fluorescence enhancement at 550 nm and detection limit of 2.99 and 1.43 nM for Cys andHcy, respectively. Time-dependent fluorescence assays showed that the fluorescence intensity reached aplateau within 20 s after addition of Cys and within 10 min after addition of Hcy. Furthermore, thefluorescence images of Cys/Hcy in Raw 264.7 cells were obtained after adding this probe to the cells.These results indicate that NBD-SCN not only possesses good selectivity and sensitivity for Cys/Hcy butalso can penetrate cells for Cys/Hcy bioimaging.
& 2014 Elsevier B.V. All rights reserved.
1. Introduction
Biological low molecular weight thiols, such as cysteine (Cys),homocysteine (Hcy), and glutathione (GSH), play important rolesin biological systems (Ball et al., 2006; Hong et al., 2006; Schulzet al., 2000; Seshadri et al., 2002; Wood et al., 2003; Zhang et al.,2004). Cys and Hcy are biologically essential molecules requiredfor the growth of cells and tissues in living organisms (Wood et al.,2003). However, abnormal concentrations of Cys and Hcy areassociated with various diseases such as growth retardation inchildren, hair depigmentation, liver damage, edema, muscle andfat loss, Alzheimer0s disease, cardiovascular disease, neural tubedefect and coronary heart disease (Heafield et al., 1990; Jacobsen,1998; Nygard et al., 1997; Shahrokhian, 2001). Therefore, thedevelopment of probes for rapid detection of Cys/Hcy is importantto investigate their functions in cells and disease diagnoses.
To date, several analytical methods such as high performanceliquid chromatography (HPLC) (Chen et al., 2008; Guo et al., 2013;
Ivanova et al., 2000; Nolina et al., 2007; Ogasawaraa et al., 2007; Wadaet al., 2013), mass spectrometry (MacCoss et al., 1999; Rafii et al., 2007;Sass and Endres, 1997; Yana et al., 2007), and electrochemistry (Salimiand Hallaj, 2005; Salimi and Pourbeyram, 2003; Tanga et al., 2010)have been reported for the determination of thiols. Among theseanalytical methods, fluorimetry is particularly attractive due to itssimplicity and sensitivity. Of importance, fluorescent method can beapplied in intracellular detection. Various fluorescent probes for thiolshave been reported in the past few years. These probes based ondifferent detecting strategies, such as Michael addition (Chen et al.,2010; Huo et al., 2009, 2010; Jung et al., 2012; Lin et al., 2009; Wanget al., 2012a; Yang et al., 2011, 2013; Yi et al., 2009; Yin et al., 2013;Zhang et al., 2012a; Zhou et al., 2012), cyclization reaction (Das et al.,2012; Ma et al., 2011; Madhu et al., 2013; Sun et al., 2011; Zhang et al.,2010), cleavage reaction (Bouffard et al., 2008; Shao et al., 2011, 2012;Wang et al., 2012b; Zhang et al., 2012c), displacement of coordinationby thiols (Chen et al., 2013; Han et al., 2009; Huang et al., 2013; Leunget al., 2013) and many other methods (Fujikawa et al., 2008; Lee et al.,2010; Murale et al., 2013; Niu et al., 2012; Tang et al., 2007; Zhanget al., 2007, 2012b) have been reported. However, many of themwerereported to have a long response time under physiological conditionand high background fluorescence.
A change in fluorescent emission profile of a fluorophore can beachieved by the alteration of the electronic features of the substituents,
Contents lists available at ScienceDirect
journal homepage: www.elsevier.com/locate/bios
Biosensors and Bioelectronics
0956-5663/$ - see front matter & 2014 Elsevier B.V. All rights reserved.http://dx.doi.org/10.1016/j.bios.2014.01.009
n Corresponding author at: Department of Biological Science and Technology,Institute of Molecular Medicine and Bioengineering, National Chiao Tung Univer-sity, 75 Bo-Ai Street, Hsinchu 300, Taiwan. Tel.: þ886 3 5712121x56972;fax: þ886 3 5729288.
E-mail address: [email protected] (Y.-M. Wang).
Biosensors and Bioelectronics 56 (2014) 117–123

through either intramolecular charge transfer (ICT) or photo-induced electron transfer (PET) pathways. The ICT type fluoro-phore can provide high sensitivity due to its very low intrinsicfluorescence (Uchiyama et al., 1998). The 7-nitrobenz-2-oxa-1,3-diazolyl (NBD) moiety has been used as a building block for thedesign of ICT type of fluorogenic reagents. For example, thephotoaffinity labeling tag, 7-azido-4-nitrobenz-2-oxa-1,3-diazole(NBD-azide), is a non-fluorescent compound because the twoelectron-withdrawing groups (7-azido and 4-nitro) that resultsin a pull–pull system and blocks the ICT process. The non-fluorescent azido fluorogen can be photoconverted to an aminoform that becomes a push–pull system and results in a dramaticincrease in fluorescence (Lord et al., 2010). In addition to the ICTcharacteristic, the NBD-based fluorophore also possesses somebenefits such as ease of synthesis, rather long wavelength emis-sion and good cell permeability.
NBD-SCN has been considered as a thiol-neutralizing agent anda potent inhibitor of nucleic acid synthesis in leucocytes(Whitehouse and Ghosh, 1968). Herein, we report NBD-SCN as afluorescent probe for the specific detection of Cys and Hcy. Owingto the donor-π-acceptor architecture, the reaction with Cys andHcy will promote the ICT property of NBD-SCN and initiatefluorescent emission. The specificity of NBD-SCN toward Cys/Hcywas evaluated by comparing the fluorescence intensities of NBD-SCN in the presence of various amino acids and anions. To studythe detecting ability of NBD-SCN toward to Cys and Hcy, time- andconcentration-dependent studies were investigated, respectively.The correlation between fluorescence intensity and Cys and Hcyconcentration were also examined. The fluorescence intensities ofNBD-SCN in the absence and presence of Cys and Hcy in variouspH conditions were measured in order to study the stability ofNBD-SCN. Furthermore, the applicability of intracellular Cys/Hcyfluorescence detection was evaluated in vitro using fluorescentimaging techniques.
2. Experimental section
2.1. Materials
4-Chloro-7-nitrobenz-2-oxa-1,3-diazole (NBD-Cl), asparagine(Asn), aspartic acid (Asp), glutamine (Gln), glutamic acid (Glu),histidine (His) isoleucine (Ile), proline (Pro), threonine (Thr),tryptophan (Trp), tyrosine (Tyr), cystine, cysteine (Cys), glu-tathione (GSH), arginine (Arg), lysine (Lys), valine (Val), alanine(Ala), leucine (Leu), methionine (Met), glycine (Gly), sodiumcarbonate (Na2CO3), sodium bicarbonate (NaHCO3), sodium sulfate(Na2SO4), sodium thiocyanate (NaSCN), sodium hydrosulfide(NaHS) and tetrabutylammonium cyanide (TBACN) were pur-chased from Sigma-Aldrich. Serine (Ser) was purchased from AcrosOrganics. Sodium acetate (CH3COONa) and sodium nitrate(NaNO3) were purchased from Showa. Phenylalanine (Phe), homo-cysteine (Hcy) and N-ethylmaleimide (NEM) were purchased fromAlfa Aesar. All chemicals were used directly without any furtherpurification.
2.2. Apparatus
Flash column chromatography was performed on reverse phaseC18 silica gel (25–40 μm). 1H and 13C NMR spectra were obtainedon an Agilent 400-MR DD2 spectrometer at 400 and 100 MHz, andwere referenced to the internal 1H and 13C solvent peaks. ESI-MSspectra were recorded on a Micromass Q-Tof mass spectrometer.Analyses of carbon, hydrogen, nitrogen and sulfur were obtainedwith an Elementar vario EL III (Heraeus) analyzer. UV–vis absorp-tion spectra were recorded on a Hitachi U-3000 spectrophotometer.
The absorption spectra of all samples were measured in a 10.0 mmpath length quartz cuvette with a volume of 3.5 mL. Fluorescencespectroscopic studies were acquired on a Hitachi F-7000 spectro-photometer. The slit width was 5.0 nm for both excitation andemission and the photon multiplier voltage was 600 V.
2.3. Synthesis of 4-nitro-7-thiocyanatobenz-2-oxa-1,3-diazole(NBD-SCN)
A modification of the synthetic procedure of NBD-SCN (Ghosh,1968) was employed. To a solution of 4-chloro-7-nitrobenz-2-oxa-1,3-diazole (NBD-Cl, 501.2 mg, 2.5 mmol) in methanol (25 mL),sodium thiocyanate (1015.5 mg, 12.5 mmol) was added, the mix-ture was stirred for 3.5 h at room temperature and monitored byTLC until the consumption of the starting materials. Then, thesolvent was removed in vacuum and the residue was subjected tocolumn chromatography for purification to obtain the targetingcompound as a yellow powder (223.5 mg, 40.2%). IR (KBr, cm�1)2166.5 (SCRN), 1533.6 and 1334.2 (NO2). 1H NMR (400 MHz,CD3OD): δ 8.65 (d, J¼8 Hz, 1H), 8.02 (d, J¼7.6 Hz, 1H) ppm; 13CNMR (100 MHz, CD3OD): δ 150.14, 144.23, 131.86, 131.18, 126.03,107.23 ppm; EI-MS, calcd for C7H2N4O3S: 221.9; found: m/z 221.9(Mþ). Anal. Calcd for C7H2N4O3S: N, 25.22; C, 37.84; H, 0.91;S, 14.43; found: N, 25.90; C, 38.25; H, 0.88; S, 14.53.
2.4. Reaction of NBD-SCN with Cys/Hcy
A solution of cysteine (39.5 mg, 0.225 mmol) in 1 mL H2O wasadded into a solution of NBD-SCN (50 mg, 0.225 mmol) in 10 mMHEPES with 1% CH3OH. The mixture was stirred for 1 h at roomtemperature and monitored by TLC until the consumption of thestarting materials. Then, the solution was subjected to columnchromatography for purification to obtain the product. The pro-duct was characterized by 1H NMR and ESI-MS. 1H NMR (400 MHz,CD3OD): δ 8.58 (d, J¼8 Hz, 1H), 7.67 (d, J¼8 Hz, 1H), 4.45 (t,J¼6 Hz, 1H), 4.05–3.88 (m, 2H) ppm; ESI-MS, calcd for C9H8N4O5S:284.02; found: 285.1.
A similar procedure was performed in the reaction of NBD-SCNwith Hcy and GSH. For the reaction product of NBD-SCN and Hcy:1H NMR (400 MHz, CD3OD): δ 8.56 (d, J¼8 Hz, 1H), 7.52(d, J¼8 Hz, 1H), 4.12 (t, J¼6.4 Hz, 1H), 3.64–3.46 (m, 2H), 2.52–2.31 (m, 2H) ppm; ESI-MS, calcd for C10H10N4O5S: 298.04; found:299.1. For the reaction product of NBD-SCN and GSH: 1H NMR(400 MHz, CD3OD): δ 8.54 (d, J¼7.9 Hz, 1H), 7.62 (d, J¼7.9 Hz, 1H),4.87 (t, J¼7.2 Hz 1H), 4.01–3.92 (m, 3H), 3.88 (dd, J¼13.9, 5.4 Hz,1H), 3.58 (dd, J¼13.9, 8.5 Hz, 1H), 2.56 (t, J¼7.2, 2H), 2.21(dt, J¼15.3, 7.6 Hz, 2H) ppm; ESI-MS, calcd for C10H10N4O5S:470.09; found: 471.2.
2.5. General procedure of UV–vis and fluorescence spectrameasurement
For the time-dependent fluorescence response study, the Cysand Hcy aqueous solutions (1.0 mM, 30 μL) were added into theNBD-SCN solutions (5 μM, 3 mL) and were measured the fluores-cence intensity under the time scan mode immediately. All of thefluorescence spectra were measured at 550 nm with excitationwavelength at 476 nm.
For the concentration-dependent fluorescence response study,appropriate volumes and concentrations of Cys and Hcy aqueoussolution were added into the NBD-SCN solution and then thefluorescence intensities were measured after 30 min mixing.
Y.-H. Chen et al. / Biosensors and Bioelectronics 56 (2014) 117–123118

2.6. Selectivity
Stock solutions of amino acids and anions (Ala, Arg, Asn, Asp,Cys, Gln, Glu, Gly, GSH, Hcy, His, Ile, Leu, Lys, Met, Phe, Pro, Ser, Thr,Trp, Tys, Val, Cystine, CH3COO� , SO4
2� , CO32� , HCO3
� , NO3� ,
SCN� , HS� and CN�) (1.0 mM) were prepared. Stock solutions ofNBD-SCN (0.5 mM) were also prepared in methanol. In theselectivity experiment, test solutions were prepared by diluting30 μL NBD-SCN stock solution with HEPES buffer (10 mM, pH 7.4)in cuvettes, and adding 2 equivalents of Cys/Hcy or 100 equiva-lents of other biologically relevant analytes. The absorption andemission spectra of test solutions were measured after the addi-tion of analyte for 30 min, respectively.
2.7. Detection limit
The limit of detection (LOD) was determined based on thefluorescence titration and was calculated by the following equa-tion (Joshi et al., 2009):
LOD¼ 3Sbi=a
where Sbi is the standard deviation of blank measurements and ais the slope between fluorescence intensity versus sample con-centration. To determine the standard deviation of blank, thefluorescence intensity of NBD-SCN was measured thrice.
2.8. pH stability
Solutions of 5 μM NBD-SCN in HEPES buffer (1% CH3OH) in thepH range of 6.0–8.3 were adjusted by HCl and NaOH solutions. Thefluorescence spectra of each solution were collected in a 3 mLcuvette. After mixing with 2 equivalents of Cys and Hcy for 30 min,the fluorescence spectra were measured again, respectively. Thefluorescence intensity was monitored at 550 nm.
2.9. Cell culture and fluorescence imaging
Raw 264.7 murine macrophage is organized from tumor ascitesinduced by intraperitoneal injection of Abselon Leukemia Virus(A-MuLV) in male mouse. Raw 264.7 murine macrophages wereobtained from the American Type Culture Collection (Manassas, VA).The cells were cultured in Dulbecco0s Modified Eagle Medium(DMEM) and supplemented with 10% fetal bovine serum (FBS), 1%sodium pyruvate and 1% MEM nonessential amino acids at 37 1C ina humidified 5% CO2 atmosphere. For imaging studies, Raw 264.7murine macrophages were plated into poly-D-lysine coated platescontaining 2 mL of DMEM, and incubated at 37 1C with 5% CO2.The cells were incubated with 5 μM NBD-SCN for 30 min and thensubjected to fluorescence microscope. For biothiols removedstudy, Raw 264.7 macrophages were pre-treated with 12.5 μMN-ethylmaleimide (NEM) for 30 min at 37 1C to remove intracel-lular thiols. After washing, the cells were incubated with 5 μMNBD-SCN for 30 min and then subjected to fluorescence micro-scope. Bright-field and fluorescence images were recorded on afluorescence microscope (IX71, Olympus) equipped with a 100 Wmercury lamp, excitation filter: 442.5–512.5 nm; emission filter:490–570 nm, and a color CCD camera system.
2.10. Confocal fluorescence imaging
For confocal fluorescence images study, Raw 264.7 macro-phages were seeded at a density of 2�105 cells/well on coverglasses (24�24 mm2) and grown for 24 h. The cells with orwithout 5 μM NBD-SCN incubation and 12.5 μM NEM treatmentwere fixed with 4% formaldehyde solution for 20 min at roomtemperature. Cell nuclei were stained with 40-6-diamidino-2-
phenylindole (DAPI). Cover glasses containing fixed cells weremounted in a mixture of PBS and glycerol (1:1) on a microscopeslide. The cells were observed using a laser scanning confocalimaging system (Olympus Fluoview 300) consisting of OlympusBX51 microscope and a 20 mW-output argon ion laser.
3. Results and discussion
3.1. Design and synthesis of the probe
The NBD-SCN was designed based on the electron withdrawingability of the groups attached. NBD-based molecules are commonICT type fluorophores for the design of sensing molecules. Forexample, 4-chloro-7-nitrobenz-2-oxa-1,3-diazole (NBD-Cl) can actas a fluorogenic reagent for amino acids and other amines (Ghoshand Whitehouse, 1968). The reactivity of NBD-Cl and NBD-SCNtoward the –NH2 group of amino acids are related to the electron-withdrawing characteristics of –Cl and –SCN groups. Chloride,possessing the more electron-withdrawing characteristic, canreact with both amino and thiol groups of amino acids whereasSCN, with the less electron-withdrawing characteristic, can reacttowards the thiol groups. Hence, NBD-SCN was designed in such away that the more electron-withdrawing �Cl group was replacedby a less electron-withdrawing group �SCN group. The probe wasobtained by reacting NBD-Cl with sodium thiocyanate in methanolwith 40.2% yield.
3.2. Proposed mechanism
As shown in Scheme 1, NBD-SCN can be activated by the4-nitro group and react with biothiol through the nucleophilicaromatic substitution to generate less fluorescent S-NBD-biothiolderivative (Whitehouse and Ghosh, 1968). The 7-S-cysteinyl-4-nitrobenz-2-oxa-1,3-diazole (S-NBD-Cys) and 7-S-homocystei-nyl-4-nitrobenz-2-oxa-1,3-diazole (S-NBD-Hcy) further convert tohighly fluorescent N-NBD-biothiol derivatives, 7-N-cysteinyl-4-nitrobenz-2-oxa-1,3-diazole (N-NBD-Cys) and 7-N-homocysteinyl-4-nitrobenz-2-oxa-1,3-diazole (N-NBD-Hcy), whereas glutathioneends with the formation of S-derivative, S-NBD-GSH. The intra-molecular S-N migration occurred in a five-membered/six-mem-bered ring in cysteine/homocysteine case whereas in glutathionemigration would involve an unfavorable ten-membered ring.(Birkett et al., 1970; Persson and Wilson, 1978; Price and Radda,1972). The corresponding products by the reaction of NBD-SCNwith Cys, Hcy, and GSH were synthesized, respectively. NMR andmass spectroscopic analysis of products supported the formationof NBD-biothiol derivatives. In order to confirm whether theproducts are either S-NBD-biothiol or N-NBD-biothiol, the com-pounds were subjected for thiol-disulfide exchange reaction toprove the presence of sulfhydryl group in the NBD-biothiolderivatives by using ESI-MS spectrometry. Addition of 2,20-dipyr-idyl sulfide in the NBD-Cys and NBD-Hcy solutions resulted inpeaks at m/z 393.9 and 407.9 which correspond to [N-NBD-Cys-S-PyþHþ] and [N-NBD-Hcy-S-PyþHþ], respectively (correspond-ing data were shown in Supporting information Scheme S1, Figs.S1 and S2). However, the corresponding peak for disulfide productin the NBD-GSH solutions was not found. These results revealedthat the corresponding products by the reaction of NBD-SCN withCys, Hcy, and GSH were N-NBD-Cys, N-NBD-Hcy, and S-NBD-GSH,respectively.
3.3. Fluorescence emission and UV–vis absorption of the probe
We proposed that the probe, NBD-SCN, will be non-fluorescentdue to the pull–pull nature of the two electron withdrawing
Y.-H. Chen et al. / Biosensors and Bioelectronics 56 (2014) 117–123 119
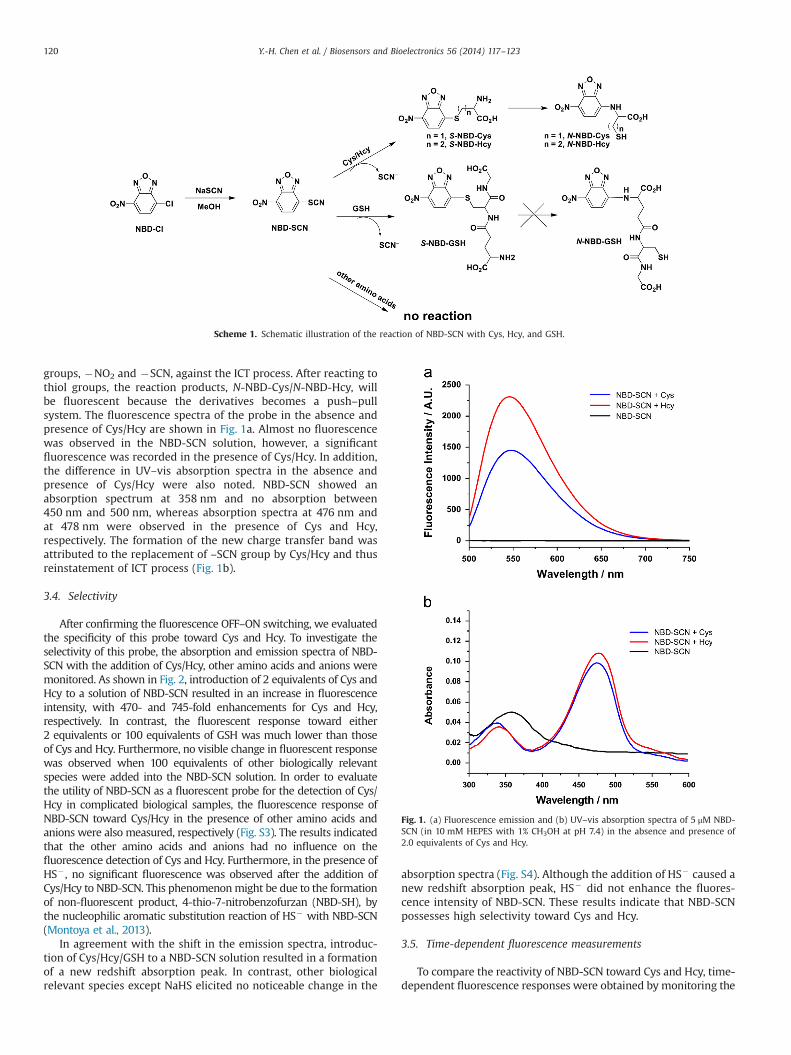
groups, �NO2 and �SCN, against the ICT process. After reacting tothiol groups, the reaction products, N-NBD-Cys/N-NBD-Hcy, willbe fluorescent because the derivatives becomes a push–pullsystem. The fluorescence spectra of the probe in the absence andpresence of Cys/Hcy are shown in Fig. 1a. Almost no fluorescencewas observed in the NBD-SCN solution, however, a significantfluorescence was recorded in the presence of Cys/Hcy. In addition,the difference in UV–vis absorption spectra in the absence andpresence of Cys/Hcy were also noted. NBD-SCN showed anabsorption spectrum at 358 nm and no absorption between450 nm and 500 nm, whereas absorption spectra at 476 nm andat 478 nm were observed in the presence of Cys and Hcy,respectively. The formation of the new charge transfer band wasattributed to the replacement of –SCN group by Cys/Hcy and thusreinstatement of ICT process (Fig. 1b).
3.4. Selectivity
After confirming the fluorescence OFF–ON switching, we evaluatedthe specificity of this probe toward Cys and Hcy. To investigate theselectivity of this probe, the absorption and emission spectra of NBD-SCN with the addition of Cys/Hcy, other amino acids and anions weremonitored. As shown in Fig. 2, introduction of 2 equivalents of Cys andHcy to a solution of NBD-SCN resulted in an increase in fluorescenceintensity, with 470- and 745-fold enhancements for Cys and Hcy,respectively. In contrast, the fluorescent response toward either2 equivalents or 100 equivalents of GSH was much lower than thoseof Cys and Hcy. Furthermore, no visible change in fluorescent responsewas observed when 100 equivalents of other biologically relevantspecies were added into the NBD-SCN solution. In order to evaluatethe utility of NBD-SCN as a fluorescent probe for the detection of Cys/Hcy in complicated biological samples, the fluorescence response ofNBD-SCN toward Cys/Hcy in the presence of other amino acids andanions were also measured, respectively (Fig. S3). The results indicatedthat the other amino acids and anions had no influence on thefluorescence detection of Cys and Hcy. Furthermore, in the presence ofHS� , no significant fluorescence was observed after the addition ofCys/Hcy to NBD-SCN. This phenomenonmight be due to the formationof non-fluorescent product, 4-thio-7-nitrobenzofurzan (NBD-SH), bythe nucleophilic aromatic substitution reaction of HS� with NBD-SCN(Montoya et al., 2013).
In agreement with the shift in the emission spectra, introduc-tion of Cys/Hcy/GSH to a NBD-SCN solution resulted in a formationof a new redshift absorption peak. In contrast, other biologicalrelevant species except NaHS elicited no noticeable change in the
absorption spectra (Fig. S4). Although the addition of HS� caused anew redshift absorption peak, HS� did not enhance the fluores-cence intensity of NBD-SCN. These results indicate that NBD-SCNpossesses high selectivity toward Cys and Hcy.
3.5. Time-dependent fluorescence measurements
To compare the reactivity of NBD-SCN toward Cys and Hcy, time-dependent fluorescence responses were obtained by monitoring the
Fig. 1. (a) Fluorescence emission and (b) UV–vis absorption spectra of 5 μM NBD-SCN (in 10 mM HEPES with 1% CH3OH at pH 7.4) in the absence and presence of2.0 equivalents of Cys and Hcy.
Scheme 1. Schematic illustration of the reaction of NBD-SCN with Cys, Hcy, and GSH.
Y.-H. Chen et al. / Biosensors and Bioelectronics 56 (2014) 117–123120

fluorescence changes of the mixture of NBD-SCN and 2 equivalents ofCys and Hcy, respectively. In the case of Cys, the reaction rate was fastand the reaction completed within 20 s whereas in the case of Hcy,it took 10min for its fluorescence intensity to reach a plateau (Fig. 3).This may be attributed to the diverse S to N transfer rate of thereaction products. The conversion of S-NBD-Cys to N-NBS-Cys wasvery fast due to the formation of a favorable five-membered ringduring S to N transfer whereas the conversion of S-NBD-Hcy to N-NBS-Hcy was expected to be very slow during S to N transfer and hence thereaction rate with Hcy is found to be slow (Birkett et al., 1970; Perssonand Wilson, 1978; Price and Radda, 1972).
3.6. Concentration-dependence of NBD-SCN with cysteineand homocysteine
The sensitivity of NBD-SCN was then studied by fluorescenceresponse of the probe toward Cys and Hcy. Different equivalents ofCys and Hcy were added to the NBD-SCN solutions (5 μM, 10 mMHEPES, pH 7.4) and the fluorescence spectra of the mixed solutionswere measured (Fig. 4). In the absence of Cys, NBD-SCN showedalmost no fluorescence in HEPES buffer. Upon addition of differentamounts of Cys, the fluorescence intensity at 550 nm increased withincreasing equivalents of Cys (Fig. 4a). When the fluorescenceintensity of the mixture at 550 nm was plotted against 0–1.25equivalents of Cys, a calibration curve with a good linearity wasobtained (R2¼0.9955; Fig. 4a, inset). A similar fluorescence responsewas observed when different amounts of Hcy were added into NBD-SCN solution. The concentration-dependent fluorescence enhance-ment showed a good linearity (R2¼0.9945; Fig. 4b, inset) in therange of 0–1.0 equivalents of Hcy.
The detection limits of Cys and Hcy obtained from the calibra-tion curve were 2.99 and 1.43 nM, respectively, which wascomparable with other reported thiols probes (Table S1) (Leunget al., 2013; Liu et al., 2013; Wang et al., 2012b; Zhang et al., 2012c;Zhou et al., 2012). These results indicate that NBD-SCN is asensitive probe for Cys and Hcy.
3.7. Stability of NBD-SCN in various pH
To be useful in biological applications, the probe should befunctional at physiological pH values. Therefore, the fluorescence
intensities of NBD-SCN in the absence and presence of Cys and Hcywere measured over various pH values. In the absence of Cys/Hcy,almost no change in fluorescence intensity for NBD-SCN was
Fig. 2. Specificity of NBD-SCN for Cys/Hcy over other amino acids and other species. Fluorescence intensities of 5 μMNBD-SCN (in 10 mM HEPES with 1% CH3OH at pH 7.4) atλem¼550 nmwas plotted versus substances: 2 equivalents of (1) Cys, (2) Hcy, (3) GSH; 100 equivalents of (4) GSH, (5) Ala, (6) Arg, (7) Asn, (8) Asp, (9) Gln, (10) Glu, (11) Gly,(12) His, (13) Ile, (14) Leu, (15) Lys, (16) Met, (17) Phe, (18) Pro, (19) Ser, (20) Thr, (21) Trp, (22) Tys, (23) Val, (24) cystine, (25) CH3COONa, (26) Na2SO4, (27) Na2CO3, (28)NaHCO3, (29) NaNO3, (30) NaSCN, (31) NaHS, (32) TBACN. All data were measured after 30 min addition substances at 25.070.1 1C.
Fig. 3. Time-dependent fluorescence response of 5 μM NBD-SCN (in 10 mM HEPESwith 1% CH3OH at pH 7.4) at 550 nm in the presence of 2 equivalents of (a) Cys and(b) Hcy.
Y.-H. Chen et al. / Biosensors and Bioelectronics 56 (2014) 117–123 121

observed in the pH 6.0–8.3 range. When Cys/Hcy was added toNBD-SCN, strong fluorescence was detected in this pH range. Theresults indicate that NBD-SCN responded to Cys/Hcy under phy-siological conditions (Fig. S5).
3.8. Fluorescence images of intracellular biothiols
To test the practical utility of NBD-SCN for cell imaging, Raw264.7 macrophages was used (Fig. 5). Significant fluorescence wasobserved when Raw 264.7 cells were incubated with NBD-SCN(5 μM) for 30 min at 37 1C (Fig. 5d). When Raw 264.7 cells werepre-treated with N-ethylmaleimide (NEM, a thiol trapping reagent,12.5 μM) for 30 min and then treated with NBD-SCN (5 μM, for30 min) the fluorescence intensity in Raw 264.7 cells decreaseddramatically because intracellular concentration of thiols isreduced by NEM (Fig. 5f). The cell permeability of NBD-SCN wasfurther confirmed by confocal fluorescent images (Fig. S6). Theseresults suggest that NBD-SCN could be applied in intracellularbiothiols detection.
4. Conclusions
In summary, a fluorescent probe, NBD-SCN, with a one-stepsynthetic procedure for detection of Cys and Hcy is reported in thisstudy. This probe exhibits high sensitivity, high selectivity, and lowdetection limit to Cys and Hcy. A great linearity relation betweenthe fluorescence intensities and Cys/Hcy concentrations maycontribute quantitative measurement of Cys/Hcy through fluores-cent method. We also proved that this probe could be applied todetect Cys/Hcy in live cells. The success of intracellular imagingindicates that this probe could be employed in further biologicalapplications.
Fig. 4. Fluorescence response spectra of 5 μM NBD-SCN (in 10 mM HEPES with 1%CH3OH at pH 7.4) upon reacting with different equivalents of (a) Cys and (b) Hcy.Excitation wavelength is 476 nm. Inset: plot of fluorescence intensity at 550 nmversus Cys/Hcy concentration.
Fig. 5. Bright-field (top) and fluorescence (bottom) images of Raw 264.7 macrophages in the absence (a and b) and presence (c and d) of NBD-SCN (5 μM). e and f representbright-field and fluorescence images of Raw 264.7 macrophages which were pre-treated with NEM (12.5 μM) for 30 min and then incubated with NBD-SCN for 30 min,respectively. The scale bar represents 50 μm.
Y.-H. Chen et al. / Biosensors and Bioelectronics 56 (2014) 117–123122
Acknowledgments
This work was supported by the National Science Council ofTaiwan (NSC101-2627-M-009-006) and DOH102-TD-C-111-002from the Ministry of Health and Welfare. National Chiao TungUniversity and the Ministry of Education of Taiwan (Aim for theTop University Plan).
Appendix A. Supplementary material
Supplementary data associated with this article can be found inthe online version at http://dx.doi.org/10.1016/j.bios.2014.01.009.
References
Ball, R.O., Courtney-Martin, G., Pencharz, P.B., 2006. J. Nutr. 136, 1682s–1693s.Birkett, D.J., Price, N.C., Radda, G.K., Salmon, A.G., 1970. FEBS Lett. 6, 346–348.Bouffard, J., Kim, Y., Swager, T.M., Weissleder, R., Hilderbrand, S.A., 2008. Org. Lett.
10, 37–40.Chen, S., Tian, J.N., Jiang, Y.X., Zhao, Y.C., Zhang, J.N., Zhao, S.L., 2013. Anal. Chim.
Acta 787, 181–188.Chen, W., Zhao, Y., Seefeldt, T., Guan, X., 2008. J. Pharm. Biomed. Anal. 48, 1375–1380.Chen, X., Zhou, Y., Peng, X.J., Yoon, J., 2010. Chem. Soc. Rev. 39, 2120–2135.Das, P., Mandal, A.K., Chandar, N.B., Baidya, M., Bhatt, H.B., Ganguly, B., Ghosh, S.K.,
Das, A., 2012. Chem. Eur. J. 18, 15382–15393.Fujikawa, Y., Urano, Y., Komatsu, T., Hanaoka, K., Kojima, H., Terai, T., Inoue, H.,
Nagano, T., 2008. J. Am. Chem. Soc. 130, 14533–14543.Ghosh, P.B., 1968. J. Chem. Soc. B Phys. Org., 334–338Ghosh, P.B., Whitehouse, M.W., 1968. Biochem. J. 108, 155–156.Guo, X.F., Zhu, H., Wang, H., Zhang, H.S., 2013. J. Sep. Sci. 36, 658–664.Han, B.Y., Yuan, J.P., Wang, E.K., 2009. Anal. Chem. 81, 5569–5573.Heafield, M.T., Fearn, S., Steventon, G.B., Waring, R.H., Williams, A.C., Sturman, S.G.,
1990. Neurosci. Lett. 110, 216–220.Hong, R., Han, G., Fernandez, J.M., Kim, B.J., Forbes, N.S., Rotello, V.M., 2006. J. Am.
Chem. Soc. 128, 1078–1079.Huang, H., Shi, F.P., Li, Y.A., Niu, L., Gao, Y., Shah, S.M., Su, X.G., 2013. Sens. Actuator
B-Chem. 178, 532–540.Huo, F.J., Sun, Y.Q., Su, J., Chao, J.B., Zhi, H.J., Yin, C.X., 2009. Org. Lett. 11, 4918–4921.Huo, F.J., Sun, Y.Q., Su, J., Yang, Y.T., Yin, C.X., Chao, J.B., 2010. Org. Lett. 12,
4756–4759.Ivanova, A.R., Nazimovb, I.V., Baratovaa, L.A., 2000. J. Chromatogr. A 870, 433–442.Jacobsen, D.W., 1998. Clin. Chem. 44, 1833–1843.Joshi, B.P., Park, J., Lee, W.I., Lee, K.H., 2009. Talanta 78, 903–909.Jung, H.S., Han, J.H., Pradhan, T., Kim, S., Lee, S.W., Sessler, J.L., Kim, T.W., Kang, C.,
Kim, J.S., 2012. Biomaterials 33, 945–953.Lee, J.H., Lim, C.S., Tian, Y.S., Han, J.H., Cho, B.R., 2010. J. Am. Chem. Soc. 132,
1216–1217.Leung, K.H., He, H.Z., Ma, V.P.Y., Chan, D.S.H., Leung, C.H., Ma, D.L., 2013. Chem.
Commun. 49, 771–773.Lin, W.Y., Yuan, L., Cao, Z.M., Feng, Y.M., Long, L.L., 2009. Chem. Eur. J. 15,
5096–5103.Liu, G.L., Feng, Q., Mu, X.Y., Zheng, W.J., Chen, T.F., Qib, L., Li, D., 2013. J. Mater. Chem.
B 1, 2128–2131.Lord, S.J., Lee, H.-l.D., Samuel, R., Weber, R., Liu, N., Conley, N.R., Thompson, M.A.,
Twieg, R.J., Moerner, W.E., 2010. J. Phys. Chem. B 114, 14157–14167.Ma, Y., Liu, S.J., Yang, H.R., Wu, Y.Q., Yang, C.J., Liu, X.M., Zhao, Q., Wu, H.Z., Liang, J.C.,
Li, F.Y., Huang, W., 2011. J. Mater. Chem. 21, 18974–18982.MacCoss, M.J., Fukagawa, A.K., Matthews, D.E., 1999. Anal. Chem. 71, 4527–4533.Madhu, S., Gonnade, R., Ravikanth, M., 2013. J. Org. Chem. 78, 5056–5060.
Montoya, L.A., Pearce, T.F., Hansen, R.J., Zakharov, L.N., Pluth, M.D., 2013. J. Org.Chem. 78, 6550–6557.
Murale, D.P., Kim, H., Choi, W.S., Churchill, D.G., 2013. Org. Lett. 15, 3630–3633.Niu, L.Y., Guan, Y.S., Chen, Y.Z., Wu, L.Z., Tung, C.H., Yang, Q.Z., 2012. J. Am. Chem.
Soc. 134, 18928–18931.Nolina, T.D., McMenaminc, M.E., Himmelfarba, J., 2007. J. Chromatogr. B 852,
554–561.Nygard, O., Nordrehaug, J.E., Refsum, H., Ueland, P.M., Farstad, M., Vollset, S.E., 1997.
N. Engl. J. Med. 337, 230–236.Ogasawaraa, Y., Mukaib, Y., Togawac, T., Suzukic, T., Tanabec, S., Ishiia, K., 2007.
J. Chromatogr. B 845, 157–163.Persson, A., Wilson, I.B., 1978. Anal. Biochem. 89, 408–413.Price, N.C., Radda, G.K., 1972. In: Akeson, A., Ehrenburg, A. (Eds.), Structure and
Function of Oxidation-Reduction Enzymes. Pergamon Press, Oxford and NewYork, pp. 161–169
Rafii, M., Elangoa, R., Courtney-Martina, G., Housec, J.D., Fisherd, L., Pencharza, P.B.,2007. Anal. Biochem. 371, 71–81.
Salimi, A., Hallaj, R., 2005. Talanta 66, 967–975.Salimi, A., Pourbeyram, S., 2003. Talanta 60, 205–214.Sass, J.O., Endres, W., 1997. J. Chromatogr. A 776, 342–347.Schulz, J.B., Lindenau, J., Seyfried, J., Dichgans, J., 2000. Eur. J. Biochem. 267,
4904–4911.Seshadri, S., Beiser, A., Selhub, J., Jacques, P.F., Rosenberg, I.H., D’Agostino, R.B.,
Wilson, P.W.F., Wolf, P.A., 2002. N. Engl. J. Med. 346, 476–483.Shahrokhian, S., 2001. Anal. Chem. 73, 5972–5978.Shao, J., Guo, H., Ji, S., Zhao, J., 2011. Biosens. Bioelectron. 26, 3012–3017.Shao, J.Y., Sun, H.Y., Guo, H.M., Ji, S.M., Zhao, J.Z., Wu, W.T., Yuan, X.L., Zhang, C.L.,
James, T.D., 2012. Chem. Sci. 3, 1049–1061.Sun, Y.Q., Chen, M.L., Liu, J., Lv, X., Li, J.F., Guo, W., 2011. Chem. Commun. 47,
11029–11031.Tang, B., Xing, Y.L., Li, P., Zhang, N., Yu, F.B., Yang, G.W., 2007. J. Am. Chem. Soc. 129,
11666–11667.Tanga, X., Liua, Y., Houb, H., You, T., 2010. Talanta 80, 2182–2186.Uchiyama, S., Santa, T., Fukushima, T., Homma, H., Imai, K., 1998. J. Chem. Soc. Perk.
Trans. 2, 2165–2173.Wada, M., Hirose, M., Kuroki, M., Ikeda, R., Sekitani, Y., Takamura, N., Kuroda, N.,
Nakashima, K., 2013. Biomed. Chromatogr. 27, 708–713.Wang, H.L., Zhou, G.D., Gai, H.W., Chen, X.Q., 2012a. Chem. Commun. 48,
8341–8343.Wang, Z., Han, D.M., Jia, W.P., Zhou, Q.Z., Deng, W.P., 2012b. Anal. Chem. 84,
4915–4920.Whitehouse, M.W., Ghosh, P.B., 1968. Biochem. Pharmacol. 17, 158–161.Wood, Z.A., Schroder, E., Harris, J.R., Poole, L.B., 2003. Trends Biochem. Sci. 28,
32–40.Yana, B., Stonera, D.L., Scott, J.R., 2007. Talanta 72, 634–641.Yang, X., Guo, Y., Strongin, R.M., 2011. Angew. Chem. Int. Ed. 50, 10690–10693.Yang, Y.T., Huo, F.J., Yin, C.X., Zheng, A.M., Chao, J.B., Li, Y.Q., Nie, Z.X., Martínez-
Máñez, R., Liu, D.S., 2013. Biosens. Bioelectron. 47, 300–306.Yi, L., Li, H.Y., Sun, L., Liu, L.L., Zhang, C.H., Xi, Z., 2009. Angew. Chem. Int. Ed. 48,
4034–4037.Yin, C.X., Huo, F.J., Zhang, J.J., Martínez-Máñez, R., Yang, Y.T., Lv, H.G., Li, S.D., 2013.
Chem. Soc. Rev. 42, 6032–6059.Zhang, H.T., Wang, P., Yang, Y.X., Sun, H.Y., 2012a. Chem. Commun. 48,
10672–10674.Zhang, M., Wu, Y., Zhang, S., Zhu, H., Wu, Q., Jiao, L., Hao, E., 2012b. Chem. Commun.
48, 8925–8927.Zhang, M., Yu, M.X., Li, F.Y., Zhu, M.W., Li, M.Y., Gao, Y.H., Li, L., Liu, Z.Q., Zhang, J.P.,
Zhang, D.Q., Yi, T., Huang, C.H., 2007. J. Am. Chem. Soc. 129, 10322–10323.Zhang, R., Yu, X., Ye, Z., Wang, G., Zhang, W., Yuan, J., 2010. Inorg. Chem. 49,
7898–7903.Zhang, S.Y., Ong, C.N., Shen, H.M., 2004. Cancer Lett. 211, 175–188.Zhang, W., Zhang, R., Zhang, J., Ye, Z., Jin, D., Yuan, J., 2012c. Anal. Chim. Acta 740,
80–87.Zhou, X., Jin, X., Sun, G., Li, D., Wu, X., 2012. Chem. Commun. 48, 8793–8795.
Y.-H. Chen et al. / Biosensors and Bioelectronics 56 (2014) 117–123 123