Biosensors and Bioelectronics - CORE · PDF fileContents lists available at ScienceDirect...
8
Contents lists available at ScienceDirect Biosensors and Bioelectronics journal homepage: www.elsevier.com/locate/bios Gold aggregating gold: A novel nanoparticle biosensor approach for the direct quantification of hepatitis C virus RNA in clinical samples Sherif M. Shawky a,b,c , Ahmed M. Awad a , Walaa Allam a , Mohamed H. Alkordi d , Sherif F. EL-Khamisy a,b, ⁎ a Center of Genomics, Helmy institute, Zewail City of Science and Technology, Sheikh Zayed Dist., 12588 Giza, Egypt b Krebs Institute, Department of Molecular Biology and Biotechnology, University of Sheffield, Sheffield S10 2TN, UK c Misr University for Science and Technology, Faculty of Pharmacy, Biochemistry Department, Giza, Egypt d Center for Materials Science, Zewail City of Science and Technology, Sheikh Zayed Dist., 12588 Giza, Egypt ARTICLE INFO Keywords: HCV Nucleic acid Gold nanoparticles RNA detection DNA repair Topoisomerase ABSTRACT The affordable and reliable detection of Hepatitis C Virus (HCV) RNA is a cornerstone in the management and control of infection, affecting approximately 3% of the global population. However, the existing technologies are expensive, labor intensive and time consuming, posing significant limitations to their wide-scale exploitation, particularly in economically deprived populations. Here, we utilized the unique optical and physicochemical properties of gold nanoparticles (AuNPs) to develop a novel assay platform shown to be rapid and robust in sensing and quantifying unamplified HCV RNA in clinical samples. The assay is based on inducing aggregation of citrate AuNPs decorated with a specific nucleic acid probe. Two types of cationic AuNPs, cysteamine and CTAB capped, were compared to achieve maximum assay performance. The technology is simple, rapid, cost effective and quantitative with 93.3% sensitivity, high specificity and detection limit of 4.57 IU/μl. Finally, our data suggest that RNA folding impact the aggregation behavior of the functionalized AuNPs, with broader applications in other nucleic acid detection technologies. 1. Introduction Approximately 3% of the world population are infected with hepatitis C virus (HCV) with 3–4 million infections annually and at least 150 million chronic carriers at risk of developing liver cirrhosis and/or liver cancer (WHO, 2016). It was estimated that more than 15% of the Egyptian population are currently infected with HCV (Hajarizadeh et al., 2013; Mauss et al., 2013) with almost half million new cases arising annually. The infection usually progresses to fatty liver and hepatocellular carcinoma, posing significant health and economic challenges to the society (Miller and Abu-Raddad, 2010). Since an approved vaccination against HCV is yet to be established (Lee et al., 2015; WHO, 2016), the prime combating strategies rely on newly developed medications coupled to robust and affordable means of viral detection and quantification (AASLD-IDSA, 2016; Seifert et al., 2015). HCV diagnosis is achieved by serologic and Nucleic Acid Testings (NATs) (Scott and Gretch, 2007). A major drawback of the serological approach is the inability to detect acute infections (Cloherty et al., 2016) and the associated complications of immuno-suppression pa- tients (Atrah and Ahmed, 1996; Mauss et al., 2013). NATs are based mainly on Real-Time RT-PCR, branched- DNA (b-DNA), and tran- scription-mediated Amplification (TMA). NATs are relatively expen- sive, labor intensive, and require adequately equipped labs, posing significant limitations to their point of care testing. Thus, alternative approaches for HCV RNA detection and quantification are urgently needed. The unique optical properties of gold nanoparticles (AuNPs), were originated from their strong Surface Plasmon Resonance (SPR) phe- nomena, which is responsible for their intense colors, and high extinction coefficient compared to conventional dyes (Huang et al., 2007a). Thus, AuNPs have been employed in many colorimetric assays for different biological molecules as proteins (Kim et al., 2009), and nucleic acids (Liandris et al., 2009). For example, Mirkin and co- workers were the first to develop a modified AuNPs cross-linking method for the direct detection of nucleic acids (Elghanian et al., 1997; Larguinho et al., 2015). Despite the high sensitivity and specificity of this method, it requires firm temperature control for precise target detection. To our knowledge, this method has not been used for nucleic acids detection clinically. Li and co-workers developed a method for the direct detection of nucleic acids using unmodified AuNPs (Li and http://dx.doi.org/10.1016/j.bios.2016.11.001 Received 29 August 2016; Received in revised form 30 October 2016; Accepted 1 November 2016 ⁎ Corresponding author at: Krebs and Sheffield Institutes for Nucleic Acids, Department of Molecular Biology and Biotechnology, University of Sheffield, Sheffield S10 2TN, UK. E-mail address: s.el-khamisy@sheffield.ac.uk (S.F. EL-Khamisy). Biosensors and Bioelectronics xx (xxxx) xxxx–xxxx 0956-5663/ © 2016 The Author(s). Published by Elsevier B.V. This is an open access article under the CC BY license (http://creativecommons.org/licenses/by/4.0/). Available online xxxx Please cite this article as: Shawky, S.M., Biosensors and Bioelectronics (2016), http://dx.doi.org/10.1016/j.bios.2016.11.001
Transcript of Biosensors and Bioelectronics - CORE · PDF fileContents lists available at ScienceDirect...

Contents lists available at ScienceDirect
Biosensors and Bioelectronics
journal homepage: www.elsevier.com/locate/bios
Gold aggregating gold: A novel nanoparticle biosensor approach for thedirect quantification of hepatitis C virus RNA in clinical samples
Sherif M. Shawkya,b,c, Ahmed M. Awada, Walaa Allama, Mohamed H. Alkordid,Sherif F. EL-Khamisya,b,⁎
a Center of Genomics, Helmy institute, Zewail City of Science and Technology, Sheikh Zayed Dist., 12588 Giza, Egyptb Krebs Institute, Department of Molecular Biology and Biotechnology, University of Sheffield, Sheffield S10 2TN, UKc Misr University for Science and Technology, Faculty of Pharmacy, Biochemistry Department, Giza, Egyptd Center for Materials Science, Zewail City of Science and Technology, Sheikh Zayed Dist., 12588 Giza, Egypt
A R T I C L E I N F O
Keywords:HCVNucleic acidGold nanoparticlesRNA detectionDNA repairTopoisomerase
A B S T R A C T
The affordable and reliable detection of Hepatitis C Virus (HCV) RNA is a cornerstone in the management andcontrol of infection, affecting approximately 3% of the global population. However, the existing technologies areexpensive, labor intensive and time consuming, posing significant limitations to their wide-scale exploitation,particularly in economically deprived populations. Here, we utilized the unique optical and physicochemicalproperties of gold nanoparticles (AuNPs) to develop a novel assay platform shown to be rapid and robust insensing and quantifying unamplified HCV RNA in clinical samples. The assay is based on inducing aggregationof citrate AuNPs decorated with a specific nucleic acid probe. Two types of cationic AuNPs, cysteamine andCTAB capped, were compared to achieve maximum assay performance. The technology is simple, rapid, costeffective and quantitative with 93.3% sensitivity, high specificity and detection limit of 4.57 IU/µl. Finally, ourdata suggest that RNA folding impact the aggregation behavior of the functionalized AuNPs, with broaderapplications in other nucleic acid detection technologies.
1. Introduction
Approximately 3% of the world population are infected withhepatitis C virus (HCV) with 3–4 million infections annually and atleast 150 million chronic carriers at risk of developing liver cirrhosisand/or liver cancer (WHO, 2016). It was estimated that more than 15%of the Egyptian population are currently infected with HCV(Hajarizadeh et al., 2013; Mauss et al., 2013) with almost half millionnew cases arising annually. The infection usually progresses to fattyliver and hepatocellular carcinoma, posing significant health andeconomic challenges to the society (Miller and Abu-Raddad, 2010).Since an approved vaccination against HCV is yet to be established (Leeet al., 2015; WHO, 2016), the prime combating strategies rely on newlydeveloped medications coupled to robust and affordable means of viraldetection and quantification (AASLD-IDSA, 2016; Seifert et al., 2015).
HCV diagnosis is achieved by serologic and Nucleic Acid Testings(NATs) (Scott and Gretch, 2007). A major drawback of the serologicalapproach is the inability to detect acute infections (Cloherty et al.,2016) and the associated complications of immuno-suppression pa-tients (Atrah and Ahmed, 1996; Mauss et al., 2013). NATs are based
mainly on Real-Time RT-PCR, branched- DNA (b-DNA), and tran-scription-mediated Amplification (TMA). NATs are relatively expen-sive, labor intensive, and require adequately equipped labs, posingsignificant limitations to their point of care testing. Thus, alternativeapproaches for HCV RNA detection and quantification are urgentlyneeded.
The unique optical properties of gold nanoparticles (AuNPs), wereoriginated from their strong Surface Plasmon Resonance (SPR) phe-nomena, which is responsible for their intense colors, and highextinction coefficient compared to conventional dyes (Huang et al.,2007a). Thus, AuNPs have been employed in many colorimetric assaysfor different biological molecules as proteins (Kim et al., 2009), andnucleic acids (Liandris et al., 2009). For example, Mirkin and co-workers were the first to develop a modified AuNPs cross-linkingmethod for the direct detection of nucleic acids (Elghanian et al., 1997;Larguinho et al., 2015). Despite the high sensitivity and specificity ofthis method, it requires firm temperature control for precise targetdetection. To our knowledge, this method has not been used for nucleicacids detection clinically. Li and co-workers developed a method for thedirect detection of nucleic acids using unmodified AuNPs (Li and
http://dx.doi.org/10.1016/j.bios.2016.11.001Received 29 August 2016; Received in revised form 30 October 2016; Accepted 1 November 2016
⁎ Corresponding author at: Krebs and Sheffield Institutes for Nucleic Acids, Department of Molecular Biology and Biotechnology, University of Sheffield, Sheffield S10 2TN, UK.E-mail address: [email protected] (S.F. EL-Khamisy).
Biosensors and Bioelectronics xx (xxxx) xxxx–xxxx
0956-5663/ © 2016 The Author(s). Published by Elsevier B.V. This is an open access article under the CC BY license (http://creativecommons.org/licenses/by/4.0/).Available online xxxx
Please cite this article as: Shawky, S.M., Biosensors and Bioelectronics (2016), http://dx.doi.org/10.1016/j.bios.2016.11.001

Rothberg 2004a, 2005). The technique is based on the adsorptionbehavior of single and double stranded nucleic acid onto AuNPs surfaceand the medium ionic strength. Despite its sensitivity and specificity, itrequires precise control of the probe, salt, and AuNPs concentrations.
The non-cross linking method was first introduced by Sato and co-workers (Sato et al., 2003), which is based on functionalizing AuNPswith single stranded thiol-modified probe. AuNPs aggregation is basedalso on the ionic strength of the medium. However, the desired results
Fig. 1. A scheme depicting the nano-assay principle and procedures. (1) Citrate capped AuNPs, was functionalized with thiolated HCV specific probe forming nanoprobes. (2) Thenanoprobe is then mixed with the RNA sample and heated at 95 °C for 3 min. (3) Right panel; the HCV viral RNA was hybridized to the HCV specific nanoprobe by sequencecomplimentarily. Left panel; no HCV RNA is present (non-specific RNA target), thus no hybridization takes place. The mixture incubated at room temperature. (4) The cationic AuNPswas added. (5) Right panel; in the presence of HCV RNA, the mixture solution remains red, reflecting the dispersion of the AuNPs onto the folded HCV RNA, thereby protecting thenanoprobes from aggregation by cationic AuNPs. Left panel; in the absence of a complementary target, the cationic AuNPs will bind to the probe phosphate backbone electrostatically,thereby reducing the inter-particle distance between the nanoprobes and the cationic AuNPs, resulting in aggregation and color change from red to blue. (For interpretation of thereferences to color in this figure legend, the reader is referred to the web version of this article).
S.M. Shawky et al. Biosensors and Bioelectronics xx (xxxx) xxxx–xxxx
2

are only achieved if the target is of the same length as the probe.Baptista and co-workers improved this technique to detect long nucleicacids; however it still depends on either high ionic strength or the pHto induce AuNPs aggregation (Baptista et al., 2008; Larguinho, Cantoet al., 2015).
Herein, we utilized positively charged gold nanoparticles (cystea-mine and CTAB AuNPs) to induce aggregation of citrate capped AuNPsdecorated with an HCV RNA specific probe (Graphical abstract andFig. 1). Our aim was to minimize the factors that may affect the outputresults, enhance the specificity, sensitivity and detection limit. Mostimportantly, this approach allowed us to achieve quantitative detectionof HCV RNA in clinical samples, in short time and with reasonable cost,and it could be easily adapted for full automation. Furthermore, thenano-assay was validated using other RNA transcripts extracted fromcell lines to illustrate its broad utility as a nucleic acid detectiontechnology.
2. Materials and methods
2.1. Chemicals and equipments
Hydrogen tetracloroaurate (III) trihydrate (HAuCl4·3H2O) ˃99%,Dithiothrietol, Dibasic and mono basic phosphate, Sodium dodecylsulfate (SDS), Sodium Chloride, Sodium borohydride,Hexadecyltrimethyl ammonium bromide (CTAB), Tri-sodium citratedehydrate, and Ribonuclease A were purchased from Sigma- Aldrich.Cysteamine (2-Mercaptoethylemine HCl ˃98% was purchased fromAcros Organics). SV-Total RNA isolation system was purchased fromPromega. Artus HCV RG RT-PCR Kit and QIAmp viral RNA kit werepurchased from Qiagen. RPMI-1640 medium, L-glutamine, Penicillin/streptomycin was purchased from Lonza, while fetal bovine serumfrom Gibco. NAP-5 columns (illustra NAP-5, GE Healthcare).
UV–vis spectra were recorded with Eppendorf Bio-spectrophot-ometer basic. A zetasizer ZC system (Malvern Instrument Ltd., Zetasizer Nano series, UK) was used for size and potential measurements.High resolution transmission electron microscope (HRTEM, JEM-2100) was used for imaging
2.2. Serum samples collection
Sample Collection was done following ethical approval and in-formed consent of all subjects. HCV infected serum samples werecollected (n=28), which included 23 samples with chronic HCVinfection and 5 samples with acute HCV infection. Healthy volunteersprovided 17 serum samples. Rapid HCV and Hepatitis B virus (HBV)antibody tests were performed for all samples. Only one sample wasHBV positive. Real-time PCR was conducted for all the samples usingArtus HCV RG RT-PCR Kit according to the manufacturers’ instruc-tions.
2.3. Synthesis, functionalization and characterization of citrateAuNPs and nanoprobes
Citrate AuNPs was prepared by the traditional sodium citratereduction method of Gold (III) chloride (Hill and Mirkin, 2006;Turkevich, 1985a, 1985b). Characterization was done usingTransmission Electron Microscope (TEM), UV–Vis. spectroscopy andDynamic light scattering (DLS). Citrate AuNPs were functionalizedwith each alkanethiol modified RNA target specific probe using wellknown salt aging process (Hurst et al., 2006). Functionalization of thealkanethiol probes was done exactly as described (Hill and Mirkin,2006). HCV specific probe is an antisense primer of 32 basescomplementary to the highly conserved region in the HCV RNA 5′-untranslated region (5′UTR) in almost all genotypes and subtypes. Theprobe (5′-TACCACAAGGCCTTTCGCGACCCAACACTACT’-3) was al-kane-thiol modified at its 5′-terminus. In parallel reactions, functio-
nalization was performed for Topoisomerase 1 & 2 (TOP1 and &TOP2), Tyrosyl- DNA phosphodiesterases 1 & 2 (TDP1 and TDP2)transcripts, by alkanethiol specific probes for each transcript extractedfrom Rectal Cancer carcinoma (RKOs) cell lines. Each transcriptspecific probe was functionalized to the AuNPs solution separately.
2.4. Synthesis and characterization of Cysteamine AuNPs
Cysteamine AuNPs were synthesized using sodium borohydridereduction method as described (Kim, Kim et al., 2009). CysteamineAuNPs was characterized using TEM, DLS, and spectrophotometri-cally.
2.5. Synthesis and characterization of CTAB AuNPs
CTAB AuNPs synthesis is generally performed following theestablished seed-mediated growth using two solutions (El-Sayedet al., 2006; Huang et al., 2007b; Li et al., 2013; Scarabelli et al.,2015). Herein, CTAB AuNPs was synthesized using only the seedsolution in a single-phase reaction without the growth solution. In atypical experiment, 3.7 ml of 0.2 M aqueous solution of CTAB wasmixed with 20 µl of 1 mM gold chloride under vigorous stirring at50 °C. Then, 1 ml of ice-cold 10 mM sodium borohydride was added inthree portions with 20 min intervals. Solution color was changed fromyellow to light brown after the first addition of the borohydride andcolor intensity increased after each addition. Stirring was continued for3 h at 50 °C and then stored at room temperature for 2 days at dark. Aclear pink-colored solution was obtained after two days, which isfollowed by characterization as described above for AuNPs.
2.6. HCV RNA extraction evaluation
HCV RNA extraction was performed using Promega SV-total RNAisolation system according to the modified HCV extraction manufac-turer's protocol (Otto et al., 1998). The QI-Amp Viral RNA kit was usedfor HCV RNA extraction to select the best RNA extraction kitcompatible with the nano-assay.
2.7. Cell lines and total RNA extraction
RKOs cancer cell lines (Homo sapiens, Tissue: colon, Carcinoma)were cultured at 37 °C and 5% CO2 in RPMI-1640 medium, supple-mented with 10% fetal bovine serum, 1% L-glutamine and 1%penicillin/streptomycin. Total RNA extraction was conducted usingPromega SV-total RNA isolation system following manufacture in-structions and each transcript was further purified by homemademagnetic nanoparticles as described previously (Eissa et al., 2014;Shawky et al., 2014), to enhance the purity of the extracted transcript.
2.8. Colorimetric/spectrophotometric AuNPs assay for RNA detection
The assay was performed by mixing 5 µl of nanoprobe with 10 µl ofRNA sample, heated at 95 °C for 3 min, incubated at room temperaturefor 5–10 min. Cationic AuNPs (10 µl) was then added to the solutionand mixed well. Solution color was developed immediately andobserved by naked eye while mixing. The color was stable for~30 min, depending on the RNA concentration. Solutions werescanned from 400 nm to 750 nm using spectrophotometer. To confirmthat the color change is due to RNA solely, the nano-assay wasperformed on two HCV positive samples before and after digestionwith Ribonuclease A enzyme. Each sample was divided into twoportions, one portion was treated with the enzyme by adding 10 µl of10 mg/ml Ribonuclease A to 35 µl of HCV RNA and then incubated for20 min at room temperature. After completion of the digestion process,the assay was performed on the Ribonuclease A treated sample and onthe mock-treated sample. The color of the two samples was then
S.M. Shawky et al. Biosensors and Bioelectronics xx (xxxx) xxxx–xxxx
3

observed and samples were also analyzed using TEM.
2.9. Quantification of HCV RNA using real-time RT-PCR and thedeveloped nano-assay
HCV RNA viral load was determined using Artus Qiagen HCV Real-time RT-PCR Kit, according to the manufacturer manual, for all serasamples. Quantification of HCV RNA using the nano-assay wasperformed by preparing serial dilutions of HCV RNA concentration(10–1200 IU/µl), and examined using the nano-assay. The spectralabsorbance for each concentration was scanned spectrophotometricallyin duplicate, and the ratio of the non-aggregated nanoparticles at λ530to the aggregated nanoparticles at λ650 (A530/ A650) was recorded andused to generate the standard curve, in which the A530/ A650 ratio wasplotted against the viral RNA log concentration. All HCV RNA samplesviral load were determined by the nano-assay using the generatedstandard curve, from their respective A530/ A650 ratios, using theequation generated by the standard curve.. The results were expressedin IU/µl and converted to IU/ml by (IU/µl *RNA elution volume in µl/serum volume in µl). Comparison between the developed nano-assayand the Real-Time RT-PCR viral load is shown in Table S1, andFig. 6c–f. Receiver operating characteristic curve (ROC curve) for thenano-assay was generated to determine the specificity, sensitivity, andthe detection limit (Table S2), using SPSS software (IBM, SPSSStatistics, version 20 package). Detection limit was further confirmedby performing serial dilutions of HCV sample till 1 IU/µl. Each dilutionwas tested by the nano-assay until aggregation occurred starting fromabout 4 IU/µl.
2.10. Nano-assay TEM analysis for positive, and HCV negativesamples, and Ribonuclease A treated sample before and afterdigestion
TEM analysis was conducted immediately after performing thenano-assay for both HCV positive and negative samples. Moreover, itwas performed on the Ribonuclease treated and mock-treated sampleas described in Section 2.8 to verify that RNA folding contributes tonanoprobe stability.
3. Results and discussion
3.1. Citrate AuNPs synthesis, functionalization and characterization
Citrate AuNPs morphology were characterized by TEM analysis. As-synthesized AuNPs were spherical and uniformly distributed withaverage diameter of ~20 nm (Fig. 2a) and average charge of −48 mv.Size and the charge were further measured using DLS (Fig. S1a and b).HCV nanoprobe was synthesized by functionalization of the CitrateAuNPs with the alkanethiol modified probe. Functionalization exploitsthe thiol group, which possesses a higher affinity to the gold surfacethan citrate, thereby forming a strong covalent bond (Xue et al., 2014),providing high stability to the nanoprobe against high salt, and positiveligands concentrations induced aggregation. TEM analysis of HCVnanoprobe revealed an increase in the citrate AuNPs from ~20 nm to~38 nm (Fig. 2b), which was confirmed by DLS with a correspondingreduction of surface charge from −48 mv to −27 mV (Fig. S2a and b).Spectrum of the as-synthesized AuNPs revealed a λmax at 520 nm, whilethat of the nanoprobe showed a slight red shift to 530 nm (Fig. 2c). Thered shift was accompanied by a noticeable absorption broadening uponcysteamine AuNPs induced aggregation of the nanoprobe (Fig. 2c).Molar concentration of AuNPs was calculated to be 4 nM with~2.436×10¹² nanoparticles per ml (Liu et al., 2007). Together, thesedata demonstrate proper conjugation of probes to the particles andconfirm the ability of cysteamine AuNPs to induce aggregation of thenanoprobe.
The probe amount and density conjugated to citrate AuNPs are
crucial for downstream applications. At high amount, steric hindranceat the AuNPs surface takes place, resulting in electrostatic repulsionbetween the target and the probe, and thus no hybridization takes place(Doria et al., 2010). It was estimated that ~1.44 nmol probes wereconjugated to the AuNPs. Accordingly, the amount of probes per onenanoparticle was ~120 oligonucleotides, which is in agreement withpreviously reported functionalization methods (Hurst et al., 2006).
3.2. Cysteamine and CTAB AuNPs synthesis and characterization
CTAB and cysteamine AuNPs morphology were characterized usingTEM (Fig. 3a and b, respectively). Cysteamine AuNPs was sphericaland uniformly distributed with an approximate size of 40 nm and aλmax of ~528 nm (Fig. 3c), with an average positive charge of +39. Theuniformity and charge were further assessed by DLS (Fig. S3a and b).The Molar concentration was calculated as described (Liu et al., 2007)and found to be ~0.5 nM with ~3.04×10¹¹ nanoparticles per ml. Thecharge and size of CTAB AuNPs were +100 mv and 30 nm, respectively(Fig. S4a and b). CTAB AuNPs extinction spectrum revealed one sharppeak in the visible region with λmax at 526 nm, suggesting sphericalnanoparticles with uniform size (Fig. 3c). However, their TEM analysis(Fig. 3a) showed core/shell like structure of many AuNPs coated withina shell. This is may be due to AuNPs seeds formation followed by theirinternalization within the CTAB micelle. We propose that synthesis ofCATB AuNPs from seed solution only is primarily affected by reagentconcentrations, especially the reductant to the gold precursor, whichwas increased by ~450 times, and the CTAB which was increased bytwo times, compared to conventional methods (Orendorff and Murphy,2006). Once the seeds are formed in the presence of the highconcentration of CTAB and reaction high temperature that stabilizedthe CTAB micelles and preserved the particles from aggregation, it ledto extra layers on the nanoparticles, which appeared as a shell likestructure (Fig. 3a). Moreover, the addition rate of the reductant (3times with 1 h intervals) and its high concentration led to completereduction of all the gold ion states to gold metal. Indeed, the highreaction temperature affects the final AuNPs shape and size (Scarabelliet al., 2015). Thus, the high temperature employed here and longgrowth time (2 days) led to further growth of the traditional seedparticles into bigger nanoparticles and prevented the CTAB moleculesfrom crystallization.
3.3. Selection of cysteamine AuNPs for the nano-assay
We noticed higher degree of aggregation and broader spectra ofCTAB-AuNPs than cysteamine-AuNPs when incubated with eitherHCV RNA or control samples (Fig. 4a). Spectral behavior of CTABAuNPs on HCV positive samples was closely similar to that producedwith monovalent or divalent cations in the conventional non-crosslinking assays (Conde et al., 2010). This is likely due to the highly stablepositively charged quaternary ammonium (NH4
+) cation, which ulti-mately increases false negative possibilities. Therefore, we decided touse cysteamine-AuNPs that are capable of acting as hydrogen bonddonors/acceptors towards the nanoprobe-HCV RNA. This also led toimproved color detection since CTAB AuNPs colors were fainter(Fig. 4b) compared to cysteamine AuNPs (Fig. 4c) in both positiveand negative samples.
3.4. Evaluation of different RNA extraction Kits
Total RNA Promega Kit was chosen for RNA extraction. Selection ofPromega Kit over the Qiagen viral RNA extraction kit was based on thatthe high rate of false positives recovered with the latter. This is likelydue to DNA contamination hence the kit was not designed to separateviral RNA from cellular DNA (Qiagen, 2014). The presence ofcirculating cell free DNA in the serum with high concentration alongwith some genomic DNA in the final product had negative impact on
S.M. Shawky et al. Biosensors and Bioelectronics xx (xxxx) xxxx–xxxx
4

assay performance, masking the nanoprobe from aggregation andincreases false positive outcomes. In contrast, Promega total RNAisolation kit includes a DNase treatment step, which eliminates DNAfrom the final product, providing pure RNA with reproducible results.
3.5. Factors affecting nano-assay performance
The nano-assay reproducibility, sensitivity and specificity areprimarily affected by (1) nanoprobe and cationic AuNPs concentrationand type, (2) pH of the reaction mixture, (3) temperature and (4) RNAfolding. The nanoprobe density of ~120 probes per small sized AuNPs~20 nm is known to improve its stability against aggregation andprovides acceptable amount for proper probe/RNA hybridization(Hurst, Lytton-Jean et al., 2006). Final nanoprobe and cationicAuNPs concentrations greatly affected the nano-assay final results.The expected outcome was observed when CATB AuNPs concentrationwas less than nanoprobe concentration. However, higher concentrationof CTAB AuNPs caused nanoprobes aggregation even in the presence ofthe RNA, likely due to the CTAB strong positively charged quaternaryammonium cation. In contrast, cysteamine AuNPs gave superiorresults regardless of the cysteamine AuNPs or nanoprobe concentra-tion. The best results obtained when cysteamine AuNPs was twice the
nanoprobe amount. Moreover, the spectrum of samples followingcysteamine AuNPs had sharp peaks and showed a clear differencebetween the positive and negative samples. This allowed a linearrelation to be devised and thus enabled quantitative detection ofRNA. In contrast, CTAB AuNPs spectra were not clear enough todifferentiate between different RNA concentrations and thus couldn'tbe used for quantitation. Comparison between the two cationic AuNPsregarding the absorption peaks and color intensity of the nano- assay isshown in Fig. 4a–c. Key to this enhanced performance is most likelythat cysteamine short molecular dimension, which allowed betterdistribution on the folded HCV RNA backbone.
Solution pH had no impact on the nano-assay as the CTAB AuNPsquaternary ammonium group is always positively charged regardless ofthe pH while the cysteamine protonated amino group positive chargepredominates from pH 9.3, which is way above the assay pH at 7.4. Thenon-pH dependency of our assay is superior to the non-cross linkingassays described previously where pH is a main player for assayperformance, especially in the target/mismatched probes (Sato et al.,2005). Therefore, using cationic AuNPs excludes the pH parameterfrom the assay. The last two parameters affecting assay performanceare reaction temperature and nucleic acid folding. Reaction tempera-ture highly affected the nano-assay. Immediate aggregation has
Fig. 2. Characterization of citrate-capped AuNPs. (a) A representative TEM image of the citrate-capped AuNPs (b) and of the nano-probe (c). The spectra of the citrate capped AuNPsshowing SPR λmax at approximately 520 nm. The nanoprobe showed a slight red shift to 530 nm with a decrease in the peak intensity indicating functionalization. Cysteamine AuNPsinduced aggregation of the nanoprobe spectrum was shown by brooding in its peak and the lack of SPR.
Fig. 3. Characterization of CTAB and Cysteamine AuNPs. (a) TEM image of CTAB AuNPs showing the nanoparticles appearing as clusters of small AuNPs surrounded or internalizedwithin a shell. (b) TEM image showing Cysteamine AuNPs. (c) The extinction spectra of the cysteamine AuNPs and CTAB AuNPs shows λmax of 528 and 526 nm; respectively.
S.M. Shawky et al. Biosensors and Bioelectronics xx (xxxx) xxxx–xxxx
5

occurred upon mixing the nanoprobe with the cationic AuNPs evenwith very high RNA concentrations. This is due to electrostaticinteraction affinity between the probes’ nitrogenous bases and thecitrate AuNPs, which prevents hybridization between the RNA targetand the probes (Li and Rothberg 2004b). A brief denaturation step wastherefore conducted for the nanoprobe/RNA mixture and prior to theaddition of the cationic AuNPs to allow accessibility of the probes to theRNA molecules (Larguinho et al., 2015), and thus allowing for theunfolding of the RNA tertiary structure and subsequent hybridizationwith its complementary probes. Incubation of the mixture at roomtemperature prior to the addition of the cationic AuNPs was essential.The time/temperature gap between heating and the addition of cationicAuNPs allowed for RNA hybridization to the probe and subsequentRNA re-folding to adopt its most thermodynamically stable form(Doerrbecker et al., 2013; El Awady et al., 2009).
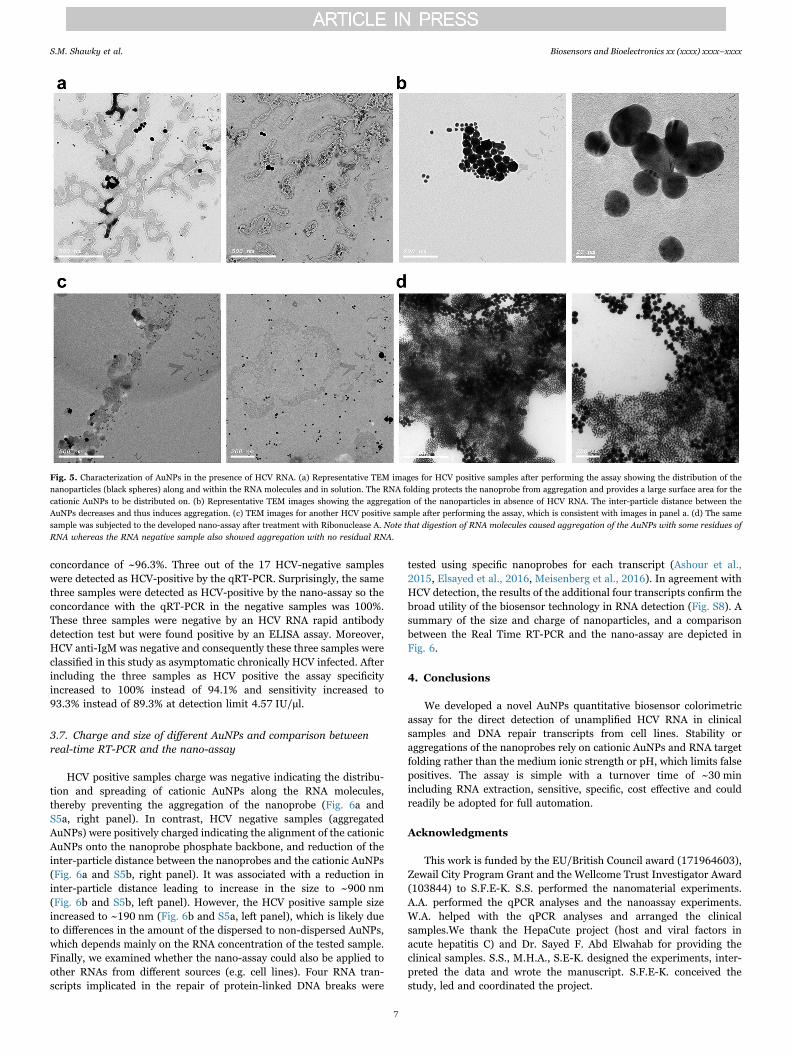
We propose RNA folding adaptation to coat the nanoprobe afterhybridization, resulting in multiple layers of RNA, thereby stabilizingthe nanoprobe. The shape adopted by the re-folded RNA is predicted togive high surface area for the cationic AuNPs to be distributed along theRNA molecules, preventing its interaction with the nanoprobe andpreserving their distribution. This notion was confirmed by comparingTEM results for HCV positive and negative samples (Fig. 5a and b). Tofurther validate the assay, HCV samples were re-analyzed with andwithout prior digestion with RNase A. In RNase A treated samples,aggregation of the AuNPs occurred, as was the case for negativesamples, indicating absence of RNA. In contrast, in mock treated
samples the stability of AuNPs was noticeable with a detectable redcolor (Fig. 4d), which was further confirmed by TEM (Fig. 5c and d).
3.6. Quantitative determination of HCV RNA in serum samples usingthe nano-assay
As the concentration of the RNA increased the nanoprobe λmax
height at wavelength 530 nm proportionally increased, representingthe non-aggregated AuNPs (dispersed nanoparticles, Fig. S6a). Theopposite occurred as the RNA concentration decreased, the nanoprobeλmax height declined with concomitant shift and broadness in the peakto a higher wavelength, indicating an increase in the aggregated AuNPspopulation (non-dispersed AuNPs). Thus, at high RNA concentrationthe ratio of the non-aggregated/aggregated is high, indicating thepredominance of the dispersed nanoprobes and their stability and viceversa. The standard curve (Fig. S6b) was plotted by recording thespectral absorbance at λ530/λ650 ratio against RNA log concentration.The plot showed a linear relation (Y=1.1143x+1.1066, R2=0.97). Allsample concentrations were calculated using the standard curve andratio described above. Also, some samples with different concentra-tions were plotted on the standard curve in Fig. S7, and a linearrelation has been obtained (Y=1.2008x+1.0055, R2=0.966). All sam-ples quantified by the nano-assay were compared to the gold standardReal-Time RT-PCR method for HCV quantification (Table S1). TheReal-Time RT-PCR revealed 27 out of the 28 as positive HCV samples,whereas the nano-assay revealed 26 out of 28 as positive with a
Fig. 4. Analyses of HCV clinical samples using cysteamine and CTAB AuNPs. (a) Extinction spectra of positive and negative HCV samples detected by the cysteamine and CTAB AuNPs.Note the difference in the peak intensity between the two cationic AuNPs used. Cysteamine AuNPs showed better SPR and well defined peak than the CTAB AuNPs. In contrast to CTABAuNPs, no significant difference between the SPR of cysteamine AuNPs in the positive sample compared to the nanoprobe peak was observed. (b) A representative photograph showingthe change in color using CTAB AuNPs biosensors. We note the faint colors of both the positive and negative samples. (c) A representative photograph showing the change in color usingcysteamine AuNPs biosensors. Note the brighter colors produced compared to CTAB AuNPs biosensors. (d) The assay was performed on HCV positive sample with and without theaddition of Ribonuclease A (RNase A). While the tube on the right showed faint red color indicating the presence of HCV RNA, the faint color is due to the sample was diluted beforephotographing, for proper comparing with the other tube. The RNase A treated tube on the left was nearly colorless indicating the absence of RNA. The difference in color confirms thatthe HCV RNA accounts for the stability of the AuNPs solution. (For interpretation of the references to color in this figure legend, the reader is referred to the web version of this article).
S.M. Shawky et al. Biosensors and Bioelectronics xx (xxxx) xxxx–xxxx
6
concordance of ~96.3%. Three out of the 17 HCV-negative sampleswere detected as HCV-positive by the qRT-PCR. Surprisingly, the samethree samples were detected as HCV-positive by the nano-assay so theconcordance with the qRT-PCR in the negative samples was 100%.These three samples were negative by an HCV RNA rapid antibodydetection test but were found positive by an ELISA assay. Moreover,HCV anti-IgM was negative and consequently these three samples wereclassified in this study as asymptomatic chronically HCV infected. Afterincluding the three samples as HCV positive the assay specificityincreased to 100% instead of 94.1% and sensitivity increased to93.3% instead of 89.3% at detection limit 4.57 IU/µl.
3.7. Charge and size of different AuNPs and comparison betweenreal-time RT-PCR and the nano-assay
HCV positive samples charge was negative indicating the distribu-tion and spreading of cationic AuNPs along the RNA molecules,thereby preventing the aggregation of the nanoprobe (Fig. 6a andS5a, right panel). In contrast, HCV negative samples (aggregatedAuNPs) were positively charged indicating the alignment of the cationicAuNPs onto the nanoprobe phosphate backbone, and reduction of theinter-particle distance between the nanoprobes and the cationic AuNPs(Fig. 6a and S5b, right panel). It was associated with a reduction ininter-particle distance leading to increase in the size to ~900 nm(Fig. 6b and S5b, left panel). However, the HCV positive sample sizeincreased to ~190 nm (Fig. 6b and S5a, left panel), which is likely dueto differences in the amount of the dispersed to non-dispersed AuNPs,which depends mainly on the RNA concentration of the tested sample.Finally, we examined whether the nano-assay could also be applied toother RNAs from different sources (e.g. cell lines). Four RNA tran-scripts implicated in the repair of protein-linked DNA breaks were
tested using specific nanoprobes for each transcript (Ashour et al.,2015, Elsayed et al., 2016, Meisenberg et al., 2016). In agreement withHCV detection, the results of the additional four transcripts confirm thebroad utility of the biosensor technology in RNA detection (Fig. S8). Asummary of the size and charge of nanoparticles, and a comparisonbetween the Real Time RT-PCR and the nano-assay are depicted inFig. 6.
4. Conclusions
We developed a novel AuNPs quantitative biosensor colorimetricassay for the direct detection of unamplified HCV RNA in clinicalsamples and DNA repair transcripts from cell lines. Stability oraggregations of the nanoprobes rely on cationic AuNPs and RNA targetfolding rather than the medium ionic strength or pH, which limits falsepositives. The assay is simple with a turnover time of ~30 minincluding RNA extraction, sensitive, specific, cost effective and couldreadily be adopted for full automation.
Acknowledgments
This work is funded by the EU/British Council award (171964603),Zewail City Program Grant and the Wellcome Trust Investigator Award(103844) to S.F.E-K. S.S. performed the nanomaterial experiments.A.A. performed the qPCR analyses and the nanoassay experiments.W.A. helped with the qPCR analyses and arranged the clinicalsamples.We thank the HepaCute project (host and viral factors inacute hepatitis C) and Dr. Sayed F. Abd Elwahab for providing theclinical samples. S.S., M.H.A., S.E-K. designed the experiments, inter-preted the data and wrote the manuscript. S.F.E-K. conceived thestudy, led and coordinated the project.
Fig. 5. Characterization of AuNPs in the presence of HCV RNA. (a) Representative TEM images for HCV positive samples after performing the assay showing the distribution of thenanoparticles (black spheres) along and within the RNA molecules and in solution. The RNA folding protects the nanoprobe from aggregation and provides a large surface area for thecationic AuNPs to be distributed on. (b) Representative TEM images showing the aggregation of the nanoparticles in absence of HCV RNA. The inter-particle distance between theAuNPs decreases and thus induces aggregation. (c) TEM images for another HCV positive sample after performing the assay, which is consistent with images in panel a. (d) The samesample was subjected to the developed nano-assay after treatment with Ribonuclease A. Note that digestion of RNA molecules caused aggregation of the AuNPs with some residues ofRNA whereas the RNA negative sample also showed aggregation with no residual RNA.
S.M. Shawky et al. Biosensors and Bioelectronics xx (xxxx) xxxx–xxxx
7

Appendix A. Supporting information
Supplementary data associated with this article can be found in theonline version at doi:10.1016/j.bios.2016.11.001.
References
AASLD-IDSA, 2016. Recommendations for testing, managing, and treating hepatitis C.AASLD-IDSA, USA. ⟨http://www.hcvguidelines.org/full-report/hcv-testing-and-linkage-care⟩ accessed, May 2016.
Ashour, M.E., Atteya, R., El-Khamisy, S.F., 2015. Nat. Rev. Cancer 15, 137–151.Atrah, H.I., Ahmed, M.M., 1996. J. Clin. Pathol. 49, 254–255.Baptista, P., Pereira, E., Eaton, P., Doria, G., Miranda, A., Gomes, I., Quaresma, P.,
Franco, R., 2008. Anal. Bioanal. Chem. 391, 943–950.Cloherty, G., Talal, A., Coller, K., Steinhart, C., Hackett, J., Jr., Dawson, G., Rockstroh, J.,
Feld, J., 2016. J. Clin. Microbiol. 54, 265–273.Conde, J., de la Fuente, J.M., Baptista, P.V., 2010. J. Nanobiotechnol. 8, 5.Doerrbecker, J., Meuleman, P., Kang, J., Riebesehl, N., Wilhelm, C., Friesland, M.,
Pfaender, S., Steinmann, J., Pietschmann, T., Steinmann, E., 2013. J. Viral Hepat.20, 478–485.
Doria, G., Baumgartner, B.G., Franco, R., Baptista, P.V., 2010. Colloids Surf. BBiointerfaces 77, 122–124.
Eissa, S., Shawky, S.M., Matboli, M., Mohamed, S., Azzazy, H.M., 2014. Clin. Biochem.47, 104–110.
El Awady, M.K., Azzazy, H.M., Fahmy, A.M., Shawky, S.M., Badreldin, N.G., Yossef, S.S.,Omran, M.H., Zekri, A.R., Goueli, S.A., 2009. World J. Gastroenterol. 15,1480–1486.
Elghanian, R., Storhoff, J.J., Mucic, R.C., Letsinger, R.L., Mirkin, C.A., 1997. Science277, 1078–1081.
El-Sayed, I.H., Huang, X., El-Sayed, M.A., 2006. Cancer Lett. 239, 129–135.Elsayed, W., El-Shafie, L., Hassan, M.K., Farag, M.A., El-Khamisy, S.F., 2016. Isoeugenol
is a selective potentiator of camptothecin cytotoxicity in vertebrate cells lackingTDP1. Scientific Reports 6, 1–10. http://dx.doi.org/10.1038/srep26626.
Hajarizadeh, B., Grebely, J., Dore, G.J., 2013. Nat. Rev. Gastroenterol. Hepatol. 10,553–562.
Hill, H.D., Mirkin, C.A., 2006. Nat. Protoc. 1, 324–336.Huang, K.S., Lin, Y.C., Su, K.C., Chen, H.Y., 2007a. Biomed. Microdevices 9, 761–768.
Huang, X., Jain, P.K., El-Sayed, I.H., El-Sayed, M.A., 2007b. Nanomedicine 2, 681–693.Hurst, S.J., Lytton-Jean, A.K., Mirkin, C.A., 2006. Anal. Chem. 78, 8313–8318.Kim, J.W., Kim, J.H., Chung, S.J., Chung, B.H., 2009. Analyst 134, 1291–1293.Larguinho, M., Canto, R., Cordeiro, M., Pedrosa, P., Fortuna, A., Vinhas, R., Baptista,
P.V., 2015. Expert Rev. Mol. Diagn. 15, 1355–1368.Lee, J., Conniff, J., Kraus, C., Schrager, S., 2015. Wis. Med. J. 114, 263–269.Li, C.M., Zhen, S.J., Wang, J., Li, Y.F., Huang, C.Z., 2013. Biosens. Bioelectron. 43,
366–371.Li, H., Rothberg, L., 2004a. Proc. Natl. Acad. Sci. USA 101, 14036–14039.Li, H., Rothberg, L.J., 2004b. J. Am. Chem. Soc. 126, 10958–10961.Li, H., Rothberg, L., 2005. Anal. Chem. 77, 6229–6233.Liandris, E., Gazouli, M., Andreadou, M., Comor, M., Abazovic, N., Sechi, L.A.,
Ikonomopoulos, J., 2009. J. Microbiol. Methods 78, 260–264.Liu, X., Atwater, M., Wang, J., Huo, Q., 2007. Colloids Surf. B Biointerfaces 58, 3–7.Mauss, S., Berg, J.R., Rockstroch, J., Sarrazin, C., Wedemyer, H., 2013. Hepatology 4th
ed.. Flying Pubisher, Germany.Meisenberg, C., Ashour, M.E., El-Shafie, L., Liao, C., Hodgson, A., Pilborough, A., et al.,
2016. Epigenetic changes in histone acetylation underpin resistance to thetopoisomerase I inhibitor irinotecan. Nucleic Acids Research, gkw1026. http://dx.doi.org/10.1093/nar/gkw1026.
Miller, F.D., Abu-Raddad, L.J., 2010. Proc. Natl. Acad. Sci. USA 107, 14757–14762.Orendorff, C.J., Murphy, C.J., 2006. J. Phys. Chem. B 110, 3990–3994.Paul Otto, Dan Kephart, Rex Bitner, Suzanne Huber, Volkerding, K., 1998. Separate
Isolation of Genomic DNA and Total RNA from Single Samples Using the SV TotalRNA. promega notes, p. 6.
Qiagen, 2014. QIAamp® Viral RNA Mini Handbook 4th ed.. Qiagen, Germany.Sato, K., Hosokawa, K., Maeda, M., 2003. J. Am. Chem. Soc. 125, 8102–8103.Sato, K., Hosokawa, K., Maeda, M., 2005. Nucleic Acids Res. 33, e4.Scarabelli, L., Sanchez, A., Perez-Juste, J., Liz-Marzan, L.M., 2015. J. Phys. Chem. Lett.
6, 4270–4279.Scott, J.D., Gretch, D.R., 2007. J. Am. Med. Assoc. 297, 724–732.Seifert, L.L., Perumpail, R.B., Ahmed, A., 2015. World J. Hepatol. 7, 2829–2833.Shawky, S.M., Guirgis, B.S., Azzazy, H.M., 2014. Clin. Chem. Lab. Med. 52, 565–572.Turkevich, J., 1985a. Gold Bull. 18, 86–91.Turkevich, J., 1985b. Gold Bull. 18, 125–131.WHO, 2016. Hepatitis C, Fact N164, ⟨http://www.who.int/mediacentre/factsheets/
fs164/en/⟩ accessed, March 2016.Xue, Y., Li, X., Li, H., Zhang, W., 2014. Nat. Commun. 5, 4348.
Fig. 6. Summary of the size and zeta potential, and a comparison between the Real Time RT-PCR and the nano-assay. (a) Charges of all AuNPs used in this study. HCV negative sampleshave positive charge while HCV positive samples have negative charge. (b) The size of the different AuNPs preparations and the HCV positive & negative samples. A significant sizeincrease for the negative samples was observed that confirms the aggregation of the nanoparticles. The mild increase in size of the positive sample may be due to a slight aggregation ofsome nanoparticles in the reaction mixture, which is not significant as the color of the sample did not change and was dependent on RNA concentration. (c) The mean viral loads (IU/ml)and standard deviations for the samples tested using the nano-assay (15203 ± 1898) and the RT-PCR (15203 ± 1898) respectively, showing no significant difference in the final viral loadbetween the two methods. (d) The nano-assay showed a sensitivity and specificity of 93.3% and 100%, while RT-PCR showed a 96.8% sensitivity and 100% specificity . (e) Theoverall time of the nano-assay for one sample was ~30 min compared to 230 min for the RT PCR (f) Cost per sample for the developed biosensor and the RT PCR was 4.5 and 33 USD,respectively; cost including all materials, chemicals and plastics used for the assays, and the RNA extraction cost. (For interpretation of the references to color in this figure legend, thereader is referred to the web version of this article).
S.M. Shawky et al. Biosensors and Bioelectronics xx (xxxx) xxxx–xxxx
8