BIOREACTOR LANDFILL CELL FEASIBILITY STUDY– REFERENCE TO
101
APPROVED: M. Acevedo, Major Professor F. Saleh, Committee Member P. Hudak, Committee Member T. La Point, Director of Institute of Applied Sciences E. Zimmerman, Dean of Department of Biological Sciences W. Burggren, Dean of College of Arts and Sciences C. Neal Tate, Dean of the Robert B. Toulouse School of Graduate Studies BIOREACTOR LANDFILL CELL FEASIBILITY STUDY– REFERENCE TO CITY OF DENTON SUBTITLE-D PERMIT #1590A LANDFILL Elizabeth M. Roberts, B.S Problem in Lieu of Thesis Prepared for the Degree of MASTER OF SCIENCE UNIVERSITY OF NORTH TEXAS May 2002
Transcript of BIOREACTOR LANDFILL CELL FEASIBILITY STUDY– REFERENCE TO

BIOREACTOR LANDFILL CELL FEASIBILITY STUDY– REFERENCE TO
CITY OF DENTON SUBTITLE-D PERMIT #1590A LANDFILL
Elizabeth M. Roberts, B.S
egree of
Problem in Lieu of Thesis Prepared for the DMASTER OF SCIENCE
APPROVED: M. Acevedo, Major Professor F. Saleh, Committee Member P. Hudak, Committee Member T. La Point, Director of Institute of Applied Sciences E. Zimmerman, Dean of Department of Biological SciencesW. Burggren, Dean of College of Arts and Sciences C. Neal Tate, Dean of the Robert B. Toulouse School of
Graduate Studies
UNIVERSITY OF NORTH TEXAS
May 2002

Roberts, Elizabeth, Bioreactor Landfill Cell Feasibility Study – Reference to City
of Denton Subtitle-D Permit #1590A Landfill. Master of Science (Environmental
Science), Spring 2002, Number of pages in your document pp.319, Number of tables in
your document 8, Number of illustrations in your document 19, Number of equations in
your document 5, Number of titles in your reference list 48.
The City of Denton Landfill, Permit #1590A, utilizes “Dry-Tomb” techniques for
disposal and promotion of municipal solid waste stabilization, as described by the
Resource Conservation and Recovery Act (RCRA) prohibition in 40 CFR. Bioreactor
research suggests re-circulating leachate increases biodegradation rates and reduces long-
term monitoring from fifty years to less than ten years.
Current procedures that are followed at Denton’s landfill, literature review and the
use of the Hydrologic Evaluation of Landfill Performance (HELP) model, suggest that a
bioreactor landfill cell is worthy of further research. Re-circulating leachate and
augmenting it with additional liquid will increase biodegradation and the need to design
and build a landfill gas collection system to capture methane for energy recovery uses.

ii
ACKNOWLEDGMENTS
Special thanks to the steering committee, in particular Dr Miguel Acevedo.
Thanks to Candy King, Institute Applied Science, University of North Texas, for
networking me with the appropriate faculty and students; Dr Debra Reinhart, University
of Central Florida, for material and direction provided in the early stages of this thesis;
Charles Fiedler, PE HDR, Inc for additional reading material and assistance in landfill
design considerations.
Encouragement is vital and was shared liberally through friends, in particular
Patricia Brady and Linda Kistler. Even though my family is in South Africa, the
continued morale support was tremendous and kept me going when I’d had enough.
Finally to a dear lady who made this all possible: Marj Jackson, THANK YOU.

iii
TABLE OF CONTENTS
Page
ACKNOWLEDGMENTS............................................................................................... ii LIST OF TABLES .......................................................................................................... vi LIST OF ILLUSTRATIONS .......................................................................................... vii LIST OF EQUATIONS .................................................................................................. ix Chapter
1. INTRODUCTION......................................................................................... 1 Statement of the Problem Evolution from Dump to Landfill Landfill and Bioreactor Regulations Objectives of this Research Research Considerations
2. WASTE STABILIZATION PROCESS........................................................ 9 Composition of Municipal Solid Waste Environmental Factors Affecting Waste Stabilization Five Phases of Landfill Stabilization
3. LANDFILL CONTAINMENT SYSTEMS.................................................. 29 Barrier Layers, Liners and Cap Leachate Collection and Storage System Gas Collection and Control
4. HYDRODYNAMICS OF LEACHATE RECIRCULATION...................... 39 Leachate Generation and Quality Leachate Flow/Movement Mathematical Modeling

iv
5. LITERATURE SURVEY ............................................................................. 56
Laboratory Scale Pilot Scale Full Scale
6. BIOREACTOR DESIGN.............................................................................. 66 Design Cell Size Maximum Allowable Leachate Head Liquid Management Landfill Gas Control System Landfill Stability Settlement Operations Pretreatment or Segregation Leachate Seeps Daily and Intermediate Cover Nutrient and Other Supplemental Additions Bioreactor Management Hydrologic Evaluation of Landfill Performance Model
7. RESULTS AND DISCUSSION ................................................................... 77 Hydrologic Evaluation of Landfill Performance Areas of Refinement Values and Preferences Sustainable Development
8. RECOMMENDATIONS FOR FUTURE RESEARCH............................... 80 Non-technical Barriers to the Bioreactor Landfill Denton Landfill Impact Assessment Limit Environmental Impacts Economics Summary and Conclusion

v
APPENDIX
A. Federal Register Chapter 40, 258.1,2,28....................................................... 93
B. Denton Landfilled Solid Waste, Fiscal Year 1996 -2000 ............................. 108
C. Denton Landfill Monthly Operations............................................................ 113
D. Denton Landfill Site Plans ............................................................................ 142
E. Denton Landfill Liner Details ....................................................................... 144
F. Denton Landfill Boring Locations and Sample Logs.................................... 154
G. Denton Residential Subdivision Construction Activity ............................... 158
H. Denton Climatic Data, 1961 -1990 ............................................................... 162
REFERENCE LIST......................................................................................................... 85

vi
LIST OF TABLES
Table Page 1. City of Denton Landfilled Solid Waste Fiscal Year 1996-2000 ............................... 14 2. Observed and Expected Frequencies from Materials Generated in MSW by Weight,
1999........................................................................................................................... 15 3. Denton Landfill monthly compaction calculated ...................................................... 15 4. Denton Residential Construction Activities.............................................................. 20 5. Conventional Landfill Leachate Concentration Ranges as a Function of the Degree of
Landfill Stabilization................................................................................................. 28 6. Summary of Pilot Scale Bioreactor Investigations ................................................... 58 7. Recent Full-Scale Bioreactor Landfill Tests ............................................................. 60 8. Leachate Quality Comparison from Ontario Landfills ............................................. 66

vii
LIST OF ILLUSTRATIONS
Figure Page 1. Memphis, TN, 1878, Garbage collection was with small wooden carts pulled by
mules ......................................................................................................................... 4 2. Memphis, TN, 1930s, Mules were replaced by simple motorized dump trucks with no
compacting capability ............................................................................................... 4 3. Tijuana Dump, Mexico, 2000 ................................................................................... 4 4. Typical Design of Modern Sanitary Landfill ............................................................ 7 5. City of Denton Total Tonnes Landfilled ................................................................... 16 6. City of Denton Future Land Use Plan, 1999-2020 ................................................... 17 7. Population Forecasts by Subarea, 1999-2020 ........................................................... 18 8. Denton 2SE Station Mean Monthly Temperatures and Precipitation 1961-1990..... 21 9. Five Phases of Landfill Stabilization ........................................................................ 28 10. EPA Recommended Landfill Cap System ................................................................ 34 11. Placement of Geonet on the Base Liner, Yolo County, Woodland, CA................... 34 12. Landfill Water Balance ............................................................................................. 37 13. Schematic Landfill Bioreactor Diagram ................................................................... 42 14. Wet Landfill Cell Schematic ..................................................................................... 42 15. Process Affecting Leachate Movement Through a Landfill ..................................... 46 16. Fate and Transportation Mechanisms for Contaminants in MSW Landfills ............ 46 17. Unsaturated Hydraulic Conductivity and Moisture Content relationship................. 55 18. Leachate Movement Following Introduction using a Horizontal Trench -test cell .. 55

viii
19. Bioreactor Design...................................................................................................... 75

ix
LIST OF EQUATIONS
Equation Page 1. Field capacity –density relationship.......................................................................... 40
2. Field capacity – waste overburden weight relationship ............................................ 41
3. Darcy's Law............................................................................................................... 47
4. Power Law equations ................................................................................................ 49
5. Brooks and Corey equations ..................................................................................... 50

1
CHAPTER 1
INTRODUCTION
Statement of the Problem
The City of Denton’s municipal solid waste Subtitle-D landfill does not utilize
any leachate re-circulation or other bioreactor-type technology. This document considers
the application of this emerging technology to the city’s current methodologies.
Evolution from Dump to Landfill
The elimination of garbage burning in backyards and factories resulted in
increased amounts of garbage to be collected for disposal. The national movement in
solid waste management during the 1940-1970s, was based primarily on public health
concerns. Figure 1 and 2 show collection methods utilized by the City of Memphis, TN
(Solid Waste Management, 2000). Disposal options in the 1950s included incineration,
composting, recycling and salvaging, and sanitary landfill. Figure 3 is a picture taken at
the Tijuana dump, Mexico where people still sift through the trash looking for clothing
and other items for their families (McDonald D., 2000). Economics and broad
geographical flexibility made the sanitary disposal of garbage on the land the disposal
option of choice. It was also clear that improved land disposal techniques, in addition to
removing smoke, could eliminate mosquitoes, flies, rats and any potential disease spread
by feeding garbage to swine.
It is not clear as to when burying garbage became an idea. Some say that the first
written description of the sanitary landfill concept can be found in the Bible. Literature

2
dating back to 1929 includes an article on garbage disposal by “sanitary fill”. It was
learned early on that covering garbage with soil or ash helped eliminate odors.
Compaction was eventually added to the process as a means of getting more garbage into
less space. Issues such as compaction requirements, densities to be achieved, frequency
and depth of cover placement, and limited access were not originally a part of the
sanitary-landfill construction procedure requirements.
The US Army research presented the art of sanitary landfilling with several
valuable contributions, including the recognition of the flexibility of a sanitary landfill,
and the application of equipment still in use in sanitary landfill construction today.
The four loosely categorized classes of sanitary landfills are:
Secure landfill – tends to entomb waste, postponing any environmental impact to the
future when environmental controls and safeguards fail;
Monofill – accepts waste that cannot be processed through resource recovery,
composting, or incineration. These materials tend to be inert and may be more easily
assimilated by the environment. The monofill is currently used for disposal of
combustion ash, construction and demolition debris, and yard waste;
Reusable landfill – permits excavation of the landfill contents to recover metals,
glass, plastics, other combustibles, compost and potentially, the site itself following a
lengthy stabilization period;
Bioreactor landfill – is operated in a manner to minimize environmental impact while
optimizing waste degradation processes. Enhanced microbial processes are used to
transform and stabilize the readily and moderately decomposable organic waste
constituents within 5 to 10 years of bioreactor process implementation. The bioreactor

3
landfill significantly increases the extent of organic decomposition, conversion rates
and process effectiveness, over what would otherwise occur within a secure landfill.
Stabilization means that the environmental performance measurement parameters
(landfill gas composition, generation rate, and leachate constituent concentrations)
remain at steady levels, and should not increase in the event of any partial
containment system failures beyond 5 to 10 years of bioreactor process
implementation (Reinhart D.R. and Townsend T.G., 1998).

4
Figure 1 Memphis, TN, 1878, Garbage collection was with small wooden carts pulled by mules (Solid Waste Management, 2000)
Figure 2 Memphis, TN, 1930s, Mules were replaced by simple motorized dump trucks with no compacting capability (Solid Waste Management, 2000)
Figure 3 Tijuana Dump, Mexico, 2000 (McDonald D., 2000)

5
Landfill and Bioreactor Regulations
Present regulations encourage landfills to remain relatively dry. In most cases,
the final moisture content remains close to that of the entering waste. Figure 4 shows a
typical design of a modern sanitary landfill (Reinhart D.R. and Townsend T.G., 1998).
The Federal Code most pertinent to liquid addition is 40 CFR 258.28 (see Federal
Register Chapter 40, 258 Appendix), which allows re-introduction of leachate and
condensate into Subtitle D lined landfills. Some states interpret 40 CFR 258.28 to mean
that liquid addition, other than leachate and condensate, are not allowed into landfills.
Federal Code may be interpreted to prohibit the addition of “bulk liquid wastes”, and not
“amendments”, to landfills. Thus water and other amendment additions to landfills
appear permissible within regulations. For example, the US Environmental Protection
Agency (EPA) Region 10, approved an amendment to Washington State’s solid waste
regulation that specifically allowed water addition in a controlled manner to a specific
composite lined, subtitle D Landfill.
The bioreactor and leachate re-circulating landfills differ from the “dry” Subtitle
D landfills in that they each receive managed liquid additions to augment waste
stabilization. The bioreactor landfill differs from the leachate re-circulating landfill in that
it can obtain rapid and complete stabilization by use of water and other amendments. For
the bioreactor landfill, water is clearly not a waste but an amendment. Other potential
bioreactor additions such as sludge and nutrients could be categorized as amendments.
Federal Code is open to necessary amendments providing that other statutory constraints
are met (e.g. leachate head limits on the base liner and inclusions of a single composite
liner).

6
Favorable federal policy toward the bioreactor landfill has begun to develop as
seen by Action Item 37 of the Federal Climate Change Action Plan of 1993. The
following relevant recommendations were made: (Pacey J. et al., 1999)
Creation of a joint state / federal coordination program to facilitate siting / permitting
of enhanced recovery (i.e. bioreactor) landfills.
Modification of environmental performance standards and regulatory requirements to
remove unnecessary barriers to bioreactor landfills.
Municipal solid waste (MSW) landfills will also have to follow a new US EPA
regulation emission limit, if their state has not yet implemented a plan. On Nov 8 1999,
the EPA issued a final rule setting guidelines for existing MSW landfills where state or
American Indian tribal plans are not in effect. Plans address emissions limits, compliance
schedules, testing and monitoring requirements, and record keeping and reporting
requirements. They also establish a process for the EPA or state to review design plans
for site-specific gas collection and control systems. In 1996, the EPA issued performance
standards for new MSW landfills and guidelines for existing ones with more than 50
mega-grams of volatile organic compounds (VOCs). The agency followed up with
amendments in June 1998 and February 1999, requiring states, territories, localities and
tribes to submit plans to the EPA. The new rule may affect more than 3,800 landfills in
approximately 28 states, protectorates and municipalities. The EPA has extended the
guidelines to January 2000, to encourage states in this process (Duff S., 1999).

Figure 4 Typical Design of Modern Sanitary Landfill (Reinhart, D.R. and Townsend, T.G., 1998)
7

8
Objectives of this Research
Evaluate the current procedures that are followed at Denton’s landfill and through
literature review and the use of the Hydrologic Evaluation of Landfill Performance
(HELP) model, determine the feasibility of a bioreactor landfill operation, at the same
site.
Research Considerations
Determine whether leachate, climatic and soil data for the City of Denton’s
landfill supports the concept of bioreactor methodologies for the processing of Municipal
Solid Waste.

9
CHAPTER 2
WASTE STABILIZATION PROCESS
Composition of Municipal Solid Waste
Municipal Solid Waste (MSW) is a term used to refer to the nation’s discarded
resources. It includes waste such as durable goods, non-durable goods, containers and
packaging, food scraps, yard trimmings and miscellaneous inorganic wastes from
residential, commercial, institutional and industrial sources. Examples of waste from
these categories include appliances, automobile tires, newspapers, clothing, boxes,
disposable tableware, office and classroom paper, wood pallets, and cafeteria waste
(Brady P., 2000).
MSW composition is a function of the population demography. Composition
affects leachate quality, landfill gas composition and quality, waste degradation rates, and
resource recovery potential. It is therefore necessary to control and monitor biological,
chemical, and hydrologic processors occurring within the cell (A portion of the landfill
that receives waste for 2-5 years, see Denton Landfill Site Plans Appendix) to
successfully operate a bioreactor landfill (Reinhart D.R. and Townsend T.G., 1998).
Denton’s per capita disposal rate is higher than both the national and state rates.
Table 1 shows the fiscal year tonnage and volume of solid waste that was buried at
Denton's Landfill from 1996 - 2000 (Roberts E.M., 2000). In 1997, the EPA reported that
197 million tonnes of municipal solid waste were generated in the U.S.A., or an average
of 2 kg per person per day. According to the Texas Natural Resource Conservation
Commission (TNRCC), in 1994, permitted MSW landfills reported a total of 19,784,133

10
tonnes of waste disposed of in Texas. With an estimated population of 18,378,185, the
per capita disposal rate was about 2.9 kg per day (Brady P., 2000). Denton's per capita
disposal rate for 1999 was about 3.4 kg per day. Figure 5 depicts Denton's total tons
landfilled from October 1995 through September 2000 (Roberts E.M., 2000). Figure 6
shows Denton’s future growth plan, which will impact the composition of the waste
stream and therefore the decomposition rates of the material in the bioreactor cells, as
will Denton’s future population, as shown in Figure 7 (Planning and Development
Department, 1999). Table 4 summarizes Denton residential construction activities during
1999 and 2000. Greater detail can be found in the Denton Residential Subdivision
Construction Activity Appendix, describing this strong growth.
A multi-year solid waste characterization study was performed (Brady P., 2000)
during 1999/2000. The material was categorized as follows:
RESIDENTIAL:
Individual Single-Family Residences that have residentially collected bags
Mobile Home Parks
Apartment Complexes
Multi-Family Dwellings with commercial collected containers
University Dormitories
Individual Residences on Rural Route Roads collected commercially
Waste in this category was expected to contain a lesser amount of paper, but a larger
amount of items such as food waste, textiles, glass, plastic and non-ferrous metals.
OFFICE:

11
Financial Institutions
Office Buildings
Real Estate Offices
Most University Buildings (Excludes Dormitories and Cafeterias)
Schools
Pre-Schools
Wholesale Establishments
Waste in this category was expected to contain primarily high grade office paper.
RESTAURANT:
Dine-In Restaurants
Fast-Food Establishments
Bowling Alleys
Movie Theaters
Skating Rinks
Includes businesses not listed above whose waste was expected to be primarily
food, paper and plastic.
INDUSTRIAL:
Auto Repair Shops
Plant Nurseries
Junk/Salvage Yards
Sheet Metal Shops
Paint Stores
Chemistry Buildings or Physical Plants on Campuses

12
Tire Shops
Repair Shops
Waste in this category was expected to contain larger amounts of metals and
chemical materials and a lesser amount of food, high-grade paper or plastic.
GROCERY:
Grocery Stores
Convenience Stores (excludes those attached to auto repair facility)
Waste in this category was expected to contain primarily cardboard, plastic, glass
bottles and food discards
RETAIL:
Business receiving merchandise for resale
Storage Facilities
Mall Businesses
Thrift Stores
Includes businesses not mentioned above whose waste was expected to be
primarily cardboard, high grade paper and miscellaneous.
The observed distribution of materials in Denton’s waste stream, Table 2, was not
significantly different than the expected national distribution of materials (Brady P.,
2000).
Preprocessing of waste does permit some control of the composition of the
landfilled MSW. Denton does practice a limited form of preprocessing, in that the
residential single family dwellings have their yard trimmings collected separately and
diverted to a mulching operation. A more uniform waste stream would be created if

13
separation of inert and organic waste, bag opening, and household hazardous waste
removal was provided. This would improve leachate and gas quality, equalize subsidence
(facilitating post-closure care), and simplify landfill operations. Physical properties of
MSW provide some opportunity for control. These properties include in-place density
and particle size, which primarily influence moisture routing within the landfill. In-place
density can be controlled by compaction in the field or by baling the waste before
landfilling. Table 3 depicts Denton's landfill compaction rates. Greater compaction (and
resulting greater density) has advantages associated with more efficient use of air space,
reduced settlement, and reduced cover material requirements. Denton Landfill Monthly
Operations Appendix describes detailed usage of airspace and cover materials (Ball C.,
2000). Hydraulic conductivity is diminished, moisture distribution is impaired and
leachate short-circuiting is promoted as in-place density increases; therefore leachate
strength may be relatively weak, resulting in delayed waste degradation. Successful
bioreactor operations require reduced compaction to promote even leachate distribution,
resulting in increased settlement rates. Shredding waste before placement can reduce
particle size. Shredding also promotes a more uniform waste, reducing fire potential and
blowing materials. It improves water distribution and promotes more equitable
settlement. Additionally, more waste is exposed to microbial activity and consequently
biodegradation is enhanced (Reinhart D.R. and Townsend T.G., 1998).

Table 1 City of Denton Landfilled Solid Waste (Roberts, E.M., 2000)
14

15
Month Year Compaction with Soil Cover
Compaction Waste only
May 1999 965 911 Sep 1999 990 949 Oct 1999 740 631 Dec 1999 838 756 Jan 2000 713 619 Feb 2000 599 501 Mar 2000 771 702 Apr 2000 720 675 May 2000 866 797 Jun 2000 885 835 Jul 2000 825 767 Aug 2000 904 845 Sep 2000 894 834 Oct 2000 912 861 Average 830 763
Table 3 Denton landfill monthly compaction calculated, kg per m3 (Ball C., 2000)
City of Denton
38%
10%6%5%
7%
12%
4%
8%
10%
Paper Plastic Metals Glass WoodFood Textile Yard Other
U.S.A.
38%
10%8%
5%
10%
7%
13%3%
6%
Paper Plastic Metals Glass WoodFood Textile Yard Other
Table 2 Observed and Expected Frequencies (%) from Materials Generated in MSW by Weight, 1999 (Brady, P., 2000)
Paper Plastic Metals Glass Wood Food Textile Yard Other Denton 37.9 10.0 5.8 4.8 7.3 12.1 3.7 8.0 10.4 U.S.A. 38.6 9.9 7.7 5.5 5.3 10.1 6.8 12.8 3.3
16
Solid Waste Department Total Tonnes Landfilled
FY96-00
5,000
6,000
7,000
8,000
9,000
10,000
11,000O
CTO
BER
JAN
UAR
Y
APR
IL
JULY
OC
TOBE
R
JAN
UAR
Y
APR
IL
JULY
OC
TOBE
R
JAN
UAR
Y
APR
IL
JULY
OC
TOBE
R
JAN
UAR
Y
APR
IL
JULY
OC
TOBE
R
JAN
UAR
Y
APR
IL
JULY
Tota
l Ton
nes
FY00FY99FY98FY97FY96
Figure 5 City of Denton Total Tonnes Landfilled (Roberts, E.M., 2000)
Residential Construction Activities Sep 1999
Oct 2000
Number of Platted Lots 2,369 2,986 Number of Unreleased Vacant Lots 206 149
Number of Vacant Lots Available for Construction 1,169 963 Number of Lots Under Construction 342 593
Lots with Completed Houses Ready for Occupancy 652 1,281 Table 4 Denton Residential Construction Activities (Planning and Development Department, 1999)

17
Figure 6 City of Denton Future Land Use Plan 1999-2020 (Planning and Development Department, 1999)

18
Figure 7 Population Forecasts (1999-2020) by Sub-Area (Planning and Development Department, 1999)

19
Environmental Factors Affecting Waste Stabilization
Oxidation reduction (redox) conditions within the landfill establish waste
degradation pathways. Aerobic landfilling is more closely related to today’s composting
operations but it should be noted that the presence of air in a landfill may increase fire
potential, has additional operating costs associated with provision of air, and may still
produce gases that require collection and treatment. Anaerobic degradation, however,
leads to the production of methane (60%), carbon dioxide (45%) and other trace gases.
The methane can be recovered for energy generation (Hermansson E. and Nelson S.,
2000). Anaerobic degradation pathways are available for many compounds that are not
amenable to aerobic degradation – e.g. chlorinated aliphatic hydrocarbons.
Moisture within the landfill serves as a reactant in the hydrolysis reactions. It
transports nutrients and enzymes, dissolves metabolites, provides pH buffering, dilutes
inhibitory compounds, exposes surface area to microbial attack, and controls microbial
cell swelling (Reinhart D.R. and Townsend T.G., 1998).
Because waste degradation involves biochemical reactions, the rate of degradation
tends to increase with temperature. The temperature within a landfill cell is determined
through a balance between heat production during the biological degradation of organic
waste fractions and the loss of heat to the surrounding soils and atmosphere. The
microbial processes are capable of significant heat generation, particularly at higher
moisture conditions. Microorganisms have a temperature range over which they function
best, and are loosely characterized as phychrophilic (ability to grow at 0°C), mesophilic
(optimal growth at 25-40°C) or thermophilic (optimal growth above 45-50°C). Many
methanogens are mesophilic (Weber-Shirk M., 2001). Temperature control at full-scale

20
landfill cells may be difficult to achieve from an economic standpoint. Sweden’s
experimental “Energy Loaf” controls temperature by re-circulating heated leachate
(Hermansson E. and Nelson S., 2000). Introduction of air and the consequential onset of
aerobic activity serves to rapidly increase temperature and inhibit methane productionas
seen at the pilot-scale experiment at Baker Place Road Landfill, Columbia County,
Georgia (Hudgins M. and Harper S., 1999).
Nutrient requirements of the waste are generally met at least during the early
degradation phases. Optimum pH for methanogens is 6.8-7.4. Buffering could best be
used in response to changes in leachate characteristics (i.e. a drop in pH or increase in
volatile organic acid -VOA concentration) in conjunction with leachate re-circulation.
However, careful operation of the landfill bioreactor, initially through slow introduction
of leachate should minimize the need for buffering (Reinhart D.R. and Townsend T.G.,
1998).
Climatic, Figure 8, conditions have a marked effect on the working face (surface),
and thus the degree of degradation under natural conditions (Unedited Local
Climatological Data, WBAN 03991 2000). Denton uses a tarp to cover the working face
daily, and clayey soil, as the intermediate cover. The clayey soil is from cell excavations
and is a composite of the Woodbine noncalcareous shale and sandstone and Grayson
Marl calcareous shale (Hunt W.C., 2000).

21
Figure 8 Denton 2SE Station Mean Monthly Temperatures and Precipitation 1961-1990 (Unedited Local Climatological Data, WBAN 03991 2000)
Denton 2SE Monthly Means 1961-1990
0.0
5.0
10.0
15.0
20.0
25.0
30.0
July
Aug
ust
Sept
embe
r
Oct
ober
Nov
embe
r
Dec
embe
r
Janu
ary
Febr
uary
Mar
ch
Apr
il
May
June
Tem
pera
ture
(C)
0.0
20.0
40.0
60.0
80.0
100.0
120.0
140.0
160.0
Prec
ipita
tion
(mm
)
Precipitation (mm) Temperature (C)

22
Five Phases of Landfill Stabilization
Landfill investigation studies suggest that the stabilization of waste proceeds in
five sequential and distinct phases (Pohland F.G. and Harper S.R., ). The rate and
characteristics of leachate produced and biogas generated from a landfill vary from one
phase to another and reflect the processes taking place inside the cell, as shown by the
graph in Figure 9. These phases tend to overlap due to the lengthy period of waste
placement.
The initial adjustment phase (Phase I) is associated with initial placement of solid
waste and accumulation of moisture within cells. An acclimation period, or lag time, is
observed until sufficient moisture develops to support an active microbial community.
Preliminary changes in environmental components occur in order to create favorable
conditions for biochemical decomposition. The lag time in the graph is recorded as
negative stabilization days due to the oxidizing environment.
Phase II, the transition phase, field capacity is often exceeded, and a
transformation from aerobic to anaerobic occurs. This is evidenced by the depletion of
oxygen trapped within the landfill media. A trend toward reducing conditions is
established in accordance with shifting of electron acceptors from oxygen to nitrates and
sulphates, and the displacement of oxygen by carbon dioxide. By the end of this phase,
measurable concentrations of chemical oxygen demand (COD) and volatile organic acids
(VOA) can be detected in the leachate. Anaerobic conditions are recorded as positive
stabilization days in the graph.
In the acid formation phase (Phase III), the continuous hydrolysis (solubilization)
of solid waste, connected with microbial conversion of biodegradable organic content,

23
produces intermediate VOAs at high concentrations. A decrease in pH values is often
observed accompanied by metal species mobilization. Viable biomass growth associated
with the acidogenic bacteria (acid formers), and rapid consumption of substrate and
nutrients are the predominant features of this phase.
During the (Phase IV) methane fermentation process, intermediate acids are
consumed by methanogenic bacteria and converted to methane and carbon dioxide.
Sulphate is reduced to sulphide. The pH value is elevated, being controlled by the
bicarbonate buffering system, and consequently supports the growth of methanogenic
bacteria. Heavy metals are removed from the leachate by complexation and precipitation
and transported to the solid phase.
During Phase V, the final state/ maturation phase of the landfill, nutrients and
available substrate become limited and the biological activity shifts to relative dormancy.
Gas production drops dramatically and leachate strength remains constant at much lower
concentrations than earlier phases. Because gas production has almost ceased,
atmospheric gases may permeate back into the landfill, and oxidized species may slowly
appear. The slow degradation of resistant organic fractions may continue with the
production of humic-like substances.
The progress toward final stabilization of solid waste is subject to physical,
chemical, and biological factors within the landfill environment, the age and the
characteristics of landfilled waste, the operational and management controls applied, as
well as the site-specific external conditions, as mentioned earlier.

24
Characteristics of Leachate
Material is removed from the waste mass via mechanisms that include leaching of
inherently soluble material, leaching of soluble products through biological and chemical
transformation, and washout of fines and colloids. The characteristics of leachate are
highly variable depending on the composition of the waste, rate of water infiltration
(Figures 12 and 13), refuse moisture content, and landfill design, operation and age,
Table 5.
Organic contaminants of leachate are primarily soluble refuse components or
decomposed products of biodegradable waste. The organic compounds found at highest
concentration in leachate is generally VOAs that are produced during the decomposition
of lipids, proteins, and carbohydrates. Aromatic hydrocarbons, including benzene,
various xylenes, and toluenes are frequently found at lower concentrations. These
compounds were considered to be constituents of gasoline and fuel oils. A total of 150
different organic compounds have been identified in multiple studies, however only 29
were identified in more than one, concluding that leachate composition was quite site
specific (Reinhart D.R. and Townsend T.G., 1998). Denton's landfill leachate analysis
will be conducted annually beginning 2001.
The dominant organic class in leachate shifts, as the age of the landfill increases
due to the ongoing microbial and physical/chemical processes within the landfill. An
investigation of leachates obtained from landfills operated from one to twenty years
found that the abundance of high molecular weight, humic-like substances decreases with
age, while intermediate-sized fulvic materials showed significantly smaller decreases.
The relative abundance of organic compounds present in these leachates was observed to

25
decrease with time in the following order: free VOAs, low molecular weight aldehydes
and amino acids, phenolic compounds and fulvic acids.
A variety of heavy metals are frequently found in landfill leachates including
zinc, copper, cadmium, lead, nickel, chromium, and mercury. These metals are either
soluble components of the refuse or are products of the physical processes such as
corrosion and complexation. In several instances heavy metal concentrations in leachate
exceed US Toxicity Characteristic Leaching Procedure standards. Heavy metal
concentrations in leachate do not appear to follow patterns of organic indicators such as
COD, BOD, nutrients, or major ions. Heavy metal release is a function of characteristics
of the leachate such as pH, flow rate and the concentration of complexing agents
(Reinhart D.R. and Townsend T.G., 1998).
Leachate Treatment and Disposal
The simplest approach to managing leachate involves discharge to a local
wastewater plant. If a sewer connection is located at the landfill site, leachate may be
directly discharged from the leachate storage facility (Reinhart D.R. and Townsend T.G.,
1998). The volume of leachate is normally far lower than wastewater, but it exhibits large
variations in quantity and quality, and at times contains high concentrations of potentially
disruptive chemicals. Natural treatment operations such as wetlands have been used in
some cases to polish leachate before discharge (Castonguay N. et al., 2000).
Construction is underway (2001) to connect the leachate collection system with
the sewer system for Denton's landfill. Regular monitoring of leachate composition will
be performed to ensure acceptable incoming toxicity levels to be treated by Denton's
Waste Water Plant.

26
Characteristics and Generation of Landfill Gas
When solid waste decomposes, significant portions of organic wastes are
ultimately converted to gaseous end-products. The rate of gas production is a function of:
refuse composition, climate, moisture content, particle size and compaction, nutrient
availability, and buffering capacity. Reported production rates vary from 0.12-0.41 m3/kg
dry waste (Reinhart D.R. and Townsend T.G., 1998). Production rates and gas
composition follow typical stabilization phases with peak flow rates and methane content
occurring during the methanogenic phase. Landfill gas is typically 40-60% methane with
carbon dioxide and trace gases such as hydrogen sulphide, water vapor, hydrogen and
various VOCs comprising the balance. Because of their high vapor pressures and low
solubilities, many toxic VOCs are observed in landfill gas.
Landfill Gas Control
Gas collection is conducted to minimize emissions to the atmosphere for health
and safety concerns, aesthetics and to minimize atmospheric degradation. Typical gas
collection systems utilize vertical wells placed within the landfill at the time of closure.
These wells are similar to those used for groundwater and consist of perforated pipe
surrounded by a permeable media such as gravel (Reinhart D.R. and Townsend T.G.,
1998). Gas will migrate to a well due to the pressure difference between the landfill
interior and the atmosphere. Passive venting does not always result in large collection
efficiencies. The “Energy Loaf” has perforated horizontal pipes connected to the vertical
wells in a patented design, enhancing gas collection efficiencies (Hermansson E. and
Nelson S., 2000).

27
Tier II testing (Maas J., 1997) was completed at Denton's Landfill during 2000.
As a result of these low emissions, regulations do not require a gas collection system
design or installation be considered for another 5 years.
Waste Decomposition and Landfill Settlement
The heterogeneous nature of MSW and the different degrees of stabilization that
occur in a landfill cell, rarely result in uniform settlement. This differential settlement
must be considered in the design of the landfill gas collection manifolds and the surface
capping system (Reinhart D.R. and Townsend T.G., 1998).
Denton's Landfill Phase 1a will have a design for closure prepared and
constructed during 2001. MSW permitted volume for this cell has been reached, and as a
result the waste is now being received in the Phase 2 cells.

28
Figure 9 Five Phases of Landfill Stabilization, (Tchobanoglous G. et al., 1992b)
Phase II Phase III Phase IV Phase V Parameter Transition Acid
Formation Methane Formation
Final Maturation
BOD, mg/l 100-10,000 1,000-57,000 600-3,400 4-120 COD, mg/l 480-18,000 1,500-71,000 580-9,760 31-900 TVA, mg/l as Acetic Acid
100-3,000 3,000-18,800 250-4,000 0
BOD/COD 0.23-0.87 0.4-0.8 0.17-0.64 0.02-0.13 Ammonia, mg/l -N 120-125 2-1,030 6-430 6-430 pH 6.7 4.7-7.7 6.3-8.8 7.1-8.8 Conductivity, µmhos/cm
2,450-3,310 1,600-17,100 2,900-7,700 1,400-4,500
Table 5 Conventional Landfill Leachate Concentration Ranges as a Function of the Degree of Landfill Stabilization (Reinhart D.R. and Townsend T.G., 1998)

29
CHAPTER 3
LANDFILL CONTAINMENT SYSTEMS
Fifteen years ago under amendments to the Resource Conservation and Recovery
Act (RCRA), Congress mandated the first multi-layered liner and cap systems (including
geomembranes) for hazardous waste landfills, thereby creating the basis for "dry tomb"
storage of waste. The EPA and state agencies have carried these mandates forward, with
some slight alterations, into multi-layered liner and cap systems for solid waste landfills.
Following separate statutory and regulatory paths under the Air Quality Analysis
Workshop, EPA and state agencies have developed regulations controlling emissions of
regulated gaseous materials from landfills. These regulations require passive or active
systems associated with the cap system to control the release of greenhouse gases from
landfills with a design capacity greater than 100,697tonnes . Modifications to the cap
barrier layer as described by RCRA are permitted (Richardson G.N. and Sprague R.T.,
2000; U.S. Department of Commerce, 1998).
Leachate is generated as a consequence of water coming in contact with solid
waste. Leachate from MSW landfills varies in strength as a result of the biological
activity occurring. Rubbish, food, garden wastes, crop and animal residues contribute to
the organic material, while the inorganic constituents in leachate are often derived from
ash, construction and demolition debris. Reports indicate that increased quantities of
paper in solid waste result in a decreased rate of waste decomposition. Lignin, the
primary component of paper, is resistant to anaerobic decomposition, which is the
primary means of degradation in landfills (Reinhart D.R. and Grosh C.J., 1998). The

30
characteristics of the leachate produced are highly variable, depending on the
composition of the solid waste, precipitation rates, site hydrology, compaction, cover
design, waste age, sampling procedures, interaction of leachate with the environment, and
landfill design and operation. The Denton landfill currently follows the standard "dry
tomb" technique, removing leachate from the landfill, through storage, and then treatment
and disposal at the Denton wastewater treatment facility.
Landfill gas (LFG) results from biological decomposition of organic material in
the solid waste stream. A large portion (Table 2) of the waste stream is composed of
biodegradable material. For most of the landfill life anaerobic conditions dominate, with
the primary by-products being methane (60%) and carbon dioxide (45%). Methane can
become explosive (5-15% by volume in air) under certain conditions, as well as being
considered a greenhouse gas, being 30 times more potent than carbon dioxide (Cox S.,
2000). The trace components are generally toxic and have odor-causing characteristics.
Barrier Layers, Liners and Cap
Figure 10 depicts an EPA recommended landfill cap system. Modern sanitary
landfills utilize barrier systems to prevent leachate from leaving the landfill and
contaminating the underlying soil and groundwater, as well as preventing water from
entering the landfill to create leachate. Barrier layers (see Denton Landfill Liner Details
Appendix) are constructed of materials that possess low permeability to water. The most
common materials include compacted soil (clay) and synthetic membranes
(geomembranes). The containment layer at the bottom of the landfill is known as a liner.
The one at the top is referred to as a cap. The barrier layers may conceptually be thought

31
of as one unit, they are in reality multiple layers of different materials, thus more
accurately referred to as liner and cap systems (Reinhart D.R. and Townsend T.G., 1998).
Current regulations for MSW landfills require a liner system composed of a
composite liner with 60cm of compacted soil at a maximum hydraulic conductivity of 10-
7cm/sec and a geomembrane that must be at least 1.524mm (Wells J., 1999) thick for
HDPE. The hydraulic conductivity is an engineering parameter relating the permeability
of a porous media to the flow of water. Denton Landfill Liner Details Appendix shows
these requirements in greater detail. The geomembrane must be in direct contact with the
compacted soil. It is then overlain by a drainage layer that limits the depth of leachate on
the liner to less than 30cm at all times. Other layers must be provided to permit drainage
and removal of leachate away from the liner. These leachate collection systems (LCS) are
composed of highly permeable materials e.g. sand, geonet, geotextile. Figure 11 depicts
the installation of a geonet at Yolo County, CA (Yazdani R. et al., 2000).
The natural clay deposits, Upper Cretaceous Woodbine and Grayson Marl, (Hunt
W.C., 2000) are used as landfill barriers in the Denton landfill. A number of properties
make this compacted soil amenable for use as a component of the containment system.
These include mechanical properties e.g. shear strength, but most importantly, the
impermeability of the clay to water. This along with many other parameters is tested
routinely during soil liner construction. In recent years engineered materials known as
geosynthetics have been developed. One of the most common uses of geosynthetics is for
the geomembrane. Denton uses high-density polyethylene (HDPE) as one of its
components for the bottom liner. The liner design for a RCRA Subtitle C hazardous
32
waste landfill requires a double liner/drainage collection system. Denton is a MSW
Subtitle D landfill, therefore does not require these extra precautions and associated costs.
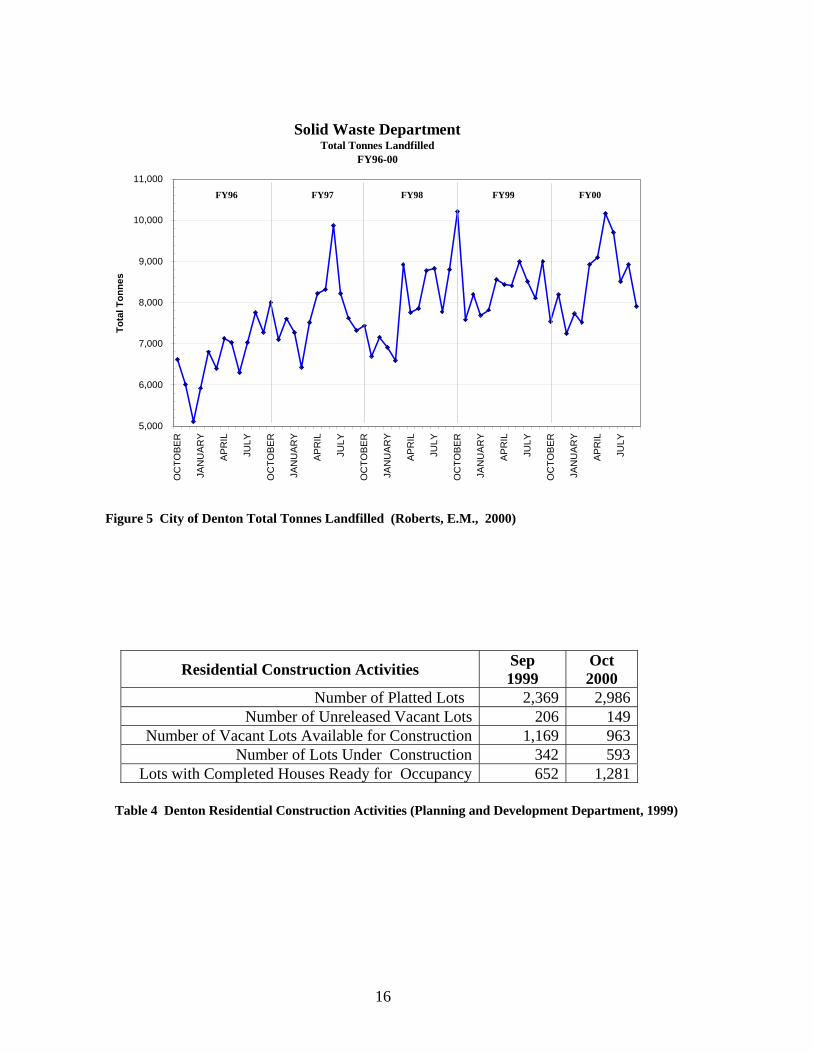
A cap system functions in a similar manner to a liner system, except the purpose
is to keep water from entering the landfill. Regulations require closure of the cell when
the permitted capacity has been reached. The capping will prevent water from entering
and the reduction in gas migration. Drainage layers are also included as part of the cap
system to serve as gas venting layers to facilitate gas transport to the collection wells. A
vegetative layer is located above the barrier layer to prevent soil erosion, Figure 10
(Reinhart D.R. and Townsend T.G., 1998).
As the first generation of Subtitle D landfills are reaching the end of their
operational life, considerable technical questions have been raised regarding both the
design of and technical justification for the expensive final covers proposed for these
facilities. Concerns include:
The use of an infiltration barrier system on the 4:1 to 3:1 side slopes common to the
industry has created a slope stability problem that might lead to the inevitable failure
of such covers.
Landfills that re-circulate leachate will undergo significant settlement that could
damage the expensive barrier covers. Why install a barrier cover to limit surface-
water infiltration if leachate is being pumped beneath the cover?
Are barrier covers required in arid and semiarid regions of the USA?
Are barrier covers required to meet the New Source Performance Standards (NSPS)
requirements?

33
Having spent millions of dollars to install a liner system, most owners naturally question
placement of an essentially impermeable final cover over the waste. This need is based
on EPA’s concern that lined landfills should not, over the long-term, become "bathtubs"
that eventually fill and release leachate to the environment. Subtitle-D regulations in all
states require that an interim cover be placed on waste that will not receive additional
waste for more than 30 days and that the final cover be placed within one year of final
waste placement (Richardson G.N. and Sprague R.T., 2000).

34
Figure 11 Placement of Geonet on the Base Liner, Yolo County, Woodland, CA (Yazdani R. et al., 2000)
Figure 10 EPA recommended landfill cap system (Reinhart, D.R. and Townsend, T.G., 1998)

35
Leachate Collection and Storage System
When rain falls on a landfill site, the water leaves as storm-water runoff,
evaporates, transpires from the vegetation, or infiltrates into the landfill creating leachate.
The infiltrate is stored (absorbed) by the landfill material, or migrates under the force of
gravity, being intercepted by the liner system.
The amount of leachate generated at a landfill depends on many conditions,
including site climate, landfill morphology, waste depth, landfill surface conditions, and
the facility operation. Figure 12 shows a simplified water budget. A water budget
analysis is a common procedure in the field of hydrology. This technique has been
applied to landfills to predict leachate generation. Standard hydrologic tools are used to
determine the amount of rainfall that infiltrates into the landfill for a given set of climate
and site conditions. This water is stored initially in the landfilled material. Field capacity
is defined as the amount of water that a permeable material such as waste may store
against the force of gravity, before it drains.
The simulation of water flow through the landfill to more accurately predict the
unsaturated flow conditions which typically occur is a common feature of most modeling
programs. The most commonly applied landfill water budget model is the Hydrologic
Evaluation of Landfill Performance.
Leachate Collection Systems (LCS) are designed to minimize the depth of
leachate above the liner, per RCRA Subtitle D landfill regulations – no more 30cm depth.
The collection system must be operational throughout the active phase of the landfill. For

36
that reason the leachate collection system must be simple, safe and durable. The main
components of a leachate collection system are:
collection unit - drainage gravel layer, side drains, main drain
transportation unit - main drain and side drains
intake system for the collection well
collection well, inspection wells, sampling wells, pumping wells
discharge pipe - gravitation and pressure pipes
The leachate collection system should be designed to accommodate the maximum
monthly precipitation for an average year (data from the most recent 30 years) (U.S.
Department of Commerce, 1998; Danish Environmental Protection Agency, 2001). The
four parameters having the greatest impact on the liner head are leachate flow rate into
the LCS, permeability of the drainage layer, length of drainage path, and slope of the
liner. Materials typically used in the LCS are sand, gravel or synthetic material – geonet.
Leachate drains from the LCS to a series of trenches that typically contain large
diameter pipes surrounded by a blanket of gravel. The trenches themselves are sloped,
and ultimately drain to a sump or lift-station. A storage system must be provided for
leachate at the landfill site. Denton Landfill LCS specifications for Phase 2 are shown in
Denton Landfill Liner Details Appendix.

37
Figure 12 Landfill Water Balance (Reinhart D.R. and Townsend T.G., 1998)

38
Gas Collection and Control
MSW landfills possess characteristics distinct from other types of landfills as a
result of the large amount of biodegradable material that is present in the waste, and the
resulting decomposition or stabilization of these materials. Landfills are estimated to be
the largest anthropogenic source of methane in the USA. Congress expanded the Clean
Air Act in 1988 to regulate municipal solid waste landfills (MSWLFs). This control was
expanded in 2000 with the enactment of New Source Performance Standards for non-
methane organic compound emissions from MSWLFs (Richardson G.N. and Sprague
R.T., 2000). The USA landfill-gas-to-energy industry has experienced a 10% growth per
year since 1990, resulting from the economic incentives and associated programs to
encourage greenhouse gas reductions and increased use of renewable energy. As of 1999
there were 300 operational facilities, 90 facilities under construction and 144 planned for
construction. Landfill gas can displace natural gas and other fossil fuels in most
applications. Landfill-gas-to-energy projects predominantly generate electricity (70%),
utilizing reciprocating engines, gas turbines, boiler/steam turbines, combined gas/steam
turbines and fuel cell technologies (Thorneloe S. et al., 1999).

39
CHAPTER 4
HYDRODYNAMICS OF LEACHATE RECIRCULATION
Leachate Generation and Quality
The major processes controlling leachate generation and re-circulation are
depicted in Figures 13 and 14. Leachate quantity is impacted by: precipitation, type of
site, groundwater infiltration, surface water infiltration, waste composition and moisture
content, preprocessing of waste (no baling or shredding practiced at Denton landfill),
cover design, depth of waste, climate, evaporation, evapotranspiration, gas production,
and waste density. Continuous leachate production occurs once the absorptive capacity of
waste has been satisfied. Leachate quantities are site specific, ranging from zero in arid
regions, to nearly 100 percent of precipitation in wet climates during active landfill
operation. Low quantities of leachate are produced at the Denton landfill during the rainy
seasons. Leachate production reaches a peak just before cell closure and then declines
significantly with the provision of surface grading and interim or final cover.
The model most frequently used to quantify the processes depicted in Figure 13,
is the Hydrologic Evaluation Performance (HELP) (Reinhart D.R. and Townsend T.G.,
1998).
The HELP program is a quasi-two-dimensional hydrologic model for conducting water balance analyses of landfills, cover systems, and other solid waste containment facilities (Schroeder P.R. et al., 1994b).
The model accepts weather, soil and design data and uses solution techniques that
account for the effects of surface storage, snowmelt, runoff, infiltration,
evapotranspiration, vegetative growth, soil moisture storage, lateral subsurface drainage,

leachate re-circulation, unsaturated vertical drainage, and leakage through soil,
geomembrane or composite liners. Landfill systems including various combinations of
vegetation, cover soils, waste cells, lateral drain layers, low permeability barrier soils,
and synthetic geomembrane liners may be modeled. The model facilitates rapid
estimation of the amounts of runoff, evapotranspiration, drainage, leachate collection and
liner leakage that may be expected to result from the operation of a wide variety of
landfill designs. The primary purpose of the model is to assist in the comparison of
design alternatives (Schroeder P.R. et al., 1994b). The HELP model is useful for long-
term prediction of leachate quantity, but is highly inaccurate for daily predictions.
Internal storage of leachate within the landfill is an important concept both to the
water balance used to calculate leachate generation rates and to the success of a leachate
re-circulation system. Internal storage of leachate is possible because the moisture
content of the incoming waste is generally below the absorptive capacity of the waste.
Field capacity is a function of waste composition, age, density and porosity. Less than 4
percent of the total waste stream (Brady P., 2000) received by Denton’s landfill, exceeds
the waste field capacity. This portion refers to the restaurant waste stream.
Fungaroli and Steiner (Fungarali A.A., 1979) developed a relationship between
field capacity and density, as shown in Equation 1, as well as finding that as the mean
Equation 1
ρ
θfc = 0.2 ln 1.6855 - 1.2
where: θfc = moisture content at field capacity, and
ρ = density, kg/m3
40

41
particle size decreases, field capacity increases.
Tchobanoglous (Tchobanoglous G. et al., 1992a) reported that field capacity
declines with landfill depth due to the compaction of the lower waste layers by the waste
overburden, as seen by Equation 2. Hentrich reported that shredded waste has a higher
moisture holding capacity (Reinhart D.R. and Townsend T.G., 1998).
Equation 2
W θfc = 0.6 –
22,000 + W
where: θfc = moisture content at field capacity, and
W = overburden weight at the mid height of the waste, kg

42
Figure 13 Schematic Landfill Bioreactor Diagram (Reinhart D.R. and Townsend T.G., 1998)
Figure 14 Wet Landfill Cell Schematic (Fiedler C., 1999)

43
Leachate Flow/Movement
Operating experience has shown that leachate is generated well before the model
calculations predict. Leachate generation may occur before reaching field capacity as a
result of uneven distribution of moisture, channeling and storm-water runoff from slopes
into the leachate collection system. Figure 15 shows the processes affecting moisture
movement through a landfill cell. Uneven moisture distribution is a natural consequence
of unsaturated flow. However, this is exacerbated by the heterogeneity of solid waste in
landfill cells. Impermeable items and the continued use of low permeable daily and
intermediate cover (Denton’s Landfill uses a tarp for daily cover, and soil for
intermediate cover) prevent even distribution of moisture and promoting horizontal
leachate movement. Gas production tends to block moisture paths in parts of the landfill
during early operation. Channeling declines over time as a result of landfill settlement, as
degradation of waste weakens the landfill structure and flow channels (Tchobanoglous G.
et al., 1992b).
The operative processes inherent to the natural stabilization phases occurring
within the landfill cell determine the fate of inorganic and organic compounds.
Contaminants tend to partition among aqueous, solid, and gaseous phases of the landfill.
Contaminant mobility and fate is largely determined by the magnitude of the preference
for one phase relative to another, which is a function of the physical/chemical
characteristics of both the contaminant and the phases present. Figure 16 depicts the
transport/transformation phenomena that may affect the environmental fate of a landfilled
contaminant. Mechanisms of mobility and transformation include biotransformation,

44
volatilization, dissolution and advection, sorption, and chemical reactions e.g.
precipitation, reduction, oxidation, and hydrolysis. Biotransformation and chemical
reaction can reduce contaminant mass, however a more toxic and/or mobile compound
may be produced. Dissolution and advection results in the movement of the compound
with the bulk flow through the waste pore spaces. Volatilization and transport by the
product gas can remove the more volatile contaminants from the landfill. Sorption and
precipitation can retard contaminant movement as the compound interacts with the solid
phase. Transport can be influenced by compound complexation or chelation, which can
either retard movement if the complex becomes associated with the solid phase or
enhance mobility if the compound “piggybacks” on a more soluble complexing agent.
The primary removal mechanism for metals in conventionally operated landfills
appears to be washout, although limited chemical precipitation may occur. In leachate re-
circulating landfills, the primary removal mechanism appears to be metal sulphide and
hydroxide precipitation. Subsequent capture within the waste matrix is via encapsulation,
sorption, ion exchange, and filtration. Leachate re-circulation stimulated reducing
conditions in lysimeters, providing for the reduction of sulphate to sulphide, which
moderated leachate metals to very low concentrations. The formation of metal sulphides
under anaerobic conditions effectively eliminated the majority of heavy metals in
leachate. With time, moderate to high molecular weight humic-like substances are
formed from waste organic matter in a process similar to soil humification. These
substances tend to form strong complexes with heavy metals. Remobilization of
precipitated metals can occur from complexation once the organic content has been
stabilized and aerobic conditions begin to re-establish. This supports the idea of

45
inactivating the landfill (removing all moisture) once the waste is sufficiently stabilized
(Reinhart D.R. and Townsend T.G., 1998).

46
Figure 15 Process Affecting Leachate Movement Through a Landfill (Reinhart D.R. and Townsend T.G., 1998)
Figure 16 Fate and Transportation Mechanisms for Contaminants in MSW Landfills (Reinhart D.R. and Townsend T.G., 1998)
47
Mathematical Modeling
Many factors affect moisture routing through a landfill. The U.S. Geological
Survey (USGS) has developed a mathematical model to consider the impact of these
parameters on design and operations. The Saturated and Unsaturated Flow and
TRAnsport (SUTRA) model was used to model the re-circulating landfill.
SUTRA is a finite-element simulation model for saturated-unsaturated, fluid-density-dependent ground-water flow with energy transport or chemically-reactive single-species solute transport. SUTRA may be employed for areal and cross-sectional modeling of saturated ground-water flow systems, and for cross-sectional modeling of unsaturated zone flow. In addition, solute transport simulation with SUTRA may be used for modeling of variable density leachate movement (Souza W.R. and Voss C.I., 1997).
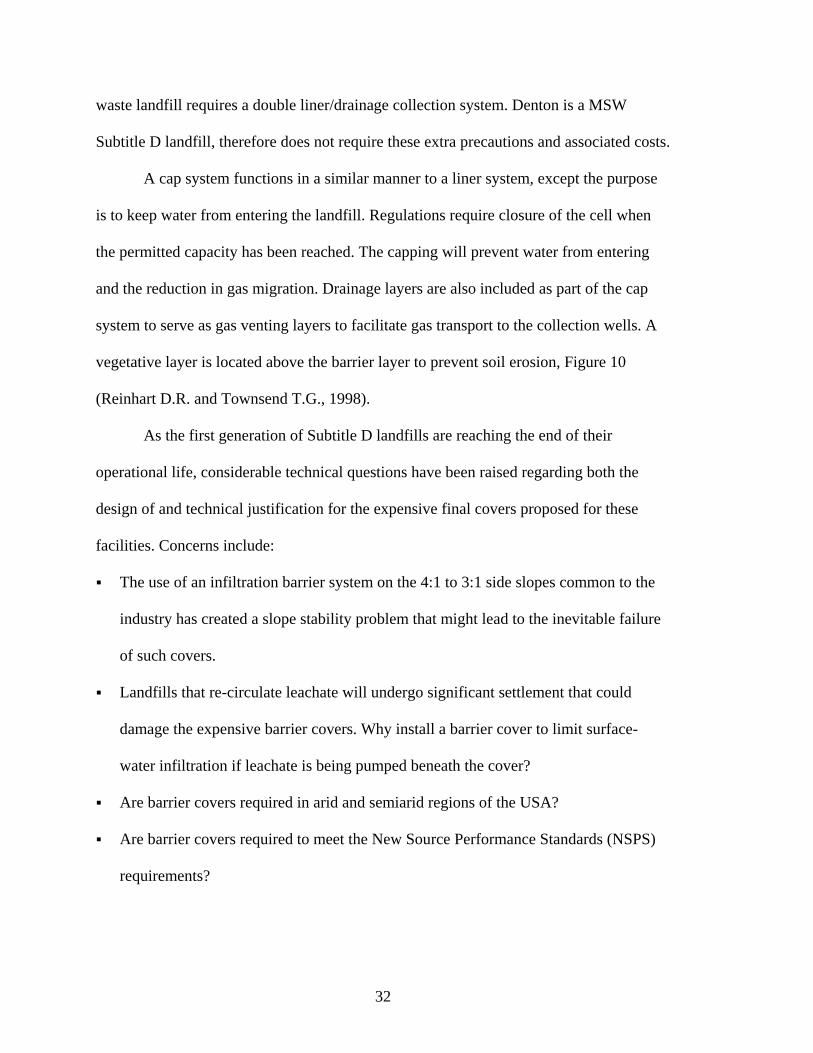
Leachate movement is predominantly characterized by unsaturated flow, except
for perched leachate over impermeable layers and leachate mounding near the bottom of
the landfill. Darcy's law, Equation 3, is used to describe unsaturated flow, just as it is
used for saturated flow (Davis M.L. and Cornwell D.A., 1991; Tchobanoglous G. et al.,
1992b).
Equation 3 Darcy's Law
dh
Q = - KA
dl
where Q = leachate discharge, m3/yr,
K = coefficient of permeability, m/yr,
A = cross-sectional area through which leachate flows, m2,
dh/dl = hydraulic gradient, m/m,
h = head loss, m,
l = length of flow path, m

48
However, there are some important differences. Under unsaturated conditions
pressure is less than atmospheric pressure, which explains why water will not flow into a
borehole drilled into the unsaturated zone. The minus sign in Darcy's law arises from the
fact that head loss always is negative, due to it being less than atmospheric pressure. The
capillary forces that hold water against gravity cause this negative potential. Water will
flow from a less negative to a more negative potential area, as long as the moisture
content is above field capacity. The suction head at field capacity is 100cm by definition,
therefore potential is extremely negative. As the moisture content increases, the suction
head declines, until it reaches zero at saturation.
The primary inputs to SUTRA are the physical characteristics of the solid matrix and fluid, porosity, permeability, dispersivity, and the unsaturated flow characteristics. Porosity is input on a node-wide basis while permeability and dispersivity are input by element. The SUTRA simulation is a mesh of nodes in cartesian coordinates which are then connected to quadrilateral elements. Output from the model provides degree of saturation (volume of water/volume of voids), fluid mass budgets, and depth of the head on the landfill liner as a function of the rate of leachate introduction and location or re-circulation device(s) (Souza W.R. and Voss C.I., 1997).
The power equations, Equation 4 (Reinhart D.R. and Townsend T.G., 1998),
developed by Korfiatis assumed that due to the dominance of paper and fibrous material
in the waste, the moisture retention characteristics of fine-grained materials could be used
as a preliminary description for the moisture retention characteristics of solid waste.
Figure 17 depicts the relationship between unsaturated hydraulic conductivity and
moisture content.

49
The Brooks and Corey equations, Equation 5 (Reinhart D.R. and
Townsend T.G., 1998), were used to model the sand and gravel components of
the model. The following example demonstrates the application of this model and
how well these correlations are represented on small-scale.
Equation 4 Power Law equations
θ h = hs θ s
Where: h = the suction head, m,
hs = saturation suction head, m,
θ = volumetric moisture content, dimensionless,
θ s = saturation volumetric moisture content, dimensionless,
b = suction head fitting parameter,
θ B
K = Ks θs
Where: K(θ) = hydraulic conductivity at θ, m/yr
Ks = saturated hydraulic conductivity, m/yr
θ = volumetric moisture content, dimensionless,
θ s = saturation volumetric moisture content, dimensionless,
B = permeability fitting parameter, dimensionless.

50
Orange County Florida Landfill Field Testing
A 7.6m deep, 3,700m2 test cell containing 4,800 Mg of municipal solid waste,
with an estimated density of 1,000kg/m3 was constructed with the specific goal of
monitoring leachate flow characteristics (Reinhart D.R. and Townsend T.G., 1998).
Leachate was introduced to the cell by a 1.5hp centrifugal pump discharging to a
6m long by 60cm wide and 60cm deep gravel-filled trench. Flow control was provided
permitting a range of leachate flow rates. Forty-eight cylinders were placed in horizontal
Equation 5 Brooks and Corey equations
h -2.75
kr =
hs
h 4
θ =
hs
Where: kr = relative hydraulic conductivity, unitless
θ = volumetric moisture content, wet basis, m3/m3
hs = saturation suction pressure, N/m2,
h = suction pressure, N/m2

51
lines at five levels within the cell. Electrical resistance of the cylinders was measured and
related to moisture content. A total of 49m3 of leachate was pumped into the test cell over
thirteen weeks. Leachate was introduced at rates of 0.38 to 0.5m3/day over a 1-hour
period. Moisture block data were recorded on an hourly basis.
Moisture content iso-clines were developed for each set of weekly data. Figure 18
depicts a typical iso-cline plot. The plots indicated that the wetting front spread in a
progressive fashion during periods of continuos moisture introduction. Horizontal
movement of leachate may have been less likely to occur compared to a more
conventional operation, due to the absence of daily cover in the test cell. The rate of
leachate movement through the test cell was used to calculate hydraulic conductivity that
ranged from 8.6x10⁻⁵ to 1.4x10⁻⁴ cm/sec for moisture contents of 40 to 70 percent, wet
basis.
The U.S. EPA funded the development of the Hydrologic Evaluation of Landfill
Performance (HELP) computer program. The advantage of this program over SUTRA,
are the two-dimensional and design alternative capabilities.
HELP is a quasi-two-dimensional hydrologic model of water movement across, into, through and out of landfills. The program was developed to conduct water balance analyses of landfills, cover systems, and solid waste disposal and containment facilities. As such, the model facilitates rapid estimation of the amounts of runoff, evapotranspiration, drainage, leachate collection, and liner leakage that may be expected to result from the operation of a wide variety of landfill designs. The primary purpose of the model is to assist in the comparison of design alternatives (Schroeder P.R. et al., 1994c).
By inputting the current Denton landfill data associated with "dry-tomb"
techniques and then adjusting the rainfall to that of a high rainfall climate to simulate
increased leachate/moisture, that would be necessary for a bioreactor to successfully

52
operate. The model will allow the user to determine the best bioreactor design needed.
The HELP program assumes Darcian flow, Equation 3, for vertical drainage through
homogeneous, temporally uniform soil and waste layers. It does not consider preferential
flow through channels such as cracks, root holes or animal burrows. As such, the
program will tend to overestimate the storage of water during the early part of the
simulation and overestimate the time required for leachate to be generated. Vertical
drainage is assumed to be driven by gravity alone and is limited only by the saturated
hydraulic conductivity and available storage of lower segments. The vertical drainage
rate out of a segment is assumed to equal the unsaturated hydraulic conductivity of the
segment corresponding to its moisture content. This is assuming that the moisture content
is greater than the field capacity or the soil suction of the segment is less than the suction
of the segment directly below it. The unsaturated hydraulic conductivity is computed by
Campbell (Schroeder P.R. et al., 1994c) hydraulic equation using Brooks-Corey,
Equation 5, parameters. It is assumed that all materials conducting unsaturated vertical
drainage have moisture retention characteristics that can be well represented by Brooks-
Corey parameters and the Campbell equation. The pressure or soil suction gradient is
ignored when applying the Campbell equation; therefore, the unsaturated drainage and
velocity of the wetting front may be underestimated. This is more limiting for dry
conditions in the lower portion of the landfill, as will probably be for the Denton landfill.
Percolation through soil liners is modeled by Darcy’s law, Equation 3, assuming
free drainage from the bottom of the liner. The liners are assumed to be saturated at all
times, but leakage occurs only when the soil moisture of the layer above the liner is
greater than the field capacity. Leakage through the geomembrane is modeled theoretical

53
and empirical equations. In all cases, leakage is a function of hydraulic head. The lateral
drainage model is based on the assumption that the lateral drainage rate and average
saturated depth relationship that exists for steady-state drainage also holds for unsteady
drainage. This assumption is reasonable for leachate collection, particularly for closed
landfills where drainage conditions should be fairly steady. Where drainage conditions
are more variable, such as in the cover drainage system, the lateral drainage rate is
underestimated when the saturated depth is building and overestimated when the depth is
falling. Overall, this assumption causes the maximum depth to be slightly overestimated
and the maximum drainage rate to be slightly underestimated. The long-term effect on the
magnitude of the water balance components should be small. As with leakage or
percolation through liners, the average saturated depth is computed from the gravity
water and moisture retention properties of the drain layer and other layers when the drain
layer is saturated. The program assumes that horizontal and vertical saturated hydraulic
conductivity to be of similar magnitude and that the horizontal value is specified for
lateral drainage layer.
Leachate re-circulation is assumed to be uniformly distributed throughout the
layer by a manifold or distribution system. Leachate collected on one day for re-
circulation is distributed steadily throughout the following day. Earlier discussions
demonstrated that there will be various heterogeneous conditions causing impervious
areas/layers for leachate and gas movement through the landfill cell.
The model can simulate water routing through or storage in up to twenty layers of
soil, waste, geosynthetics or other materials for a period of 1 to 100 years. The program
performs water balance analysis for a minimum period of one year, beginning January 1

54
and ending December 31. The condition of the landfill, soil properties, thickness,
geomembrane hole density, maximum level of vegetation, etc., are assumed to be
constant throughout the simulation period. The program cannot simulate the actual filling
operation of an active landfill. Active landfills are modeled a year at a time, adding a
yearly lift of material and updating the initial moisture of each layer for each year of
simulation. (Schroeder P.R. et al., 1994c)

Figure 17and Tow
Figure 18(Reinhar
Unsaturated Hydraulic Conductivity and Moisture Content relationship (Reinhart D.R. nsend T.G., 1998)
55
Leachate Movement Following Introduction using a Horizontal Trench -test cell, t D.R. and Townsend T.G., 1998)

56
CHAPTER 5
LITERATURE SURVEY
Laboratory Scale
Many lab scale studies have been conducted to investigate the effects of leachate
re-circulation on leachate quality, waste stabilization, waste settlement, gas production,
attenuation of heavy metals, and other factors.
Moisture content, pH, temperature, availability of macro- and micro-nutrients and
the presence of suitable micro-organisms are the main parameters controlling the process
of landfill stabilization and are therefore typically manipulated in lab studies.
Georgia Institute of Technology Experiment (Reinhart D.R. and Townsend T., 1999)
Conducted during the mid-1970s and supported by the USA EPA. This
experiment conclusively proved the effectiveness of leachate re-circulation on waste
stabilization. Conclusions drawn:
Leachate re-circulating columns produced low COD/TVA leachates in a
shorter time period as opposed to a more gradual decline in the control cell.
The peak COD and TVA concentrations in the leachate re-circulated columns
were less than the control column.
pH remained more neutral in the leachate re-circulated column than the
control column.
pH control and leachate re-circulation gave the best performance with rapid
decline in COD and TVA concentrations.

57
Inoculation with wastewater sludge did not accelerate the degradation process.
University of Louisville (Reinhart D.R. and Townsend T., 1999)
The lab scale study was performed to demonstrate the advantages of leachate re-
circulation and the feasibility of providing leachate treatment. Additionally the effect of
leachate pH and nutrient control on biological stabilization of shredded and unshredded
waste was determined. Conclusions drawn:
Leachate re-circulation with leachate control established anaerobic biological
population in the fill rapidly.
Nutrient control did not have any significant effect on stabilization of organic
content of the refuse
Shredding did not have any effect on biological stabilization of the refuse
Leachate re-circulation with pH control lead to accelerated biological
stabilization of the organic content of the refuse reducing the ultimate required
time for site use (land reclamation)
Leachate re-circulation with pH control lead to significant reductions in BOD,
COD, and TOC
Leachate re-circulation with pH control can be used as an effective leachate
treatment process.
Pilot Scale
Table 6 lists ten pilot scale bioreactor experiments that have clearly demonstrated
the advantages of operating a landfill cell as a bioreactor.

58
Location Dimension Techniques Applied Conclusion
Georgia Institute of Technology
4 columns: 0.9m diameter, 3m waste depth
Re-circulation, pH control, sludge addition
Re-circulation with pH control produced low organic strength leachate faster
Sludge had no effect Georgia Institute of Technology
4 columns: 0.9m diameter, 3m waste depth
Re-circulation, addition of priority pollutants
Re-circulation increased gas volume and rate, decreased leachate organic strength
Re-circulation promoted reduction of inorganic and organic pollutants
Georgia Institute of Technology
2 cells: 3m x 3m x 4.3m
Re-circulation, sealing of cell
Sealed re-circulation more conducive to methanogenic conditions than open air cell
University of Louisville
4 columns: 0.9m diameter, 2.4m waste depth
Re-circulation, shredding, pH control, nutrient addition
Re-circulation with pH control produced low organic strength leachate faster
Shredding and nutrient addition had no effect
Newcastle University 4 lysimeters: 0.5m diameter
Re-circulation, shredding, saturation vs free draining, waste density
Shredding increased degradation rate No benefit from saturation Lower density increased waste
degradation Bornhausen Landfill, Germany
4 columns: 1.5m diameter, 1.35m waste depth
Re-circulation, initial saturation, water input rate varied
Emission of inorganic and organic pollutants reduced due to re-circulation
No increase in gas production or quality

59
Bornhausen Landfill, Germany
3 cells: 50m2 x 4m 2 cells: 0.6ha x 2m
Re-circulation, thin layer compaction
Re-circulation cut stabilization in half
Binghamton, NY 9 cells: 17m x 23m x 6.4m
Re-circulation, sludge addition
Re-circulation and sludge addition improved gas and leachate quality
Delaware Solid Waste Authority
5 areas: 3.6 to 8.9ha Re-circulation: spray, recharge wells, horizontal infiltrators
Re-circulation accelerates waste biodegradation
Re-circulation improved gas quality and leachate at low capital cost
Lycoming, PA 52.6ha max depth 21m Re-circulation: spray, trenches, inspection wells
Re-circulation increases waste degradation and methane generation
Ponding and saturation lead to leachate outbreaks
Injection wells most efficient
Table 6 Summary of Pilot Scale Bioreactor Investigations (Reinhart D.R. and Townsend T.G., 1998)

60
Full Scale
Table 7 provides a brief overview of fifteen recent landfills that have been granted permission to implement full-scale
bioreactor tests in North America, U.K., Europe and Australia.
Location Size Start Up Date
Leachate Re-circulation Technique
Leachate Re-circulation
Cost
Comments
Kootenai Co., Idaho
7 acres 1993 (open) 1995 (leach. Recirc)
Surface spray (summer only) trenches 80’ spa Wells
$1,035,000 amortized + op = $449,600/yr
First lined landfill in Idaho
Bluestem SWA, Linn Co. Iowa
0.5 acres 8500 tons waste divided into 2 subcells
1998 Trenches 15’spa 2820 gals/d
$959,000 (cell construction)
Experimenting with bag opening, biosolids addition
Milwaukee
200’ x 40’ 1999 Trenches NA No compaction, shredded, biosolids added
Keele Valley LF Toronto, Canada
Pilot 1990 Vertical wells – 0.5 wells/acre ~50-100 gpm
Well water added to adjust MC not leachate
Eau Claire, WI 7 Mile Creek SL
800 tpd landfill, phase 1 at200
Trenches 25’ spa 1.8 gpd/ft2
NA Tire chips acceptable in trenches, gas production increased by 25% in wells near recirculation
Yolo County, CA
2 10,000 ft2 cells 9,000 lb MSW each 40’ deep
1995 14 infiltration trenches at surface
$563,000 (cell con-struction)
Enhanced gas production, settlement, Shredded tires successful in LFG collection

61
Lower Spen Valley LF West Yorkshire, UK
2 cells ~ 950 tonnes waste ~ 9600 ft2 ea ~ 18 ft deep
1991 Trenches NA Biosolids and wastewater addition Low temperture prevented max. gas production
Crow Wing MSW LF, Minn
12.8 acres 1997 11 trenches, 50’ spacing, filled with shredded tires, 25 g/d/ft
$290,000, $72,500 savings/yr (1997-8)
No off site hauling of leachate in 1998, Recirculation operated 3 mos/yr
Worcester Co. LF, MD
17 acres, 80’ deep
1990 Vertical wells surrounded by 25’ of gravel blanket
$50,000 Net benefit $3.2 mill per 17-acre cell (after mining)
Avg. 65% of leachate recirculated Upper layers did not degrade extensively
North Central Georgia
78.5 ac 1996 Sprayed on the working face during day
$0.011/gal leachate
5 % increase in compaction achieved
Lyndhurst LF, Melbourne, Australia
1.3 ha 1995 Recharge wells and trenches
NA Complete instrumentation for monitoring leachate, temperature, gas, climate, moisture distribution, head on liner
VAM Waste Treatment, Wijster, the Netherland
7062 m2 1997 Trenches 10 m hor, 3 m vertical spacing (plus surface infil-tration at 5 m spacing)
NA Gas collection in wood chips at the top liner. Filled with mechanically separated organic fractions <45 mm diameter
Baker Rd LF, Columbia County, Georgia
8 acres, 10 ft deep
1996
20 vertical wells.
$25 – 30,000 capital, O& M costs not reported
Air injected into LCS system, Settlement increased by 4.5%, biodegradation rate increased by >50%

62
Live Oak LF, Atlanta, Georgia, USA
2.5 acres, 30 ft deep
1997 27 vertical wells, 5-15 ft deep, 18 air injection wells
Air and liquid injection into same well improved fluid distribution
Trail Road LF, Ontario, Canada
270 m x 500m 1992 Infiltration lagoons
NA Lagoons were moved around ~ 50% of field capacity achieved
Table 7 Recent Full-Scale Bioreactor Landfill Tests, (Reinhart D., 1999)

63
Other investigations that are also occurring deal with treating the leachate before
discharging to publicly owned wastewater treatment works. The Huneault Landfill,
located in the city of Gloucester, Ontario, receives construction/demolition waste and
industrial/commercial/institutional waste. The landfill produces about 57,000 m3/yr of
leachate.
A system consisting of a peat filter followed by an engineered wetland was
selected to treat leachate before discharging it into the receiving environment. Laboratory
batch adsorption and continuous column studies demonstrated that the peat filter is highly
effective in leachate treatment. Removal rates of 85%, 99%, and 85% were achieved for
iron, lead and zinc, respectively. As much as 30% removal was achieved for boron and
34-47% removal was observed for BOD5.
The peat filter and engineered wetland treatment system was designed and
constructed in 1994/1995 and came into operation in August of 1995. This system
consists of four cells, the first one comprising of the peat filter and the other three cells
serving as free surface water engineered wetlands.
Field monitoring of the peat filter and engineered wetland based on two sampling
events showed removal efficiencies of 83%, 94%, 99%, 55% and 87% for boron, iron,
lead, zinc, and BOD5 respectively. These results confirm that this system is quite
effective for the treatment of leachate (Castonguay N. et al., 2000).
Table 8 shows a comparison describing the noticeable leachate quality
differences, which is attributed to a large extent to the type of waste being landfilled.

64
Denton landfill will have its own unique characteristics too. Treatment methods will
therefore need to be specific to each landfill's leachate.

65
Table 8 Leachate Quality Comparison from Ontario Landfills, (Castonguay N. et al., 2000)
Min Max Avg Min Max Avg Min Max Avg Ammonia 0.1 26.51 15.82 <0.1 1302 318.79 0.03 1302 171.3 BOD5 1.6 81 26.56 270 66000 14176 1 66000 4975.6 Alkalinity 185 1696 1370.4 691 11640 5459 7 11640 2626 Nickel 0.02 0.17 0.05 0.01 0.3 0.07 Copper 0.0016 4.5 0.52 0 1.05 0.11 <0.001 8.8 0.11 Diss. Org. Carbon 17.5 114 82.6 29 14365 4064 1 14365 1630.9 Tot. Kjeldahl N 2.1 37.7 26.6 6.2 2488 561.2 0 2488 256.3 Boron 0.37 12 8.79 0.34 5.1 2.52 0.12 63.2 10.53 Iron 0.003 8.086 3.11 0.38 3853 395.91 0.03 3853 130.79 Conductivity 669 4540 3533 700 21500 9833 475 26100 6088 Diss. Inorg. Carbon 16 455 282.3 1 5800 497.3 TDS 1920 2572 2193 196 9030 4327 Potassium 11.8 80.4 63.63 5 899 275.6 0.1 2000 207 Magnesium 17 171 106.97 16.4 1972 438.6 4.8 7600 231.9 Sodium 53.9 476 332.94 28.4 8760 1473.2 6.1 8760 577.1 Manganese 0.13 8.56 1.97 0.01 14.1 2.73 Organic N 1.27 37.6 12.54 Phenols 0 1.12 0.03 6 6620 1760 0 6620 493.8 COD 69.2 2897 242.65 558 37209 16050 1 47300 7855.2 TSS 12 140 57.14 <10 3210 458 3 8130 445 Chlorides 45.5 1260 349.17 39 5448 1691.7 4 5448 744.9 Lead 0 0.28 0.03 0 0.58 0.04 0 0.8 0.05 Zinc 0.01 1.83 0.04 0 82.6 1.47
Notes: all concentrations are in mg/l
HUNEAULT LANDFILL (1990 1995)
NEPEAN LANDFILLS ONTARIO LANDFILLS

66
CHAPTER 6
BIOREACTOR DESIGN
Design
For the most part, state and federal regulations (primarily RCRA Subtitle D)
dictate the design of the modern landfill. Required design components include the liner,
leachate collection facilities, gas collection and management facilities, and final cap.
These same components must be adapted during the operational period of the bioreactor
landfill to manage leachate, including liquid introduction, and to handle enhanced gas
generation. The following issues must be addressed to produce a successful project that
satisfies regulatory concerns (Pacey J. et al., 1999; Pacey J. et al., 1999).
Cell Size
For economic and regulatory reasons, an emerging trend in traditional landfill
design is to build deep cells (or phases) that are completed within two to five years. This
trend bodes well for bioreactor landfill evolution. Phased cell construction can more
easily take advantage of emerging technological developments, rather than committing
long term to a design that might prove to be inefficient. Denton's Landfill Site Plans
Appendix shows that phased cell construction is being utilized. Once closed,
methanogenic conditions within the cell (phase) are optimized and gas generation and
extraction are facilitated. However, extremely deep landfills might be so dense in the
lower portions that refuse permeability will inhibit leachate flow. In these instances, it

67
might be necessary to limit addition and/or re-circulation to the upper levels or develop
adequate internal drainage management capability.
Maximum Allowable Leachate Head
Federal regulations prescribe a 0.305m (Wells J., 1999) maximum allowable
leachate head on the bottom liner. This criterion can be readily achieved through
appropriate design and bottom-liner slopes, drainage-layer flow distances, and hydraulic
conductivity of the leachate drainage layer. The design can be aided by the use of
mathematical models such as HELP3 developed by the Army Corps of Engineers
(Schroeder P.R. et al., 1994a). Since leachate-head predictions are based on mathematical
models, regulatory agencies may require monitoring to verify performance.
Liquid Management
An estimate of the design flow rates and liquid storage and supplementation
capacity must be developed for the liquid management system. Sufficient storage will be
required to ensure that peak leachate-generation events can be accommodated. Sufficient
liquid supply (i.e., leachate, water, wastewater, or sludge) must be ensured to support
project goals. The volume of liquid needed to reach waste field capacity can be based on
prior field studies, model predictions, or landfill-specific measurement. Expressed as a
volume per mass of solid waste, the range of liquid addition to reach field capacity is
104,306 - 208,612 liters per 1,000 tonnes (Wells J., 1999) of solid waste (Reinhardt J.J.
and Ham R.K., 1974).

68
There are various methods of adding liquid. Methods that directly apply the
leachate and water to the solid waste can target moisture supplementation levels during
active landfilling. One option is to apply the liquid at the working face as refuse is placed
into the landfill. In this case, however, operators must be prepared to deal with increasing
gas generation shortly thereafter. Another option is to add moisture after waste
placement, which controls the onset of rapid gas generation. Applying leachate and water
to solid waste already in place can be accomplished by using surface irrigation systems,
infiltration ponds, injection wells, or trenches. Selection considerations include climate,
malodors, worker exposure, environmental impacts, evaporative loss, reliability,
uniformity, and aesthetics. Buried trenches or vertical wells offer advantages of minimum
exposure pathways, good all-weather performance, and favorable aesthetics. However,
they may be adversely impacted by differential settlement. Guidance on liquid addition,
alternative design, and performance can be found in Reinhart and Townsend (1997)
(Reinhart D.R. and Townsend T.G., 1998).
Adding liquid to solid waste will increase its density, which can be of critical
importance in the design of load-bearing structural members in the landfill. Most notably,
the leachate and LFG collection system must be designed to accommodate the increased
load, which may be as much as 30% heavier because of expected moisture uptake and
settlement. The design process for determination of the buried leachate pipe load-bearing
capacity is described in (Harrison S. and Watkins R.K., 1996).

69
Landfill Gas Control System.
A bioreactor landfill will generate more LFG in a much shorter time than a drier
landfill will. To efficiently control gas and avoid odor problems, the bioreactor LFG
extraction system may require installation of larger pipes, blowers, and related equipment
early in its operational life. Horizontal trenches, vertical wells, near-surface collectors, or
hybrid systems may be used for gas extraction. Greater gas flows are readily
accommodated by increased pipe diameter as capacity increases as the square of pipe
diameter.
Liquid addition systems should be separate from gas extraction systems to avoid
flow impedance. The porous leachate removal system underlying the refuse should be
considered for integration with the gas extraction system.
Enhanced gas production can negatively impact side slopes and cover if an
efficient collection system is not installed during active landfill phases. Uplift pressure on
geomembrane covers during installation can cause ballooning of the membrane and may
lead to some local instability and soil loss. Temporary venting or aggressive extraction of
gas during cover installation might facilitate cover placement. Once the final cover is in
place, venting should be adequate to resist the uplift force created by LFG pressure
buildup. The designer should consider the pressure buildup condition on slope stability
when the collection system is shut down for any significant amount of time.
Landfill Stability
Addition of liquid into the refuse to increase biological activity will increase the
total weight of the refuse mass and may cause an increase in internal pore pressure. This

70
stability issue can be readily assessed and resolved with standard geotechnical analyses
(Maier T.B., 1998). Seismic effects should also be considered during geotechnical
analysis, when appropriate.
Settlement
A bioreactor landfill will experience more rapid, total, and complete settlement
than will a drier landfill. Accelerated settlement results from both an increased rate of
solid waste decomposition and increased compression through higher specific weights.
Settlement during the landfilling operations will impact the performance of the final
surface grade, surface drainage, roads, gas-collection piping system, and leachate-
distribution piping system. Because of the significant increase in settlement magnitude
and rate, it could be very beneficial to overfill the refuse above design grade before
placement of the final cover. Alternatively, a significant benefit may accrue if final cover
and final site-improvement installations are postponed and the rapid settlement is used to
recapture airspace. Settlement impacts can be readily accommodated by the project
design. Since settlement will be largely complete soon after landfill closure, long-term
maintenance costs and the potential for fugitive emissions will be avoided.
Operations
The bioreactor landfill is a waste treatment system. During landfill operations, it
requires closer attention to system performance than the drier landfill does. Successful
operation of a bioreactor landfill depends on control and monitoring of biological,
chemical, and hydrologic processes occurring within the landfill. Operational and

71
maintenance programs addressing settlement, LFG, and leachate may be reduced to a
minimal level once the landfill is closed and the refuse is largely stabilized.
Pretreatment or Segregation
Bioreactor operations are most efficient and effective where the refuse has high
organic content and large exposed specific surface area. For this reason, bioreactor
operations should be concentrated on waste segregated to maximize its organic content
and shredded, flailed, or otherwise manipulated to increase its exposed surface area.
Waste segregation could include separation of construction and demolition wastes from
MSW. Limited shredding can be obtained by spreading refuse in thin lifts and using
landfill equipment to break open plastic bags and break down containers. Mechanical
shredding can be efficient and effective in reducing particle size and opening bags;
however, it is an intensive, high-maintenance, and high-cost activity that might not be
cost-effective. Moreover, shredded wastes may become exceedingly dense after
placement, thereby limiting moisture penetration.
Leachate Seeps
Adding liquids to solid waste landfills increases the potential for leachate seeps or
breakouts, and the landfill must be operated to minimize such possibilities. Leachate must
be precluded from contaminating storm-water runoff. Monitoring for leachate seeps is
mandatory, and the operations plan must include a rapid response action to correct
leachate seeps as they develop. Such measures as installation of slope and toe drains,
surface regarding, filling and sealing cracks as necessary to reduce surface-water

72
infiltration, and reducing the liquid addition rate are some of the standard methods used
to address this condition. Managing liquid addition rate, amount, and location can limit
the potential for slope seeps.
Daily and Intermediate Cover
The use of soil cover in a bioreactor landfill requires special attention. A cover
more permeable than the waste can direct leachate to the sides, where the leachate must
be properly collected and drained. Low-permeability daily cover can create barriers to the
effective percolation of leachate and water (Miller L.V. et al., 1991). It can also impede
leachate distribution and LFG flow to collection and distribution systems; its ability to
serve as a barrier should be reduced through scarifying, or partial removal, prior to
placing solid waste over it. When placed within 15.24m of the slopes, it should be graded
to drain back into the landfill to preclude leachate from reaching the slope and emerging
as a seep. Use of alternative covers that do not create such barriers can mitigate these
effects. In many cases, alternative covers have been found to be quite cost-effective when
compared to soil.
Nutrients and Other Supplemental Additions
Nutrient requirements are generally supplied by waste components (Barlaz M.A.
et al., 1990), but research suggests that nutrients and other biological and chemical
supplements may enhance biological activity. Addition of such supplements has not yet
been attempted in the field. As with waste segregation, or shredding, the costs of
nutrients and other additions will need to be justified.

73
Optimum pH for methanogens is approximately 6.8-7.4. Buffering of leachate in
order to maintain pH in this range has been found to improve gas production in
laboratory studies. Particular attention to pH and buffering needs should be given during
early stages of leachate re-circulation. Careful operation of the landfill bioreactor initially
through slow introduction of liquids should minimize the need for buffering.
Bioreactor Management
It is important that operators of each bioreactor project develop a detailed and
thorough management plan addressing project goals: design, operation, and maintenance;
training; monitoring; contingency considerations; and QA/QC elements. All issues and
solutions should be addressed in detail within these programs to the satisfaction of
regulators and the public. The bioreactor landfill is possible now that Subtitle D mandates
an environmentally secure environment. Within Subtitle D, some management flexibility
is allowable to optimize the benefits available through controlled management of the
organic decomposition process. Under certain conditions, the bioreactor landfill as seen
in Figure 19, may be a viable technical option for landfill management.

74
Figu
re 1
9 B
iore
acto
r D
esig
n {P
hane
uf ,
R.J
. and
Van
a, J
.M.,
1999
}

75
Hydrologic Evaluation of Landfill Performance Model
Chapter 4 defined how the HELP program functioned. The following data was
input into the HELP model: (Schroeder P.R. et al., 1994a)
1. Units: Customary
2. Location:
City Name and State: Denton, TX
Latitude 33.12
3. Temperature data file names
Denton Climatic Data Appendix shows some of the data
Minimum Temperature: 1960-1990 daily minimums
Maximum Temperature: 1960-1990 daily maximums
4. Evapotranspiration information:
Evaporative Zone Depth: 12.0 in
Max. Leaf Area Index: 3.5
Growing Season Start Date: 63 (based on Dallas)
Growing Season End Date: 329 (based on Dallas)
Average Wind Speed: 9.5 mph
Relative Humidity - First Quarter: 66% (based on Dallas)
Relative Humidity - Second Quarter: 68% (based on Dallas)
Relative Humidity - Third Quarter: 63% (based on Dallas)
Relative Humidity - Fourth Quarter: 66% (based on Dallas)

76
5. Precipitation data:
Denton Climatic Data Appendix shows some of the data
Daily Precipitation: 1960-1990 daily recordings
7. Solar radiation data
Use simulation generated data based on climatic inputs
8. Soil and design data file name
Layer types: 4 - vertical percolation, lateral drainage, barrier soil liner, and
geomembrane liner with associated layer thickness, soil texture no, total
porosity, field capacity, wilting point, saturated hydraulic conductivity,
max drainage length, drain slope, leachate/drainage re-circulation, re-
circulate to layer #, subsurface inflow, geomembrane pin-hole density,
geomembrane installation defects, geomembrane placement quality,
geotextile transmissivity.
Program has default data to aid in the determination of input values. Used
Denton Landfill Phase 2 landfill design to guide decision-making.
9. General landfill and site information
Assumed 9 acre cell with 100% possible runoff
Program was allowed to determine initial moisture content
10. Soil Conservation Service runoff curve number information
Program permitted to compute curve number

77
CHAPTER 7
RESULTS AND DISCUSSION
Hydrologic Evaluation of Landfill Performance
One of the objectives for this feasibility study was to utilize the Hydrologic
Evaluation of Landfill Performance (HELP) model. The environmental engineering
design program is used to assist landfill design engineers to consider the many factors
specific to the conditions of the potential landfill. The Corp of Engineers released version
does have a user-manual, but no live technical support. Without sufficient programming
experience to debug all the errors, it was not possible to make the program run the full
simulation, after loading all input data.
The DFW landfill is benefiting from the capture of methane, powering electric
generators, which is providing electricity to homes in the Dallas-Ft.Worth metroplex.
This landfill receives similar municipal waste to the Denton landfill, and is also located in
a similar climate and soil region. However, if they had a bioreactor cell in operation, the
methane generation and degradation rates would in all likelihood be far higher.
Areas of Refinement
Debugging the HELP software program to ensure that all data would be accepted
to run the simulation, would aid in a more accurate feasibility assessment for a bioreactor.
The model does allow for up to 100 years of data to be entered. However, only 10
years of daily precipitation and temperature were entered due to programming
malfunctions. The program was allowed to compute hourly solar radiation. An
improvement to this could be through the collection of solar radiation data from another

78
WBAN station and then applying the necessary algorithms to more accurately reflect the
conditions at Denton. The evaporative zone depth, maximum leaf area index, growing
season and humidity were based on Dallas, TX default data supplied with the program.
This could be refined to more closely depict the Denton Landfill conditions, if data could
be collected on the premises.
Values and Preferences
Statutes enacted during the 1960s and 1970s reflect public attention to the workplace and the environment; they resulted from political deliberation about what a decent, self-respecting society with a particular history would do about the work-place, the environment, civil rights, and public safety and health. These laws express a common perception of ourselves and the values we stand for as a moral community; they are not intended to satisfy personal preferences. When we make public law and public policy, we put both the devil and the policy analyst behind us, for we are to consider shared values and common intentions, not simply personal interests. Public issues must be discussed in public terms. What counts in public policy is a conception of right and wrong - a conception of the good society - not just what works for you (Sagoff M., 1988).
Sustainable Development
We can make educated guesses about where we are heading, by recognizing some
of the major trends from the past and present. An old Chinese proverb states: if you do
not change the direction in which you are headed, you will end up where you are headed.
Worldwatch Institute believes that by 2030 alternatives to the current dependence
on fossil fuels will have taken place. Northern Europe and the United States will
hopefully have become far more reliant on wind power and hydropower. Northern Africa

79
and the Middle East would utilize direct sunlight as their main energy source. Japan,
Indonesia, Iceland and the Philippines would be tapping their ample geothermal energy
reserves (Seitz J.L., 1995).
The throwaway mentality that has been so prevalent in the United States is slowly
being replaced by the recycling mentality. Many countries have developed a recycling
program, but waste reduction in the packaging of goods still needs to be strongly
encouraged. Alternative waste disposal methods such as the bioreactor technology,
encourage the productive use of greenhouse gases, while accelerating the decomposition
process.

80
CHAPTER 8
RECOMMENDATIONS FOR FUTURE RESEARCH
Science contributes moral as well as material blessings to the world. Its great moral contribution is objectivity, or the scientific point of view. Professors serve science and science serves progress. It serves progress so well that many of the more intricate instruments are stepped upon and broken in the rush to spread progress to all backward lands (Leopold A., 1966).
Nontechnical Barriers to the Bioreactor Landfill
Research and limited field-scale experience offer solid technical evidence of the
value of the bioreactor landfill. The challenges of non-technical barriers still face the
bioreactor landfill. Principal among these is:
Limited regulatory awareness and negative perception;
Absence of site-specific performance quantification;
Limited availability of project economic assessments;
Insufficient project-sustainability experience;
Lack of financing experience;
Extended time expectations for planning, permitting, and licensing; and
Increased regulatory constraints and conditions.
These non-technical issues and uncertainties must be researched further to fully
evaluate the viability of potential projects and gain acceptance for the concept (Pacey J.
et al., 1999).

81
Denton Landfill Impact Assessment
An impact assessment was performed when originally siting the landfill for
Denton. Creating a new baseline of data before moving toward bioreactor technology,
would verify any significant changes especially with regards air quality, surface water,
soil and ground water, visual impacts, and socio-economics resulting from this change in
processing and handling of the waste stream (Canter L.W., 1996).
Limit Environmental Impacts
Rapid stabilization offers a major long-term environmental benefit in terms of
reducing risk: Waste and leachate will have been exposed to all potential detrimental
environmental impacts during the operational life of the landfill, rather than during a long
post-closure period. Post-closure liquid flowing through the waste should not increase gas
generation nor result in further release of organic or metal constituents into the leachate.
Most external environments should be able to naturally manage long-term waste-related
emission or leakage from a well-managed bioreactor landfill.
Waste stabilization is a relatively gray term in literature. Life cycle consideration
for the bioreactor landfill is for 20, 100, or 500 years. For the purpose of the bioreactor
landfill, food, green-waste, and paper products can be biodegraded to a stabilized status
within a few years of landfill closure. The level to which these items are degraded in the
bioreactor landfill extends well beyond what would otherwise occur in the conventional
Subtitle D landfill, even in the event of total failure of its environmental containment
system. Other organic constituents, such as wood, rubber, plastic, leather, and textiles, are

82
slowly degradable and should not pose much of a long-term environmental threat from
either a greenhouse gas or groundwater standpoint (Pacey J., 2001).
Economics
The bioreactor landfill offers several well-known and proven processes to achieve
rapid degradation, and thus stabilization, of the relatively rapidly degradable organic
waste materials within a relatively short term. Although it requires increased management
and more environmental controls, the bioreactor landfill can result in enhanced
performance, fewer long-term environmental risks, and higher potential revenue to help
defray operational costs. Over the long term this should result in considerable
environmental and cost savings.
The operational issues for the bioreactor landfill are the same as have been
permitted in the past.
Recognition of the potential environmental and economic benefits of the
bioreactor has brought a new focus on the use of anaerobic and aerobic bioreactor
processes. With the advent of Subtitle D landfills, there are now real possibilities to
rapidly stabilize our waste so as to minimize post-closure environmental risk and gain
near-term environmental and economic benefit. The bioreactor process is not
complicated. Although the degree of management and monitoring is more sophisticated
and challenging than with the conventional landfill, the benefits can be outstanding
(Pacey J., 2001).

83
Summary and Conclusion
It is now time to seriously consider acceptance and adoption of the bioreactor
landfill as a key strategy for deriving short- and long-term environmental, regulatory,
monetary, and societal benefits. The bioreactor option is a direct result of engineering and
building a new generation of environmentally sound landfills. It provides environmental
security while permitting and encouraging rapid stabilization of readily and moderately
decomposable organic waste components. It is hoped that the emerging bioreactor-
landfill technology will point our solid waste industry toward taking a new look at a very
effective option to managing our waste disposal.
In human affairs, the logical future, determined by past and present conditions, is less important than the willed future, which is largely brought about by deliberate choices - made by the human free will. Rene Dubos (Seitz J.L., 1995).

84
REFERENCE LIST
1. Unedited Local Climatological Data, WBAN 03991 [Web Page]. Located at:
http://nndc.noaa.gov/?http://ols.ncdc.noaa.gov/cgi-bin/nndc/buyOL-002.cgi.
Accessed 2000 Jan.
2. Ball C. (Sr Crew Leader, Landfill). City of Denton Landfill, 901 Texas St, Denton,
TX 76205. 2000.
3. Barlaz MA, Ham RK, Schaefer DM. Methane Production from Municipal Refuse.
Critical Reviews in Environmental Control 19(6):557. 1990.
4. Brady P. Characterizing The Municipal Solid Waste Stream in Denton, TX [Thesis]
University of North Texas, Denton, TX. 2000.
5. Canter LW. Environmental Impact Assessment. 2nd ed. Irwin McGraw-Hill. 1996.
6. Castonguay N, Eng P, Fernandes L, Sartaj M. Peat Filter and Engineered Wetland
Combined System for Treatment of Landfill Leachate [Web Page]. Located at:
http://www.computan.on.ca/~ffg/peatfilt.htm. Accessed 2000 Nov 2.

85
7. Cox S. 2000 May. Horizontal collector wells for landfill gas extraction [Web Page].
Located at: http://www.soton.ac.uk/~sunrise/gas%20wells.htm. Accessed 2001 Nov.
8. Danish Environmental Protection Agency. Landfilling of Waste [Web Page]. Located
at: http://www.mst.dk/default.asp?Sub=http://www.mst.dk/udgiv/publications/
2000/87-7909-605-0/html/kap08_eng.htm. Accessed 2001 Jan.
9. Davis ML, Cornwell DA. Introduction to Environmental Engineering. 2nd ed. USA:
McGraw-Hill Inc. 1991.
10. Duff S. EPA Sets Landfill Emissions Limits. Waste News 5(27):4. 1999.
11. Fiedler C (Fiedler, Charles). 1999/ Aug 31. Bioreactor. [E-mail to Roberts, Elizabeth
(Roberts, Elizabeth)].
12. Fungarali AA. U.S. Environmental Protection Agency: U.S. Environmental
Protection Agency. 1979.

86
13. Harrison S, Watkins RK. HDPE Leachate Collection Pipe Design by Fundamentals of
Mechanics. Proceedings Nineteenth International Madison Waste Conference,
Municipal and Industrial Waste . 1996.
14. Hermansson E, Nelson S. Biogas in Lusaka? Feasibility Study: Possibilities to Extract
and Utilise Biogas from Municipal Solid Waste in Lusaka, Zambia
Lund Institute of Technology, Sweden. Master’s Thesis . 2000.
15. Hudgins M, Harper S. Operational Characteristics Of Two Aerobic Landfill Systems.
International Waste Management and Landfill Symposium 7. 1999.
16. Hunt WC, Prof. Engineer. (Emcon). Denton, TX: City of Denton. Purchasing
Department, 901 Texas Street, Denton TX 76201. 2000.
17. Leopold A. A Sand County Almanac. Oxford University Press. 1966.
18. Maas J. 1997 Jul 31. Tier I/II Designation and Screening Process [Web Page].
Located at: http://www.epa.gov/swerosps/bf/html-doc/screen.htm. Accessed 2001
Jan.

87
19. Maier TB. Analysis Procedure for Design of Leachate Recirculation Systems.
Proceedings of the SWANA Landfill Symposium . 1998.
20. McDonald D. Tijuana dump, Mexico [Web Page]. Located at:
http://www.campharmony.org/lift/tour/landfill.htm. Accessed 2000 Dec.
21. Miller LV, Mackey RE, Flynt J. Evaluation of a PVC Liner and Leachate Collection
System in a 10-Year-Old Municipal Solid Waste Landfill. SWANA's Annual Solid
Waste Exposition 29. 1991.
22. Pacey J, Augenstein D, Morck R, Reinhart D, Yazdani R. The Bioreactor Landfill -
An Innovation in Solid Waste Management. TNRCC Environmental Trade Fair .
1999.
23. Pacey J. Bioreactor Landfill: An Overview Perspective. MSW Management, Journal
for Solid Waste Professionals 11(1). 2001.
24. Pacey J, Augenstein D, Morck R, Reinhart D, Yazdani R. The Bioreactive Landfill.
MSW Management, Journal for Solid Waste Professionals 9(5):53-60. 1999.

88
25. Phaneuf RJ, Vana JM. Landfill Bioreactors - A New York State Regulatory
Perspective. TNRCC Environmental Trade Fair 1999 . 1999.
26. Planning and Development Department. (City of Denton, TX). Denton, TX Denton
Planning and Development Department, City Hall West, 221 North Elm Street,
Denton, TX 76201. 1999.
27. Pohland FG, Harper SR. Critical Review and Summary of Leachate and Gas
Production from Landfills.
28. Solid Waste Milling and Disposal on Land Without Cover. Cincinatti, Ohio: U.S.
E.P.A. Vol. PB-234 930, 1974.
29. Reinhart DR, Grosh CJ: University of Central Florida, Civil and Environmental
Engineering Department. 97-3 .State University System of Florida, Florida Center for
Solid and Hazardous Waste Management, 2207 NW 13 Street, Suite D, Gainesville, FL
32609. 1998.
30. Reinhart DR, Townsend T. Optimization of Leachate Introduction in Anaerobic
Bioreactor Landfills. TNRCC Environmental Trade Fair 1999 2:169-71. 1999.

89
31. Reinhart DR, Townsend TG. Landfill Bioreactor Design and Operation. Boca Raton,
NY: Lewis Publishers. 1998.
32. Reinhart D (Reinhart, Debra). 1999/ Aug 30. Bioreactor. [E-mail to Roberts,
Elizabeth (Roberts, Elizabeth)].
33. Richardson GN, Sprague RT. Coordinating Regulations in Design and Construction
of Modern Landfill Liners and Closure Caps. MSW Management, Journal for Solid
Waste Professionals 10(3):92-103. 2000.
34. Roberts EM. (Manager, City of Denton). Solid Waste Department, City of Denton,
901 Texas Street, Denton, TX 76205. 2000.
35. Sagoff M. The Economy of the Earth Cambridge University Press. 1988.
36. Schroeder PR, Aziz NM, Lloyd CM, Zappi PA. User's Guide for Version 3. The
Hydrologic Evaluation of Landfill Performance (HELP) Model EPA-600-R-94-168a.
1994a.

90
37. Schroeder PR, Dozier TS, Zappi PA, McEnroe BM, Sjostrom JW, Peyton RL.
Engineering Documentation for Volume 3. The Hydrologic Evaluation of Landfill
Performance (HELP) Model EPA-600-R-94-168b. 1994b.
38. Schroeder PR, Dozier TS, Zappi PA, McEnroe BM, Sjostrom JW, Peyton RL.
Engineering Documentation for Volume 3. The Hydrologic Evaluation of Landfill
Performance (HELP) Model EPA-600-R-94-168b. 1994c.
39. Seitz JL. Global Issues: An Introduction. Oxford, UK: Blackwell Publishers Ltd. p
152, 207, 214. 1995
40. Solid Waste Management. 2000 Oct. City of Memphis - Solid Waste History [Web
Page]. Located at: http://www.memphiswaste.org/statistics/sw_history.htm. Accessed
2000 Dec.
41. Souza WR, Voss CI. (USGS). U.S. Geological Survey, Hydrologic Analysis Software
Support Program, 437 National Center, Reston, VA 20192 . 1997.
42. Tchobanoglous G, Theisen H, Vigil H. Integrated Solid Waste Management:
Engineering Principles and Management Issues McGraw-Hill. 1992a.

91
43. Tchobanoglous G, Theisen H, Vigil H. Integrated Solid Waste Management:
Engineering Principles and Management Issues McGraw-Hill. 1992b.
44. Thorneloe S, Roqueta A, Pacey J, Bottero C. Database of Landfill Gas to Energy
Projects in the United States. Sixth International Landfill Symposium at Sardinia,
Italy . 1999.
45. U.S. Department of Commerce. 1998. Part 258 - Criteria for Municipal Solid Waste
Landfills [Web Page]. Located at: http://www.epa.gov/epaoswer/non-
hw/muncpl/landfill/techman/. Accessed 1999 Dec.
46. Weber-Shirk M. Methane Production from Municipal Solid Waste [Web Page].
Located at: http://ceeserver.cee.cornell.edu/mw24/cee453/Lab_Manual/pdf/
methane.pdf. Accessed 2001 Nov.
47. Wells J. 1999 Nov 14. Weights and Measures [Web Page]. Located at:
http://www.brocktonmass.com/weights/tables.html.
48. Yazdani R, Moore R, Dahl K, Augenstein D. Toward a Twenty-first Century Landfill
[Web Page]. Located at: http://www.yolocounty.org/org/PPW/diwm/bioreactor.htm.
Accessed 2000 Mar.