Biomolecular Imaging with Coherent Nonlinear Vibrational ...
23
PC64CH05-Potma ARI 28 November 2012 15:51 R E V I E W S I N A D V A N C E Biomolecular Imaging with Coherent Nonlinear Vibrational Microscopy Chao-Yu Chung, John Boik, and Eric O. Potma Department of Chemistry, University of California, Irvine, California 92697; email: [email protected] Annu. Rev. Phys. Chem. 2013. 64:77–99 The Annual Review of Physical Chemistry is online at physchem.annualreviews.org This article’s doi: 10.1146/annurev-physchem-040412-110103 Copyright c 2013 by Annual Reviews. All rights reserved Keywords vibrational spectroscopy, nonlinear optical microscopy, sum-frequency generation, coherent Raman scattering, biomedical imaging Abstract Optical imaging with spectroscopic vibrational contrast is a label-free solu- tion for visualizing, identifying, and quantifying a wide range of biomolecu- lar compounds in biological materials. Both linear and nonlinear vibrational microscopy techniques derive their imaging contrast from infrared active or Raman allowed molecular transitions, which provide a rich palette for in- terrogating chemical and structural details of the sample. Yet nonlinear op- tical methods, which include both second-order sum-frequency generation (SFG) and third-order coherent Raman scattering (CRS) techniques, offer several improved imaging capabilities over their linear precursors. Nonlinear vibrational microscopy features unprecedented vibrational imaging speeds, provides strategies for higher spatial resolution, and gives access to additional molecular parameters. These advances have turned vibrational microscopy into a premier tool for chemically dissecting live cells and tissues. This review discusses the molecular contrast of SFG and CRS microscopy and highlights several of the advanced imaging capabilities that have impacted biological and biomedical research. 77 Review in Advance first posted online on December 5, 2012. (Changes may still occur before final publication online and in print.) Changes may still occur before final publication online and in print Annu. Rev. Phys. Chem. 2013.64. Downloaded from www.annualreviews.org by University of California - Irvine on 04/02/13. For personal use only.
Transcript of Biomolecular Imaging with Coherent Nonlinear Vibrational ...

PC64CH05-Potma ARI 28 November 2012 15:51
RE V I E W
S
IN
AD V A
NC
E
Biomolecular Imaging withCoherent NonlinearVibrational MicroscopyChao-Yu Chung, John Boik, and Eric O. PotmaDepartment of Chemistry, University of California, Irvine, California 92697;email: [email protected]
Annu. Rev. Phys. Chem. 2013. 64:77–99
The Annual Review of Physical Chemistry is online atphyschem.annualreviews.org
This article’s doi:10.1146/annurev-physchem-040412-110103
Copyright c© 2013 by Annual Reviews.All rights reserved
Keywords
vibrational spectroscopy, nonlinear optical microscopy, sum-frequencygeneration, coherent Raman scattering, biomedical imaging
Abstract
Optical imaging with spectroscopic vibrational contrast is a label-free solu-tion for visualizing, identifying, and quantifying a wide range of biomolecu-lar compounds in biological materials. Both linear and nonlinear vibrationalmicroscopy techniques derive their imaging contrast from infrared active orRaman allowed molecular transitions, which provide a rich palette for in-terrogating chemical and structural details of the sample. Yet nonlinear op-tical methods, which include both second-order sum-frequency generation(SFG) and third-order coherent Raman scattering (CRS) techniques, offerseveral improved imaging capabilities over their linear precursors. Nonlinearvibrational microscopy features unprecedented vibrational imaging speeds,provides strategies for higher spatial resolution, and gives access to additionalmolecular parameters. These advances have turned vibrational microscopyinto a premier tool for chemically dissecting live cells and tissues. This reviewdiscusses the molecular contrast of SFG and CRS microscopy and highlightsseveral of the advanced imaging capabilities that have impacted biologicaland biomedical research.
77
Review in Advance first posted online on December 5, 2012. (Changes may still occur before final publication online and in print.)
Changes may still occur before final publication online and in print
Ann
u. R
ev. P
hys.
Che
m. 2
013.
64. D
ownl
oade
d fr
om w
ww
.ann
ualr
evie
ws.
org
by U
nive
rsity
of
Cal
ifor
nia
- Ir
vine
on
04/0
2/13
. For
per
sona
l use
onl
y.

PC64CH05-Potma ARI 28 November 2012 15:51
SFG: sum-frequencygeneration
CRS: coherentRaman scattering
1. INTRODUCTION
The challenge in biomolecular optical imaging is to efficiently probe endogenous compounds,while maintaining sample integrity and ensuring that other off-target molecules remain opticallyunresponsive. Vibrational excitation of molecules is a natural choice to achieve such chemicallyselective contrast, as it allows nondestructive and label-free imaging of biological samples.
The energies of molecular vibrations, which include the vibrations of chemical bonds andchemical groups, are found in the ∼100 cm−1 to 4,000 cm−1 range. These energies correspondto the mid-infrared (mid-IR) to far-IR range of the electromagnetic spectrum. Microscopy basedon IR absorption contrast has grown into a mature technique for interrogating biological samples(1–6). Nonetheless, IR absorption microscopy necessitates special sample preparations to suppressthe contribution of water absorption, which can dominate the response in biological tissues. Inaddition, the spatial resolution, dictated by the wavelength of light, is of the order of a fewmicrometers or more and thus is insufficient to resolve intracellular details. For these reasons, IRabsorption microscopy has played a limited role in the study of live biological specimens.
Raman-type excitations constitute another approach to probe the vibrational properties ofmolecules. The Raman excitation is an indirect, off-resonance excitation of a molecular mode.Compared to direct IR excitation, the Raman process can be induced with visible or near-IRradiation. This flexibility offers an important practical advantage over IR absorption microscopy,as the refractive-based optics of standard light microscopes can be used for Raman microscopy(7–10). The optimized optics in the visible/near-IR range provide the submicrometer spatialresolution needed to visualize subcellular compartments. In addition, the Raman spectrum is lessaffected by a ubiquitous water background, which permits, for instance, imaging of aqueous cellculture specimens with good spectral contrast.
Raman microscopy has enabled label-free and selective imaging of cellular compartments, in-cluding the nucleus, endoplasmic reticulum, Golgi apparatus, and mitochondria (11–13). Suchimaging capabilities fill an important void in biological imaging; previously, this degree of or-ganelle selectivity was only possible with the use of fluorescent labels. And yet Raman microscopyhas its weaknesses. In particular, the image-acquisition speed is not conducive for live-cell appli-cations. The intrinsically low photon yield of the spontaneous Raman process gives rise to longsignal integration times, well over 1 ms per spatial pixel, which is incompatible with fast imagingapplications.
Some of the shortcomings encountered in conventional vibrational microscopy can be over-come with nonlinear vibrational techniques. In nonlinear vibrational microscopy, the detectedoptical signal scales nonlinearly with the power of the incident light. Nonlinear vibrational mi-croscopy methods include vibrationally resonant sum-frequency generation (SFG) imaging andcoherent Raman scattering (CRS) imaging techniques. Similar to their linear predecessors, theseoptical techniques are sensitive to molecular vibrational modes and generate label-free images withchemical contrast. Although nonlinear optical methods can be more complex in terms of instru-mentation, they deliver several improved imaging properties relative to their linear counterparts.
First, nonlinear vibrational imaging methods enjoy high signal levels that permit pixel dwelltimes of 1 μs or less. These fast imaging conditions make it possible to record images at ratessuitable for examining dynamic processes in cells and tissues. Second, nonlinear optical techniquesprovide ways to improve the spatial resolution. SFG imaging addresses vibrational modes withIR light, yet it provides a much higher spatial resolution than what can be obtained with linearIR microscopy. CRS imaging also offers opportunities to visualize structures with an improvedspatial resolution relative to linear Raman microscopy. Third, nonlinear light-matter interactionsprovide access to an expanded set of parameters, including higher-order molecular symmetries
78 Chung · Boik · Potma
Changes may still occur before final publication online and in print
Ann
u. R
ev. P
hys.
Che
m. 2
013.
64. D
ownl
oade
d fr
om w
ww
.ann
ualr
evie
ws.
org
by U
nive
rsity
of
Cal
ifor
nia
- Ir
vine
on
04/0
2/13
. For
per
sona
l use
onl
y.

PC64CH05-Potma ARI 28 November 2012 15:51
and vibrational phase information, which cannot be probed with conventional vibrational imagingmethods.
In this review, we highlight several of these new imaging properties of coherent nonlinear vibra-tional microscopy techniques. We discuss both second-order and third-order vibrational imagingapproaches and point out the advantages of these techniques over their existing linear counter-parts. We place special emphasis on new molecular parameters and structural properties of thesample that can be retrieved when using nonlinear vibrational methods and how these propertiesmay impact biological research. For more information on other important differences betweenlinear and nonlinear vibrational microscopy techniques, such as the role of spatial coherence incoherent nonlinear imaging, the reader is referred elsewhere (14–16). Similarly, for an in-depthoverview of current biomedical applications of CRS microscopy, we refer to existing reviews inthe literature (17–19).
2. VIBRATIONAL CONTRAST
2.1. Vibrational Modes in Biomolecules
The contrast in nonlinear vibrational microscopy arises from molecular vibrations. These vibra-tions are commonly modeled as normal modes, which correspond to the vibrational motion of achemical moiety that can include multiple chemical bonds. Depending on the symmetry proper-ties of the mode, the molecular vibration can be IR active or Raman active, display both IR andRaman activity, or can be nonactive with respect to its ability to couple to the electric compo-nent of the light field. IR-active modes are vibrations that bring about a change in the electricdipole moment μ of the molecule, whereas Raman-active modes are vibrations that give rise to anonzero change in the molecular polarizability α. These well-established selection rules highlightthat IR- and Raman-based spectroscopies complement each other. For instance, modes that aretotally symmetric along their normal coordinate are typically not IR active, but they do displayRaman activity. Nonetheless, unless the molecule exhibits perfect inversion symmetry (the modeis centrosymmetric), optically active normal modes often have nonvanishing contributions to bothIR and Raman spectra.
In addition to fundamental modes, the vibrational spectrum contains band structures that can beassigned to overtones, combination bands, and Fermi resonances. In the harmonic approximation,the first overtone and transitions into combination bands are not allowed. The appearance ofthese features in the spectrum thus indicates the presence of anharmonicity in the system, whichis commonly understood as the anharmonicity of the potential energy surface. Fermi resonancesare also a result of anharmonicity and arise when an overtone or combination band mixes with afundamental mode at near-degenerate energies.
The vibrational spectrum of biological samples is dominated by fundamental modes of organicbiomolecular compounds. This implies that the number of chemical moieties that contribute tothe spectrum is limited. Because many bioorganic molecules comprise a finite set of chemicalmoieties, the corresponding vibrational signatures in the IR/Raman spectra of many biomolecularcompounds show a significant amount of overlap. Vibrational spectroscopy is thus not suitablefor a complete chemical analysis of biological materials such as cells and tissues because thelimited amount of spectral features is by far insufficient to identify all molecular species and theircorresponding concentrations within the probing volume.
Despite the difficulty of performing a detailed chemical analysis on vibrational spectra, a sur-prising amount of information can be gleaned from vibrational microspectroscopic measurementsin biological samples. First, microspectroscopic measurements confine the probing volume to
www.annualreviews.org • Coherent Nonlinear Vibrational Microscopy 79
Changes may still occur before final publication online and in print
Ann
u. R
ev. P
hys.
Che
m. 2
013.
64. D
ownl
oade
d fr
om w
ww
.ann
ualr
evie
ws.
org
by U
nive
rsity
of
Cal
ifor
nia
- Ir
vine
on
04/0
2/13
. For
per
sona
l use
onl
y.

PC64CH05-Potma ARI 28 November 2012 15:51
a b c d
e f g h
Figure 1Comparison of immunofluorescence images (a–d ) with Raman-based images (e–h). Fluorescence stains foractin (a; red ), Golgi apparatus (b; green), and nucleus (c; blue) were used. The different compartments in thecell can also be distinguished by sets of Raman intensities at selected wave numbers determined by aninformation-based spectral decomposition approach (13): actin (e; red ), Golgi apparatus ( f; green), andnucleus ( g; blue). Panels d and h show the overlapped fluorescence and Raman-based images, respectively.Figure reproduced with permission from Reference 13.
(sub)micrometer dimensions. The spatial resolution is often sufficient to spatially discriminatebiologically distinct structures such as intracellular organelles. Consequently, biological sam-ples show significant variation in chemical composition on these length scales, which is reflectedin changes in the vibrational spectrum when spatially scanning across the sample. The relativechanges in the vibrational spectrum are highly informative and can reveal important differencesin the composition and concentration of key biomolecular compounds. Figure 1 shows an ex-ample in which information from the Raman spectrum alone is sufficient to discriminate variousorganelles in cultured mammalian cells.
Second, although band structures can significantly overlap, a detailed reading of the vibrationalspectrum can reveal essential information about the composition and physical state of endoge-nous biomolecular compounds. This type of information can be retrieved even in regions of thespectrum that are particularly dense, such as the range spanned by the stretching modes of CH-containing moieties. In the following subsection, we briefly discuss the CH stretching region andhighlight how nonlinear vibrational methods can help improve the analysis of band profiles.
2.2. The CH Stretching Vibrations
The CH stretching vibrations play a prominent role in coherent nonlinear vibrational microscopy.Their prominence is related to the sheer quantity of C-H bonds per unit volume in biologicalsamples, which, combined with their moderately strong cross sections for both IR- and Raman-type transitions, produce strong vibrational band structures in the 2,700 cm−1 to 3,100 cm−1 range.The CH stretching range is largely devoid of contributions from other chemical moieties, whichsomewhat simplifies the assignment of band structures in this region of the vibrational spectrum:They all arise from CH stretching modes. However, an accurate assignment is complicated by thefact that there is a multitude of CH stretching modes.
The primary contributing chemical moieties are the methyl (CH3), methylene (CH2), andmethine (CH) groups of sp3 hybridized carbon. Both the methyl and methylene groups exhibitsymmetric and asymmetric stretching modes that have nonvanishing IR and Raman cross sections.
80 Chung · Boik · Potma
Changes may still occur before final publication online and in print
Ann
u. R
ev. P
hys.
Che
m. 2
013.
64. D
ownl
oade
d fr
om w
ww
.ann
ualr
evie
ws.
org
by U
nive
rsity
of
Cal
ifor
nia
- Ir
vine
on
04/0
2/13
. For
per
sona
l use
onl
y.

PC64CH05-Potma ARI 28 November 2012 15:51
The methyl modes contribute notably to the vibrational spectra of proteins, given that the methyl-containing amino acids (alanine, valine, leucine, isoleucine, methionine, and threonine) constitutealmost 40% of the total amino acid content on average in proteins with more than 200 residues(20). The methylene stretching modes are dominant in the vibrational spectra of aliphatic lipids,but they also contribute substantially to the spectra of carbohydrates and proteins. Methine modescontribute only moderately to the spectra of most biomolecules (21–23), but they are thought tobe prominent in carbohydrate spectra (24).
In addition to the normal modes associated with sp3 hybridized carbons, the CH stretch-ing vibrations of chemical groups with an sp2 hybridized carbon introduce distinct features tothe vibrational spectrum as well. The most significant contributors in this category are the CHstretching vibrations of the vinyl ( = CH-) groups, which are prominent in aromatic compoundsand (poly-)unsaturated fatty acids.
The contributions of the CH-containing chemical groups produce vibrational bands that over-lap significantly, which complicates a detailed assignment of the band structures of most biomolec-ular compounds. Mode assignments in larger molecules are complicated by the sensitivity of CHvibrations to their immediate chemical environment and by the multitude of structural conformers,which can give rise to shifting of the fundamental frequencies and broadening of the band profiles.For instance, in biomolecules that contain both methyl and methylene groups, it is challenging toidentify the vibrational energies of the asymmetric CH2 modes, which can show substantial overlapwith the symmetric and asymmetric CH3 modes. Furthermore, Fermi resonances between the firstovertone of CH bending modes and the fundamental stretching modes of the methyl and methy-lene groups can shift peak positions and add spectral density to otherwise weak overtone bands (25).
Most of the spectral band assignments in the CH stretching range of IR and Raman spectraoriginate from normal-mode analysis methods and calculations based on a valence force fieldderived from empirical data (25–29). It has been difficult to rigorously verify these assignments withmore advanced computational methods. Ab initio calculations within the harmonic approximationprovide useful information about the fundamental modes (30–34), but they are unable to predictthe contribution of Fermi resonances and other band structures induced by anharmonicities.Vibrational self-consistent field methods with anharmonic potentials have enabled a qualitativereproduction of the CH stretching range of aliphatic molecules (35, 36), but they have so far beeninsufficient to confirm clear trends in the vibrational energies of fundamental modes, nor havethey pointed out the exact influence of degeneracies.
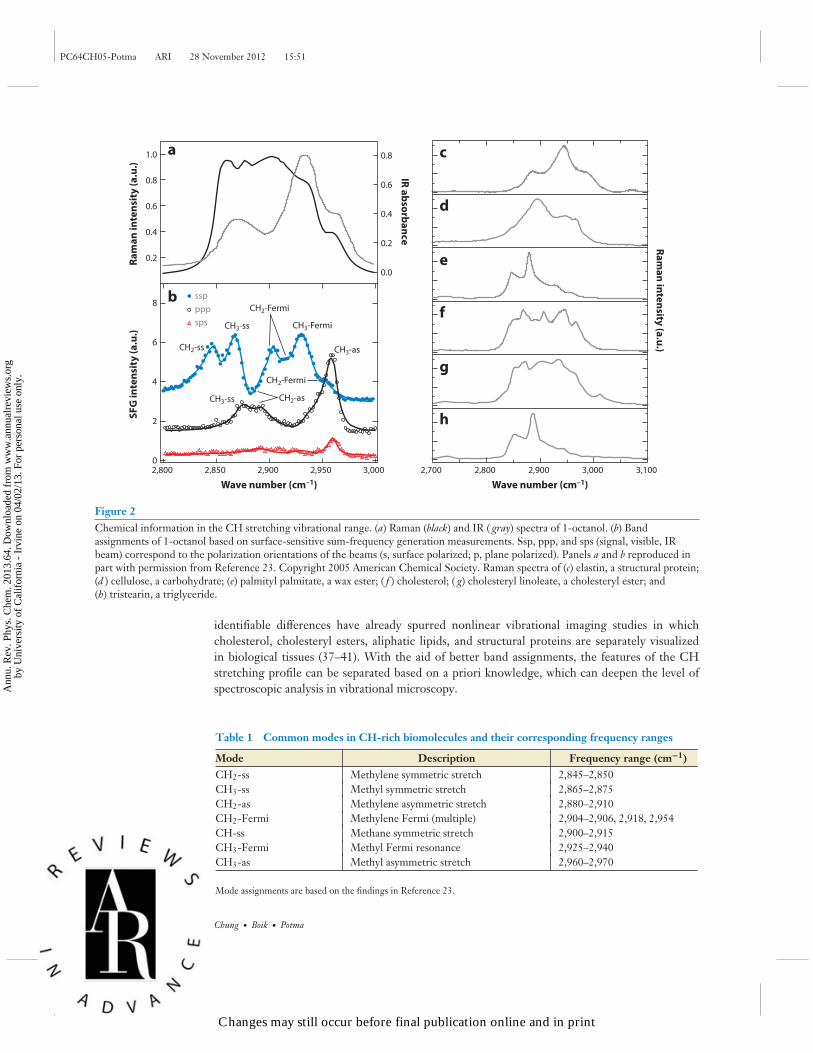
In this regard, additional information about the symmetries of the CH band structures is helpfulin deciphering their chemical origin. Compared to linear IR and Raman spectroscopy, SFG spec-troscopy is sensitive to oriented molecules at surfaces. This property alleviates uncertainty aboutorientation and offers a detailed look at the polarization properties of the CH stretching bands,providing a means to unlock band profiles based on mode symmetries. Figure 2a shows the IR andRaman spectra of 1-octanol, an aliphatic compound rich in methylene groups. The band structurein both IR and Raman spectra is congested, revealing limited substructure. The use of polarization-sensitive SFG spectroscopy (23) can provide more information, as illustrated in Figure 2b. Indi-vidual normal-mode contributions are now resolved, allowing a more accurate assignment of thefundamental frequencies as well as the identification of Fermi resonances. Table 1 summarizes thevibrational frequencies of the most dominant modes in the CH stretching range. Note, however,that the frequency ranges of the different modes may vary among molecular classes.
These additional insights can help improve the analytical capabilities of vibrational micro-scopies. Figure 2c–h depicts the vibrational spectra of several CH-rich biomolecular compounds.Despite the congested character of the CH stretching range, clear substructures can be identifiedthat enable an analytical discrimination of important molecular classes. These subtle yet
www.annualreviews.org • Coherent Nonlinear Vibrational Microscopy 81
Changes may still occur before final publication online and in print
Ann
u. R
ev. P
hys.
Che
m. 2
013.
64. D
ownl
oade
d fr
om w
ww
.ann
ualr
evie
ws.
org
by U
nive
rsity
of
Cal
ifor
nia
- Ir
vine
on
04/0
2/13
. For
per
sona
l use
onl
y.
PC64CH05-Potma ARI 28 November 2012 15:51
0.2
0.4
0.6
0.8
1.0
0.0
0.2
0.4
0.6
0.8
IR absorbance
SFG
inte
nsit
y (a
.u.)
Ram
an in
tens
ity
(a.u
.)
Raman intensity (a.u.)
2
0
4
6
8
2,800 2,850 2,900 2,950 3,000
Wave number (cm–1) Wave number (cm–1)2,700 2,800 2,900 3,000 3,100
a c
b
d
e
f
g
h
ssppppsps
CH3-ss
CH3-as
CH2-as
CH2-ss
CH3-ss
CH2-Fermi
CH2-Fermi
CH3-Fermi
Figure 2Chemical information in the CH stretching vibrational range. (a) Raman (black) and IR ( gray) spectra of 1-octanol. (b) Bandassignments of 1-octanol based on surface-sensitive sum-frequency generation measurements. Ssp, ppp, and sps (signal, visible, IRbeam) correspond to the polarization orientations of the beams (s, surface polarized; p, plane polarized). Panels a and b reproduced inpart with permission from Reference 23. Copyright 2005 American Chemical Society. Raman spectra of (c) elastin, a structural protein;(d ) cellulose, a carbohydrate; (e) palmityl palmitate, a wax ester; ( f ) cholesterol; ( g) cholesteryl linoleate, a cholesteryl ester; and(h) tristearin, a triglyceride.
identifiable differences have already spurred nonlinear vibrational imaging studies in whichcholesterol, cholesteryl esters, aliphatic lipids, and structural proteins are separately visualizedin biological tissues (37–41). With the aid of better band assignments, the features of the CHstretching profile can be separated based on a priori knowledge, which can deepen the level ofspectroscopic analysis in vibrational microscopy.
Table 1 Common modes in CH-rich biomolecules and their corresponding frequency ranges
Mode Description Frequency range (cm−1)CH2-ss Methylene symmetric stretch 2,845–2,850CH3-ss Methyl symmetric stretch 2,865–2,875CH2-as Methylene asymmetric stretch 2,880–2,910CH2-Fermi Methylene Fermi (multiple) 2,904–2,906, 2,918, 2,954CH-ss Methane symmetric stretch 2,900–2,915CH3-Fermi Methyl Fermi resonance 2,925–2,940CH3-as Methyl asymmetric stretch 2,960–2,970
Mode assignments are based on the findings in Reference 23.
82 Chung · Boik · Potma
Changes may still occur before final publication online and in print
Ann
u. R
ev. P
hys.
Che
m. 2
013.
64. D
ownl
oade
d fr
om w
ww
.ann
ualr
evie
ws.
org
by U
nive
rsity
of
Cal
ifor
nia
- Ir
vine
on
04/0
2/13
. For
per
sona
l use
onl
y.

PC64CH05-Potma ARI 28 November 2012 15:51
a b|n⟩
|b⟩
|a⟩
|n' ⟩
|n⟩
|b⟩
|a⟩
ω1
ω1
ω2
ω2
ω3 ω3 ω4
χ (2) (–ω3; ω1, ω2) χ(3) (–ω4; ω1, –ω2, ω3)
Figure 3Energy diagrams of (a) sum-frequency generation and (b) coherent anti-Stokes Raman scattering. In thesediagrams, |a〉 is the ground state, |b〉 is the first vibrationally excited state, and |n〉 ,
∣∣n′⟩ are higher-energystates in the material. The arrows are not necessarily ordered in time. The arrows to the far right correspondto the signal field: An upward arrow corresponds to field absorption, whereas a downward arrow denotes afield emission.
2.3. Nonlinear Susceptibilities
Vibrationally resonant SFG is sensitive to the second-order nonlinear susceptibility χ (2), and CRSmethods probe the third-order nonlinear susceptibility χ (3) of the sample. In SFG, the incidentfields ω1 and ω2 induce a nonlinear polarization in the sample, which subsequently radiates at afrequency ω3 = ω1 +ω2. In CRS, the incident fields ω1, ω2, and ω3 set up a nonlinear polarizationthat can radiate at frequencies ω4 = ±(ω1 − ω2) + ω3. The energy-level diagrams of selectedSFG and CRS processes are shown in Figure 3, in which the vibrational transition is betweenthe ground state a and the first vibrationally excited state b, with n and n′ (electronic) levels withenergies much higher than the vibrational energies. In this case, the second- and third-ordernonlinear susceptibilities can be summarized as
χ(2)i j k(−ω3; ω1, ω2) = S
∑ab,n
μiabμ
jbnμ
kna f (2)
ab .n(−ω3; ω1, ω2), (1)
χ(3)i j kl (−ω4; ω1, ω2, ω3) = S
∑ab,nn′
μianμ
jnbμ
kbn′μ
ln′a f (3)
ab,nn′ (−ω4; ω1, ω2, ω3), (2)
with i the polarization orientations of the emitted radiation, and j, k, and l the polarization orienta-tion of the incident fields, respectively (42). The operator S sums over all permutations of the fields(42), and the frequency-dependent functions f (n) capture the spectral properties of the n-th-ordernonlinear susceptibility. The negative sign in front of the signal frequency means that the signalis emitted, whereas a positive sign would indicate that the signal is absorbed. The magnitude ofthe transition dipole moment along the i coordinate between the levels n and a is indicated byμi
an. The product of two transition dipole moments (e.g., μjbnμ
kna ) can be written as the coefficient
αj kba,n, which has symmetry properties similar to that of the Raman polarizability tensor. The triple
product of transition dipole moments in the expression for the second-order nonlinear suscepti-bility that describes the SFG process can thus be understood as a product of a dipole-allowed IRtransition (∼μ) and a Raman-type transition (∼α). Consequently, the vibrational modes observedin SFG microscopy must have both IR and Raman activity. Similarly, the CRS process, which isdescribed by a quadruple product of transition dipole moments, can be interpreted as the prod-uct of two Raman-type transitions. The vibrational modes observed in CRS imaging are indeedRaman-active modes.
www.annualreviews.org • Coherent Nonlinear Vibrational Microscopy 83
Changes may still occur before final publication online and in print
Ann
u. R
ev. P
hys.
Che
m. 2
013.
64. D
ownl
oade
d fr
om w
ww
.ann
ualr
evie
ws.
org
by U
nive
rsity
of
Cal
ifor
nia
- Ir
vine
on
04/0
2/13
. For
per
sona
l use
onl
y.
PC64CH05-Potma ARI 28 November 2012 15:51
A quick comparison between χ (2) and χ (3) suggests that the second-order response mustbe significantly stronger than the third-order response. This can be expected because a directelectric dipole excitation is generally much stronger than a Raman-type excitation, even underoff-resonant conditions. Indeed, the nonresonant χ (2) of quartz is of the order of 10−9 electrostaticunits, whereas the nonresonant χ (3) is of the order of 10−14 electrostatic units (43). However,other factors such as phase matching, sample density, sample geometry, and the efficiency ofsignal collection also affect the magnitude of the measured response. In practice, in microscopicapplications of SFG and CRS, the collected vibrationally resonant signals derived from χ (2) andχ (3) are comparable in magnitude, thus enabling simultaneous second-order and third-ordervibrational investigations of microstructured samples (44).
2.3.1. Polarization properties. Compared to linear vibrational techniques, nonlinear techniquesuse multiple excitation fields. By using different polarization orientations of the incident fields,the sample can be examined in a more advanced fashion, which can give access to additionalmolecular symmetry parameters. In isotropic media, however, it is difficult to retrieve such newinformation. The situation is different when the sample is anisotropic or highly ordered on amicroscopic scale. Examples of ordered structures in biological samples include lipid membranesand ordered structures therein, protein fibrillar structures, and biomolecular microcrystallitessuch as cholesterol crystals. In these cases, nonlinear vibrational microscopy offers opportunitiesto unveil molecular symmetries that go beyond what can be retrieved with linear techniques.
The observed macroscopic nonlinear susceptibility is defined in the laboratory frame (x, y, z),which is related to the coordinates (a, b, c) of the molecular frame through a transformation. Thenonlinear susceptibilities can be written as
χ(2)i ′ j ′k′ = N
∑i j k
⟨Ri ′i R j ′ j Rk′k
⟩χ
(2)i j k (−ω3; ω1, ω2), (3)
χ(3)i ′ j ′k′l ′ = N
∑i j k
⟨Ri ′i R j ′ j Rk′k Rl ′l
⟩χ
(3)i j kl (−ω4; ω1, ω2, ω3), (4)
where N is the number density of the molecules and Rλ′λ are elements of the Euler transformationmatrices that relate the microscopic coordinate λ(a, b, c ) to the macroscopic coordinate λ′(x, y, z)(45). The brackets in these expressions indicate the average over the orientations of the molecules.When the orientation of the molecules and the orientation angles of the contributing chemicalgroups are known, information about the molecular symmetries contained in χ
(2)i j k and χ
(3)i j kl can be
obtained. Vice versa, if the molecular symmetries are known, information about the shape andorientation of the molecules can be acquired (46).
An example of the use of polarization-sensitive second-order vibrational techniques to studystructural information about biomolecular compounds is the study of type I collagen fibrils.Assuming that the triple-helix structure of type I collagen can be described as a rod withcylindrical symmetry, seven nonvanishing and independent elements of χ
(2)i j k can be identified if
the fibril is aligned along one of the laboratory axes (47, 48). Three of these elements describechiral contributions, and the other four represent achiral contributions to the SFG spectrum (49,50). These contributions can be independently measured by controlling the input polarizationsof the excitation fields. SFG measurements on aligned type I collagen have revealed that asymmetric methylene mode constitutes a major component of the achiral optical response,whereas carbonyl amide I vibrational modes are identified as chiral contributions in the SFGspectrum (50). Although these measurements have been performed only on macroscopic samples,
84 Chung · Boik · Potma
Changes may still occur before final publication online and in print
Ann
u. R
ev. P
hys.
Che
m. 2
013.
64. D
ownl
oade
d fr
om w
ww
.ann
ualr
evie
ws.
org
by U
nive
rsity
of
Cal
ifor
nia
- Ir
vine
on
04/0
2/13
. For
per
sona
l use
onl
y.
PC64CH05-Potma ARI 28 November 2012 15:51
CARS: coherentanti-Stokes Ramanscattering
similar experiments can be conducted in an optical microscope, providing access to detailedstructural chemical information on a microscopic scale (44, 51).
In addition to the capability of SFG to probe molecular chirality, it has recently been pointed outthat polarization-sensitive CRS measurements also provide access to information about molecularchirality in uniaxially oriented materials (52). Furthermore, the higher-order nonlinearity of theCRS process makes it possible to probe higher-order molecular symmetries. Recent polarization-dependent coherent anti-Stokes Raman scattering (CARS) microscopy studies have shown thatfourth-order symmetries of the nonlinear susceptibility near vibrational resonances can be ob-served in microcrystallites of cubic symmetry (46, 53). This method can be extended to otherordered materials as well, providing molecular symmetry information that is inaccessible withspontaneous Raman scattering techniques.
2.3.2. Frequency dependence. In Equations 1 and 2, the frequency dependence of thesecond-order and third-order susceptibilities is described by the functions f (2)
ab,n(−ω3; ω1, ω2) andf (3)ab,nn′ (−ω4; ω1, ω2, ω3), respectively. For the SFG and CRS processes, only the terms that contain
a vibrational resonance give rise to the desired chemical contrast. These terms have the followingform:
f (2)ab,n(−ω3; ω1, ω2) ∝ Aab,n(ω3)
ωab − ω2 − i�ab, (5)
f (3)ab,nn′ (−ω4; ω1, ω2, ω3) ∝ Aab,nn′ (ω1, ω4)
ωab − (ω1 − ω2) − i�ab. (6)
Here ωab is the vibrational frequency corresponding to the transition from the ground state a to thevibrational state b, and �ab is a parameter related to the dephasing rate of the vibrational excitation.The label b corresponds to both IR and Raman accessible states. The complex amplitude functionsAab,n(ω3) and Aab,nn′ (ω1, ω4) can contain additional (one-photon) electronic resonances. When thefrequency parameters are close to an electronic resonance, the amplitudes can grow significantly,boosting the overall magnitude of vibrationally resonant nonlinear susceptibility. Electronic reso-nance enhanced CARS (54, 55) and doubly resonant SFG (56–58) operate under these conditions.Far from electronic resonances, the amplitude functions are generally much smaller and real.
The vibrational resonance is described by the denominator in Equations 5 and 6. In SFG,the resonance occurs when the frequency of the IR field, ω2, matches the molecular vibrationaltransition frequency ωab . In CRS, vibrational resonance is achieved when the difference frequencyω1 − ω2 is tuned to ωab . Vibrational sensitivity in CRS techniques thus arises as a consequence ofa two-photon resonance. In addition to the vibrationally resonant terms, both the second-orderand third-order susceptibilities include terms that lack vibrational resonances. These terms can bewritten as f (2)
NR and f (3)NR for the second- and third-order susceptibilities, respectively, and are gen-
erally not negligible. They can give rise to a significant background in vibrational measurements.These terms are generally complex and can contain one- and two-photon electronic resonances.Far away from electronic resonances, however, these contributions can be considered purely real.
The functional form of the vibrational resonance in Equations 5 and 6 is complex; it containsreal and imaginary parts. Far from electronic resonances, the nonlinear susceptibilities χ (n) canbe written as
χ (n) = Reχ (n) + iImχ (n) =[χ
(n)NR + Reχ (n)
R
]+ iImχ
(n)R , (7)
where χ(n)R is the vibrationally resonant contribution to the n-th-order nonlinear susceptibility,
and χ(n)NR is the nonresonant contribution. The imaginary part of the response corresponds to
the dissipation of energy; it accounts for the exchange of energy of the light fields with the
www.annualreviews.org • Coherent Nonlinear Vibrational Microscopy 85
Changes may still occur before final publication online and in print
Ann
u. R
ev. P
hys.
Che
m. 2
013.
64. D
ownl
oade
d fr
om w
ww
.ann
ualr
evie
ws.
org
by U
nive
rsity
of
Cal
ifor
nia
- Ir
vine
on
04/0
2/13
. For
per
sona
l use
onl
y.

PC64CH05-Potma ARI 28 November 2012 15:51
SRS: stimulatedRaman scattering
material. During a vibrational excitation, energy initially contained in the light fields is absorbedby the molecule, leaving the molecule in a higher energy state. Both IR absorption spectroscopyand spontaneous Raman scattering spectroscopy are sensitive to the absorption of a vibrationalquantum, which implies that they probe the imaginary part of the material susceptibility.
The real part of the susceptibility, which accounts for the refractive properties of the material,is not directly probed in linear vibrational techniques. Although the real and imaginary parts of thesusceptibility are related to one another through a Kramers-Kronig transformation, it is impossiblein linear spectroscopy to retrieve the real part of the response in an isolated and narrow frequencyrange without knowing the vibrational spectrum at large. In nonlinear vibrational microscopy,alternatively, it is possible to fully characterize the real and imaginary parts of the nonlinearsusceptibility with the aid of interferometric detection at single frequencies.
Detecting the real and imaginary parts of the nonlinear susceptibility as separate entities isattractive for vibrational imaging applications. It is clear from Equation 7 that, whereas the realpart contains both nonresonant and vibrationally resonant terms, Imχ (n) is sensitive solely to vi-brational resonances. Hence vibrational microscopy based on the amplitude of Imχ (n) providesimages in which the contrast is directly derived from molecular vibrations without electronic back-ground contributions. This can be achieved with phase-sensitive SFG [Imχ (2)] and phase-sensitiveCARS [Imχ (3)] by tuning a reference field, commonly called the local oscillator, in phase with theimaginary part of the response (59–62). In stimulated Raman scattering (SRS) methods, the localoscillator is provided by the incident light fields, which have a fixed phase with respect to the mate-rial response (63–66). These techniques illustrate that coherent detection allows a direct inspectionof the energy flow between the light fields and the material, which is the source of chemical con-trast. This concept was recently generalized for CRS microscopy by demonstrating that the energyloss in the combined light fields corresponds to a vibrational energy gain in the material (67, 68).
However, it is the ability to detect both the real and imaginary parts of the material suscep-tibility that really sets nonlinear vibrational methods apart from their linear counterparts. Whenboth Reχ (n) and Imχ (n) are known, the amplitude and phase of the vibrational transition can bedetermined (69). Figure 4a,b shows the CARS amplitude and phase of two different polymers,polyethylene and poly(methyl)-methacrylate. The difference in chemical structure between thetwo polymers is reflected in both the amplitude and phase spectra, which implies that both the am-plitude dimension and the phase dimension can be used to distinguish the two chemical species.This information can also be presented in the complex plane, as shown in Figure 4e, whichplots the amplitudes of both Reχ (3) and Imχ (3) for each pixel in an image. Different areas canbe recognized in the complex plane, corresponding to chemical groups whose vibrations have aspecific vibrational amplitude and phase. Consequently, different molecules can be discriminatedbased on their position in the complex plane. Note that this information was obtained at a single(narrowband) Raman frequency, which is a detection strategy compatible with very fast image-acquisition times. Hence phase-sensitive methods, such as interferometric CARS and opticallyheterodyne-detected Raman-induced Kerr effect (70) microscopy, permit the simultaneous de-tection and separation of multiple chemical species at image-acquisition rates that are orders ofmagnitude higher than what can be attained with linear vibrational microscopies.
3. SECOND-ORDER VIBRATIONAL MICROSCOPY
3.1. Sum-Frequency Generation Microscopy
Vibrationally resonant SFG has long been recognized as a spectroscopic technique for probingmolecules at interfaces. Because the SFG response is dictated by χ (2), the sample needs to exhibit
86 Chung · Boik · Potma
Changes may still occur before final publication online and in print
Ann
u. R
ev. P
hys.
Che
m. 2
013.
64. D
ownl
oade
d fr
om w
ww
.ann
ualr
evie
ws.
org
by U
nive
rsity
of
Cal
ifor
nia
- Ir
vine
on
04/0
2/13
. For
per
sona
l use
onl
y.

PC64CH05-Potma ARI 28 November 2012 15:51
PE Mix PMMA Water
Complex plane
-Im
Re
0.2
0.6
1.0
2,600 2,800 3,000 3,200–3.0
–2.5
–2.0
–1.5
–1.0
–0.5
Phas
e (r
ad)
Wave number (cm–1)
CARS
am
plit
ude
(a.u
.)
a
b
Am
plitude (a.u.)V
ibrational phase (rad)
c
d
e 1
0.8
0.6
0.4
0.2
0
–1
–2
–3
Points/pixeldensity (log)
0 –2 –4 –6
2
Figure 4Vibrational phase microscopy with interferometrically detected coherent anti-Stokes Raman scattering (CARS). (a) CARS amplitude ofpoly(methyl)-methacrylate (red ) and polyethylene (blue). (b) Corresponding vibrational phase of the two polymers. (c) CARS amplitudeimage and (d ) corresponding phase image of a sample containing a sheet of polyethylene (PE), poly(methyl)-methacrylate (PMMA)beads, and water. The images were acquired at 2,940 cm−1, corresponding to the dashed line in panels a and b. (e) Density graph of theprojected amplitude and phase points in the complex plane. Images are plotted below for several locations in the complex plane,showing chemically distinct contrast that enables the separation of the several components. Figure reproduced in part with permissionfrom Reference 69. Copyright 2010 American Chemical Society. Courtesy of Herman Offerhaus, Twente University.
noncentrosymmetry. This condition is fulfilled at planar interfaces, which enables the generationof SFG radiation, induced by molecules at the surface, in a phase-matched direction (71–74). Forexample, SFG spectroscopy has unveiled important information about the molecular structure anddynamics of phospholipid membranes (75–78) and water surfaces (79). In addition to nonvanishingSFG signals at planar surfaces, it has been demonstrated that second-order nonlinear optical signalscan be generated from a suspension of microscopic vesicles (80, 81). This observation has triggeredseveral spectroscopic studies of vesicles whose membranes have curvatures that are relevant forbiological function (82).
The SFG surface sensitivity, which is unique and has no equivalent in linear vibrational spec-troscopy, has also been exploited in SFG microscopy. Most implementations of surface-sensitiveSFG microscopy are based on a wide-field excitation geometry. In these experiments, an area ofseveral hundred squared micrometers of the sample is illuminated with amplified laser beams, andthe SFG radiation is captured by a high-numerical-aperture lens to form an image on a camera (83).The wide-field illumination approach is sensitive enough to visualize self-assembled monolayerswith chemical selectivity in the CH stretching range (84–88). An example is shown in Figure 5.The spatial resolution in wide-field SFG can be as high as 2 μm (89–91), which is much higherthan what can be obtained in linear IR microscopy. The higher resolution is a direct consequenceof the nonlinear upconversion of an initial IR excitation to a signal in the visible range of thespectrum.
Besides mapping the spatial heterogeneity in interfacial molecular layers, the SFG microscopeis sensitive to biological structures with intrinsic noncentrosymmetry on the microscopic scale.Biofibers such as cellulose, collagen, and microtubules share this property and are thus suitabletargets for SFG imaging. In addition, crystallized structures of chiral biomolecules maintain amacroscopic noncentrosymmetry (92, 93) and can thus produce detectable SFG signals in thenonlinear microscope. Some examples are discussed below.
www.annualreviews.org • Coherent Nonlinear Vibrational Microscopy 87
Changes may still occur before final publication online and in print
Ann
u. R
ev. P
hys.
Che
m. 2
013.
64. D
ownl
oade
d fr
om w
ww
.ann
ualr
evie
ws.
org
by U
nive
rsity
of
Cal
ifor
nia
- Ir
vine
on
04/0
2/13
. For
per
sona
l use
onl
y.

PC64CH05-Potma ARI 28 November 2012 15:51
2,875 cm–1
3,065 cm–1
a
b
c
2,700 2,800 2,900 3,000 3,100 3,200
SFG
inte
nsit
y (a
.u.)
Wave number (cm–1)
d
60 µm
Figure 5Surface-sensitive sum-frequency generation (SFG) imaging of a patterned monolayer of hexadecane-dithiocarboxylic acid and16-phenyl-hexadecanethiol. (a) Image taken at 2,875 cm−1 showing strong contrast from the methyl group of hexadecane-dithiocarboxylic acid. (b) Image taken at 3,065 cm−1 showing strong contrast from the aromatic CH stretching mode. Note that thecontrast in panels a and b is inverted. (c) Close-up of the highlighted area in panel a. (d ) SFG spectra of the selected blue and green areasin panel c. Spectra are offset for clarity. Based on results presented in Reference 88. Courtesy of Steven Baldelli, University of Houston.
Relaxed phase-matching conditions in a microscope can be used when measuring biologicalstructures with nonzero χ (2) elements. Using collinearly aligned IR and visible excitation beams,while maintaining a wide-field detection strategy, investigators have achieved a lateral resolutionas high as 1.1 μm for SFG imaging in the CH stretching range (94, 95). High axial resolutionwas furthermore accomplished by illuminating the sample in a wide-field fashion with the IRbeam and focusing the visible excitation beam with a high-numerical-aperture lens (96). In thisconfiguration, the visible SFG radiation can be detected through a pinhole with a point detector,and the image is formed by raster scanning the sample with a translation stage. Alternatively,reflective objective lenses can be utilized, which permit collinear focusing of both the visible andIR beams to a joint focal spot. Adopting the latter implementation, researchers demonstratedSFG imaging with a lateral resolution of 0.6 μm (44). Hence the nonlinearity of SFG producesa dual-color excitation volume that is much smaller than what can be achieved with focused IRlight alone.
Most SFG microscopes to date have used amplified laser systems, whose low repetition ratesare not optimized for fast imaging applications. A picosecond synchronously pumped opticalparametric oscillator, which produces high-repetition-rate radiation in the 2,800 to 3,100 cm−1
range, is an attractive option for rapid narrowband SFG imaging (44). Importantly, vibrationallyresonant, single-frequency SFG signals are comparable in magnitude to the signal strength ofconventional nonlinear optical imaging modalities based on second-harmonic generation (SHG)
88 Chung · Boik · Potma
Changes may still occur before final publication online and in print
Ann
u. R
ev. P
hys.
Che
m. 2
013.
64. D
ownl
oade
d fr
om w
ww
.ann
ualr
evie
ws.
org
by U
nive
rsity
of
Cal
ifor
nia
- Ir
vine
on
04/0
2/13
. For
per
sona
l use
onl
y.
PC64CH05-Potma ARI 28 November 2012 15:51
SHG:second-harmonicgeneration
a b c
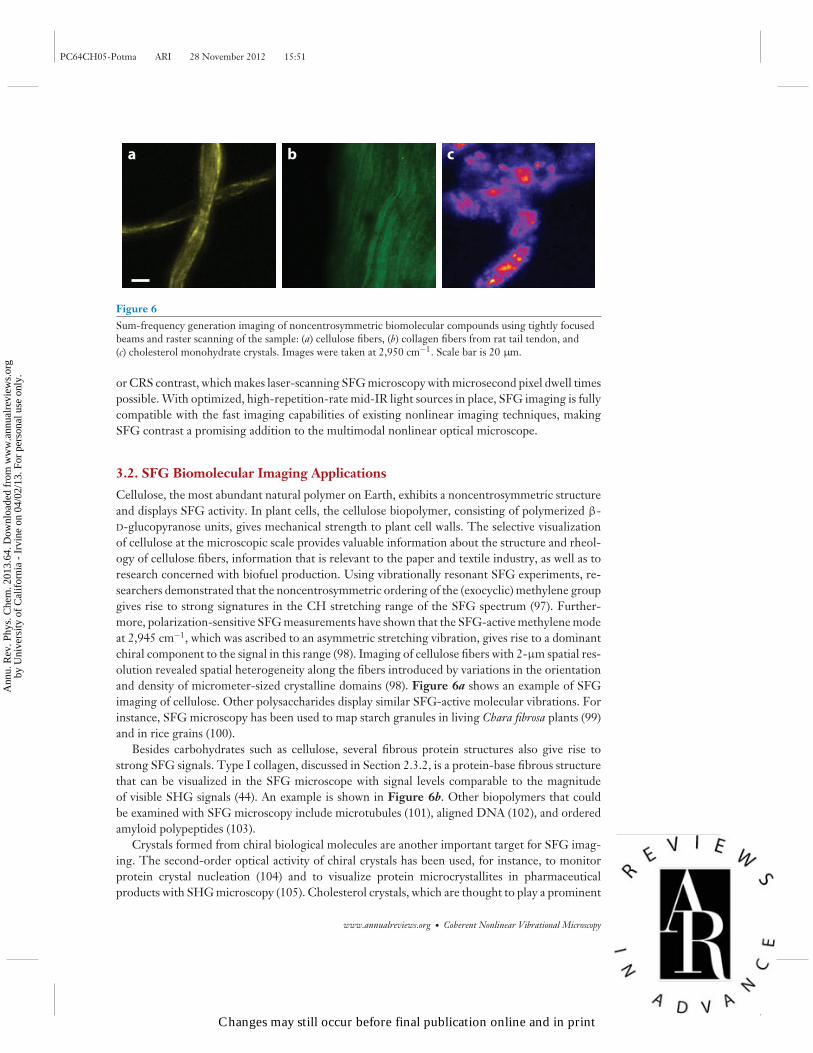
Figure 6Sum-frequency generation imaging of noncentrosymmetric biomolecular compounds using tightly focusedbeams and raster scanning of the sample: (a) cellulose fibers, (b) collagen fibers from rat tail tendon, and(c) cholesterol monohydrate crystals. Images were taken at 2,950 cm−1. Scale bar is 20 μm.
or CRS contrast, which makes laser-scanning SFG microscopy with microsecond pixel dwell timespossible. With optimized, high-repetition-rate mid-IR light sources in place, SFG imaging is fullycompatible with the fast imaging capabilities of existing nonlinear imaging techniques, makingSFG contrast a promising addition to the multimodal nonlinear optical microscope.
3.2. SFG Biomolecular Imaging Applications
Cellulose, the most abundant natural polymer on Earth, exhibits a noncentrosymmetric structureand displays SFG activity. In plant cells, the cellulose biopolymer, consisting of polymerized β-D-glucopyranose units, gives mechanical strength to plant cell walls. The selective visualizationof cellulose at the microscopic scale provides valuable information about the structure and rheol-ogy of cellulose fibers, information that is relevant to the paper and textile industry, as well as toresearch concerned with biofuel production. Using vibrationally resonant SFG experiments, re-searchers demonstrated that the noncentrosymmetric ordering of the (exocyclic) methylene groupgives rise to strong signatures in the CH stretching range of the SFG spectrum (97). Further-more, polarization-sensitive SFG measurements have shown that the SFG-active methylene modeat 2,945 cm−1, which was ascribed to an asymmetric stretching vibration, gives rise to a dominantchiral component to the signal in this range (98). Imaging of cellulose fibers with 2-μm spatial res-olution revealed spatial heterogeneity along the fibers introduced by variations in the orientationand density of micrometer-sized crystalline domains (98). Figure 6a shows an example of SFGimaging of cellulose. Other polysaccharides display similar SFG-active molecular vibrations. Forinstance, SFG microscopy has been used to map starch granules in living Chara fibrosa plants (99)and in rice grains (100).
Besides carbohydrates such as cellulose, several fibrous protein structures also give rise tostrong SFG signals. Type I collagen, discussed in Section 2.3.2, is a protein-base fibrous structurethat can be visualized in the SFG microscope with signal levels comparable to the magnitudeof visible SHG signals (44). An example is shown in Figure 6b. Other biopolymers that couldbe examined with SFG microscopy include microtubules (101), aligned DNA (102), and orderedamyloid polypeptides (103).
Crystals formed from chiral biological molecules are another important target for SFG imag-ing. The second-order optical activity of chiral crystals has been used, for instance, to monitorprotein crystal nucleation (104) and to visualize protein microcrystallites in pharmaceuticalproducts with SHG microscopy (105). Cholesterol crystals, which are thought to play a prominent
www.annualreviews.org • Coherent Nonlinear Vibrational Microscopy 89
Changes may still occur before final publication online and in print
Ann
u. R
ev. P
hys.
Che
m. 2
013.
64. D
ownl
oade
d fr
om w
ww
.ann
ualr
evie
ws.
org
by U
nive
rsity
of
Cal
ifor
nia
- Ir
vine
on
04/0
2/13
. For
per
sona
l use
onl
y.

PC64CH05-Potma ARI 28 November 2012 15:51
role in atherosclerotic disease progression, are noncentrosymmetric and can be probed by SHG(41) and SFG microscopy. Figure 6c shows a vibrationally resonant SFG image of cholesterolmicrocrystals. SFG microspectroscopy has also been used to discriminate several saccharidemicrocrystallites, including D-glucose, amylopectin, and β-cyclodextrin (106), illustrating theusefulness of chemically selective SFG imaging.
Finally, recent SFG microscopy studies on cultured cells have shown that SFG signals with aspectral dependence in the CH stretching vibrational range can be observed (95). Although theorigin of these signals remains to be determined, it is clear that SFG microscopy may provideuseful information about intracellular constituents that can complement the contrast seen in CRSimages of cells.
4. THIRD-ORDER VIBRATIONAL MICROSCOPY
4.1. Coherent Raman Scattering Techniques
The imaging capabilities of CRS imaging techniques have improved dramatically over the past15 years. Technological developments have pushed the imaging speed of CRS methods to videorate (107, 108), firmly inserting CRS microscopy as a viable imaging tool for biomedical researchand diagnostics. CRS enables the generation of real-time images with vibrational contrast in liveanimals (107, 109, 110) and human subjects (108, 111, 112), a capability that remains out of reachfor linear vibrational imaging methods.
Fast imaging applications of CRS commonly use two excitation beams, ω1 and ω2, called pumpand Stokes (ω1 > ω2), respectively. In this configuration, four main types of CRS signals can becollected: coherent Stokes Raman scattering (CSRS) at ωc s = 2ω1 −ω2, stimulated Raman gain atω2, stimulated Raman loss at ω1, and CARS at ωas = 2ω1 − ω2. All these CRS signals result fromthe same Raman transition and are generated simultaneously. They can be detected separatelywith spectral filters and/or modulation techniques (65).
Experimentally, fast CRS imaging applications make use of a collinear excitation geometry inwhich both excitation beams are focused to a common focal volume. Images are generated byrapidly raster scanning the focus across the image and collecting the signal through spectral filtersonto large-aperture detectors. SRS techniques use additional demodulators to filter the nonlinearRaman signals from the laser background. The CRS microscope has matured into a user-friendlyinstrument, and easy-to-use commercial solutions have become available.
All CRS techniques enjoy signal levels that can be many orders of magnitude higher thanin spontaneous Raman scattering, which is a direct consequence of the coherence among theoscillators in focus. The strong signals permit short pixel dwell times of less than 1 μs, enablingreal-time imaging at video rates (107, 108). Yet the fastest implementations of CRS imaging arenarrowband techniques in which the intensity of one particular Raman band is used as the contrastin the image. This single-frequency approach produces little spectral information. Hence, whereasCRS microscopy is superior to Raman microscopy in terms of imaging speed, spontaneous Ramanspectroscopy tops most CRS methods in terms of spectral information. To visualize and identifymultiple biomolecular compounds in live samples, it is essential to combine the fast imagingspeed of CRS microscopy with spectroscopic information from a broader range of the vibrationalspectrum.
Current developments focus on improving the spectral content of the CRS signal while main-taining the advantage of fast imaging. Broadband CARS and SRS methods, which make use ofspectrally broad pulses and CCD (charge-coupled-device)-based spectrometers, are continuingto improve, pushing spectral acquisition times to several milliseconds or less. These spectral
90 Chung · Boik · Potma
Changes may still occur before final publication online and in print
Ann
u. R
ev. P
hys.
Che
m. 2
013.
64. D
ownl
oade
d fr
om w
ww
.ann
ualr
evie
ws.
org
by U
nive
rsity
of
Cal
ifor
nia
- Ir
vine
on
04/0
2/13
. For
per
sona
l use
onl
y.

PC64CH05-Potma ARI 28 November 2012 15:51
acquisition times are currently one order of magnitude less compared to those of spontaneousRaman microscopy (38, 113). Other broadband techniques make use of tuning mechanisms basedon spectral focusing (114, 115) or employ pulses with a spectral amplitude and phase optimizedto efficiently drive a particular Raman chromophore (116), which allows fast detection with alarge-aperture detector. The latter method enables selective imaging of particular biomolecularcompounds in mixtures with effective pixel dwell times of ∼0.1 ms. Alternatively, a narrowbandpulse or portions of a broadband pulse can be spectrally swept to achieve spectral bandwidth.In this approach, image frames are collected for a series of single frequencies, which are thencombined in a stack for further spectral analysis (41, 117). Effective spectral acquisition times ofthe order of 1 ms have been reported (118), and further developments are likely to reduce theacquisition time even more.
In addition to the improved image-acquisition times, CRS methods introduce new nonlinearmechanisms to sharpen the resolution of the vibrational microscope. Using beam-shaping tech-niques, nonlinear excitation volumes can be formed with smaller focal spots than what can be ob-tained with (linear) single-beam techniques. Focal spot sizes as small as 0.13μm have been reported,improving the resolution by twofold relative to standard CSR imaging conditions (119). Other ad-vanced nonlinear optical schemes promise CRS imaging with an even higher resolution (120, 121).
4.2. Fast Biomolecular Imaging Applications
The fast imaging capabilities of CRS imaging make it possible to follow dynamic processes in livecells without using labels. Most studies reported to date have focused on cellular processes relatedto intracellular lipid bodies, which are often called lipid droplets (122). Because the droplets aremobile and biologically dynamic, the slower acquisition time of spontaneous Raman microscopyis typically insufficient to capture important processes associated with lipid droplets. The ability tofollow mobile droplets in living cells with CRS has provided useful information, for example, aboutlipid droplet trafficking mechanisms (123), lipid droplet growth and remodeling (124, 125), andvariation in adipogenesis as a function of insulin signaling pathways (126). The fast imaging capa-bility of CRS is also leveraged in studies that focus on water diffusion and water membrane perme-ability in single living cells, in which the OH stretching vibration is used as a marker for water (127,128). Beyond individual cells, CRS methods have proved useful for probing lipid dynamics in livemicroorganisms, including Caenorhabditis elegans (129) and Drosophila larva (130). Because microor-ganisms can move significantly in real time, fast imaging capabilities are crucial in these studies.
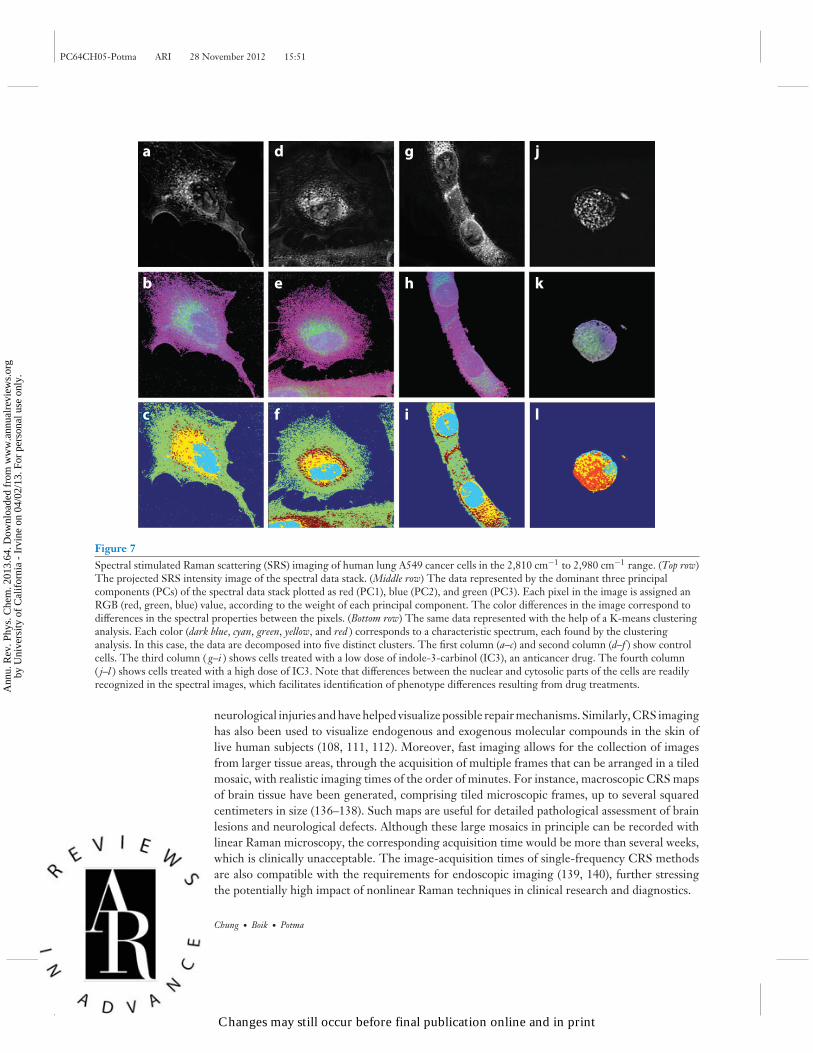
In most CRS microscopy studies of cells and microorganisms, the single-frequency approachhas been used to ensure sufficient imaging speed. Better chemical analytical capabilities are attainedwith broadband CARS techniques, which have shown that cellular compartments can be identifiedthrough vibrational signatures in a broad spectral range from 600 to 3,200 cm−1 and with acquisi-tion times of the order of several tens of milliseconds per pixel (113). Figure 7 shows spectral SRSimages of human lung cancer cells, collected in the CH stretching spectral range from 2,810 to2,980 cm−1 using wavelength sweeping. Although here the spectral range is moderate, the effectiveacquisition time is of the order of a few milliseconds, which is sufficiently fast to capture spectral im-ages within a time frame of several minutes. Spectral CRS imaging discriminates important spectralfeatures that can be associated with cellular compartments using multivariate analysis techniques.
Similar to the imaging of cells, visualization of live tissues requires fast imaging capabilitiesto intercept stills from a moving specimen. CRS imaging has proved tremendously successfulin meeting this need. For instance, single-frequency CRS techniques have been used to generatemaps of nervous tissue in live animals based on the strong nonlinear Raman signal of CH-rich lipidsin myelin-wrapped neurons (109, 131–135). These studies have revealed important details about
www.annualreviews.org • Coherent Nonlinear Vibrational Microscopy 91
Changes may still occur before final publication online and in print
Ann
u. R
ev. P
hys.
Che
m. 2
013.
64. D
ownl
oade
d fr
om w
ww
.ann
ualr
evie
ws.
org
by U
nive
rsity
of
Cal
ifor
nia
- Ir
vine
on
04/0
2/13
. For
per
sona
l use
onl
y.
PC64CH05-Potma ARI 28 November 2012 15:51
b
cc
e
f
h
i
k
l
a d g j
Figure 7Spectral stimulated Raman scattering (SRS) imaging of human lung A549 cancer cells in the 2,810 cm−1 to 2,980 cm−1 range. (Top row)The projected SRS intensity image of the spectral data stack. (Middle row) The data represented by the dominant three principalcomponents (PCs) of the spectral data stack plotted as red (PC1), blue (PC2), and green (PC3). Each pixel in the image is assigned anRGB (red, green, blue) value, according to the weight of each principal component. The color differences in the image correspond todifferences in the spectral properties between the pixels. (Bottom row) The same data represented with the help of a K-means clusteringanalysis. Each color (dark blue, cyan, green, yellow, and red ) corresponds to a characteristic spectrum, each found by the clusteringanalysis. In this case, the data are decomposed into five distinct clusters. The first column (a–c) and second column (d–f ) show controlcells. The third column ( g–i ) shows cells treated with a low dose of indole-3-carbinol (IC3), an anticancer drug. The fourth column( j–l ) shows cells treated with a high dose of IC3. Note that differences between the nuclear and cytosolic parts of the cells are readilyrecognized in the spectral images, which facilitates identification of phenotype differences resulting from drug treatments.
neurological injuries and have helped visualize possible repair mechanisms. Similarly, CRS imaginghas also been used to visualize endogenous and exogenous molecular compounds in the skin oflive human subjects (108, 111, 112). Moreover, fast imaging allows for the collection of imagesfrom larger tissue areas, through the acquisition of multiple frames that can be arranged in a tiledmosaic, with realistic imaging times of the order of minutes. For instance, macroscopic CRS mapsof brain tissue have been generated, comprising tiled microscopic frames, up to several squaredcentimeters in size (136–138). Such maps are useful for detailed pathological assessment of brainlesions and neurological defects. Although these large mosaics in principle can be recorded withlinear Raman microscopy, the corresponding acquisition time would be more than several weeks,which is clinically unacceptable. The image-acquisition times of single-frequency CRS methodsare also compatible with the requirements for endoscopic imaging (139, 140), further stressingthe potentially high impact of nonlinear Raman techniques in clinical research and diagnostics.
92 Chung · Boik · Potma
Changes may still occur before final publication online and in print
Ann
u. R
ev. P
hys.
Che
m. 2
013.
64. D
ownl
oade
d fr
om w
ww
.ann
ualr
evie
ws.
org
by U
nive
rsity
of
Cal
ifor
nia
- Ir
vine
on
04/0
2/13
. For
per
sona
l use
onl
y.
PC64CH05-Potma ARI 28 November 2012 15:51
5. CONCLUDING REMARKS
Although the source of contrast in linear and nonlinear vibrational microscopy techniques derivesfrom the same molecular modes, coherent nonlinear methods feature several improved imagingcapabilities that have elevated the impact of vibrational microscopy in the biological and biomedicalresearch fields. Higher spatial resolution, the opportunity to probe the vibrational phase, andthe ability to examine higher-order molecular symmetries are examples of new capabilities thatnonlinear vibrational techniques have added to the imaging properties of existing linear vibrationalmicroscopes. Above all, it is the much higher imaging speed of nonlinear vibrational microscopythat has opened up a new area of biomolecular imaging applications. Nonetheless, the improvedimaging speed is accompanied by a loss of spectral information. The challenge ahead is to bringtogether the excellent analytical capabilities of linear vibrational microscopy techniques with thesuperior image-acquisition times of single-frequency nonlinear methods. Recent developments inCRS microscopy indicate that this goal is within reach. The fruition of such capabilities wouldtransform nonlinear vibrational microscopy into a real-time chemical diagnostic tool, which islikely to have a significant impact in multiple areas of fundamental and applied research, includingclinical imaging, cell biological research, material science, and surface chemistry.
SUMMARY POINTS
1. Interferometric detection of the coherent SFG or CRS signal allows a full characteriza-tion of the amplitude and phase of the vibrational mode at any driving frequency. Knowl-edge of the vibrational phase translates into an enhanced differentiation of molecules ata single vibrational frequency.
2. Nonlinear microscopy methods offer opportunities to improve the imaging resolutionrelative to linear vibrational techniques. The spatial resolution in IR/visible SFG mi-croscopy is significantly better compared to the resolution in linear IR microscopy be-cause of the nonlinear upconversion to a signal in the visible range. Similarly, spatialshaping of the nonlinear CRS excitation volume has produced smaller focal spot sizescompared to the focal volumes in Raman microscopy.
3. Single-frequency SFG and CRS imaging techniques have much higher imaging speedsthan their linear counterparts. These fast image-acquisition times enable high-resolutionmapping of live and dynamic biological samples in real time, a capability currently im-possible with linear techniques.
4. The current technical challenge in coherent nonlinear vibrational microscopy is to mergeits fast imaging capabilities with spectroscopic information over a broad spectral band-width. Recent developments have provided glimpses of such nonlinear vibrational mi-croscopes with improved analytical imaging capabilities.
DISCLOSURE STATEMENT
The authors are not aware of any affiliations, memberships, funding, or financial holdings thatmight be perceived as affecting the objectivity of this review.
ACKNOWLEDGMENTS
We thank Roza Korai and Jeffrey Suhalim for their help in preparing the figures. We acknowl-edge support from the National Institutes of Health, grant P41-RR-01192 (Laser Microbeam
www.annualreviews.org • Coherent Nonlinear Vibrational Microscopy 93
Changes may still occur before final publication online and in print
Ann
u. R
ev. P
hys.
Che
m. 2
013.
64. D
ownl
oade
d fr
om w
ww
.ann
ualr
evie
ws.
org
by U
nive
rsity
of
Cal
ifor
nia
- Ir
vine
on
04/0
2/13
. For
per
sona
l use
onl
y.

PC64CH05-Potma ARI 28 November 2012 15:51
and Medical Program), and from the National Science Foundation, grant CHE-0807097. J.B.acknowledges financial support from the Life Extension Foundation.
LITERATURE CITED
1. Wetzel DL, Levine SM. 1999. Imaging molecular chemistry with infrared microscopy. Science 285:1224–25
2. Diem M, Boydston-White S, Chiriboga L. 1999. Infrared spectroscopy of cells and tissues: shining lightonto a novel subject. Appl. Spectrosc. 53:A148–61
3. Bhargava R, Levib IW. 2001. Fourier transform infrared imaging: theory and practice. Anal. Chem.73:5157–67
4. Levin IW, Bhargava R. 2005. Fourier transform infrared vibrational spectroscopic imaging: integratingmicroscopy and molecular recognition. Annu. Rev. Phys. Chem. 56:429–74
5. Fernandez DC, Bhargava R, Hewitt SM, Levin IW. 2005. Infrared spectroscopic imaging for histopatho-logic recognition. Nat. Biotechnol. 23:469–74
6. Lasch P, Boese M, Pacifico A, Diem M. 2002. FT-IR spectroscopic investigations of single cells on thesubcellular level. Vib. Spectrosc. 28:147–57
7. Delhaye M, Dhamelincourt P. 1975. Raman microprobe and microscope with laser excitation. J. RamanSpectrosc. 3:33–43
8. Delhaye M, Migeon M. 1966. Interet de la concentration d’un faisceau laser pour l’excitation de l’effetRaman. C. R. Acad. Sci. Paris 262:1513–16
9. Turrell G, Corset J, eds. 1996. Raman Microscopy: Developments and Applications. San Diego: Academic10. Matthaus C, Bird B, Miljkovic M, Chernenko T, Romeo M, Diem M. 2008. Infrared and Raman mi-
croscopy in cell biology. Methods Cell Biol. 89:275–30811. Uzunbajakava N, Lenferink A, Kraan Y, Volokhina E, Vrensen G, et al. 2003. Nonresonant confocal
Raman imaging of DNA and protein distribution in apoptotic cells. Biophys. J. 84:3968–8112. Matthaus C, Chernenko T, Newmark JA, Warner CM, Diem M. 2007. Label-free detection of mito-
chondrial distribution in cells by nonresonant Raman microspectroscopy. Biophys. J. 93:668–7313. Klein K, Gigler AM, Aschenbrenner T, Monetti R, Bunk W, et al. 2012. Label-free live-cell imaging
with confocal Raman microscopy. Biophys. J. 102:360–6814. Cheng J-X, Volkmer A, Xie XS. 2002. Theoretical and experimental characterization of coherent anti-
Stokes Raman scattering microscopy. J. Opt. Soc. Am. B 19:1363–7515. Potma EO, Krishnamachari VV. 2009. Imaging with phase-sensitive narrowband nonlinear microscopy.
In Biochemical Applications of Nonlinear Optical Spectroscopy, ed. VV Yakovlev, pp. 213–38. Boca Raton, FL:CRC
16. Popov KI, Pegoraro AF, Stolow A, Ramunno L. 2011. Image formation in CARS microscopy: effect ofthe Gouy phase shift. Opt. Express 19:5902–11
17. Evans CL, Xie XS. 2008. Coherent anti-Stokes Raman scattering microscopy: chemical imaging forbiology and medicine. Annu. Rev. Anal. Chem. 1:883–909
18. Le TT, Yue S, Cheng JX. 2010. Shedding new light on lipid biology with coherent anti-Stokes Ramanscattering microscopy. J. Lipid Res. 51:3091–102
19. Pezacki JP, Blake JA, Danielson DC, Kennedy DC, Lyn RK, Singaravelu R. 2011. Chemical contrastfor imaging living systems: Molecular vibrations drive CARS microscopy. Nat. Chem. Biol. 7:137–45
20. Carugo O. 2008. Amino acid composition and protein dimension. Protein Sci. 17:2187–9121. Pozefsky A, Coggeshall ND. 1951. Infrared absorption studies of carbon hydrogen stretching frequen-
cies. Anal. Chem. 23:1611–1922. Fox JJ, Martin AE. 1940. Investigations of infra-red spectra: determination of C-H frequencies
(∼3000 cm−1) in paraffins and olefins with some observations of polythenes. Proc. R. Soc. 175:208–3323. Lu R, Gan W, Wu BH, Zhang Z, Guo Y, Wang HF. 2005. C-H stretching vibrations of methyl,
methylene and methine groups at the vapor/alcohol (n = 1–8) interfaces. J. Phys. Chem. B 109:14118–2924. Wiley JH, Atalla RH. 1987. Band assignments in the Raman spectra of celluloses. Carbohydr. Res. 160:113–
29
94 Chung · Boik · Potma
Changes may still occur before final publication online and in print
Ann
u. R
ev. P
hys.
Che
m. 2
013.
64. D
ownl
oade
d fr
om w
ww
.ann
ualr
evie
ws.
org
by U
nive
rsity
of
Cal
ifor
nia
- Ir
vine
on
04/0
2/13
. For
per
sona
l use
onl
y.
PC64CH05-Potma ARI 28 November 2012 15:51
25. Snyder RG, Hsu SL, Krimm S. 1978. Vibrational spectra in the C-H stretching region and the structureof the polymethylene chain. Spectrochim. Acta 34A:395–406
26. Gaber BP, Peticolas WL. 1977. On the quantitative interpretation of biomembrane structure by Ramanspectroscopy. Biochim. Biophys. Acta 465:260–74
27. Kodati VR, El-Jastimi R, Lafleur M. 1994. Contribution of the intermolecular coupling and librotorsionalmobility in the methylene stretching modes in the infrared spectra of acyl chains. J. Phys. Chem. 98:12191–97
28. Snyder RG, Scherer JR, Gaber BP. 1980. Effects of chain packing and chain mobility on the Ramanspectra of biomembranes. Biochim. Biophys. Acta 601:47–53
29. Snyder RG, Strauss HL, Elliger CA. 1982. C-H stretching modes and structure of n-alkyl chains 1.Long, disordered chains. J. Phys. Chem. 86:5145–50
30. Miyazawa T, Shimanouchi T, Mizushima SI. 1958. Normal vibrations of N-methyl acetamide. J. Chem.Phys. 29:611–16
31. Gwinn WD. 1971. Normal coordinates: general theory, redundant coordinates and general analysisusing electronic computers. J. Chem. Phys. 55:477–81
32. Mirkin NG, Krimm S. 1991. Ab initio vibrational analysis of hydrogen-bonded trans- and cis-N-methylacetamide. J. Am. Chem. Soc. 113:9742–47
33. Csaszar AG. 1995. On the structures of free glycine and α-alanine. J. Mol. Struct. 346:141–5234. Csaszar AG. 1996. Conformers of gaseous α-alanine. J. Phys. Chem. 100:3541–5135. Sebek J, Pele L, Potma EO, Geber RB. 2011. Raman spectra of long chain hydrocarbons: anharmonic cal-
culations, experiment and implications for imaging of biomembranes. Phys. Chem. Chem. Phys. 13:12724–33
36. Pele L, Sebek J, Potma EO, Gerber RB. 2011. Raman and IR spectra of butane: anharmonic calculationsand interpretation of room temperature spectra. Chem. Phys. Lett. 515:7–12
37. Krafft C, Ramoji AA, Bielecki C, Vogler N, Meyer T, et al. 2009. A comparative Raman and CARSimaging study of colon tissue. J. Biophotonics 2:303–12
38. Pohling C, Buckup T, Motzkus M. 2011. Hyperspectral data processing for chemoselective multiplexcoherent anti-Stokes Raman scattering microscopy of unknown samples. J. Biomed. Opt. 16:021105
39. Chowdary PD, Benalcazar WA, Jiang Z, Marks DM, Boppart SA, Gruebele M. 2010. High speednonlinear interferometric vibrational analysis of lipids by spectral decomposition. Anal. Chem. 82:3812–18
40. Lim RS, Suhalim JL, Miyazaki-Anzai S, Miyazaki M, Levi M, et al. 2011. Identification of cholesterolcrystals in plaques of atherosclerotic mice using hyperspectral CARS imaging. J. Lipid Res. 52:2177–86
41. Suhalim JL, Chung CY, Lilledahl MB, Lim RS, Levi M, et al. 2012. Characterization of cholesterolcrystals in atherosclerotic plaques using stimulated Raman scattering and second-harmonic generationmicroscopy. Biophys. J. 102:1988–95
42. Butcher PN, Cotter D. 1990. The Elements of Nonlinear Optics. New York: Cambridge Univ. Press43. Chase LL, Stryland EWV. 1995. Inorganic materials. In CRC Handbook of Laser Science and Technology
Supplement 2: Optical Materials, ed. MJ Weber, pp. 269–88. Boca Raton, FL: CRC44. Raghunathan V, Han Y, Korth O, Ge NH, Potma EO. 2011. Rapid vibrational imaging with sum
frequency generation microscopy. Opt. Lett. 36:3891–9345. Wang HF, Gan W, Lu R, Rao Y, Wu BH. 2005. Quantitative spectral and orientational analysis in
surface sum frequency generation vibrational spectroscopy. Int. Rev. Phys. Chem. 24:191–25646. Brasselet S. 2011. Polarization-resolved nonlinear microscopy: application to structural and biological
imaging. Adv. Opt. Photonics 3:205–7147. Dick B. 1985. Irreducible tensor analysis of sum-frequency and difference-frequency generation in par-
tially oriented samples. Chem. Phys. 96:199–21548. Fisher P, Hache F. 2005. Nonlinear optical spectroscopy of chiral molecules. Chirality 17:421–3749. Haupert LM, Simpson GJ. 2009. Chirality in nonlinear optics. Annu. Rev. Phys. Chem. 60:345–6550. Rocha-Mendoza I, Yankelevich DR, Wang M, Reiser KM, Frank CW, Knoesen A. 2007. Sum frequency
vibrational spectroscopy: the molecular origins of the optical second-order nonlinearity of collagen.Biophys. J. 93:4433–44
www.annualreviews.org • Coherent Nonlinear Vibrational Microscopy 95
Changes may still occur before final publication online and in print
Ann
u. R
ev. P
hys.
Che
m. 2
013.
64. D
ownl
oade
d fr
om w
ww
.ann
ualr
evie
ws.
org
by U
nive
rsity
of
Cal
ifor
nia
- Ir
vine
on
04/0
2/13
. For
per
sona
l use
onl
y.
PC64CH05-Potma ARI 28 November 2012 15:51
51. Ji N, Zhang K, Yang H, Shen YR. 2006. Three-dimensional chiral imaging by sum-frequency generation.J. Am. Chem. Soc. 128:3482–83
52. Davis RP, Moad AJ, Goeken GS, Wampler RD, Simpson GJ. 2008. Selection rules and symmetryrelations for four-wave mixing measurements of uniaxial assemblies. J. Phys. Chem. B 112:5834–48
53. Munhoz F, Rigneault H, Brasselet S. 2010. High order symmetry structural properties of vibrationalresonances using multiple-field polarization coherent anti-Stokes Raman spectroscopy microscopy. Phys.Rev. Lett. 105:123903
54. Druet SAJ, Attal B, Gustafson TK, Taran JP. 1978. Electronic resonance enhancement of CARS. Phys.Rev. A 18:1529–57
55. Maeda S, Kamisuki T, Kataoka H, Adachi Y. 1985. Resonance CARS studies of electronic excitedmolecules. Appl. Spectrosc. Rev. 21:211–57
56. Humbert C, Dreesen L, Mani AA, Gaudano Y, Lemaire JJ, et al. 2002. IR-visible sum-frequency vi-brational spectroscopy of biphenyl-3 methylene thiol monolayer on gold and silver: effect of the visiblewavelength on the SFG spectrum. Surf. Sci. 502–503:203–7
57. Humbert C, Dreesen L, Nihonyanagi S, Masuda Y, Kondo T, et al. 2003. Probing a molecular electronictransition by two-colour sum-frequency generation spectroscopy. Appl. Surf. Sci. 212–213:797–803
58. Raschke MB, Hayashi M, Shen YR. 2002. Doubly-resonant sum-frequency generation spectroscopy forsurface studies. Chem. Phys. Lett. 359:367–73
59. Evans CL, Potma EO, Xie XS. 2004. Coherent anti-Stokes Raman scattering interferometry: determi-nation of the real and imaginary components of the nonlinear susceptibility for vibrational microscopy.Opt. Lett. 29:2930–32
60. Jurna M, Korterik JP, Otto C, Offerhaus HL. 2007. Shot noise limited heterodyne detection of CARSsignals. Opt. Express 15:15207–13
61. Marks DL, Boppart SA. 2004. Nonlinear interferometric vibrational imaging. Phys. Rev. Lett. 92:12390562. Potma EO, Evans CL, Xie XS. 2006. Heterodyne coherent anti-Stokes Raman scattering (CARS) imag-
ing. Opt. Lett. 31:241–4363. Freudiger CW, Min W, Saar BG, Lu S, Holtom GR, et al. 2008. Label-free biomedical imaging with
high sensitivity by stimulated Raman scattering microscopy. Science 322:1857–6164. Ploetz E, Laimgruber S, Berner S, Zinth W, Gilch P. 2007. Femtosecond stimulated Raman microscopy.
Appl. Phys. B 87:389–9365. Min W, Freudiger CW, Lu S, Xie XS. 2011. Coherent nonlinear optical microscopy: beyond fluorescence
microscopy. Annu. Rev. Phys. Chem. 62:507–3066. Nandakumar P, Kovalev A, Volkmer A. 2009. Vibrational imaging based on stimulated Raman scattering.
New J. Phys. 11:03302667. Rahav S, Mukamel S. 2010. Stimulated coherent anti-Stokes Raman spectroscopy (CARS) resonances
originate from double-slit interference of two Stokes pathways. Proc. Natl. Acad. Sci. USA 107:4825–2968. Garbacik ET, Korterik JP, Otto C, Mukamel S, Herek JL, Offerhaus HL. 2011. Background-free non-
linear microspectroscopy with vibrational molecular interferometry. Phys. Rev. Lett. 107:25390269. Jurna M, Garbacik ET, Korterik JP, Herek JL, Otto C, Offerhaus HL. 2010. Visualizing resonances in
the complex plane with vibrational phase contrast coherent anti-Stokes Raman scattering. Anal. Chem.82:7656–59
70. Freudiger CW, Roeffaers MBJ, Zhang X, Saar BG, Min W, Xie XS. 2011. Optical heterodyne-detectedRaman-induced Kerr effect (OHD-RIKE) microscopy. J. Phys. Chem. B 115:5574–81
71. Shen YR. 1989. Surface properties probed by second-harmonic and sum-frequency generation. Nature337:519–25
72. Shen YR. 1994. Surfaces probed by nonlinear optics. Surf. Sci. 299:551–6273. Eisenthal KB. 1996. Liquid interfaces probed by second-harmonic and sum-frequency spectroscopy.
Chem. Rev. 96:1343–6074. Eisenthal KB. 1992. Equilibrium and dynamic processes at interfaces by second harmonic and sum
frequency generation. Annu. Rev. Phys. Chem. 43:627–6175. Walker RA, Conboy JC, Richmond GL. 1997. Molecular structure and ordering of phospholipids at a
liquid-liquid interface. Langmuir 13:3070–73
96 Chung · Boik · Potma
Changes may still occur before final publication online and in print
Ann
u. R
ev. P
hys.
Che
m. 2
013.
64. D
ownl
oade
d fr
om w
ww
.ann
ualr
evie
ws.
org
by U
nive
rsity
of
Cal
ifor
nia
- Ir
vine
on
04/0
2/13
. For
per
sona
l use
onl
y.

PC64CH05-Potma ARI 28 November 2012 15:51
76. Liu J, Conboy JC. 2004. Direct measurement of the transbilayer movement of phospholipids by sum-frequency vibrational spectroscopy. J. Am. Chem. Soc. 126:8376–77
77. Chen X, Tang H, Even MA, Wang J, Tew GN, Chen Z. 2006. Observing a molecular knife at work. J.Am. Chem. Soc. 128:2711–14
78. Roke S. 2011. Nonlinear spectroscopy of bio-interfaces. Int. J. Mater. Res. 102:906–1279. Richmond GL. 2002. Molecular bonding and interactions at aqueous surfaces as probed by vibrational
sum frequency spectroscopy. Chem. Rev. 102:2693–72480. Eisenthal KB. 2006. Second harmonic spectroscopy of aqueous nano- and microparticle interfaces. Chem.
Rev. 106:1462–7781. Roke S, Gonella G. 2012. Nonlinear light scattering and spectroscopy of particles and droplets in liquids.
Annu. Rev. Phys. Chem. 63:353–7882. Roke S, Roeterdink W, Wijnhoven J, Petukhov A, Kleyn A, Bonn M. 2003. Vibrational sum frequency
scattering from a submicron suspension. Phys. Rev. Lett. 91:25830283. Cimatu KA, Baldelli S. 2009. Chemical microscopy of surfaces by sum frequency generation imaging. J.
Phys. Chem. C 113:16575–8884. Florsheimer M, Brillert C, Fuchs H. 1999. Chemical imaging of interfaces by sum frequency microscopy.
Langmuir 15:5437–3985. Kuhnke K, Hoffmann DMP, Wu XC, Bittner AM, Kern K. 2003. Chemical imaging of interfaces by
sum-frequency generation microscopy: application to patterned self-assembled monolayers. Appl. Phys.Lett. 83:3830–32
86. Cimatu K, Baldelli S. 2006. Sum frequency generation microscopy of microcontact-printed mixed self-assembled monolayers. J. Phys. Chem. B 110:1807–13
87. Cimatu K, Baldelli S. 2007. Spatially resolved surface analysis of an octadecanethiol self-assembledmonolayer on mild steel using sum frequency generation imaging microscopy. J. Phys. Chem. C 111:7137–43
88. Cimatu K, Moore HJ, Barriet D, Chinwangso P, Lee TR, Baldelli S. 2008. Sum frequency generationimaging microscopy of patterned self-assembled monolayers with terminal -CH3, -OCH3, -CF2CF3,-C = C, -phenyl, and -cyclopropyl groups. J. Phys. Chem. C 112:14529–37
89. Hoffmann DMP, Kuhnke K, Kern K. 2002. Sum-frequency generation microscope for opaque andreflecting samples. Rev. Sci. Instrum. 73:3221–26
90. Hernandez M, Chinwangso P, Cimatu K, Srisombat L, Lee TR, Baldelli S. 2011. Chemical imagingand distribution analysis of mono-, bi-, and tridentate alkanethiol self-assembled monolayers on gold bysum frequency generation imaging microscopy. J. Phys. Chem. C 115:4688–95
91. Nakai IF, Tachioka M, Ugawa A, Watanabe K, Matsumoto Y. 2009. Molecular structure and carrierdistributions at semiconductor/dielectric interfaces in organic field-effect transistors studied with sumfrequency generation microscopy. Appl. Phys. Lett. 95:243304
92. Wampler RD, Kissick DJ, Dehen CJ, Gualtieri EJ, Grey JL, et al. 2008. Selective detection of proteincrystals by second harmonic generation. J. Am. Chem. Soc. 130:14076–77
93. Kissick DJ, Wanapun D, Simpson GJ. 2011. Second-order nonlinear optical imaging of chiral crystals.Annu. Rev. Anal. Chem. 4:419–37
94. Inoue K, Fujii M, Sakai M. 2010. Development of a non-scanning vibrational sum-frequency generationdetected infrared super-resolution microscope and its application to biological cells. Appl. Spectrosc.64:275–81
95. Kogure S, Inoue K, Ohmori T, Ishihara M, Kikuchi M, et al. 2010. Infrared imaging of an A549cultured cell by a vibrational sum-frequency generation detected infrared super-resolution microscopy.Opt. Express 18:13402–6
96. Locharoenrat K, Sano H, Mizutani G. 2009. Demonstration of confocal sum frequency microscopy.Phys. Stat. Solidi C 6:304–6
97. Barnette AL, Bradley LC, Veres BD, Schreiner EP, Park YB, et al. 2011. Selective detection of crystallinecellulose in plant cell walls with sum-frequency-generation (SFG) vibration spectroscopy. Biomacro-molecules 12:2434–39
98. Hieu HC, Tuan NA, Li H, Miyauchi Y, Mizutani G. 2011. Sum frequency generation microscopy studyof cellulose fibers. Appl. Spectrosc. 65:1254–59
www.annualreviews.org • Coherent Nonlinear Vibrational Microscopy 97
Changes may still occur before final publication online and in print
Ann
u. R
ev. P
hys.
Che
m. 2
013.
64. D
ownl
oade
d fr
om w
ww
.ann
ualr
evie
ws.
org
by U
nive
rsity
of
Cal
ifor
nia
- Ir
vine
on
04/0
2/13
. For
per
sona
l use
onl
y.

PC64CH05-Potma ARI 28 November 2012 15:51
99. Miyauchi Y, Sano H, Mirzutani G. 2006. Selective observation of starch in a water plant using opticalsum-frequency microscopy. J. Opt. Soc. Am. A 23:1687–90
100. Li H, Miyauchi Y, Tuan NA, Mizutani G, Koyano M. 2012. Optical sum frequency generation imageof rice grains. J. Biomat. Nanobiotechnol. 3:286–91
101. Campagnola PJ, Millard AC, Terasaki M, Hoppe PE, Malone CJ, Mohler WA. 2002. Three-dimensionalhigh-resolution second-harmonic generation imaging of endogenous structural proteins in biologicaltissue. Biophys. J. 81:493–508
102. Walter SR, Geiger FM. 2010. DNA on stage: showcasing oligonucleotides at surfaces and interfaceswith second harmonic and vibrational sum frequency generation. J. Phys. Chem. Lett. 1:9–15
103. Fu L, Ma G, Yan ECY. 2010. In situ misfolding of human islet amyloid polypeptide at interfaces probedby vibrational sum frequency generation. J. Am. Chem. Soc. 132:5405–12
104. Wanapun D, Kestur US, Kissick DJ, Simpson GJ, Taylor LS. 2010. Selective detection and quantitationof organic molecule crystallization by second harmonic generation microscopy. Anal. Chem. 82:5425–32
105. Toth SJ, Madden JT, Taylor LS, Marsac P, Simpson GJ. 2012. Selective imaging of active pharmaceuticalingredients in powdered blends with common excipients utilizing two-photon excited ultraviolet fluores-cence and ultraviolet-second order nonlinear optical imaging of chiral crystals. Anal. Chem. 84:5869–75
106. Mizutani G, Koyama T, Tomizawa S, Sano H. 2005. Distinction between some saccharides in scatteredoptical sum frequency intensity images. Spectrochim. Acta A 62:845–49
107. Evans CL, Potma EO, Puoris’haag M, Cote D, Lin C, Xie XS. 2005. Chemical imaging of tissue in vivowith video-rate coherent anti-Stokes Raman scattering (CARS) microscopy. Proc. Natl. Acad. Sci. USA102:16807–12
108. Saar BG, Freudiger CW, Reichman J, Michael SC, Holtom GR, Xie XS. 2010. Video-rate molecularimaging in vivo with stimulated Raman scattering. Science 330:1368–70
109. Henry F, Cote D, Randolph MA, Rust EAZ, Redmond RW, et al. 2009. Real-time in vivo assessmentof the nerve microenvironment with coherent anti-Stokes Raman scattering microscopy. Plastic Reconstr.Surg. 123:S123–30
110. Huff TB, Shi Y, Yan Y, Wang H, Cheng JX. 2008. Multimodal nonlinear optical microscopy andapplications to central nervous system. IEEE J. Sel. Top. Quantum Electron. 14:4–9
111. Konig K, Breunig HG, Buckle R, Kellner-Hofer M, Weinigel M, et al. 2011. Optical skin biopsies byclinical CARS and multiphoton fluorescence/SHG tomography. Laser Phys. Lett. 8:465–68
112. Breunig HG, Buckle R, Kellner-Hofer M, Weinigel M, Lademann J, et al. 2012. Combined in vivomultiphoton and CARS imaging of healthy and disease-affected human skin. Microsc. Res. Techn. 75:492–98
113. Parekh SH, Lee YJ, Aamer KA, Cicerone MT. 2010. Label-free cellular imaging by broadband coherentanti-Stokes Raman scattering microscopy. Biophys. J. 99:2695–704
114. Hellerer T, Enejder AMK, Zumbusch A. 2004. Spectral focusing: high spectral resolution spectroscopywith broad-bandwidth laser pulses. Appl. Phys. Lett. 85:25–27
115. Pegoraro AF, Ridsdale A, Moffatt DJ, Jia Y, Pezacki JP, Stolow A. 2009. Optimally chirped multimodalCARS microscopy based on a single Ti:sapphire oscillator. Opt. Express 17:2984–96
116. Freudiger CW, Min W, Holtom GR, Xu B, Dantus M, Xie XS. 2011. Highly specific label-free molecularimaging with spectrally tailored excitation-stimulation Raman scattering (STE-SRS) microscopy. Nat.Photonics 5:103–9
117. Lin CY, Suhalim JL, Nien C, Miljkovic M, Diem M, et al. 2011. Picosecond spectral coherent anti-Stokes Raman scattering (CARS) imaging with principal component analysis of meibomian glands. J.Biomed. Opt. 16:021104
118. Begin S, Burgoyne B, Mercier V, Villeneuve A, Vallee R, Cote D. 2011. Coherent anti-Stokes Ramanscattering hyperspectral tissue imaging with a wavelength-swept system. Biomed. Opt. Express 2:1296–306
119. Kim H, Bryant GW, Stranick SJ. 2012. Superresolution four-wave mixing microscopy. Opt. Express20:6042–51
120. Beeker WP, Groβ P, Lee CJ, Cleff C, Offerhaus HL, et al. 2009. A route to sub-diffraction limitedCARS microscopy. Opt. Express 17:22632–38
98 Chung · Boik · Potma
Changes may still occur before final publication online and in print
Ann
u. R
ev. P
hys.
Che
m. 2
013.
64. D
ownl
oade
d fr
om w
ww
.ann
ualr
evie
ws.
org
by U
nive
rsity
of
Cal
ifor
nia
- Ir
vine
on
04/0
2/13
. For
per
sona
l use
onl
y.

PC64CH05-Potma ARI 28 November 2012 15:51
121. Beeker WP, Lee CJ, Boller KJ, Groβ P, Cleff C, et al. 2010. Spatially dependent Rabi oscillations:an approach to sub-diffraction limited coherent anti-Stokes Raman scattering microscopy. Phys. Rev. B81:012507
122. Walther TC, Farese RV Jr. 2012. Lipid droplets and cellular lipid metabolism. Annu. Rev. Biochem.81:687–714
123. Nan X, Potma EO, Xie XS. 2006. Nonperturbative chemical imaging of organelle transport in livingcells with coherent anti-Stokes Raman scattering microscopy. Biophys. J. 91:728–35
124. Yamaguchi T, Omatsu N, Morimoto E, Nakashima H, Ueno K, et al. 2007. CGI-58 facilitates lipolysison lipid droplets but is not involved in the vesculation of lipid droplets by hormonal stimulation. J. LipidRes. 48:1078–89
125. Paar M, Jungst C, Steiner NA, Magnes C, Sinner F, et al. 2012. Remodeling of lipid droplets duringlipolysis and growth in adipocytes. J. Biol. Chem. 287:11164–73
126. Le TT, Cheng JX. 2009. Single-cell profiling reveals the origin of phenotypic variability in adipogenesis.PLoS One 4:e5189
127. Potma EO, de Boeij WP, van Haastert PJM, Wiersma DA. 2001. Real-time visualization of intracellularhydrodynamics. Proc. Natl. Acad. Sci. USA 98:1577–82
128. Ibata K, Takimoto S, Morisaku T, Miyawaki A, Yasui M. 2011. Analysis of aquaporin-mediated diffusionalwater permeability by coherent anti-Stokes Raman scattering microscopy. Biophys. J. 101:2277–83
129. Folick A, Min W, Wang MC. 2011. Label-free imaging of lipid dynamics using coherent anti-StokesRaman scattering (CARS) and stimulated Raman scattering microscopy. Curr. Opin. Genet. Dev. 21:585–90
130. Chien CH, Chen WW, Wu JT, Chang YC. 2011. Label-free imaging of Drosophila in vivo by coher-ent anti-Stokes Raman scattering and two-photon excitation fluorescence microscopy. J. Biomed. Opt.16:016012
131. Huff TB, Cheng JX. 2007. In vivo coherent anti-Stokes Raman scattering imaging of sciatic nerve tissues.J. Microsc. 225:175–82
132. Wang H, Fu Y, Zickmund P, Shi R, Cheng JX. 2005. Coherent anti-Stokes Raman scattering imagingof live spinal tissues. Biophys. J. 89:581–91
133. Huff TB, Shi Y, Sun W, Wu W, Shi R, Cheng JX. 2011. Real-time CARS imaging reveals a calpain-dependent pathway for paranodal myelin retraction during high-frequency stimulation. PLoS One6:e17176
134. Fu Y, Wang H, Huff TB, Shi R, Cheng JX. 2007. Coherent anti-Stokes Raman scattering imagingof myelin degradation reveals a calcium-dependent pathway in lyo-PtdCho-induced demyelination. J.Neurosci. Res. 85:2870–81
135. Imitola J, Rasmussen S, Liu Y, Chitnis T, Khoury SJ, et al. 2011. Multimodal coherent anti-StokesRaman scattering microscopy reveals microglia-associated myelin and axonal dysfunction in multiplesclerosis-like lesions in mice. J. Biomed. Opt. 16:021109
136. Evans CL, Xu X, Kesari S, Xie XS, Wong STC, Young GS. 2007. Chemically-selective imaging of brainstructures with CARS microscopy. Opt. Express 15:12076–87
137. Fu Y, Huff TB, Wang HW, Wang H, Cheng JX. 2008. Ex vivo and in vivo imaging of myelin fibers inmouse brain by coherent anti-Stokes Raman scattering microscopy. Opt. Express 16:19396–409
138. Meyer T, Bergner N, Bielecki C, Krafft C, Akimov D, et al. 2011. Nonlinear microscopy, infrared, andRaman microspectroscopy for brain tumor analysis. J. Biomed. Opt. 16:021113
139. Balu M, Liu G, Chen Z, Tromberg BJ, Potma EO. 2010. Fiber delivered probe for efficient CARSimaging of tissues. Opt. Express 18:2380–88
140. Saar BG, Johnston RS, Freudiger CW, Xie XS, Seibel EJ. 2011. Coherent Raman scattering fiberendoscopy. Opt. Lett. 36:2396–98
www.annualreviews.org • Coherent Nonlinear Vibrational Microscopy 99
Changes may still occur before final publication online and in print
Ann
u. R
ev. P
hys.
Che
m. 2
013.
64. D
ownl
oade
d fr
om w
ww
.ann
ualr
evie
ws.
org
by U
nive
rsity
of
Cal
ifor
nia
- Ir
vine
on
04/0
2/13
. For
per
sona
l use
onl
y.