Biometric Sample Quality and its Application to Multimodal ...
233
Author: Fernando Alonso Fern´ andez (Ingeniero de Telecomunicaci´on, UPM) UNIVERSIDAD POLIT ´ ECNICA DE MADRID ESCUELA T ´ ECNICA SUPERIOR DE INGENIEROS DE TELECOMUNICACI ´ ON DEPARTAMENTO DE SE ˜ NALES, SISTEMAS Y RADIOCOMUNICACIONES Biometric Sample Quality and its Application to Multimodal Authentication Systems –TESIS DOCTORAL– Calidad de muestras biom´ etricas y su aplicaci´ on en sistemas de autenticaci´ on multimodal A thesis submitted for the degree of Doctor of Philosophy & Doctor Europeus Madrid, September 2008
Transcript of Biometric Sample Quality and its Application to Multimodal ...

Author: Fernando Alonso Fernandez
(Ingeniero de Telecomunicacion, UPM)
UNIVERSIDAD POLITECNICA DE MADRID
ESCUELA TECNICA SUPERIOR DE INGENIEROS DE TELECOMUNICACION
DEPARTAMENTO DE SENALES, SISTEMAS Y RADIOCOMUNICACIONES
Biometric Sample Quality and its
Application to Multimodal
Authentication Systems
–TESIS DOCTORAL–
Calidad de muestras biometricas y su aplicacion en
sistemas de autenticacion multimodal
A thesis submitted for the degree of
Doctor of Philosophy & Doctor Europeus
Madrid, September 2008

Colophon
This book was typeset by the author using LATEX2e. The main body of the text was
set using a 11-points Computer Modern Roman font. All graphics and images were
included formatted as Encapsuled Postscript (TM Adobe Systems Incorporated).
The final postscript output was converted to Portable Document Format (PDF)
and printed.
Copyright c© 2008 by Fernando Alonso Fernandez. All rights reserved. No part of
this publication may be reproduced or transmitted in any form or by any means,
electronic or mechanical, including photocopy, recording, or any information stor-
age and retrieval system, without permission in writing from the author.
This Thesis was printed with the financial support from ATVS-UAM.

Department: Senales, Sistemas y RadiocomunicacionesEscuela Tecnica Superior de Ing. de TelecomunicacionUniversidad Politecnica de Madrid (UPM)SPAIN
PhD Thesis: Biometric Sample Quality and its Applicationto Multimodal Authentication Systems
Author: Fernando Alonso FernandezIngeniero de Telecomunicacion(Universidad Politecnica de Madrid)
Advisor: Javier Ortega GarcıaDoctor Ingeniero de Telecomunicacion(Universidad Politecnica de Madrid)Universidad Autonoma de Madrid, SPAIN
Year: 2008
Committee: Narciso Garcıa SantosUniversidad Politecnica de Madrid, SPAIN
Javier Portillo GarcıaUniversidad Politecnica de Madrid, SPAIN
Fabio RoliUniversity of Cagliari, ITALY
Marcos Faundez ZanuyEscola Universitaria Politecnica de Mataro, SPAIN
Julian Fierrez AguilarUniversidad Autonoma de Madrid, SPAIN
The research described in this Thesis was carried out within the Biometric Recognition
Group – ATVS at the Dept. of Ingenierıa Audiovisual y Comunicaciones, Escuela Uni-
versitaria de Ingenierıa Tecnica de Telecomunicacion, Universidad Politecnica de Madrid
(in 2004); and at the Dept. of Ingenierıa Informatica, Escuela Politecnica Superior, Uni-
versidad Autonoma de Madrid (from 2004 to 2008). The project was partially funded by
a PhD scholarship from Comunidad de Madrid and Fondo Social Europeo.


The author was awarded with a PhD scholarship from Consejeria de
Educacion de la Comunidad de Madrid and Fondo Social Europeo between
2004 and 2008 which supported his Ph.D. research.
The author was awarded with a mobility grant from Consejo Social de la
Universidad Politecnica de Madrid, which supported his research stay
carried out at University of Kent, Canterbury, England, from November
2006 to February 2007.

Abstract1
This Thesis is focused on the quality assessment of biometric signals and its ap-
plication to multimodal biometric systems. Since the establishment of biometrics as an
specific research area in late 90s, the biometric community has focused its efforts in the
development of accurate recognition algorithms and nowadays, biometric recognition is
a mature technology that is used in many applications. However, we can notice recent
studies that demonstrate how performance of biometric systems is heavily affected by
the quality of biometric signals. Quality measurement has emerged in the biometric
community as an important concern after the poor performance observed in biometric
systems on certain pathological samples.
We first summarize the state-of-the-art in the biometric quality problem. We
present the factors influencing biometric quality, which mainly have to do with four
issues: the individual itself, the sensor used in the acquisition, the user-sensor interac-
tion, and the system used for processing and recognition. After that, we give strategies
to ensure the best possible quality of acquired biometric samples. Next, we present
existing frameworks for evaluation of the performance of biometric quality measures.
The relationship between human and automatic quality assessment, as well as the role
of quality measures within biometric systems is then analyzed. Lastly, we summarize
standardization efforts related to biometric quality and we point out further issues and
challenges of the quality problem.
The experimental part of the Thesis starts with the study of quality in fingerprint
images. We evaluate the impact of selected image quality measures in the performance
of the two most used approaches for fingerprint recognition using a multi-session and
a multi-sensor database. It is observed high correlation between the different quality
measures in most cases, although some differences are found depending on the sensor.
The behavior of the two matchers under varying image quality conditions has been also
found to be different.
We then study the problem of quality assessment in off-line signature images. We
present several measures aimed to predict the performance of off-line signature verifica-
tion systems measuring factors like signature legibility, complexity, stability, duration,
etc. We also present a new matcher based on local contour features, which is com-
pared with two other approaches. Some remarkable findings of this chapter are that
1Se incluye un resumen extenso de la Tesis en espanol en el Capıtulo 7.

better performance is obtained with legible signatures and skilled forgeries, or that
performance is worsened with highly variable signatures.
Finally, we contribute with a quality-based multibiometric architecture that is gen-
eralizable to biometric systems working with multiple sources of information (different
modalities, matchers, acquisition devices, etc.). In this approach, quality is used to
switch between different system modules depending on the data source, and to con-
sider only data of enough quality. We compare the proposed architecture with a set of
simple fusion rules. It is demonstrated that the proposed system outperforms the rest
when coping with signals originated from heterogeneous biometric sources, pointing
out its effectiveness. An additional overall improvement of 25% is observed in the
EER by incorporating a quality-based score rejection scheme, showing the benefits of
incorporating quality information in biometric systems.

TO MY FAMILY AND LIGHT.
“I do not know what I may appear to the world, but
to myself I seem to have been only like a boy playing
on the sea-shore, and diverting myself in now and
then finding a smoother pebble or a prettier shell
than ordinary, whilst the great ocean of truth lay
all undiscovered before me”.
−Sir Isaac Newton.−
Physicist, mathematician, astronomer, naturalphilosopher, alchemist and theologian.
His PhilosophiæNaturalis Principia Mathematica,published in 1687, is said to be the greatest
single work in the history of science,and is the basis for modern
engineering.


Acknowledgements
This Thesis summarizes the work I have carried out during my Ph.D. studies with
the ATVS - Biometric Recognition Group since 2004. This research group was estab-
lished in 1994 at the Dept. of Ingenierıa Audiovisual y Comunicaciones (DIAC) of
the Universidad Politecnica de Madrid (UPM) and since 2004, it is affiliated to the
Dept. of Ingenierıa Informatica of the Universidad Autonoma de Madrid (UAM). The
work presented in this Thesis has been conducted at both institutions. This Thesis has
been mainly supported by a Ph.D. scholarship granted to the author by Comunidad
de Madrid and Fondo Social Europeo, which covered the period between October 2004
and October 2008, and also by various Spanish and European projects referenced in
the related publications.
I would like to devote a number of paragraphs to acknowledge a number of col-
leagues and friends who have make this Ph.D. Thesis to become a reality, both direct
or indirectly (with apologies to those that unintentionally are not mentioned here).
Foremost, I have to thank my advisor Prof. Javier Ortega-Garcıa for his guidance
and support over the past five years. During this period I have benefited from his
vision, discipline and intelligent effort, which have definitely shaped my thinking and
working attitudes, and have taught me how to successfully manage multiple “temitas”
(tasks). In the framework of the ATVS research group I have also received support
from Prof. Joaquın Gonzalez-Rodrıguez, feeling fortunate to learn from his courage
and self-mastery. I am also indebted with Prof. Javier Portillo-Garcıa (Grupo de
Procesado de Datos y Simulacion, GPDS, UPM), who is the responsible of my first
steps in the research world when I was pursuing my Master degree. I have been also
advised by Prof. Luis A. Hernandez-Gomez (Grupo de Aplicaciones del Procesado de
Senal, GAPS, UPM) during this PhD Thesis, having the opportunity to experience
his exemplifying and encouraging philosophy of research work. I also want to thank
Profs. Narciso Garcıa-Santos (Grupo de Tratamiento de Imagenes, GTI, UPM) , Juan-
Alberto Siguenza-Pizarro (Escuela Politecnica Superior, EPS, UAM), Carmen Garcıa-
Mateo (Grupo de Tecnologıas de la Senal, GTS, UVIGO) and Eduardo Lopez-Gonzalo
(Grupo de Aplicaciones del Procesado de Senal, GAPS, UPM) for the work on reviewing
this Thesis, and for their wise comments and suggestions, as well as to Mari-Carmen
Munoz-Ruiz (Secretarıa SSR, UPM), for her patience and valuable help. A extra special
mention has to be done to colleague Dr. Julian Fierrez-Aguilar for the endless hours
of enriching discussions. I really appreciate his support and guidance, without whom
this PhD Thesis would have not been the same.
During my Ph.D. studies I had the great opportunity of visiting a number of foreign
institutions, an experience which definitely changed my mind and opened a number of
both professional and personal relationships. I specially remember the one-month ex-
perience at the BioSecure Residential Workshop, held in Paris during August of 2005. I
had the fortune to meet there a number of researchers in a wonderful international en-
vironment. I benefited during this Workshop from work and discussions with students
as well as top researchers in their fields: Hartwig Fronthaler, Klaus Kollreider, Sonia
Garcia-Salicetti, Bao Ly-Van, Tung Doan Trung, Bernadette Dorizzi, Jana Dittman,
Claus Vielhauer, Tobias Scheidat, Gerard Chollet, Dijana Petrovska, Josef Kittler and
Carmen Garcia-Mateo. My first three-months stay was in 2005 at the University of
Twente (Enschede, The Netherlands, just in the heart of Europe), with Prof. Raymond
Veldhuis. As part of the Signals and Systems group, he inspired me with his different
way of working and managing people, in a group that has produced important contri-
butions in the biometric field. I gratefully remember both professional and personal
contact with him and people of his group and his institution: Asker Bazen, Haiyun Xu
and Chun Chen. My second three-months stay was in 2006 at the University of Cagliari
(in the wonderful island of Sardinia, Italy), with Prof. Fabio Roli, where I could benefit
from his mastering in the field of pattern recognition and his important contributions in
the fingerprint recognition area. I really appreciate his guidance during my stay, which
was a real inspiration for this Ph.D. Thesis. I also sincerely thank Prof. Gian Luca
Marcialis for his enormous personal and scientific support (and great patience), and
the Latin spirit of Prof. Roli’s people, who made me feel at home: Giorgio Giacinto,
Giorgio Fumera, Roberto Tronci, Alessandra Serrau and Daniele Muntoni. Next, in
2006-2007, I did a four-month research stay at the University of Kent (in the medieval
city of Canterbury, England), where I had the luck of working under the master direc-
tion of Prof. Mike Fairhurst. I was really motivated by the close contact with such a
distinguished researcher, and his important contributions in the field of signature recog-
nition was a real inspiration, helping definitely to outline and give shape to this Thesis.
I also appreciate the extraordinary care as host of Prof. Fairhurst and the people of
his fantastic department: Farzin Deravi, Richard Ng, Martino Bacile di Castiglione,
Jenny Harries and Nicola Brown. My last foreign experience was a two-weeks visit in
June 2007 to the Institut National des Telecommunications (Groupe des Ecoles des
Telecommunications, France), with Prof. Sonia Garcia-Salicetti. In spite of its short
duration, I had enough time to benefit from her experience in signature recognition,

as well as to enjoy the close and warm contact with her extraordinary group of peo-
ple. I have to thank her student Nesma Houmani, with whom I worked closely, and
other people that helped me in other aspects of my stay, including Aurelien Mayoue,
Lorene Allano and Patricia Fixot. I also have to acknowledge the countless people and
institutions beyond the scientific and departmental scope that help you to feel at home
when you are thousand of kilometers away from it. I specially acknowledge the financial
support from Consejeria de Educacion de la Comunidad de Madrid, Consejo Social de
la Universidad Politecnica de Madrid and BioSecure Network of Excellence.
I would like also to acknowledge a number of researchers who have helped to shape
this PhD Thesis with their interesting discussions, and many others whose inspiring
work has motivated this Thesis. These researchers include Andy Adler, David Benini,
Josef Bigun, Raffaelle Cappelli, Patrick Grother, Richard Guest, Anil Jain, Alisher
Kholmatov, Krzysztof Kryszczuk, Davide Maltoni, Norman Poh, Jonas Richiardi, Arun
Ross and Elham Tabassi.
I have had the lucky opportunity to supervise and/or collaborate with a number
of M.Sc. candidates in their degree projects, having learned much from them. These
wonderful engineers are: Francisco del Valle, Marcos Martınez, Susana Pecharroman
and Pedro Tome. I have also been enriched by the opportunity of participating in our
“baby-researchers” experience, which involves a number of people in their first years
of degree. These extraordinary promising researchers who full our B-203 nursery of
young strength are: Alicia Beisner, Javier Burgues, Almudena Gilperez and Virginia
Ruiz-Albacete.
And lastly, but not less important, it is mandatory for me to thank all the work
mates at ATVS who have shared with me so many laughs, deadlines, friendship and
projects. I have to thank from the bottom of my heart to: Alejandro Abejon, Carlos
Bousono, Cristina Esteve, Javier Franco-Pedroso, Manuel R. Freire, Javier Galbally,
Marta Garcıa-Gomar, Daniel Garcıa-Romero, Javier Garcıa-Torcelly, Javier Gonzalez-
Domınguez, Vıctor M. Gonzalez, Daniel Hernandez-Lopez, Ignacio Lopez-Moreno, Jaime
Lopez-Penalba, Marcos Martınez-Dıaz, Ismael Mateos-Garcıa, Alberto Montero, Lucas
Perez, Daniel Ramos, Diego Rodrıguez, Javier Simon, Danilo Spada, Prof. Doroteo T.
Toledano, among many others who have recently joined up with this exciting research
journey at ATVS.
A las personas que me acompanan en el viaje de la vida y sin las cuales nada de
esto tendrıa sentido, que no necesitan ser nombradas porque sabeis quienes sois.
Fernando Alonso-Fernandez
Madrid, September 2008


Contents
Abstract vi
Acknowledgements x
List of Figures xvii
List of Tables xxv
1 Introduction 1
1.1 Biometric systems . . . . . . . . . . . . . . . . . . . . . . . . . . . . . . 2
1.2 Multibiometric systems . . . . . . . . . . . . . . . . . . . . . . . . . . . 6
1.3 Quality information in biometric systems . . . . . . . . . . . . . . . . . 8
1.4 Performance evaluation of biometric systems . . . . . . . . . . . . . . . 10
1.4.1 Statistical significance of experimental results . . . . . . . . . . . 12
1.5 Motivation of the Thesis . . . . . . . . . . . . . . . . . . . . . . . . . . . 12
1.6 The Thesis . . . . . . . . . . . . . . . . . . . . . . . . . . . . . . . . . . 14
1.7 Outline of the Dissertation . . . . . . . . . . . . . . . . . . . . . . . . . . 15
1.8 Research contributions . . . . . . . . . . . . . . . . . . . . . . . . . . . . 17
2 Quality Measures in Biometric Systems 21
2.1 Definition of biometric sample quality . . . . . . . . . . . . . . . . . . . 24
2.2 Factors influencing biometric quality . . . . . . . . . . . . . . . . . . . . 25
2.3 Ensuring good quality in biometric samples . . . . . . . . . . . . . . . . 29
2.4 Performance of quality assessment algorithms . . . . . . . . . . . . . . . 32
2.4.1 Previous works . . . . . . . . . . . . . . . . . . . . . . . . . . . . 32
2.4.2 A framework for evaluating biometric quality measures . . . . . . 34
2.4.3 Evaluation of quality algorithms . . . . . . . . . . . . . . . . . . 36
2.5 Human vs. automatic quality assessment . . . . . . . . . . . . . . . . . . 37
xiii

CONTENTS
2.6 Incorporating quality measures in biometric systems . . . . . . . . . . . 38
2.7 Standardizing biometric quality . . . . . . . . . . . . . . . . . . . . . . . 42
2.8 Issues and challenges . . . . . . . . . . . . . . . . . . . . . . . . . . . . . 45
2.9 Chapter summary and conclusions . . . . . . . . . . . . . . . . . . . . . 46
3 Quality Assessment of Fingerprint Images 49
3.1 Automatic fingerprint recognition . . . . . . . . . . . . . . . . . . . . . . 51
3.1.1 Fingerprint Sensing . . . . . . . . . . . . . . . . . . . . . . . . . 51
3.1.2 Preprocessing and Feature Extraction . . . . . . . . . . . . . . . 53
3.1.3 Fingerprint Matching . . . . . . . . . . . . . . . . . . . . . . . . 57
3.1.4 Issues and Challenges . . . . . . . . . . . . . . . . . . . . . . . . 59
3.2 Literature review of algorithms for fingerprint image quality estimation 62
3.2.1 Assessing the quality of fingerprint images . . . . . . . . . . . . . 62
3.2.2 Fingerprint image quality estimation methods . . . . . . . . . . . 64
3.2.3 Methods based on local features . . . . . . . . . . . . . . . . . . 65
3.2.4 Methods based on global features . . . . . . . . . . . . . . . . . . 74
3.2.5 Methods based on classifiers . . . . . . . . . . . . . . . . . . . . . 76
3.3 Fingerprint matcher based on minutiae . . . . . . . . . . . . . . . . . . . 77
3.4 Fingerprint matcher based on ridge information . . . . . . . . . . . . . . 79
3.5 Experimental framework . . . . . . . . . . . . . . . . . . . . . . . . . . . 81
3.5.1 Database and protocol . . . . . . . . . . . . . . . . . . . . . . . . 81
3.5.2 Selected quality measures . . . . . . . . . . . . . . . . . . . . . . 82
3.6 Results . . . . . . . . . . . . . . . . . . . . . . . . . . . . . . . . . . . . . 85
3.7 Chapter summary and conclusions . . . . . . . . . . . . . . . . . . . . . 88
4 Quality Assessment of Signature Images 93
4.1 Automatic off-line signature recognition . . . . . . . . . . . . . . . . . . 94
4.1.1 Signature acquisition and preprocessing . . . . . . . . . . . . . . 95
4.1.2 Feature extraction . . . . . . . . . . . . . . . . . . . . . . . . . . 97
4.1.3 Signature matching . . . . . . . . . . . . . . . . . . . . . . . . . . 99
4.1.4 Issues and challenges . . . . . . . . . . . . . . . . . . . . . . . . . 101
4.2 Contribution: quality estimation of signature samples . . . . . . . . . . 102
4.2.1 Legibility and type of signature . . . . . . . . . . . . . . . . . . . 104
4.2.2 Slant and variability measures . . . . . . . . . . . . . . . . . . . 106
4.2.3 Geometrical measures . . . . . . . . . . . . . . . . . . . . . . . . 109
4.3 Experimental framework . . . . . . . . . . . . . . . . . . . . . . . . . . . 111
4.3.1 Database and protocol . . . . . . . . . . . . . . . . . . . . . . . . 111
xiv

CONTENTS
4.4 Signature matcher based on global information . . . . . . . . . . . . . . 114
4.4.1 Signature preprocessing . . . . . . . . . . . . . . . . . . . . . . . 114
4.4.2 Feature extraction and matching . . . . . . . . . . . . . . . . . . 114
4.5 Signature matcher based on local HMM analysis . . . . . . . . . . . . . 117
4.6 Contribution: Signature matcher based on local contour analysis . . . . 117
4.6.1 Signature preprocessing . . . . . . . . . . . . . . . . . . . . . . . 119
4.6.2 Feature extraction . . . . . . . . . . . . . . . . . . . . . . . . . . 119
4.6.3 Feature matching . . . . . . . . . . . . . . . . . . . . . . . . . . . 122
4.6.4 System development . . . . . . . . . . . . . . . . . . . . . . . . . 122
4.7 Results and discussion . . . . . . . . . . . . . . . . . . . . . . . . . . . . 124
4.7.1 Legibility and type of signature . . . . . . . . . . . . . . . . . . . 124
4.7.2 Slant and variability measures . . . . . . . . . . . . . . . . . . . 127
4.7.3 Geometrical measures . . . . . . . . . . . . . . . . . . . . . . . . 131
4.8 Chapter summary and conclusions . . . . . . . . . . . . . . . . . . . . . 133
5 Quality-Based Processing and Fusion in Multibiometrics 135
5.1 Calibration and fusion of biometric systems . . . . . . . . . . . . . . . . 136
5.1.1 Calibration of scores from a biometric system . . . . . . . . . . . 136
5.1.2 Linear logistic regression fusion . . . . . . . . . . . . . . . . . . . 138
5.2 Dataset and experimental protocol . . . . . . . . . . . . . . . . . . . . . 140
5.3 Contribution: System architecture with quality-based conditional pro-
cessing . . . . . . . . . . . . . . . . . . . . . . . . . . . . . . . . . . . . . 146
5.4 Results . . . . . . . . . . . . . . . . . . . . . . . . . . . . . . . . . . . . . 147
5.4.1 Estimation of the input device from quality measures . . . . . . 147
5.4.2 Sensor interoperability . . . . . . . . . . . . . . . . . . . . . . . . 151
5.4.3 Quality-dependent multimodal fusion . . . . . . . . . . . . . . . 154
5.5 Chapter summary and conclusions . . . . . . . . . . . . . . . . . . . . . 160
6 Conclusions and Future Work 161
6.1 Conclusions . . . . . . . . . . . . . . . . . . . . . . . . . . . . . . . . . . 161
6.2 Future work . . . . . . . . . . . . . . . . . . . . . . . . . . . . . . . . . . 163
7 Resumen Extendido de la Tesis 165
7.1 Introduccion . . . . . . . . . . . . . . . . . . . . . . . . . . . . . . . . . . 166
7.2 Medidas de calidad en sistemas biometricos . . . . . . . . . . . . . . . . 176
7.3 Analisis de calidad en imagenes de huella . . . . . . . . . . . . . . . . . 178
7.4 Analisis de calidad en imagenes de firma . . . . . . . . . . . . . . . . . . 180
xv

CONTENTS
7.5 Procesado y fusion multibiometrica dependiente de calidad . . . . . . . 182
7.6 Lıneas de Trabajo Futuro . . . . . . . . . . . . . . . . . . . . . . . . . . 183
xvi

List of Figures
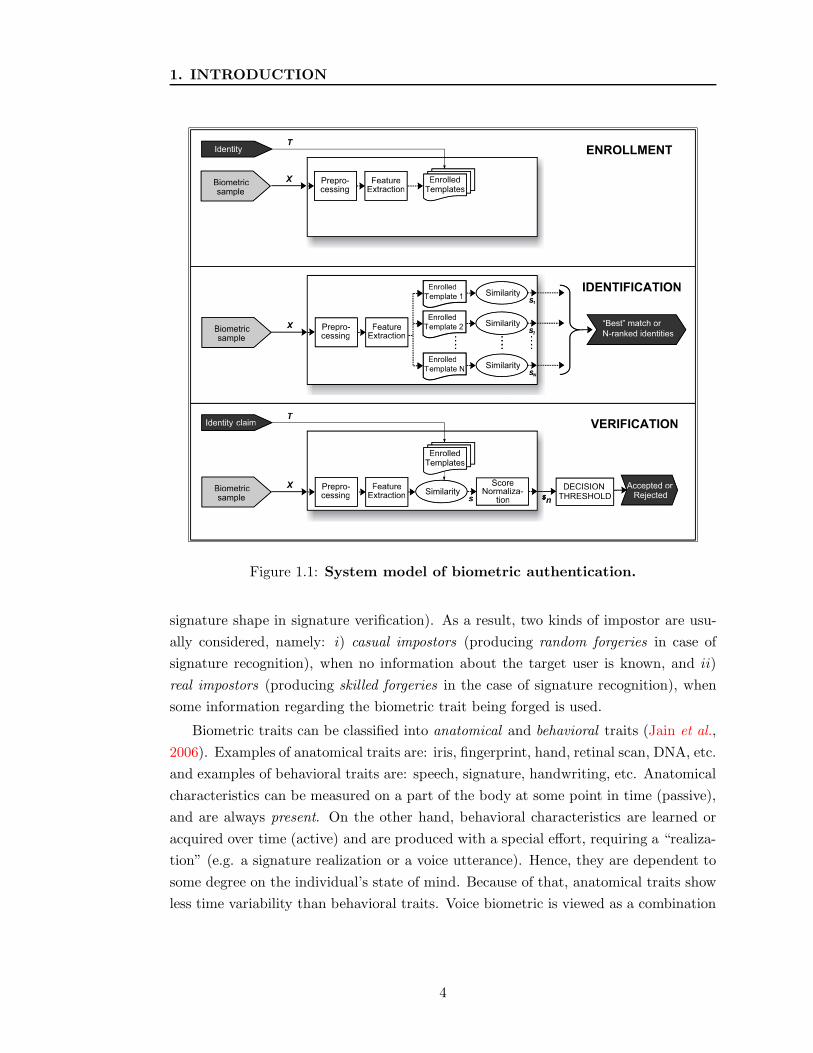
1.1 System model of biometric authentication. . . . . . . . . . . . . . 4
1.2 Example of biometric traits. . . . . . . . . . . . . . . . . . . . . . . 5
1.3 Example of verification performance comparison with ROC
(left) and DET (right) curves. . . . . . . . . . . . . . . . . . . . . . 11
1.4 Dependence among Dissertation chapters. . . . . . . . . . . . . . 16
2.1 Definition of biometric quality from three different points of
view: character, fidelity or utility. . . . . . . . . . . . . . . . . . . . 23
2.2 Factors affecting the quality of biometric signals. . . . . . . . . . 24
2.3 Biometric quality assurance process. . . . . . . . . . . . . . . . . . 30
2.4 Raw similarity scores from a fingerprint matcher versus the
average quality of the enrolment and the test images. . . . . . . 35
2.5 Verification performance of a fingerprint matcher as samples
with the lowest quality value are rejected. . . . . . . . . . . . . . 37
2.6 Roles of a sample quality measure in the context of biometric
systems. . . . . . . . . . . . . . . . . . . . . . . . . . . . . . . . . . . . 39
2.7 Use of standards in biometric systems to ensure good quality. . 43
3.1 Acquisition principles of silicon and optical sensors. . . . . . . . 50
3.2 Solid-state sensors embedded in portable devices. . . . . . . . . . 51
3.3 (a) loop and delta singularities, (b) ridge ending, (c) ridge bi-
furcation. . . . . . . . . . . . . . . . . . . . . . . . . . . . . . . . . . . 52
3.4 Local ridge orientation of a fingerprint image computed over a
square-meshed grid: (a) original image, (b) orientation image,
(c) smoothed orientation image. Each element of (b) and (c)
denotes the local orientation of the ridges. Figure extracted
from Simon-Zorita (2003). . . . . . . . . . . . . . . . . . . . . . . . . 54
3.5 Modeling of ridges and valleys as a sinusoidal-shaped wave. . . 54
xvii

LIST OF FIGURES
3.6 Enhancement of fingerprint images. . . . . . . . . . . . . . . . . . . 55
3.7 Segmentation of fingerprint images. Left: original image. Right:
segmentation mask. . . . . . . . . . . . . . . . . . . . . . . . . . . . . 55
3.8 Binarization and thinning of fingerprint images using contex-
tual filters. Figure extracted from Simon-Zorita et al. (2003). . 56
3.9 Thinning step: (a) typical imperfections appeared during the
thinning step, (b) a thinned fingerprint structure before and
after removing imperfections. . . . . . . . . . . . . . . . . . . . . . . 56
3.10 Minutia represented by its spatial coordinates and angle. . . . . 57
3.11 Alignment between minutiae of two fingerprints. Figure ex-
tracted from Jain et al. (1997a). . . . . . . . . . . . . . . . . . . . . 58
3.12 Texture information based on local orientation. Figure ex-
tracted from Munoz-Serrano (2004). . . . . . . . . . . . . . . . . . 59
3.13 Examples of intra-class variability in fingerprints. Figure ex-
tracted from Simon-Zorita (2003). . . . . . . . . . . . . . . . . . . 60
3.14 Sample images of poor quality due to different factors: (a)
displacement with respect to the center, (b) incomplete fin-
gerprint (out of the scanning area), (c) incomplete fingerprint
(low pressure), (d) blurring, (e) ghost effects (non-zero back-
ground), (f) non-homogeneous gray-scale, (g) ridge structure
not well defined, (h) lack of ridge structure in some zones, (i)
broken ridge structure due to chaps, (j) artifacts in ridge struc-
ture, (k) visible pores, (l) fingerprint divided in two parts, and
(m) fingerprint size. Figure extracted from Simon-Zorita (2003). 63
3.15 Taxonomy of existing fingerprint image quality estimation meth-
ods. . . . . . . . . . . . . . . . . . . . . . . . . . . . . . . . . . . . . . . 65
3.16 Computation of the Orientation Certainty Level (OCL) for two
fingerprints of different quality. Panel (a) are the input finger-
print images. Panel (b) are the block-wise values of the OCL;
blocks with brighter color indicate higher quality in the region. 68
3.17 Computation of the Local Orientation Quality (LOQ) for two
fingerprints of different quality. Panel (a) are the direction
fields of the images shown in Figure 3.16a. Panel (b) are the
block-wise values of the average absolute difference of local
orientation with the surrounding blocks; blocks with brighter
color indicate higher difference value and thus, lower quality. . 69
xviii

LIST OF FIGURES
3.18 Estimation of fingerprint quality using symmetry features. Fig-
ure shows the decomposition of two fingerprints of different
quality into linear and parabolic symmetry (second and third
column, respectively). The final local quality estimation in
blocks is depicted in the fourth column (blocks with brighter
color indicate higher quality in the region). . . . . . . . . . . . . . 70
3.19 Estimation of fingerprint quality using Gabor filters. Panel (a)
are the input fingerprint images. Panel (b) are the block-wise
values of the standard deviation of m filter responses (8 in this
example) with different direction. Blocks with brighter color
indicate higher standard deviation value and thus, higher quality. 71
3.20 Estimation of fingerprint quality using gray level statistics for
the two fingerprints of different quality shown in Figure 3.16a.
Figure shows (from left to right of each subplot): fingerprint
image and block-wise values of mean, standard deviation and
contrast value, respectively. Brighter values in the blocks indi-
cate higher values. For the low quality fingerprint we observe
more fluctuation of the three measures across the image. . . . . 72
3.21 Modeling of ridges and valleys as a sinusoid. . . . . . . . . . . . . 73
3.22 Computation of the Local Clarity Score for two fingerprint
blocks of different quality. Panel (a) are the fingerprint blocks.
Panel (b) are the gray level distributions of the segmented
ridges and valleys. The degree of overlapping for the low and
high quality block is 0.22 and 0.10, respectively. . . . . . . . . . . 74
3.23 Fingerprint quality maps provided by the minutia detection
package of the NIST Fingerprint Image Software for two fin-
gerprints of different quality. . . . . . . . . . . . . . . . . . . . . . . 75
3.24 Computation of the energy concentration in the power spec-
trum for two fingerprints of different quality. Panel (a) are the
power spectra of the images shown in Figure 3.16a. Panel (b)
shows the energy distributions in the region of interest. The
quality values for the low and high quality image are 0.35 and
0.88 respectively. . . . . . . . . . . . . . . . . . . . . . . . . . . . . . . 76
3.25 System architecture of the MINDTCT package of the NIST
Fingerprint Image Software 2 (NFIS2). . . . . . . . . . . . . . . . 77
xix

LIST OF FIGURES
3.26 Compatibility between minutiae pairs of two different finger-
prints. . . . . . . . . . . . . . . . . . . . . . . . . . . . . . . . . . . . . 79
3.27 Processing steps of the ridge-based matcher. From left to right:
original image, filtered image with filter orientation θ = 0 and
FingerCode. Figure extracted from Munoz-Serrano (2004). . . 79
3.28 Biosec baseline fingerprint sensors. . . . . . . . . . . . . . . . . . . 80
3.29 Example images from the BioSec baseline corpus. Fingerprint
images are plotted for the same finger for (i) capacitive sensor
(top row), optical sensor (medium row), thermal sensor (bot-
tom row), and (ii) three different fingerprints, one per column. 82
3.30 Quality distribution of the images of the BioSec baseline corpus
(test set). All image quality values are normalized into the
[0-1] range, with 0 corresponding to the worst quality and 1
corresponding to the best quality. . . . . . . . . . . . . . . . . . . . 83
3.31 Correlation between the automatic quality assessment algo-
rithms tested in this work (x- and y-axis are the quality values
of the two algorithms under comparison). Pearson correlation
value between the two algorithms is also shown in each subplot. 84
3.32 Minutiae-based matcher. Dependence of similarity scores (y-
axis) on the average quality of the template and the input im-
ages (x-axis). We assign a quality value to a given score, which
is computed as√
Qe × Qt, where Qe and Qt are the quality val-
ues of the enrolment and test fingerprint samples, respectively,
corresponding to the matching. . . . . . . . . . . . . . . . . . . . . 86
3.33 Ridge-based matcher. Dependence of similarity scores (y-axis)
on the average quality of the template and the input images
(x-axis). We assign a quality value to a given score, which is
computed as√
Qe × Qt, where Qe and Qt are the quality val-
ues of the enrolment and test fingerprint samples, respectively,
corresponding to the matching. . . . . . . . . . . . . . . . . . . . . 87
3.34 Minutiae-based matcher. Verification performance as samples
with the lowest quality value are rejected. Results are shown
for all the quality measures tested in this work in terms of False
Acceptance Rate at 1% FRR (first column), Equal Error Rate
- EER (second column) and False Rejection Rate at 1% FAR
(third column). . . . . . . . . . . . . . . . . . . . . . . . . . . . . . . . 90
xx

LIST OF FIGURES
3.35 Ridge-based matcher. Verification performance as samples with
the lowest quality value are rejected. Results are shown for
all the quality measures tested in this work in terms of False
Acceptance Rate at 1% FRR (first column), Equal Error Rate
- EER (second column) and False Rejection Rate at 1% FAR
(third column). . . . . . . . . . . . . . . . . . . . . . . . . . . . . . . . 91
4.1 Example of signatures from MCYT database. The two left
signatures are genuine and the one on the right is a skilled
forgery. Plots below each signature correspond to the available
on-line information, namely: position trajectories (horizontal
x, and vertical y), pressure (p), and pen inclination (azimuth
and altitude angles). . . . . . . . . . . . . . . . . . . . . . . . . . . . 94
4.2 Signature binarization using the Otsu method. . . . . . . . . . . 96
4.3 Noise removal using morphological closing. . . . . . . . . . . . . . 96
4.4 Elimination of signature outermost flourish strokes. Figure ex-
tracted from Alonso-Hermira (2003); Moreno-Marquez (2003). 97
4.5 Size normalization to a fixed width. Figure extracted from
Alonso-Hermira (2003); Moreno-Marquez (2003). . . . . . . . . . 97
4.6 Several signatures of two different subjects after size normal-
ization and centering. Figure extracted from Alonso-Hermira
(2003); Moreno-Marquez (2003). . . . . . . . . . . . . . . . . . . . 98
4.7 Signature examples with different degrees of name legibility
(from top to bottom). . . . . . . . . . . . . . . . . . . . . . . . . . . 103
4.8 Signature examples of the four types encountered in the MCYT
corpus (from left to right). . . . . . . . . . . . . . . . . . . . . . . . 105
4.9 Slant measure. Example of two eroded images (bottom row)
of a given signature image (top row). The middle row shows
the two structuring elements used for the erosion. The dotted
circle denotes a region of the signature having various strokes
crossing in several directions. In this region, no predominant
slant direction exists. . . . . . . . . . . . . . . . . . . . . . . . . . . . 107
4.10 Slant measure. Histogram (left bottom) and cumulative his-
togram (right bottom) of the number of eroded images in which
a pixel is marked for the two example signatures shown. . . . . 108
xxi

LIST OF FIGURES
4.11 Variability measure. Example of two signature sets of different
variability. Vectors {o1, ...,oK} denote the K different signatures
(K=5 in this example). Parameter µ denotes the mean vector
of the K signatures {o1, ...,oK}. Parameters di are the Euclidean
distances of each signature oi to the mean vector µ (i = 1, ...,K). 109
4.12 Variability measure. Example of two signature sets of different
variability from the MCYT database. . . . . . . . . . . . . . . . . 110
4.13 Cumulative distribution function of the proposed Slant and
Variability measures for all users of the database used in this
Chapter. . . . . . . . . . . . . . . . . . . . . . . . . . . . . . . . . . . . 111
4.14 Geometrical measures. Example of signatures with different
measure value. . . . . . . . . . . . . . . . . . . . . . . . . . . . . . . . 112
4.15 Cumulative distribution function of the proposed geometrical
measures for all users of the database used in this Chapter. . . 113
4.16 Preprocessing stage performed in the signature matcher based
on global analysis. Figure extracted from Alonso-Hermira (2003);
Moreno-Marquez (2003). . . . . . . . . . . . . . . . . . . . . . . . . 115
4.17 Feature extraction stage performed in the signature matcher
based on global analysis. Structuring elements used for slant
direction extraction (SE-1 to SE-32) and envelope direction ex-
traction (SE-33 to SE-38) are also shown. Origin of the element
is indicated in gray. The area of SE-1 to SE-32 is 10 pixels and
the angle between successive elements is approximately 11 de-
grees. The areas of SE-33/34 and SE-35/36/37/38 are 7 and 4
pixels respectively. Figure based on plots appearing in Alonso-
Hermira (2003); Moreno-Marquez (2003). . . . . . . . . . . . . . . 116
4.18 Example of division of a signature image into overlapped col-
umn blocks. Figure extracted from Alonso-Hermira (2003);
Moreno-Marquez (2003). . . . . . . . . . . . . . . . . . . . . . . . . 117
4.19 Preprocessing stage performed in the signature matcher based
on local contour analysis. . . . . . . . . . . . . . . . . . . . . . . . . 118
4.20 Graphical description of the feature extraction. From left to
right: contour direction (f1), contour hinge (f2) and horizontal
direction co-occurrence (f3h). . . . . . . . . . . . . . . . . . . . . . 121
4.21 Verification performance without score normalization (user-
independent decision thresholds). . . . . . . . . . . . . . . . . . . . 124
xxii

LIST OF FIGURES
4.22 System performance based on the Slant Measure. For each
matcher, it is also given the relative gain of performance with
respect to the overall results for the point x=4.5. . . . . . . . . . 128
4.23 System performance based on the gray level variance across
signature strokes. Grey dashed lines denote the overall perfor-
mance of each matcher in the whole dataset. . . . . . . . . . . . . 130
4.24 System performance based on the number of pixels of the sig-
nature. Grey dashed lines denote the overall performance of
each matcher in the whole dataset. . . . . . . . . . . . . . . . . . . 131
4.25 System performance based on the size of the bounding box of
the signature. Grey dashed lines denote the overall perfor-
mance of each matcher in the whole dataset. . . . . . . . . . . . . 132
5.1 Modalities considered in the Access Control Evaluation. Top
row: hardware devices and acquisition samples for the face
modality (left: low resolution webcam, right: high resolution
digital camera). Bottom row: hardware devices and acquisition
samples for the fingerprint modality (left: optical sensor with
flat positioning of the finger, right: thermal sensor with finger
sweeping). . . . . . . . . . . . . . . . . . . . . . . . . . . . . . . . . . . 143
5.2 Performance in terms or EER of the different modalities de-
fined in Table 5.2 in the training and evaluation sets defined in
Table 5.1. . . . . . . . . . . . . . . . . . . . . . . . . . . . . . . . . . . 144
5.3 Architecture of the proposed fusion strategy, including some
quality-based conditional processing steps (highlighted with
dashed ellipses). . . . . . . . . . . . . . . . . . . . . . . . . . . . . . . 145
5.4 Face quality features for query device estimation. . . . . . . . . . 149
5.5 Verification results of the proposed log-likelihood fusion (Log-
lik.) together with simple fusion rules used for comparison
(Loglik. SUM is further studied in the present chapter, Log-
lik. MAX was the approach submitted by the authors to the
quality-based Biosecure evaluation). . . . . . . . . . . . . . . . . . 150
5.6 Verification results of the fusion for the different mixtures de-
fined in Table 5.4. . . . . . . . . . . . . . . . . . . . . . . . . . . . . . 153
5.7 Verification performance in terms of EER for the fingerprint
modality as scores with the lowest quality value are discarded. 154
xxiii

LIST OF FIGURES
5.8 Verification performance in terms of EER for the face modality
as scores with the lowest quality value are discarded. Results
are shown using the quality features that result in the highest
improvement of the EER. . . . . . . . . . . . . . . . . . . . . . . . . 155
5.9 Incorporation of quality information in the fusion stage. Re-
sults show the number of accesses per modality with quality
value lower than the predefined thresholds. It can be observed
that the fusion reduces significantly the number of rejected ac-
cesses. . . . . . . . . . . . . . . . . . . . . . . . . . . . . . . . . . . . . 158
5.10 Verification results of the proposed fusion incorporating quality
information in the fusion stage (without device estimation). . . 159
5.11 Verification results of the proposed fusion for the different mix-
tures defined in Table 5.2 incorporating quality information in
the fusion stage (without device estimation). . . . . . . . . . . . . 159
xxiv

List of Tables
2.1 Results in terms of Equal Error Rate (EER) of the best per-
forming algorithm in each of the four databases of the FVC
competitions (Cappelli et al., 2006b). . . . . . . . . . . . . . . . . 22
2.2 Physiological factors that can have impact on biometric quality. 25
2.3 Behavioral factors that can have impact on biometric quality. . 26
2.4 Environmental factors that can have impact on biometric quality. 26
2.5 Operational factors that can have impact on biometric quality. 28
3.1 Summary of existing fingerprint quality measures based on lo-
cal features. . . . . . . . . . . . . . . . . . . . . . . . . . . . . . . . . . 66
3.2 Summary of existing fingerprint quality measures based on
global features. . . . . . . . . . . . . . . . . . . . . . . . . . . . . . . . 67
3.3 Relationship between sensor acquisition area and relative per-
formance improvement obtained after rejection of 5% of the
samples (results shown in this table are the best cases of Fig-
ures 3.34 and 3.35). It is observed that, in general, bigger ac-
quisition area results in higher performance improvement for
the minutiae-based matcher.∗ Image size of the capacitive sensor is after interpolation to
500 dpi, see Section 3.5.1. . . . . . . . . . . . . . . . . . . . . . . . . 92
4.1 Distribution of users on the MCYT database (75 users) based
on name legibility and signature type. . . . . . . . . . . . . . . . . 106
4.2 Features used in the signature matcher based on local contour
analysis. . . . . . . . . . . . . . . . . . . . . . . . . . . . . . . . . . . . 120
4.3 System Performance in terms of EER (in %) of the individual
features with a posteriori user-dependent score normalization
when using K = 5 or 10 training signatures. . . . . . . . . . . . . 123
xxv

LIST OF TABLES
4.4 System Performance in terms of EER (in %) of the combination
of features with a posteriori user-dependent score normaliza-
tion when using K = 5 or 10 training signatures. They are
marked in bold the cases in which there is a performance im-
provement with respect to the best individual feature involved. 123
4.5 System performance based on name legibility in terms of EER.
Results are given in %. Grey dashed lines denote the overall
performance of each matcher in the whole dataset. For each
matcher, it is also given the relative gain/loss of performance
with respect to the overall results. . . . . . . . . . . . . . . . . . . 125
4.6 System performance based on signature type in terms of EER.
Results are given in %. Grey dashed lines denote the overall
performance of each matcher in the whole dataset. . . . . . . . . 126
4.7 System performance based on the Variability Measure in terms
of EER (results are given in %). Grey dashed lines denote the
overall performance of each matcher in the whole dataset. For
each matcher, it is also given the relative gain/loss of perfor-
mance with respect to the overall results. . . . . . . . . . . . . . . 129
5.1 Experimental protocol. . . . . . . . . . . . . . . . . . . . . . . . . . . 140
5.2 Biometric traits and biometric devices considered for the ex-
periments. . . . . . . . . . . . . . . . . . . . . . . . . . . . . . . . . . . 141
5.3 Reference systems and quality measures used in the experiments.141
5.4 Data format and possible mixtures for each access (the query
sensors are specified, all templates acquired with the high res-
olution face camera and the flat fingerprint sensor). . . . . . . . 142
5.5 Quality feature combination for the estimation of the device
used for the query acquisition. . . . . . . . . . . . . . . . . . . . . . 148
5.6 Verification results of the fusion in terms of EER (%) for the
four different mixtures defined in Table 5.4 on the evaluation
set. The relative EER increase with respect to the best modal-
ity involved (see Figure 5.2) is also given in brackets. . . . . . . 152
xxvi
LIST OF TABLES
5.7 Effects on the performance of the proposed log-likelihood sum
fusion on the different mixtures defined in Table 5.4 in terms
of EER as scores with quality value lower than the predefined
thresholds are not considered in the fusion. Results are shown
by either discarding face or fingerprint scores, together with the
resulting relative EER increase in brackets (reference results
without quality-based score rejection are shown in Table 5.6,
fifth column). Threshold values are selected on the basis of
Figures 5.7 and 5.8. . . . . . . . . . . . . . . . . . . . . . . . . . . . . 156
5.8 Verification results of the fusion on the mixtures defined in
Table 5.2 in terms of EER (%) for the evaluation set incorpo-
rating quality information in the fusion stage (without device
estimation). The relative EER increase as a result of quality
incorporation is also shown (in brackets). . . . . . . . . . . . . . . 158
xxvii

LIST OF TABLES
xxviii
Chapter 1
Introduction
This PhD Thesis is focused on biometric sample quality assessment, and its ap-
plication in multimodal biometric systems. In particular, this PhD Thesis explores the
quality assessment problem in two traits: fingerprints and signature images. Contrar-
ily to fingerprint images, where we can objectively define quality, in behavioral traits
like signature it is not straightforward to define what quality is. We also explore the
incorporation of quality information in multibiometric systems, showing the benefits of
adapting the system to the quality of the sample at hand.
Every human being has experience in recognizing a familiar person based on his/her
specific characteristics, like voice, face, gait, handwriting, signature and so on. Some
people, more than others, have even the ability to recognize unknown persons, after
having seen or heard them. Nowadays, due to the expansion of the networked society,
there as increasing need for reliable personal identification by automatic means. Estab-
lishing the identity of individuals is recognized as fundamental not only in numerous
governmental, legal or forensic operations, but also in a large number of civilian ap-
plications. This has resulted in the establishment of a new research and technology
area known as biometric recognition, or simply biometrics (Jain et al., 2006). The
term “biometrics” refers to automatic recognition of an individual based on behavioral
and/or anatomical characteristics (e.g., fingerprints, face, iris, voice, signature, etc.).
The difficulties associated with person identification and individualization were al-
ready highlighted by the pioneers of forensic sciences. Alphonse Bertillon developed in
the eighteenth century an anthropometric identification approach, based on the measure
of physical characteristics of a person (Bertillon, 1893). Automatic person authentica-
tion has been a subject of study for more than thirty five years (Atal, 1976; Kanade,
1973), although it has not been until the last decade when biometric research has been
1

1. INTRODUCTION
established as an specific research area (Bolle et al., 2004; Jain et al., 1999, 2008; Li
and Jain, 2004; Maltoni et al., 2003; Nanavati et al., 2002; Ratha and Bolle, 2004;
Ross et al., 2006; Wayman et al., 2005; Zhang, 2002). In order to provide certain ser-
vices, a variety of applications require reliable confirmation of a person’s identity by
recognizing an individual. The increasing interest of biometrics in the last years is also
evidenced by efforts focused on the organization of specific conferences (AVBPA, 2005;
BTAS, 2007; ICB, 2007; ICBA, 2004; SPIE-BTHI, 2008), several cooperative interna-
tional projects (BioSec, 2004; BioSecure, 2004; COST-2101, 2006; COST-275, 2003),
the standardization in the field of biometrics (BioAPI, 1998; CBEFF, 2001; INCITS
M1, 2007; ISO/IEC JTC1 SC37, 2002) and the development of common benchmark
tools and evaluation campaigns for biometric systems (BMEC, 2007; FpVTE, 2003;
FRVT, 2006; FVC2006, 2006; ICE, 2006; Mansfield and Wayman, 2002; NIST SRE,
2006; SVC, 2004; Wayman et al., 2005). There has been also in the last years an increas-
ing institutional interest from government (DoD, 2007), industry (IBG, 2007), research
bodies (NIST-ITL, 2007) and the establishment of international consortia dedicated
specifically to biometric recognition (BC, 2005; EBF, 2003).
This introductory chapter presents the basics of biometric systems, including prop-
erties, common performance measures and the combination of multiple sources of bio-
metric information into a multibiometric system. We also outline the topic of biometric
quality assessment, from which the motivation of this Thesis is also derived. We finish
the chapter by stating the Thesis, giving an outline of the Dissertation, and summariz-
ing the research contributions originated from this work.
Although no special background is required for this chapter, the reader will benefit
from introductory reading in biometrics as Jain et al. (2006, 2004b). A deeper reference
is Jain et al. (2008).
1.1 Biometric systems
A biometric system essentially makes use of behavioral or anatomical characteristics
to recognize individuals by means of pattern recognition techniques and statistical
methods. Biometric systems are used nowadays in many government and civilian ap-
plications, offering greater convenience and several advantages over traditional security
methods based on something that you know (normally a secret password or PIN, which
can be shared, forgotten or copied) or something that you have (a physical object that
is presented to receive access, such as keys, magnetic cards, identity documents, etc.,
which can be shared, stolen, copied or lost). Without sophisticated means, biometrics
2

1.1 Biometric systems
are difficult to share, steal or forge and cannot be forgotten or lost. Therefore, this
latter solution provides a higher security level in identity prove. In addition, the com-
bination of possession and knowledge with biometrics makes the identity proof even
more secure.
Such a system involves four aspects (Jain et al., 2000): data acquisition and pre-
processing, feature extraction, similarity computation and decision-making. The digital
representation recorded in the system database, which describes the characteristics or
features of a physical trait, is defined as a template. It is obtained by a feature extrac-
tion algorithm, and is generated through an enrolment or training process, which is
depicted in Figure 1.1 (top). The recognition process can be performed in two modes
by a biometric system (Jain et al., 2008):
• Identification. In this mode, the correct identity of an unknown person is
selected from the database of registered identities. It is called a “one to many”
matching process, because the system is asked to complete a comparison between
the persons biometrics and all the biometric templates stored in the database
(Figure 1.1, middle). The system can take either the “best” match, or it can
score the possible matches, and rank them in order of similarity. Two modes of
identification are possible, positive and negative. The positive identification tends
to determine if a given person is really in a specific database, whereas a negative
identification determines if a given person is not in a “watchlist” database.
• Verification. This mode consists in verifying whether a person is who he or she
claims to be. It is called a “one to one” matching process, as the system has
to complete a comparison between the person’s biometric and only one chosen
template stored in the database (Figure 1.1, bottom). Such a method is applied
when the goal is to secure and restrict specific accesses with obviously cooperative
users.
This Thesis is focused on biometric verification (also called authentication). In
this mode, the clients or targets are known to the system (through the enrolment
process), whereas the impostors can potentially be the world population. The result
of the comparison between the biometric sample X provided by the user and his/her
claimed identity T is a similarity score s, which can be further normalized to sn before
comparing it to a decision threshold. If the score is higher than the decision threshold,
then the claim is accepted, otherwise the claim is rejected.
Depending on the biometric trait used by the system, impostors may know infor-
mation about the client that lowers verification performance when it is exploited (e.g.
3
1. INTRODUCTION
FeatureExtraction
Biometricsample
EnrolledTemplates
Identity
orRejected
X
T
ENROLLMENT
FeatureExtraction
Biometricsample
EnrolledTemplates
Identity claim
SimilarityScore
Normaliza-DECISION
THRESHOLD
Accepted orRejected
Prepro-cessing
X
T
s sntion
VERIFICATION
Prepro-cessing
FeatureExtraction
Biometricsample
Identity claim
“Best” match or
N-ranked identitiesPrepro-cessing
X
IDENTIFICATION
Enrolled
Template N SimilaritysN
Enrolled
Template 1 Similaritys1
Enrolled
Template 2 Similaritys2
....
....
....
FeatureExtraction
Biometricsample
EnrolledTemplates
Identity
orRejected
X
T
ENROLLMENT
FeatureExtraction
Biometricsample
EnrolledTemplates
Identity claim
SimilarityScore
Normaliza-DECISION
THRESHOLD
AcceptedAcc orRejected
Prepro-cessing
X
T
s sn
stion
VERIFICATION
Prepro-cessing
FeatureExtraction
Biometricsample
Identity claim
“Best” match or
N-ranked identitiesPrepro-cessing
X
IDENTIFICATION
Enrolled
Template N SimilaritysNss
Enrolled
Template 1 Similaritys1ss
Enrolled
Template 2 Similaritys2ss
....
....
....
Figure 1.1: System model of biometric authentication.
signature shape in signature verification). As a result, two kinds of impostor are usu-
ally considered, namely: i) casual impostors (producing random forgeries in case of
signature recognition), when no information about the target user is known, and ii)
real impostors (producing skilled forgeries in the case of signature recognition), when
some information regarding the biometric trait being forged is used.
Biometric traits can be classified into anatomical and behavioral traits (Jain et al.,
2006). Examples of anatomical traits are: iris, fingerprint, hand, retinal scan, DNA, etc.
and examples of behavioral traits are: speech, signature, handwriting, etc. Anatomical
characteristics can be measured on a part of the body at some point in time (passive),
and are always present. On the other hand, behavioral characteristics are learned or
acquired over time (active) and are produced with a special effort, requiring a “realiza-
tion” (e.g. a signature realization or a voice utterance). Hence, they are dependent to
some degree on the individual’s state of mind. Because of that, anatomical traits show
less time variability than behavioral traits. Voice biometric is viewed as a combination
4
1.1 Biometric systems
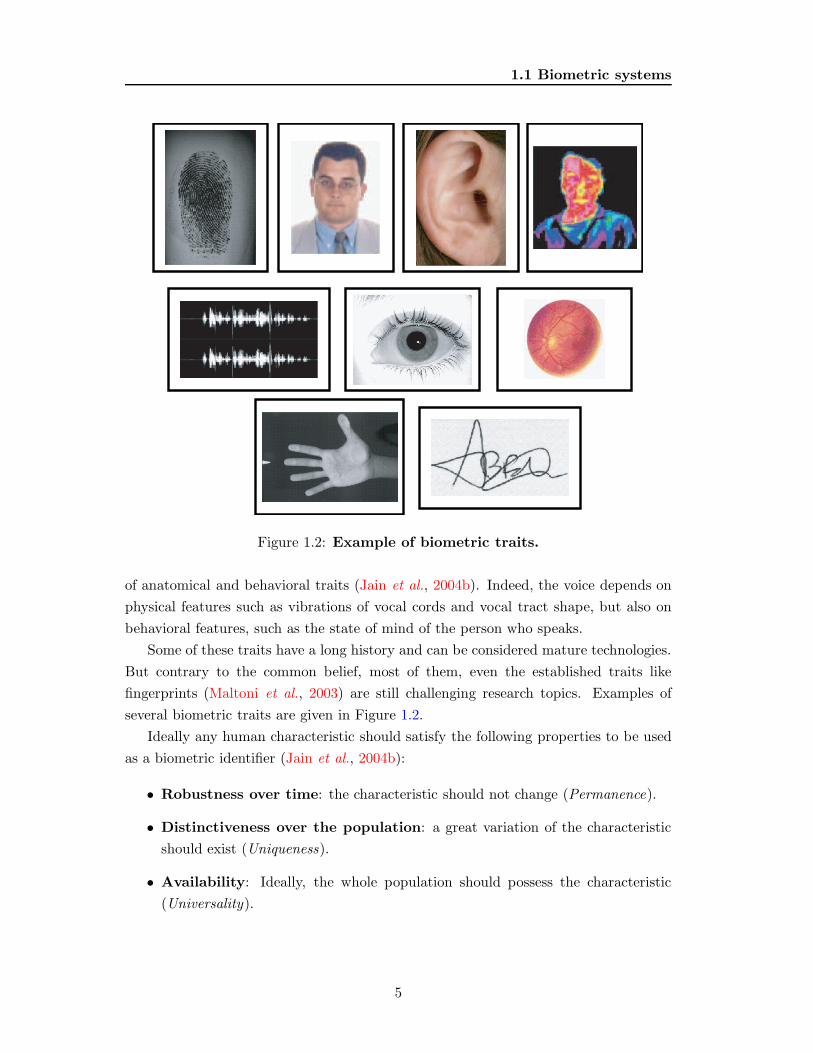
Figure 1.2: Example of biometric traits.
of anatomical and behavioral traits (Jain et al., 2004b). Indeed, the voice depends on
physical features such as vibrations of vocal cords and vocal tract shape, but also on
behavioral features, such as the state of mind of the person who speaks.
Some of these traits have a long history and can be considered mature technologies.
But contrary to the common belief, most of them, even the established traits like
fingerprints (Maltoni et al., 2003) are still challenging research topics. Examples of
several biometric traits are given in Figure 1.2.
Ideally any human characteristic should satisfy the following properties to be used
as a biometric identifier (Jain et al., 2004b):
• Robustness over time: the characteristic should not change (Permanence).
• Distinctiveness over the population: a great variation of the characteristic
should exist (Uniqueness).
• Availability: Ideally, the whole population should possess the characteristic
(Universality).
5

1. INTRODUCTION
• Accessibility: The characteristic should be easy to acquire (Collectability).
Besides these basic properties, some additional properties have to be considered in
the context of a biometric system:
• Performance, which refers to all the factors that influence and affect the accu-
racy, efficiency, robustness, computational speed and resource requirements of a
biometric system.
• Acceptability: The population should accept the fact that the characteristic is
taken from them.
• Circumvention, which refers to the ability of a system to resist against potential
threats and spoof attacks.
• Exception handling, which has to do with the ability to complete a manual
matching process in the case of an impossibility of feature extraction and modality
use for certain persons.
• System cost, which refers to all the costs of the system components, in adequate
and normal use.
A practical biometric system should meet the specified recognition accuracy, speed,
and resource requirements, be harmless to the users, be accepted by the intended
population, and be sufficiently robust to various fraudulent methods and attacks to
the system. Unfortunately, none single biometric satisfies all the above mentioned
properties. While some biometrics have easy and friendly collectability (e.g. face or
voice), their distinctiveness is low. Other biometrics with high distinctiveness are not
easy to acquire (e.g. iris).
1.2 Multibiometric systems
In multibiometric systems, multiple sources of biometric information are combined with
the purpose of overcoming some of the limitations shown by unibiometric systems (Ross
et al., 2006). Using a single trait for recognition is often affected by practical problems
like:
1. Noise in sensed data due to imperfect or variable acquisition conditions, resulting
in individuals being incorrectly rejected by the system.
6
1.2 Multibiometric systems
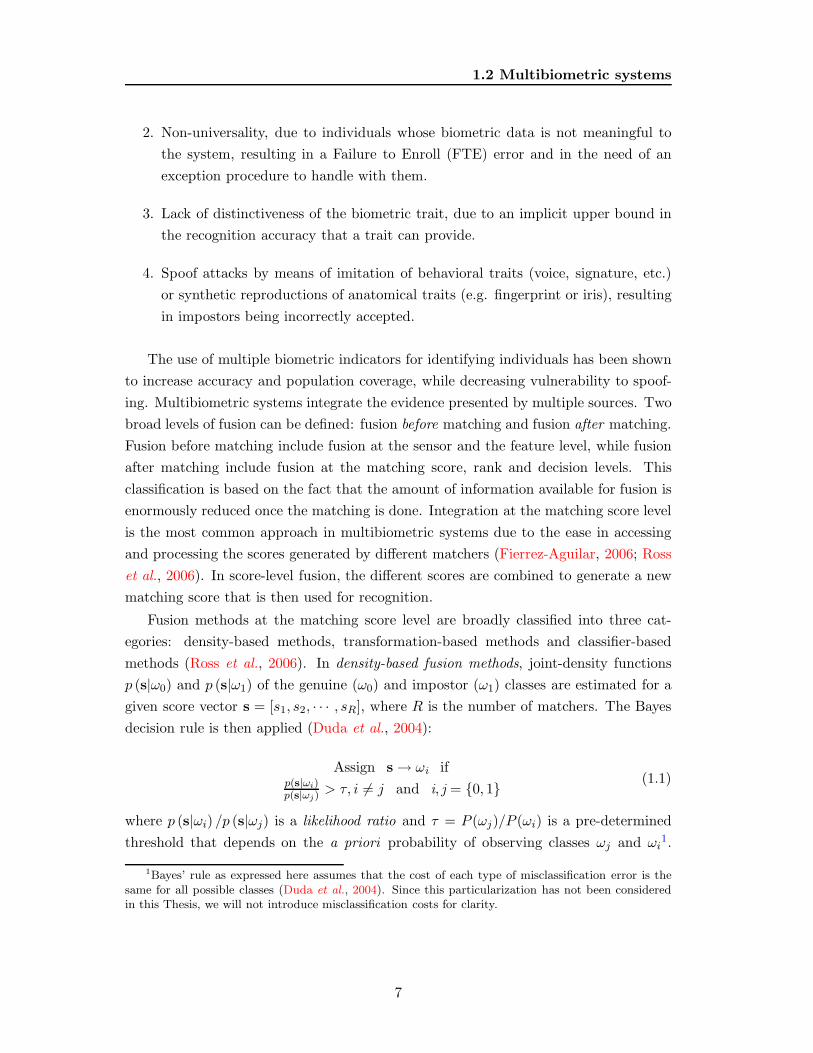
2. Non-universality, due to individuals whose biometric data is not meaningful to
the system, resulting in a Failure to Enroll (FTE) error and in the need of an
exception procedure to handle with them.
3. Lack of distinctiveness of the biometric trait, due to an implicit upper bound in
the recognition accuracy that a trait can provide.
4. Spoof attacks by means of imitation of behavioral traits (voice, signature, etc.)
or synthetic reproductions of anatomical traits (e.g. fingerprint or iris), resulting
in impostors being incorrectly accepted.
The use of multiple biometric indicators for identifying individuals has been shown
to increase accuracy and population coverage, while decreasing vulnerability to spoof-
ing. Multibiometric systems integrate the evidence presented by multiple sources. Two
broad levels of fusion can be defined: fusion before matching and fusion after matching.
Fusion before matching include fusion at the sensor and the feature level, while fusion
after matching include fusion at the matching score, rank and decision levels. This
classification is based on the fact that the amount of information available for fusion is
enormously reduced once the matching is done. Integration at the matching score level
is the most common approach in multibiometric systems due to the ease in accessing
and processing the scores generated by different matchers (Fierrez-Aguilar, 2006; Ross
et al., 2006). In score-level fusion, the different scores are combined to generate a new
matching score that is then used for recognition.
Fusion methods at the matching score level are broadly classified into three cat-
egories: density-based methods, transformation-based methods and classifier-based
methods (Ross et al., 2006). In density-based fusion methods, joint-density functions
p (s|ω0) and p (s|ω1) of the genuine (ω0) and impostor (ω1) classes are estimated for a
given score vector s = [s1, s2, · · · , sR], where R is the number of matchers. The Bayes
decision rule is then applied (Duda et al., 2004):
Assign s → ωi ifp(s|ωi)p(s|ωj)
> τ, i 6= j and i, j = {0, 1} (1.1)
where p (s|ωi) /p (s|ωj) is a likelihood ratio and τ = P (ωj)/P (ωi) is a pre-determined
threshold that depends on the a priori probability of observing classes ωj and ωi1.
1Bayes’ rule as expressed here assumes that the cost of each type of misclassification error is thesame for all possible classes (Duda et al., 2004). Since this particularization has not been consideredin this Thesis, we will not introduce misclassification costs for clarity.
7

1. INTRODUCTION
Estimation of the density p (s|ωi) is done from a training set of matching score vec-
tors using parametric or non-parametric techniques. Several approaches following this
method have been proposed in the literature (Dass et al., 2005; Kittler et al., 1998; Ross
et al., 2006). In order to accurately estimate the density functions, a large number of
training samples is usually needed, especially if the dimensionality of the vector s is
large. In transformation-based fusion methods, matching scores are directly combined
using simple fusion operators (such as the sum of scores, the maximum/minimum, etc.)
(Kittler et al., 1998). In this case, a normalization process is needed to transform the
different matching scores into a common domain (Jain et al., 2005). Classifier-based fu-
sion methods use the matching scores from the multiple matchers as input to a trained
pattern classifier (Duda et al., 2004) in order to determine the class label (genuine or
impostor), instead of giving an scalar value. In this case, the scores usually do not
need to be transformed into a common domain prior to the classification, and a large
number of training samples is also often needed to compute the parameters of the clas-
sifier. Several classifiers have been used in the biometric literature to combine scores
from different matchers: hyper BF networks (Brunelli and Falavigna, 1995), k-Nearest
Neighbors (Verlinde and Chollet, 1999), decision trees (Ben-Yacoub et al., 1999; Ross
and Jain, 2003; Verlinde and Chollet, 1999), linear logistic regression (Verlinde and
Chollet, 1999), k-means and fuzzy clustering (Chatzis et al., 1999), Support Vector Ma-
chines (SVM) (Ben-Yacoub et al., 1999; Fierrez-Aguilar et al., 2005a,e; Garcia-Romero
et al., 2003), multilayer perceptrons (Ben-Yacoub et al., 1999), Fisher discriminants
(Ben-Yacoub et al., 1999; Wang et al., 2003), Bayesian classifiers (Ben-Yacoub et al.,
1999; Bigun et al., 1997) and neural networks (Wang et al., 2003).
1.3 Quality information in biometric systems
Quality assessment algorithms have been developed mainly for fingerprint images (Alonso-
Fernandez et al., 2007c) and recently, for iris (Chen et al., 2006a; Kalka et al., 2005),
voice, (Garcia-Romero et al., 2006; Richiardi and Drygajlo, 2008; Richiardi et al., 2007),
face (Kryszczuk and Drygajlo, 2007) and signature signals (Alonso-Fernandez et al.,
2007a; Muller and Henniger, 2007). In many of these works, it is demonstrated that the
performance of a biometric system is heavily affected by the quality of biometric signals.
Biometric quality assessment is an active field of research in recent years (BQW, 2007;
Grother and Tabassi, 2007) and even the best verification systems worldwide struggle in
the presence of noisy images, as demonstrated in the series of International Fingerprint
Verification Competitions, FVC (Cappelli et al., 2006b). The series of FVC competi-
8

1.3 Quality information in biometric systems
tions have been organized biannually since 2000 by the Biometrics Systems Laboratory
of Bologna University, the Pattern Recognition and Image Processing Laboratory of
Michigan State University, the Biometric Test Center of San Jose State University and,
more specifically, in FVC2006 also by the ATVS/Biometric Recognition Group of the
Universidad Autonoma de Madrid. In the first competition FVC2000, data consisted
of fingerprint images acquired without any special restrictions, and the best system
obtained an average Equal Error Rate (EER) of 1.73%. In the 2002 edition, data were
also acquired without special restrictions, and average error rates decreased signifi-
cantly (0.19% EER for the best system). In some sense, these results demonstrated
the maturity of fingerprint verification systems. But in the 2004 edition, image qual-
ity of the acquired data was artificially corrupted by using an acquisition procedure
with exaggerated plastic distortions, artificial dryness and moistness. Surprisingly, the
results of FVC2004 were much worse even than those in FVC2000 (an average EER
of 2.07% for the best system), thus demonstrating that degradation of quality has a
severe impact on the recognition rates.
Recent efforts have also been focused on the standardization of biometric quality
information and its incorporation to biometric data structures (Benini, 2007; Benini
and et al, 2003, 2006). There are a number of roles regarding a quality measure in
the context of biometric systems (Benini, 2007; Grother and Tabassi, 2007): i) qual-
ity algorithms may be used as a monitoring tool (Ko and Krishnan, 2004) in order
to accumulate relevant statistics of the system (e.g. to identify sources experiencing
problems and submitting poor quality samples); ii) quality of enrolment templates
and/or samples acquired during an access transaction can be controlled by acquiring
until satisfaction (recapture); and iii) some of the steps of the recognition system can
be adjusted based on the estimated quality (quality-based conditional processing).
A number of recent works have followed this last direction. The algorithm pro-
posed by Fronthaler et al. (2008) discards unreliable fingerprint regions from the score
decision. Chen et al. (2005) proposed a fingerprint matching algorithm in which high
quality minutiae contribute more to the computation of the matching score. Quality
measures are used as weights for matching distances of an iris recognition system by
Chen et al. (2006a). Alonso-Fernandez et al. (2007c) studied the effect of rejecting
low quality samples using a selection of fingerprint quality estimation algorithms and
a database acquired with three sensors of different technology. Several works have
also taken into account how differences among fingerprint capture devices impact on
the quality measure computation (Alonso-Fernandez et al., 2008; Grother et al., 2005;
Kang et al., 2003; Sickler and Elliott, 2005).
9

1. INTRODUCTION
Quality information has also been incorporated in a number of multimodal fusion
approaches. Garcia-Romero et al. (2006) adapted the standard SVM fusion approach
to take into account the quality information of speech signals. Fierrez-Aguilar et al.
(2006) used an adaptive score-level fusion approach which exploits differences in be-
havior of two fingerprint matchers as image quality varies, which can be seen as a
particular example of their more general quality-based fusion approach presented in
Fierrez-Aguilar et al. (2005e). Nandakumar et al. (2006) proposed a likelihood ratio-
based fusion scheme that takes into account the quality of the biometric samples when
estimating the joint densities of the genuine and impostor classes. A novel device-
specific quality-dependent score normalization technique is presented by Poh et al.
(2007). Fronthaler et al. (2008) introduced a Bayesian-adaptive cascaded scheme that
dynamically switches on different matchers in case of low quality and adapts fusion pa-
rameters based on past performance of the matchers. Finally, Kryszczuk and Drygajlo
(2008) presented a theoretical framework of credence estimation and error prediction
in multibiometric systems, showing how erroneous classification decisions are better
handled using quality measures.
1.4 Performance evaluation of biometric systems
In first research works on biometrics conducted over three decades ago, it was common
to evaluate biometric products on small custom or proprietary datasets (Atal, 1976;
Kanade, 1973) and therefore, experiments were not repeatable and a comparative as-
sessment could not be accomplished. As biometric systems are being deployed, joint
efforts have been conducted to perform common experimental protocols and technology
benchmarks. Several evaluation procedures (Mansfield and Wayman, 2002), databases
and competitions have been settled in the last years, e.g. the NIST Speaker Recognition
Evaluations (NIST SRE, 2006), the FERET and FRVT Face Recognition Evaluations
(FRVT, 2006), the series of Fingerprint Verification Competitions (FVC) (FVC2006,
2006), the Iris Challenge Evaluation (ICE) (ICE, 2006) or the Signature Verification
Competition (SVC) (SVC, 2004).
Different rates can be used to quantify the different properties of biometric systems
described in Section 1.1. In this Thesis, we concentrate on performance indicators to
compare different systems, and more specifically on the accuracy of the authentication
process. We do not consider other performance indicators that are strongly related to
particular implementations and hardware/software architectures, as the computational
efficiency, resources, speed, etc.
10

1.4 Performance evaluation of biometric systems
Figure 1.3: Example of verification performance comparison with ROC (left)and DET (right) curves.
Biometric authentication can be considered as a detection task, involving a tradeoff
between two types of errors (Ortega-Garcia et al., 2004): i) Type I error, also named
False Rejection Rate (FRR) or miss (detection), occurring when a client, target, genuine
or authorized user is rejected by the system, and ii) Type II error, known as False
Acceptance Rate (FAR) or false alarm, taking place when an unauthorized or impostor
user is accepted as being a true user. Although each type of error can be computed
for a given decision threshold, a single performance level is inadequate to represent
the full capabilities of the system and, as such a system has many possible operating
points, it is best represented by a complete performance curve. These total performance
capabilities have been traditionally shown in form of ROC (Receiver - or also Relative -
Operating Characteristic) plot, in which FAR versus FRR is depicted for all the possible
decision thresholds. A variant of the ROC curve, the so-called DET (Detection Error
Tradeoff) plot, is used in this work (Martin et al., 1997). In the DET curve, the use of a
normal deviate scale makes the comparison of competing systems easier. A comparison
between ROC and DET curves for two hypothetical competing verification systems A
and B is given in Figure 1.3.
A specific point is attained when FAR and FRR coincide, the so-called EER (Equal
Error Rate). The global EER of a system can be easily detected by the intersection
between the DET curve of the system and the diagonal line y = x. Nevertheless,
and because of the step-like nature of FAR and FRR plots, EER calculation may be
ambiguous according to the above-mentioned definition, so an operational procedure
11
1. INTRODUCTION
for computing the EER must be followed. In this work, the procedure for computing
the EER described by Maio et al. (2002) has been applied.
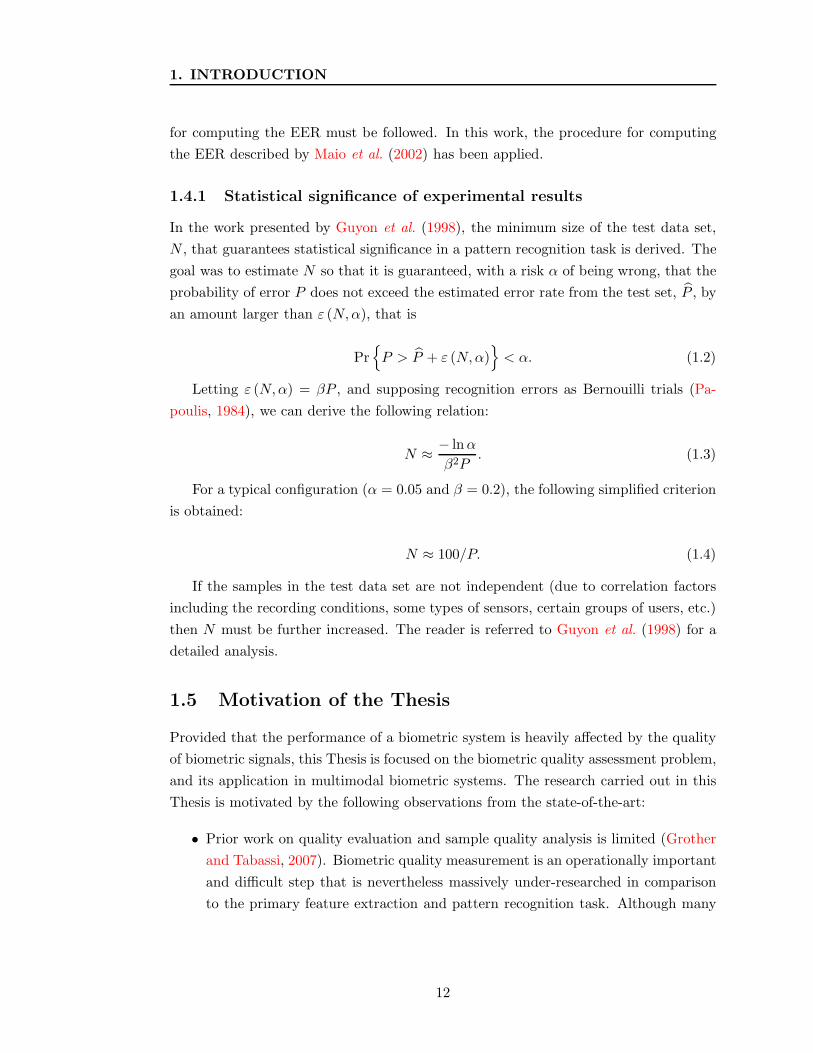
1.4.1 Statistical significance of experimental results
In the work presented by Guyon et al. (1998), the minimum size of the test data set,
N , that guarantees statistical significance in a pattern recognition task is derived. The
goal was to estimate N so that it is guaranteed, with a risk α of being wrong, that the
probability of error P does not exceed the estimated error rate from the test set, P , by
an amount larger than ε (N,α), that is
Pr{
P > P + ε (N,α)}
< α. (1.2)
Letting ε (N,α) = βP , and supposing recognition errors as Bernouilli trials (Pa-
poulis, 1984), we can derive the following relation:
N ≈ − ln α
β2P. (1.3)
For a typical configuration (α = 0.05 and β = 0.2), the following simplified criterion
is obtained:
N ≈ 100/P. (1.4)
If the samples in the test data set are not independent (due to correlation factors
including the recording conditions, some types of sensors, certain groups of users, etc.)
then N must be further increased. The reader is referred to Guyon et al. (1998) for a
detailed analysis.
1.5 Motivation of the Thesis
Provided that the performance of a biometric system is heavily affected by the quality
of biometric signals, this Thesis is focused on the biometric quality assessment problem,
and its application in multimodal biometric systems. The research carried out in this
Thesis is motivated by the following observations from the state-of-the-art:
• Prior work on quality evaluation and sample quality analysis is limited (Grother
and Tabassi, 2007). Biometric quality measurement is an operationally important
and difficult step that is nevertheless massively under-researched in comparison
to the primary feature extraction and pattern recognition task. Although many
12
1.5 Motivation of the Thesis
quality assessment algorithms have been developed, mainly for fingerprint images,
they have been tested under limited and heterogenous frameworks. It has not been
until the last years when the concept of sample quality has been formalized and a
framework for evaluating biometric quality measures has been proposed (Grother
and Tabassi, 2007; Youmaran and Adler, 2006). Thus, there are no comparative
studies of biometric quality algorithms under a common framework, using the
same dataset and the same protocol.
• Previous studies have shown that the performance of biometric systems is heavily
affected by the quality of biometric signals. For the case of fingerprints, the two
most popular approaches for fingerprint recognition are found to behave differ-
ently as image quality varies (Fierrez-Aguilar et al., 2006). Some works have also
taken into account how differences among fingerprint capture devices impact on
the quality measure computation (Grother et al., 2005; Kang et al., 2003; Sickler
and Elliott, 2005). However, results are based on an specific quality assessment
algorithm and/or databases acquired with a single sensor. It can be hypothesized
that using other quality assessment algorithms or fingerprint sensors may lead to
different results.
• In behavioral biometric traits such as signature, it is harder to define what quality
is. There are studies that relate performance with signature complexity or vari-
ability (Allgrove and Fairhurst, 2000; Fierrez-Aguilar et al., 2005d). The effect of
different features extracted automatically from online signatures is also studied
by Muller and Henniger (2007). There are also works focused on speech quality
(Garcia-Romero et al., 2006). However, prior work on sample quality analysis for
behavioral traits is quite limited.
• Additional problems may arise when a biometric device is replaced without re-
acquiring the corresponding template (Poh et al., 2007), or when a biometric tem-
plate is matched against a template generated using a different algorithm (Grother
et al., 2005). These are common interoperability problems, which typically are not
specifically overcome by biometric systems, and thus lower the recognition perfor-
mance, sometimes dramatically (Alonso-Fernandez et al., 2005c, 2006c; Grother
et al., 2005; Ross and Jain, 2004). Unfortunately, as biometric technology is ex-
tensively deployed, it will be a common situation to replace parts of operational
systems as they are damaged or newer designs appear, or to exchange informa-
tion among several applications involving systems developed by different vendors
(Poh et al., 2007). Examples are the necessity of all ePassports issued by each
13
1. INTRODUCTION
country to be readable by readers placed at borders of other countries, or indi-
viduals remotely accessing to a system using their own sensor (e.g. a PDA or
mobile telephone with biometric signal acquisition capabilities).
• Incorporating biometric quality information in multibiometric systems is cur-
rently a research challenge (BMEC, 2007; BQW, 2007). Multibiometric systems
integrate the evidence presented by multiple biometric systems (Jain et al., 2006).
Such systems are more robust to variations in the sample quality as shown in sev-
eral studies (Fierrez-Aguilar et al., 2006; Nandakumar et al., 2006). Incorporation
of quality information in biometric systems can also provide additional improve-
ment (BQW, 2007; Fierrez-Aguilar et al., 2005e; Grother and Tabassi, 2007). For
example, dynamically assigning weights to the outputs of individual matchers
based on the quality of the samples presented at the input (quality-based fusion)
can improve the overall recognition performance. Other works (Chen et al., 2005)
are focused on adapting the steps of the recognition system based on the quality
of the samples (quality-based conditional processing).
These observations will be discussed in Chapter 2, in which the biometric quality
assessment problem is analyzed in depth.
1.6 The Thesis
The Thesis developed in this Dissertation can be stated as follows:
The incorporation of quality information in biometric systems can provide sig-
nificant benefits in their performance. Examples of quality-based approaches
in biometrics include the adaptation of parts of the system to the quality of the
sample at hand, and the reacquisition of samples that do not satisfy certain
quality criteria.
To incorporate quality information in a biometric system, we first should assess
how the system performance is affected by the quality of biometric signals. This task
is addressed in Chapters 3 and 4 for fingerprints and signature, respectively. An exper-
imental study of system adaptation to the quality of biometric signals is carried out in
Chapter 5, in which we propose a multibiometric system architecture generalizable to
biometric systems working with heterogeneous sources of information.
14

1.7 Outline of the Dissertation
1.7 Outline of the Dissertation
The main objectives of this PhD Thesis are as follows:
1. Review and study of the problem of biometric quality analysis.
2. Definition of a framework for evaluating biometric quality measures.
3. Review of existing fingerprint quality assessment algorithms, including the imple-
mentation of a representative set and a comparative evaluation.
4. Review of existing signature quality assessment algorithms, including the proposal
of new quality measures and a comparative evaluation.
5. Incorporation of biometric quality measures in multibiometric systems, including
quality-based fusion and quality-based conditional processing.
This Dissertation is structured according to a traditional complex type (Paltridge,
2002) with literature review, theoretical and practical methods and three experimental
studies in which the methods are applied. The chapter structure is as follows:
• Chapter 1 introduces the topic of biometric systems and gives the motivation,
outline and contributions of this PhD Thesis.
• Chapter 2 summarizes related works and details the motivations for this Thesis
based on these previous works.
• Chapter 3 studies the problem of quality assessment of fingerprint images. The
taxonomy of existing approaches for fingerprint image quality assessment is a
contribution of this PhD Thesis, therefore they will be presented in some detail.
• Chapter 4 studies the problem of quality assessment of signature images. Several
measures to predict the performance of signature systems are proposed as contri-
bution. Also, one of the three verification systems used is a contribution of this
PhD Thesis.
• Chapter 5 conducts a study of system adaptation to the quality of biometric
signals. We contribute with a quality-based multibiometric architecture that is
generalizable to biometric systems working with heterogeneous sources of infor-
mation.
15

1. INTRODUCTION
Chapter 1:“Introduction”
Chapter 2:“Quality measures
Chapter 3:“Fingerprint quality”
Chapter 4:“Signature quality”
Chapter 5:“Quality in multibiometrics”
Chapter 6:“Conclusions”
Preceeding block is requiredPreceeding block is recommended
Introduction, related works, methods,materials, and conclusions
Chapters reporting experimental results
in biometrics”
Figure 1.4: Dependence among Dissertation chapters.
16

1.8 Research contributions
• Chapter 6 concludes the Dissertation summarizing the main results obtained and
outlining future research lines.
The dependence among the chapters is illustrated in Figure 1.4. In order to properly
follow the experimental chapters, a background in biometric systems and multibiomet-
rics is desirable. We refer the reader to introductory readings in these topics (Jain and
Ross, 2004; Jain et al., 2006, 2004b). For a deeper view, we refer to Jain et al. (2008);
Ross et al. (2006).
Some methods developed in this PhD Thesis are strongly based on popular ap-
proaches from the pattern recognition literature. The reader is referred to standard
texts for a background on the topic (Duda et al., 2004; Jain et al., 2000; Theodoridis
and Koutroumbas, 2003). Chapters 3 and 4 assume a knowledge of the fundamentals
of image processing (Gonzalez and Woods, 2002). Chapter 3 also assumes knowledge
of the fundamentals of computer vision (Bigun, 2006).
1.8 Research contributions
The research contributions of this PhD Thesis are the following (some publications
appear in several items of the list):
• Literature reviews.
1. A taxonomy of fingerprint image quality assessment algorithms (Alonso-
Fernandez et al., 2007c, 2005b).
2. State of the art in fingerprint verification (Alonso-Fernandez et al., 2008a).
• Novel methods.
1. Novel methods for signature quality assessment and performance prediction
(Alonso-Fernandez et al., 2007a,b).
2. Novel methods for quality-based multimodal verification generalizable to
biometric systems working with multiple sources of information (Alonso-
Fernandez et al., 2008b).
• New biometric systems.
1. A new off-line signature verification system based on contour features (Gilperez
et al., 2008), developed jointly with Pecharroman-Balbas (2007).
17
1. INTRODUCTION
• New experimental studies.
1. Comparative evaluation of fingerprint quality measures depending on sensor
technology using a minutiae- and a ridge-based matcher (Alonso-Fernandez
et al., 2007c, 2008; Fierrez-Aguilar et al., 2005b).
2. Evaluation of impact of signature legibility and signature type in the per-
formance of three off-line signature verification systems (Alonso-Fernandez
et al., 2007b).
3. Evaluation of performance of off-line signature verification systems in terms
of two new proposed measures aimed to estimate signature stability/variability
(Alonso-Fernandez et al., 2007a).
4. Study of combination of different contour features for off-line signature ver-
ification (Gilperez et al., 2008).
5. Study of system adaptation to the quality of biometric signals coming from
different sources, including quality-based fusion and quality-based condi-
tional processing (Alonso-Fernandez et al., 2008b).
• New biometric data.
1. A new multimodal database including face, speech, signature, fingerprint,
hand and iris data modalities from more than 650 subjects acquired within
the framework of the BioSecure Network of Excellence (Alonso-Fernandez
et al., 2008b). This new database is unique in its class, in the sense that
it includes three scenarios in which the subjects have been simultaneously
acquired (over the Internet, in an office environment with a PC, and in
indoor/outdoor environments with mobile devices). Part of this database is
used in the experimental section of Chapter 5.
Other research contributions by the author during his PhD studies that fall outside
of the scope of his Ph.D. Thesis include:
• Literature reviews.
1. State of the art in on-line signature verification in the framework of the
BioSecure Network of Excellence (Garcia-Salicetti et al., 2008).
2. Review of fingerprint and signature databases and evaluations (Alonso-Fernandez
and Fierrez, 2008; Garcia-Salicetti et al., 2008).
18
1.8 Research contributions
3. Review of biometrics and its applications (Alonso Fernandez et al., 2008).
• New biometric systems.
1. An iris verification system based on Gabor features, developed jointly with
Tome-Gonzalez (2008).
• New biometric applications.
1. Application of signature verification to portable Tablet PC and PDA devices
(Alonso-Fernandez et al., 2005a, 2006a; Martinez-Diaz et al., 2007).
• Novel methods.
1. New multialgorithm fingerprint adaptive fusion schemes based on image
quality (Fronthaler et al., 2008).
2. New user-dependent score normalization scheme that exploits quality infor-
mation (Alonso-Fernandez et al., 2006b).
• New experimental studies.
1. Multi-algorithm fingerprint and signature verification in the framework of
the BioSecure Network of Excellence (Alonso-Fernandez et al., 2008a, 2007d;
Garcia-Salicetti et al., 2007, 2008).
2. Study of the capability of fingerprint quality measures to discriminate be-
tween images of different quality (Alonso-Fernandez et al., 2005b, 2007e,
2008).
3. Attacks to fingerprint recognition systems (Galbally-Herrero et al., 2006;
Martinez-Diaz et al., 2006) and iris recognition systems (Ruiz-Albacete et al.,
2008).
4. Study of sensor interoperability and sensor fusion in fingerprint and on-line
signature verification (Alonso-Fernandez et al., 2005c, 2006c).
5. Study of effects of image quality in the performance of individual users with
a multisensor database on a minutiae-based fingerprint verification approach
(Alonso-Fernandez et al., 2006b).
6. Study of effects of time variability in iris recognition (Tome-Gonzalez et al.,
2008).
19

1. INTRODUCTION
• New biometric data.
1. A new on-line signature database of 53 subjects acquired with Tablet PC
(Alonso-Fernandez et al., 2005a).
2. A new multimodal database including speech, iris, face, signature, finger-
prints, hand and keystroking modalities from 400 subjects acquired within
the framework of the BiosecurID project funded by the Spanish MEC (Gal-
bally et al., 2007).
• Public technical reports.
1. Activities carried out within the BioSecure Network of Excellence, available
at BioSecure (2004): 1) acquisition of a new multimodal database, to be
released soon, activity in which the author has been actively involved (Al-
lano et al., 2007; Ortega-Garcia and Alonso-Fernandez, 2005a; Ortega-Garcia
et al., 2006b,c, 2007), 2) legal issues regarding biometric data (Ortega-Garcia
et al., 2006a), 3) reports on existing biometric databases and tools (Ortega-
Garcia and Alonso-Fernandez, 2005b; Ortega-Garcia et al., 2006d), 4) re-
ports on activities carried out on specific fields of interest for the author
(Veldhuis et al., 2006, 2007).
20

Chapter 2
Quality Measures in Biometric
Systems
Biometric quality measurement is an operationally important step that is nev-
ertheless under-researched in comparison to the primary feature extraction and pattern
recognition task. Recently, quality measurement has emerged in the biometric commu-
nity as an important concern after the poor performance observed in biometric systems
on certain pathological samples (Grother and Tabassi, 2007). There are a number of
factors that can affect the quality of biometric signals, and there are numerous roles
of a quality measure in the context of biometric systems. Standardization bodies are
also developing standards that incorporate quality measures in existing standardized
biometric data storage and exchange formats.
Since 2006, it is celebrated a new Workshop sponsored by the National Institute
of Standards and Technology (NIST) that is dedicated to Biometric Quality Mea-
surements (BQW, 2007). Also, independent evaluations of commercial and research
prototypes conducted during the last decade include in each edition new scenarios and
conditions that are progressively more difficult in nature. We observe that, in many
cases, this results in a performance worsening, and it is not until the next edition that
the algorithms show progress under the new challenging conditions. For instance, in
the 2000 and 2002 editions of the International Fingerprint Verification Competition,
FVC (Cappelli et al., 2006b), the fingerprint samples used were acquired without any
special restriction, resulting in a decrease of one order of magnitude in the error rates
(see Table 2.1). However, in the 2004 edition, fingerprint samples were intentionally
corrupted (e.g. by asking people to exaggeratedly rotate or press the finger against
21
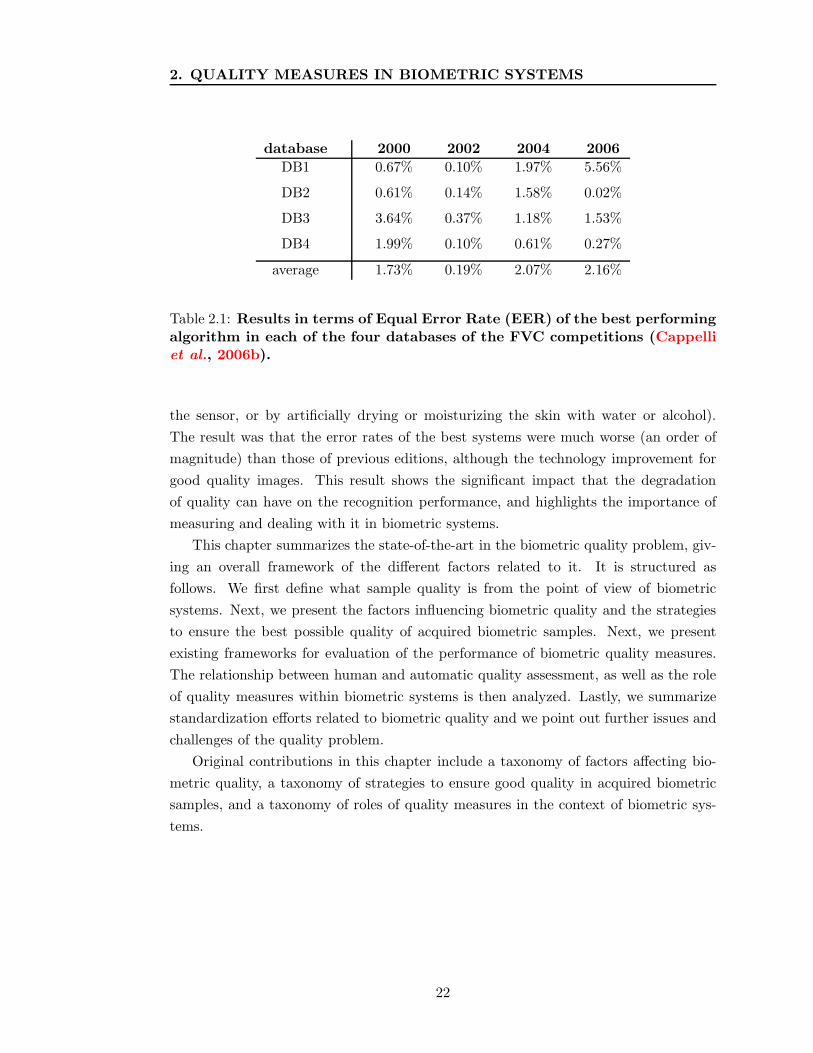
2. QUALITY MEASURES IN BIOMETRIC SYSTEMS
database 2000 2002 2004 2006
DB1 0.67% 0.10% 1.97% 5.56%
DB2 0.61% 0.14% 1.58% 0.02%
DB3 3.64% 0.37% 1.18% 1.53%
DB4 1.99% 0.10% 0.61% 0.27%
average 1.73% 0.19% 2.07% 2.16%
Table 2.1: Results in terms of Equal Error Rate (EER) of the best performingalgorithm in each of the four databases of the FVC competitions (Cappelliet al., 2006b).
the sensor, or by artificially drying or moisturizing the skin with water or alcohol).
The result was that the error rates of the best systems were much worse (an order of
magnitude) than those of previous editions, although the technology improvement for
good quality images. This result shows the significant impact that the degradation
of quality can have on the recognition performance, and highlights the importance of
measuring and dealing with it in biometric systems.
This chapter summarizes the state-of-the-art in the biometric quality problem, giv-
ing an overall framework of the different factors related to it. It is structured as
follows. We first define what sample quality is from the point of view of biometric
systems. Next, we present the factors influencing biometric quality and the strategies
to ensure the best possible quality of acquired biometric samples. Next, we present
existing frameworks for evaluation of the performance of biometric quality measures.
The relationship between human and automatic quality assessment, as well as the role
of quality measures within biometric systems is then analyzed. Lastly, we summarize
standardization efforts related to biometric quality and we point out further issues and
challenges of the quality problem.
Original contributions in this chapter include a taxonomy of factors affecting bio-
metric quality, a taxonomy of strategies to ensure good quality in acquired biometric
samples, and a taxonomy of roles of quality measures in the context of biometric sys-
tems.
22

CHARACTER FIDELITY
Acquisition
fidelityProcessing
fidelity
Extraction
fidelity
Source
Raw
sample
Processed
sample
Feature-based
sample
Storedsamples
Claimed identity System
performance
UTILITY
False Acceptance Rate (in %)
Fa
lse
Re
ject
ion
Ra
te (
in %
)
Similaritycomputation
Acceptanceor
rejection
Properties of
the sourceFaithfulness to the source
Predicted contribution
to performance
Figure 2.1: Definition of biometric quality from three different points of view: character, fidelity or utility.
23

2. QUALITY MEASURES IN BIOMETRIC SYSTEMS
Figure 2.2: Factors affecting the quality of biometric signals.
2.1 Definition of biometric sample quality
It has not been until the last years that there is consensus about what biometric sample
quality is. Broadly, a sample is of good quality if it is suitable for personal recognition.
Recent standardization efforts (Benini and et al, 2006) have established that biometric
sample quality can be considered from three different points of view, see Figure 2.1:
i) character, which refers to the quality attributable to inherent physical features of
the subject; ii) fidelity, which is the degree of similarity between a biometric sample
and its source, attributable to each step through which the sample is processed; and
iii) utility, which refers to the impact of the individual biometric sample on the overall
performance of a biometric system. The character of the sample source and the fidelity
of the processed sample contribute to, or similarly detract from, the utility of the
sample.
It is generally accepted that a quality metric should most importantly mirror the
utility of the sample (Grother and Tabassi, 2007), so that samples assigned higher
quality lead to better identification of individuals. Thus, quality should be predictive
of the recognition performance. This statement, however, is largely subjective: not
24
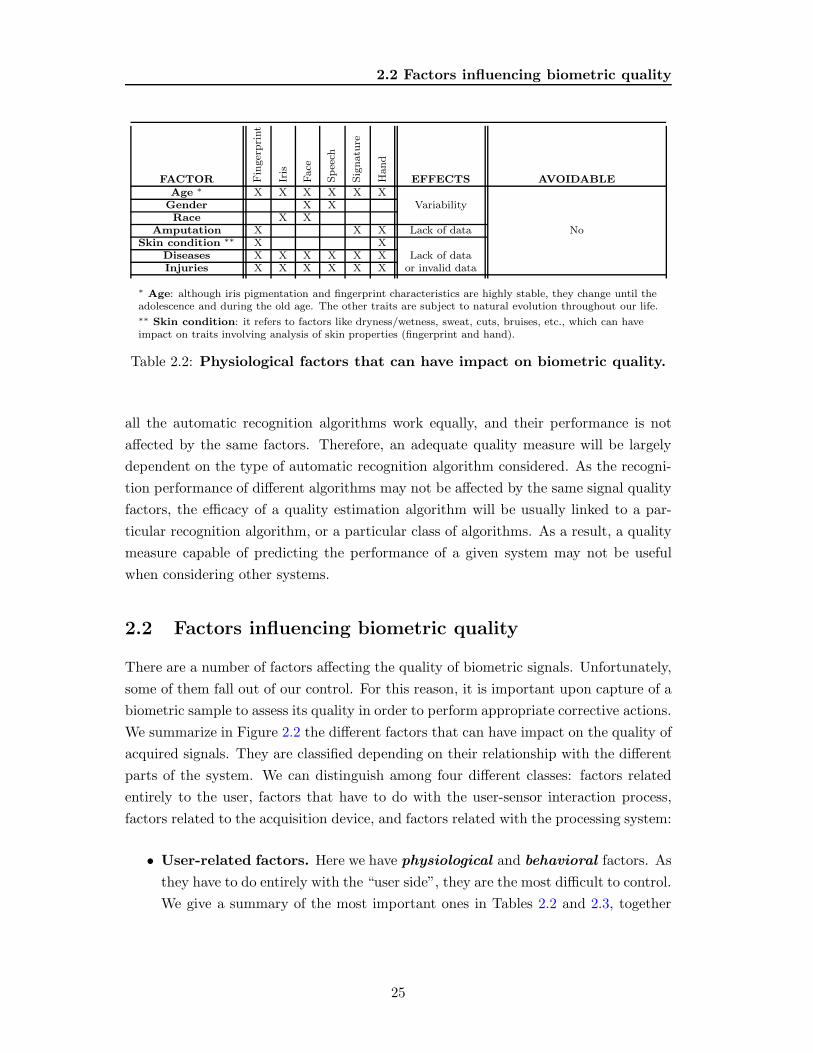
2.2 Factors influencing biometric quality
FACTOR Fin
ger
pri
nt
Iris
Face
Spee
ch
Sig
natu
re
Hand
EFFECTS AVOIDABLEAge ∗ X X X X X X
Gender X X VariabilityRace X X
Amputation X X X Lack of data NoSkin condition ∗∗ X X
Diseases X X X X X X Lack of dataInjuries X X X X X X or invalid data
∗ Age: although iris pigmentation and fingerprint characteristics are highly stable, they change until theadolescence and during the old age. The other traits are subject to natural evolution throughout our life.∗∗ Skin condition: it refers to factors like dryness/wetness, sweat, cuts, bruises, etc., which can haveimpact on traits involving analysis of skin properties (fingerprint and hand).
Table 2.2: Physiological factors that can have impact on biometric quality.
all the automatic recognition algorithms work equally, and their performance is not
affected by the same factors. Therefore, an adequate quality measure will be largely
dependent on the type of automatic recognition algorithm considered. As the recogni-
tion performance of different algorithms may not be affected by the same signal quality
factors, the efficacy of a quality estimation algorithm will be usually linked to a par-
ticular recognition algorithm, or a particular class of algorithms. As a result, a quality
measure capable of predicting the performance of a given system may not be useful
when considering other systems.
2.2 Factors influencing biometric quality
There are a number of factors affecting the quality of biometric signals. Unfortunately,
some of them fall out of our control. For this reason, it is important upon capture of a
biometric sample to assess its quality in order to perform appropriate corrective actions.
We summarize in Figure 2.2 the different factors that can have impact on the quality of
acquired signals. They are classified depending on their relationship with the different
parts of the system. We can distinguish among four different classes: factors related
entirely to the user, factors that have to do with the user-sensor interaction process,
factors related to the acquisition device, and factors related with the processing system:
• User-related factors. Here we have physiological and behavioral factors. As
they have to do entirely with the “user side”, they are the most difficult to control.
We give a summary of the most important ones in Tables 2.2 and 2.3, together
25

2. QUALITY MEASURES IN BIOMETRIC SYSTEMS
FACTOR Fin
ger
pri
nt
Iris
Face
Spee
ch
Sig
natu
re
Hand
EFFECTS AVOIDABLETiredness X X X X X X Difficult
Distraction X X X X X X YesCooperativity X X X X X X Depending onMotivation X X X X X XNervousness X X X X X X the application
Distance X X X Invalid dataFrontalness X X
Blink, eyes closed X X Yes, recapturePressure against sensor X X X
Inconsistent contact X XPose, gaze X XIlliteracy X X Lack of data No
Manual work ∗ X X or invalid dataFacial expression X Yes, recaptureEthnic origin ∗∗ X X X X No
Hairstyle, beard, make-up XClothes X Variability Difficult, except coat/sweater
Hat XJewelry X X X Yes, take off and recapture
Glasses/contact lenses XX Invalid data
∗ Manual work: it may affect the skin condition (dryness, cuts, bruises, dirt, diseases, etc.), in some casesirreversibly.∗∗ Ethnic origin: it affects to iris (pigmentation is different in some ethnic groups), face (physical features,hairstyle, beard, jewelry, etc.), speech (language, lexicon, intonation, etc.) and signature (Americansignatures typically consist of a readable written name, European signatures normally include flourishOriental signatures consist of independent symbols, etc.).
Table 2.3: Behavioral factors that can have impact on biometric quality.
FACTOR Fin
ger
pri
nt
Iris
Face
Spee
ch
Sig
natu
re
Hand
EFFECTS AVOIDABLEIndoor/outdoor X X X X X X Variability (light, noise, skin, sensor)
Background X VariabilityTemperature X X Variability (skin properties)
Humidity X X YesIllumination X X X Variability, invalid data
Light reflection X XAmbient noise X Invalid data
Object occlusion XSeason X X Variability (clothing, skin properties) Yes
Table 2.4: Environmental factors that can have impact on biometric quality.
26
2.2 Factors influencing biometric quality
with an indication of what biometric trait is affected by each one, their effects,
and to what degree we can control them. Notice that most physiological factors
fall out of our control (e.g. age, gender, race, etc.). A number of them do not
necessarily produce degradation on the biometric data, but additional biometric
intra-variability (e.g. face or speech characteristics are different in males and
females, faces change as we grow up, etc.). These additional variability factors,
if not properly considered by the recognition algorithm, may lead to degraded
performance. Other factors, like diseases or injuries, may alter a part of our
body, our skin, our voice, our ability to sign, etc., resulting in invalid data. In
some cases, the alteration may be irreversible, making the affected biometric
trait infeasible for recognition. On the contrary, behavioral factors are easier to
alleviate than physiological ones, although it is not always possible or convenient,
as we would have to modify the people’s behavior or habits. People may not
be motivated to provide their biometric data at a certain moment or for certain
applications. Or they may be tired, distracted or nervous. In other situations,
as for the case of criminals, we expect them to be non-cooperative. Note that
when dealing with many behavioral factors, one solution is just to recapture after
taking corrective actions (e.g. “put off your hat/coat/ring/glasses” or “keep your
eyes opened”), but this is not always possible or appropriate.
• Factors related to the user-sensor interaction. Two types of factors are
included here: environmental and operational , which we summarize respec-
tively in Tables 2.4 and 2.5. In principle, they are easier to control than user-
related factors, although users still play a part in them. For instance, impact of
environmental factors will be low if we can control the environment. The quality
of face images or videos depends on illumination, background, object occlusion,
etc., and fingerprint images are affected by modifications of the properties of the
skin due to humidity or temperature. Also, illumination and light reflections have
great impact on iris images due to the reflective properties of the eye, whereas the
quality of speech is highly dependent of factors affecting background noise. Out-
door operation is specially problematic, as we can lose control on many factors
affecting not only the biometric trait but also the sensor itself: temperature, hu-
midity, weather, noise, illumination, etc. Outdoor operation demands additional
actions to us regarding sensor conditions and its maintenance. Unfortunately, in
certain applications, we cannot control the environment, as in the case of modern
applications that make use of handheld devices with acquisition capabilities of
biometric samples (e.g. PDA, mobile phone, etc.) and/or the Internet.
27

2. QUALITY MEASURES IN BIOMETRIC SYSTEMS
FACTOR Fin
ger
pri
nt
Iris
Face
Spee
ch
Sig
natu
re
Hand
EFFECTS AVOIDABLEUser familiarity X X X Yes
Feedback of acquired data X X X XSupervision by an operator X X X X X X Invalid data,
Sensor cleaning X X variability Depending onPhysical guides ∗ X X X X the applicationErgonomics ∗∗ X X X X X
Time between acquisitions ∗∗∗ X X X X X X Variability
∗ Physical guides: In some cases, they are incorporated in some sensors to facilitate the acquisition (e.g.hand, finger).∗∗ Ergonomics: it refers to how the design of the acquisition device facilitates the interaction with the user.∗∗∗ Time between acquisitions: it is also known as ageing. The biometric data acquired from an individualat two different moments may be very different, having great impact on the system performance.
Table 2.5: Operational factors that can have impact on biometric quality.
As in the case of environmental factors, operational ones (Table 2.5) can be con-
trolled if we have influence on the acquisition act itself. Again, if the acquisition is
not done physically in our premises, we will not be able to provide help or super-
vision to the user, we will not know if the sensor is cleaned periodically, or we will
not be able to guarantee the ergonomics of the acquisition kiosk. An important
factor that has to do with the operation of the system is the time passed between
acquisitions, also known as ageing. There is an intrinsic variability in biometric
data characteristics as time passes, not only in the long-term (e.g. changes of
our face, voice, etc. or differences in the way we interact with the system) but
also in the short-term (e.g. clothes, temporary diseases). The most important
consequence is that biometric data acquired from an individual at two different
moments may be very different. This affects to any biometric trait, although
some of them are more sensitive than others (Jain et al., 2008), as it is the case
of signature, face or voice. Another operational factor that we should consider
is if the user receives feedback of the acquired data via display or similar, which
leads to better acquired samples.
• Factors related to the acquisition sensor. A number of sensor features can
affect the quality of acquired biometric data: its ease of use and maintenance, the
size of its acquisition area, the resolution or the acquisition noise, its reliability
and physical robustness, its dynamic range or the time it needs to acquire a
sample. It is important that these factors be compliant with existing standards,
28
2.3 Ensuring good quality in biometric samples
so we will be able to replace the sensor without degrading the reliability of the
acquisition process. This is specially important, because replacing the sensor is
very common in operational situations as it is damaged or newer designs appear.
Standards compliance also guarantees that we can use different sensors to interact
with the system, as in the case of people with their own personal devices.
• Factors related to the processing system. Here we find the factors that are
easiest to control, which are related to how we process a biometric sample once it
has been acquired by the sensor. Factors affecting here are the data format we use
for exchange or storage and the algorithms we apply for data processing. If there
are storage or exchange speed constraints, we may need to use data compression
techniques, which may degrade the sample or template quality.
As can be seen in Figure 2.2, the user-related factors have impact on the character of
the biometric sample, that is, the quality attributable to the inherent physical features.
In this sense, the control we have on these factors is low, as the inherent features of a
person are difficult or impossible to modify. The remaining factors affect the fidelity,
or in other words, the faithfulness between a biometric sample and its source. Their
degree of control is, as discussed before, higher than user-related factors.
2.3 Ensuring good quality in biometric samples
In the previous section, we have summarized the usual factors affecting the quality of
biometric signals. We will now report some helpful guidelines to control these factors.
For that purpose, we identify three points of action, as it can be observed in Figure 2.3:
i) the capture point, ii) the quality assessment algorithm itself, and iii) the system
that performs the recognition process.
Most of the factors affecting the quality of biometric signals are related with the
“user side”, as we have discussed before. For this reason, there are many things that
can be done at the capture point:
• Supervision of the acquisition by an operator, ensuring that he is well trained,
works in an adequate environment, and has enough time to capture good quality
signals. Note that this is a repetitive task that may cause tiredness, boredom or
lack of motivation in the operator, factors that we must try to control.
• Use of adequate sensors, with enough capabilities for our application (size, reso-
lution, etc.) and with enhanced features allowing the acquisition of bad quality
sources (e.g. touchless fingerprint sensors, 3D cameras).
29
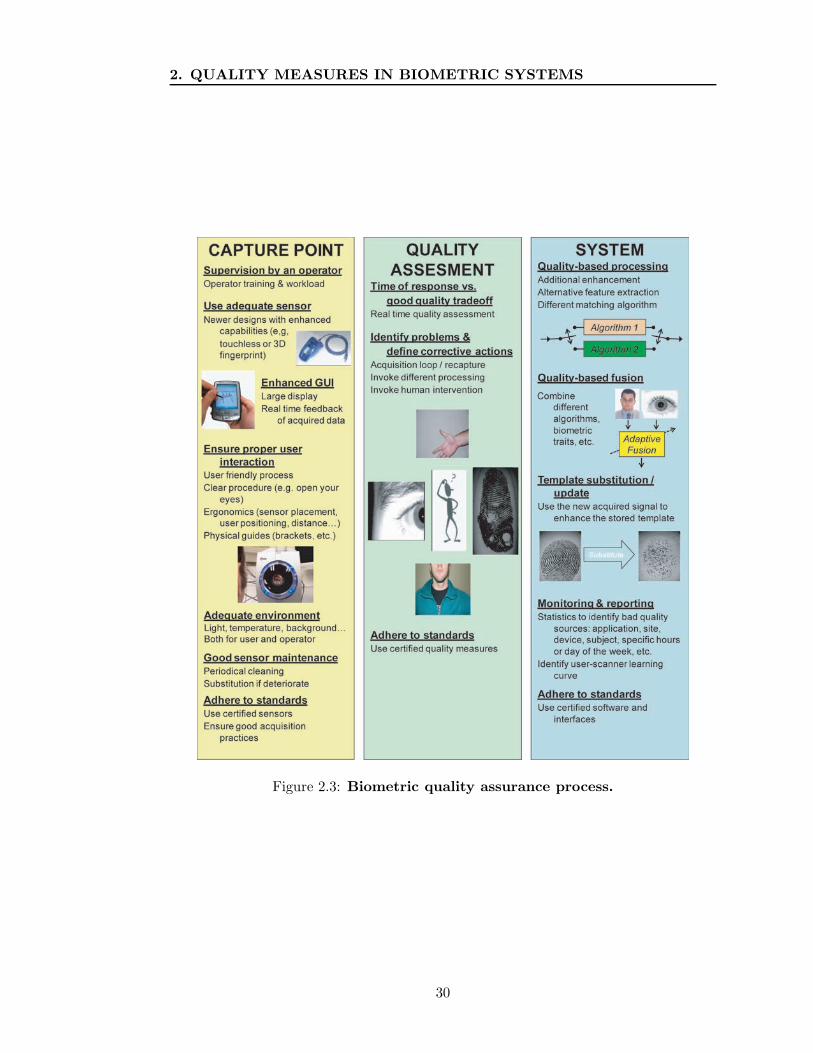
2. QUALITY MEASURES IN BIOMETRIC SYSTEMS
Figure 2.3: Biometric quality assurance process.
30

2.3 Ensuring good quality in biometric samples
• Use of an adequate Graphical User Interface (GUI), with a large display providing
real time feedback of acquired data, as it has been demonstrated that users tend
to provide better signals over time and to habituate faster to the system if they
have feedback of their acquisitions.
• To ensure an adequate acquisition environment (light, temperature, background,
noise, etc.), with a clear acquisition procedure (e.g. “gaze at the camera” or
“place your finger here”), being at the same time ergonomic and user-friendly.
• To ensure a good maintenance of the sensor and of the acquisition kiosk in general,
with periodical cleaning and substitution of damaged parts.
Unfortunately, sometimes these guidelines are not possible to put into practice.
As we have pointed out in the previous section, a number of uncontrolled situations
exist in the “user side”, specially as new deployments making use of portable devices
and/or remote access appear. This is a challenge that should encourage the biometric
community to define a set of best capture practices, and to work towards a common
working criteria.
Regarding the “system side” (right part of Figure 2.3), the most important action
to ensure good quality of biometric samples is to perform quality-dependent processing
and/or quality-dependent fusion. In brief words, it means to invoke different algorithms
and to combine them with different weighting depending on the quality of the signal at
hand. This approach enables to integrate specific developments for poor quality signals
into established recognition strategies. It is also important that the system monitors the
quality of biometric signals, generating periodic reports (Ko and Krishnan, 2004). This
is useful to identify sudden problems (e.g. a damaged sensor) and to carry out trend
analysis that helps to determine if there is a hidden systematic problem that needs
corrective action (e.g. is the quality between two terminals of the same application
different and why? is there an specific scanner working worse that the others? is there
an specific hour when the quality of acquired signals is worse?). Specially important
is to identify if there is a user-scanner learning curve, i.e. if once the users get more
familiar with the interaction with the acquisition device, their acquired biometric signals
exhibit better quality. This allows us to avoid the “first time user” syndrome, specially
for elder people or people who is not used to interact with machines. Another quality-
corrective action, which is still under-researched, is known as template adaptation or
update (Uludag et al., 2004). It is typical for the stored template data to be significantly
different to the processed biometric data obtained during an authentication access due
to natural variations across time. In this case, storing multiple templates that represent
31
2. QUALITY MEASURES IN BIOMETRIC SYSTEMS
the variability associated with a user’s biometric data and to update/substitute them
with new acquisitions is an efficient way to deal with this problem, ensuring at the
same time the best possible quality of stored biometric data.
Between the “user side” and the “system side” (see Figure 2.3), we position the
quality assessment algorithm. Since the quality of the acquired signal conditions subse-
quent actions, it is very important that the quality of biometric samples be computed
in real-time. The assessment algorithm should be able to identify which factor is de-
grading the quality of acquired signals and based on it, start the appropriate corrective
action. In some cases, we will be able to reacquire until satisfaction, but in others we
will not have the opportunity of ask for a new sample, so we will have to deal with the
“bad” sample at hand. Based on the assessed quality, we can invoke different processing
algorithms, or we can reject the acquired signal. In this case, we should have defined
an exception procedure for users whose samples are rejected by the quality assessment
algorithm (e.g. invoke human intervention for an alternative recognition procedure).
The cost of this last option, as well as the inconvenience to the user, is a good reason to
highlight the importance of having a good quality assessment module in any biometric
system.
We should note that adhesion to standards is recommended throughout the quality
assurance process: for sensors, software, interfaces, etc. With the use of standards, we
obtain great flexibility and modularity, fast technology interchange, sensor and system
interoperability, and proper interaction with external security systems.
2.4 Performance of quality assessment algorithms
2.4.1 Previous works
We can find many quality assessment algorithms in the literature (NIST-BQH, 2007).
Quality assessment algorithms have been developed mainly for fingerprint images (Alonso-
Fernandez et al., 2007c) and recently, for iris (Chen et al., 2006a; Kalka et al., 2005),
voice, (Garcia-Romero et al., 2006; Richiardi and Drygajlo, 2008; Richiardi et al., 2007),
face (Kryszczuk and Drygajlo, 2007) and signature signals (Alonso-Fernandez et al.,
2007a,b; Muller and Henniger, 2007).
In spite of the number of existing quality assessment algorithms, almost all of them
have been tested under limited and heterogenous frameworks (Grother and Tabassi,
2007). Biometric quality measurement is an operationally important difficult to bench-
mark, mainly because it has not been until the last years when the biometric community
has formalized the concept of sample quality and has developed several frameworks for
32
2.4 Performance of quality assessment algorithms
evaluating biometric quality measures.
As shown in Figure 2.1, we can consider biometric sample quality from the point
of view of character (inherent properties of the source), fidelity (faithfulness of the
biometric sample to the source), or utility (predicted contribution to performance).
Youmaran and Adler (2006) have developed a theoretical framework for measuring bio-
metric sample fidelity. They relate biometric sample quality with the amount of iden-
tifiable information that the sample contains, and suggest that this amount decreases
with a reduction in quality. They measure the amount of identifiable information for
a person as the relative entropy D(p||q) between the population feature distribution q
and the person’s feature distribution p. Based on this, we can measure the information
loss due to a degradation in sample quality as the relative change in the entropy.
Quality measurement algorithms are increasingly deployed in operational biometric
systems (Grother and Tabassi, 2007) and there is now international consensus in in-
dustry (Benini and et al, 2006), academia (Chen et al., 2005) and government (Tabassi
et al., 2004) that a statement of a biometric sample’s quality should be related to its
recognition performance. That is, a quality measurement algorithm takes a signal or
image, x, and produces a scalar, q = Q(x), which is predictive of error rates associated
with that sample. In other words, most of the operational schemes for quality esti-
mation of biometric signals are focused on the utility of the signal. A framework for
evaluating and comparing quality measures in terms of their capability of predicting
the system performance is presented by Grother and Tabassi (2007). We adhere to this
framework to report the experimental results of this Ph.D. Thesis.
We should note that, although biometric matching involves at least two samples,
they are not acquired at the same time (we store samples in the system database that
are later compared with the new ones provided for recognition). Therefore, a quality
algorithm should be able to work with individual samples, even though its ultimate
intention is to improve recognition performance when matching two (or more) samples.
We should also note that the efficacy of a quality algorithm is usually related to a
particular recognition algorithm, or to a particular class of algorithms (Grother and
Tabassi, 2007). Can vendor A’s quality measure be used with vendor B’s recognition
algorithm? To cope with this problem, there are recent efforts focused on the use
of quality vectors instead of quality scalars, where each component of the vector is
focused on a specific quality factor (Mansfield, 2007). However, this approach still
needs the consensus of researchers and standardization bodies to decide which are
the key factors for a given technology and how to provide universal quality measures
interpretable by different algorithms. We will later discuss this issue in Section 2.7,
33

2. QUALITY MEASURES IN BIOMETRIC SYSTEMS
related to standardization efforts.
2.4.2 A framework for evaluating biometric quality measures
Broadly, a sample should be of good quality if it is suitable for automated matching.
“Bad” quality in this context refers to any property or defect associated with a sample
that would cause performance degradation. We then formalize the concept of sample
quality as a scalar quantity that is related monotonically to the performance of biomet-
ric matchers (Grother and Tabassi, 2007). Throughout this work, we use low quality
values to indicate poor sample properties.
Consider a data set D containing two samples, d(1)i and d
(2)i collected from each of
i = 1, ..., N individuals. The first sample can be regarded as an enrollment sample,
the second as a user sample collected later for verification or identification purposes.
Consider that a quality algorithm Q can be run on the enrollment sample to produce
a quality value
q(1)i = Q(d
(1)i ) (2.1)
and likewise for the authentication (use-phase) sample
q(2)i = Q(d
(2)i ) (2.2)
Consider K verification algorithms, Vk, that compare pairs of samples (or templates
derived from them) to produce match (i.e., genuine) similarity scores,
s(k)ii = Vk(d
(1)i , d
(2)i ), (2.3)
and, similarly, nonmatch (impostor) scores,
s(k)ij = Vk
(d(1)i , d
(2)j
)i 6= j (2.4)
Assume now that the two quality values involved in a matching can be used to
produce an estimate of the genuine similarity score
s(k)ii = P (q
(1)i , q
(2)i ) + ǫ
(k)ii , (2.5)
where the function P is some predictor of a matcher k’s similarity scores, and ǫii is the
34

2.4 Performance of quality assessment algorithms
0 0.2 0.4 0.6 0.8 10
50
100
150
200
250
300
Average quality of enrolment and test images
Sim
ilari
ty s
core
Figure 2.4: Raw similarity scores from a fingerprint matcher versus the av-erage quality of the enrolment and the test images.
error in doing so for the ith score. Then substituting Equation (2.1) gives
s(k)ii = P (Q(d
(1)i ), Q(d
(2)i )) + ǫ
(k)ii , (2.6)
and it becomes clear that, together, P and Q would be perfect imitators of the matcher
Vk in Equation (2.3) if it was not necessary to apply Q to the samples separately.
This separation is usually a necessary condition for a quality algorithm to be useful
because, at least half of the time (i.e., enrollment), only one sample is available. Thus,
the quality problem is complex, first, because Q is considered to produce a scalar and,
second, because it is applied separately to the samples. The obvious consequence of this
formulation is that it is inevitable that quality values will imprecisely map to similarity
scores, i.e., there will be a scatter of the known scores, sii, for the known qualities
q(1)i and q
(2)i . For example, Figure 2.4 shows the raw similarity scores of a fingerprint
matcher versus the average quality of the enrolment and the test images. They trend
in the correct direction: worse quality gives lower similarity scores. However, it is
inappropriate to require quality measures to be linear predictors of the similarity scores;
instead, the scores should be a monotonic function (higher quality samples give higher
scores) (Grother and Tabassi, 2007).
Quality algorithms should be targeted to application-specific performance variables,
i.e., false match and non-match rates. Verification applications are positive applica-
35

2. QUALITY MEASURES IN BIOMETRIC SYSTEMS
tions, which means that samples are captured overtly from users who are motivated to
submit high quality samples. For this scenario, the relevant performance metric is the
False Rejection Rate (FRR) because two high quality samples from the same individual
should produce a high score. Regarding the False Acceptance Rate (FAR), high quality
images should give very low impostor scores, but low quality images should also pro-
duce low scores (Grother and Tabassi, 2007). Indeed, it is undesirable that a matching
algorithm produces high impostor scores from low quality samples.
Biometric matching involves at least two samples. We are then faced with relating
performance to two quality values q(1)i and q
(2)i . To simplify the analysis, the two
qualities are combined:
qi = H(q(1)i , q
(2)i ) (2.7)
Enrolment is usually a supervised process, and it is common to improve the qual-
ity of the final stored sample by acquiring as many samples as needed. Subsequent
authentication samples gathered in the use-phase of a system can be supervised or un-
supervised, thus having samples of less controlled quality. To capture this concept, we
can consider H(x, y) =min(x, y), i.e., the worse of the two samples drives the similarity
score. Another utilized functions H(x, y) are (Fierrez-Aguilar et al., 2005b; Grother
and Tabassi, 2007): the arithmetic and geometric means, H(x, y) = (x + y)/2 and
H(x, y) =√
xy.
2.4.3 Evaluation of quality algorithms
The primary choice for evaluation of quality algorithms in several existing studies is the
DET curve (Chen et al., 2005; Fierrez-Aguilar et al., 2005b; Tabassi and Wilson, 2005).
DET curves are widely used in the biometric field to report performance capabilities of
a system (Martin et al., 1997). Data is partitioned in L levels according to some quality
criteria and L rank-ordered DET curves are plotted. However, because DET curves
combine the effect of quality on both genuine and impostor performance, we lose sight
of the separate effects of quality on FAR and FRR. Three methods for partitioning the
data are given by Grother and Tabassi (2007). The simplest case uses scores obtained by
comparing authentication and enrolment samples whose qualities are both k. Although
common, this method is not representative of an operational use of quality. Instead,
by computing performance from scores obtained by comparing authentication samples
of quality k with enrolment samples of quality greater than or equal to k, we model
the situation in which the enrolment samples are at least as good as the authentication
36

2.5 Human vs. automatic quality assessment
0 5 10 15 20 25
1.4
1.6
1.8
2
2.2
2.4
2.6
2.8
Fraction rejected (%)
EE
R (
%)
Figure 2.5: Verification performance of a fingerprint matcher as samples withthe lowest quality value are rejected.
samples. Such use of a quality would lead to failures to acquire for the low quality levels.
On the contrary, if we compare performance across all authentication samples against
enrolment samples of quality greater than or equal to k, we model the situation where
quality control is applied only during enrolment. Although some differences are found,
experiments reported by Grother and Tabassi (2007) show that the ranked separation
of the DETs is maintained with the three methods.
An alternative approach to the DET curve is the error-vs-reject curve. This curve
models the operational case in which quality is used to reject low quality samples with
the purpose of improving performance. Similarity scores with associated samples having
a quality value lower than a predefined threshold are not included in the computation of
the error rates. Note that this procedure involves the combination of quality from two
samples (see Equation 2.7). For a good quality algorithm, error rates should decrease
quickly with the fraction rejected. An example is shown in Figure 2.5.
2.5 Human vs. automatic quality assessment
It is often assumed that human assessment of biometric quality is the gold standard
against which automatic quality measures should be measured. There is an established
community of human experts in recognizing biometric signals for certain applications
37

2. QUALITY MEASURES IN BIOMETRIC SYSTEMS
(e.g. signatures in cheques or fingerprints in the forensic field) and the use of manual
quality verification is included in the workflow of some biometric applications such as
immigration screening and passport generation (Adler and Dembinsky, 2006).
Many authors make use of datasets with manually labeled quality measures to
optimize and test their quality assessment algorithms (e.g. see Alonso-Fernandez et al.
(2007c) and the references therein). On the other hand, there are some studies that
test the relationship between human and algorithm based quality measures (Adler
and Dembinsky, 2006). From these studies, it is evident that human and computer
processing are not always functionally comparable. For instance, if a human judges
a face or iris image to be good because of its sharpness, but a recognition algorithm
works in low frequencies, then the human statement of quality is inappropriate. We can
improve the judgement of human inspectors by adequate training on the limitations of
the recognition system, but this could be prohibitively expensive and time consuming.
In addition, if we decide to incorporate a human quality checker, we must consider the
human factors such as tiredness, boredom or lack of motivation that a repetitive task
like this may cause in the operator.
2.6 Incorporating quality measures in biometric systems
Different uses of sample quality measures in the context of biometric systems have been
identified throughout this chapter. These possible uses are represented in Figure 2.6.
We should note that these roles are not mutually exclusive. Indeed, the ideal situation
would be to include all of them in our application. We can distinguish among:
• Recapture loop or conditional reacquisition. If an acquired sample does
not satisfy our quality criteria, we can implement for instance an “up to three
attempts” policy. This depends on the applications constraints, which may re-
quire to process the first acquired sample regardless of the quality. Also it is
very important to know the reasons for poor quality samples, so we can improve
the process, for example: giving feedback to the user including corrective be-
havior that would improve the quality of the reacquisition, using another sensor,
collecting additional samples, invoking different processing, etc. To avoid reac-
quisition, some systems select the best signal in a stream captured while the user
is interacting with the sensor, such as iris or face images from a video.
38

2.6
Incorp
ora
ting
quality
measu
res
inbio
metric
syste
ms
Update
template
pre
pro
cessin
g
Storedsamples
Claimed identity
Similaritycomputation
Similarity
scorefeatu
reextr
acti
on
BIOMETRIC SYSTEM
SENSOR
Quality computation
of acquired sample
Q-based
processing
Q-based
matching
Recapture
Human
intervention
Q-based
fusion
Monitoring
Reporting
DecisionAcceptance
orrejection
Q-based
decision
Figure 2.6: Roles of a sample quality measure in the context of biometric systems.
39

2. QUALITY MEASURES IN BIOMETRIC SYSTEMS
• Invoke human intervention. In the undesirable case that the biometric data
of a user does not meet the quality requirements, we can either deny the access
to this person, or (more friendly) invoke human intervention for an alternative
recognition procedure. Human intervention is certainly time and cost consuming,
and inconvenient for users. Therefore, it is important to capture the best possible
input signals.
• Quality-based processing. In biometric systems, once a signal has been ac-
quired, two steps are typically performed before the signal is matched against
the templates stored in the system database: i) pre-processing, in which the in-
put signal is enhanced to simplify the task of feature extraction, and ii) feature
extraction, in which we further process the signal to generate a discriminative
and compact representation. Depending on the quality of the acquired signal, we
can adapt these two steps accordingly. If the quality of the sample is low, we
can invoke special enhancement algorithms. Also, we can extract features robust
to the kind of degradation that the biometric signal is suffering. In some cases
there will be useless parts of the biometric signal (e.g., damaged fingerprint re-
gions). Local quality measures can help to extract features only from the useful
regions (Fronthaler et al., 2008), taking into account that a minimum amount of
information is needed to reliably using the biometric signal for recognition. It
is also possible to rank the extracted features depending on the quality of local
regions of the biometric signal, and exploit that information afterwards during
the matching.
• Update of enrolment data. Biometric data is subject to natural variations
across time. To cope with this problem, multiple templates representing the
variability associated with the user can be stored in the database, which can be
updated with new acquisitions (Ko and Krishnan, 2004; Uludag et al., 2004).
To improve the overall quality of the biometric database over time, we can also
update the currently enrolled samples of a subject with better quality samples
captured during the operation of the system, thereby improving the overall system
match accuracy.
• Quality-based matching and decision. Once we extract the feature repre-
sentation of the input biometric signal, it is compared against one (verification)
or more (identification) templates stored in the system database. This compari-
son process is also called matching. The result of the comparison is a similarity
or matching score, which in verification systems is then compared to a decision
40

2.6 Incorporating quality measures in biometric systems
threshold in order to accept or reject an input identity claim. Depending on the
quality of acquired templates, we can use different matching algorithms (which
also depend on the kind of features extracted in the previous step) (Fierrez-
Aguilar et al., 2005e). Also, we can adjust the sensitivity of the matcher or the
decision threshold to the quality of the signals under comparison (Chen et al.,
2006a). We can discard features with low quality from the matching or give more
weight to high quality features (Chen et al., 2005).
• Quality based-fusion. Multibiometric systems integrate the evidence presented
by multiple sources with the purpose of overcoming some of the limitations shown
by the individual sources. The most widely used approach is integrating the
matching scores provided by different systems due to the ease in accessing and
processing outputs generated by different matchers (Ross et al., 2006). Quality
information has been incorporated in a number of fusion approaches, for instance
weighting results from the multiple sources depending on the quality (Fierrez-
Aguilar et al., 2005e), or using only sources with a minimum quality. There
are systems that implement a cascade scheme (e.g. Fronthaler et al. (2008)) by
dynamically switching on the different sources in case of uncertainty (low quality)
with the available ones. Other works that incorporate quality information in the
fusion are Fierrez-Aguilar et al. (2006); Garcia-Romero et al. (2006); Kryszczuk
and Drygajlo (2008); Nandakumar et al. (2006).
• Monitoring and reporting. We can use quality measures to monitor quality
across the different parts of our system with the objective of identifying problems
that lead to poor quality signals. Ko and Krishnan (2004) have documented a
methodology for this purpose. They identify different aspects related to biometric
signal quality that can be monitored and reported:
1. Signal quality by application. Different application scenarios may require
different scanners, capture software, environment configuration and settings,
and these differences may have different impact on the overall quality of
captured signals. Therefore, it is important to monitor the signal quality
distribution for different applications to find application-specific problems.
2. Signal quality by site/terminal. This helps to identify abnormal sites or
terminals due to operator training, site configuration, operational conditions,
damaged sensor, environment, etc.
3. Signal quality by capture device. There can be variations in the quality of
41

2. QUALITY MEASURES IN BIOMETRIC SYSTEMS
captured signals between devices due to differences in the physical acquisi-
tion principle (Alonso-Fernandez et al., 2008), mechanical design, etc. Re-
porting quality distributions by scanner type identifies device-specific prob-
lems, helping us to initiate corrective actions.
4. Signal quality by subject. It is known that once the users get more familiar
with the interaction with the acquisition device, and with the system in
general, their acquired biometric signals exhibit better quality. Identifying
the interaction learning curve helps us to better train new users, specially
elder people or people who is not used to interact with machines, alleviating
the “first time user” syndrome.
5. Signal quality by template. As we have discussed before, template substi-
tution/updating is a good strategy to deal with the variability of biometric
data across time and to improve the quality of stored templates. Periodic
quality distribution reports of stored biometric data allows us to detect how
the quality of the database is varying, helping us to improve the template
substitution/updating algorithm.
6. Signal quality by biometric input. In multibiometric systems, where multi-
ple sources of biometric information are combined (Ross et al., 2006), this
kind of report is aimed to examine the quality distributions of these different
sources. It allows us to detect, for instance, if an specific source is experi-
encing problems, or if the way we are combining the different sources can be
improved.
7. Signal quality trend analysis. This provides the quality statistics of all appli-
cations, sites, etc., allowing us to identify trends in signal quality or sudden
changes that need further investigation.
2.7 Standardizing biometric quality
Standards compliance allows us to replace parts of deployed systems with various tech-
nological options coming from open markets. Also, as biometric technology is exten-
sively deployed, a common situation is the exchange of information between several
applications, involving diverse biometric systems developed by different vendors. This
interoperable scenario is also enabled by the adoption of standards. Examples of in-
teroperable scenarios are the use of ePassports readable by different countries, or the
exchange of lists of criminals among Security Forces.
42
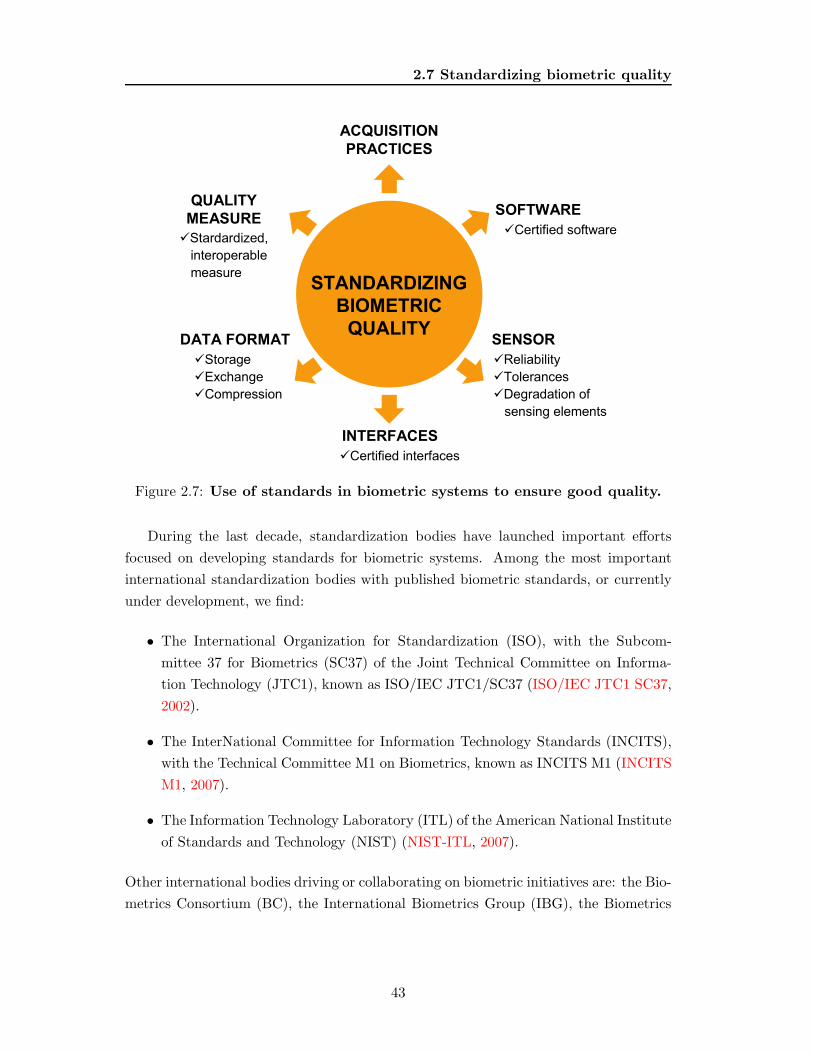
2.7 Standardizing biometric quality
STANDARDIZING
BIOMETRIC
QUALITY
ACQUISITION
PRACTICES
SENSOR
üReliability
üTolerances
üDegradation of
sensing elements
SOFTWARE
üCertified software
DATA FORMAT
üStorage
üExchange
üCompression
INTERFACES
üCertified interfaces
QUALITY
MEASURE
üStardardized,
interoperable
measure
Figure 2.7: Use of standards in biometric systems to ensure good quality.
During the last decade, standardization bodies have launched important efforts
focused on developing standards for biometric systems. Among the most important
international standardization bodies with published biometric standards, or currently
under development, we find:
• The International Organization for Standardization (ISO), with the Subcom-
mittee 37 for Biometrics (SC37) of the Joint Technical Committee on Informa-
tion Technology (JTC1), known as ISO/IEC JTC1/SC37 (ISO/IEC JTC1 SC37,
2002).
• The InterNational Committee for Information Technology Standards (INCITS),
with the Technical Committee M1 on Biometrics, known as INCITS M1 (INCITS
M1, 2007).
• The Information Technology Laboratory (ITL) of the American National Institute
of Standards and Technology (NIST) (NIST-ITL, 2007).
Other international bodies driving or collaborating on biometric initiatives are: the Bio-
metrics Consortium (BC), the International Biometrics Group (IBG), the Biometrics
43
2. QUALITY MEASURES IN BIOMETRIC SYSTEMS
Management Office of the American Department of Defense (DoD), the Federal Bu-
reau of Investigation (FBI), the European Biometrics Forum (EBF), the International
Civil Aviation Organization (ICAO), the International Biometric Industry Association
(IBIA), or the American National Standards Institute (ANSI).
We summarize in Figure 2.7 which parts of a biometric system can be standardized.
As a result of the efforts carried out by these standardization bodies, we find that
international standards relating to biometrics are maturing quickly:
• Standards for interfaces between modules, as the BioApi Specification (BioAPI,
1998), sponsored in 1999 by the NIST-ITL and the US Biometric Consortium,
and adopted by ISO/IEC and INCITS as the ISO/IEC 19784-1:2005 and ANSI
INCITS 358-2002 standards, respectively.
• Standards for data formats, as: i) the Common Biometric Exchange Formats
Framework (CBEFF), sponsored by the NIST-ITL and the Biometric Consortium
in 2001/2004, ii) the FBI Wavelet Scalar Quantization (WSQ) image compression
algorithm for fingerprint images, developed to archive the large FBI fingerprint
database, iii) the Electronic Fingerprint Transmission Specification (EFTS) (FBI
Biometric Specifications (BioSpecs)) of the FBI, initially developed for electroni-
cally encoding and transmitting fingerprint images, identification and arrest data,
and recently expanded to include additional biometric modalities (palmprint, fa-
cial, and iris), or iv) the ANSI/NIST-ITL 1-2000 that specifies a common format
for exchanging fingerprint, facial, scar, mark, and tattoo identification data be-
tween law enforcement and related criminal justice agencies.
• Standards for acquisition practices, as: i) the ISO-19794-5/ICAO requirements
and best practices for facial portraits, with recommendations about the deploy-
ment of biometrics in machine readable travel documents, or ii) the best practices
Annex to ISO 19794-5 standard regarding conditions for taking photographs for
face image data, with indications about lighting and camera arrangement, and
head positioning.
Most of the biometric existing standards define a quality score field aimed to in-
corporate quality measures. Nevertheless, the content of this field is not explicitly
defined or is somewhat subjective (Benini, 2007). The reason for this vagueness is
that traditionally there has not been consensus on how to provide universal quality
measures interpretable by different algorithms, or which are the key factors that define
44

2.8 Issues and challenges
quality in a given biometric trait. These problems are being the source of many re-
search works nowadays, and have led to the multipart standardization effort ISO/IEC
29794-1/4/5 on biometric sample quality (Benini, 2007). The goals of this standard
are to enable harmonized interpretation of quality scores from different vendors, al-
gorithms and versions. Ongoing works within this standardization project include: i)
standardizing quality scoring algorithms by setting the key factors that define qual-
ity in different biometric traits (e.g., for face recognition, they would be metrics like
eyes closed/obstructed, lighting uniformity on face, image focus, face rotation, etc.), ii)
achieving normalization of scores, with different algorithms expressing quality scores
on the same scale, iii) building a database of samples and assigned quality scores that
would serve as reference for vendors, and iv) incorporating fields to existing data inter-
change format standards to identify the algorithm used to generate the quality scores.
The latter approach, known as Quality Algorithm ID (QAID), incorporates standard-
ized data fields (International Biometric Industry Association (IBIA)) that uniquely
identifies a quality algorithm, including its vendor, product code and version. It enables
to differentiate between quality scores generated by different algorithms/vendors and
to adjust them for any differences in processing or analysis as necessary. QAID fields
can be easily added to existing data interchange formats such as CBEFF, enabling a
modular multi-vendor environment that accomodates samples scored by different qual-
ity algorithms. It should noted that this approach does not attempt to define what is
good/bad quality or to set how quality measures should be computed, it just provides
means to interchange and interpret biometric sample quality scores via existing data
interchange formats.
2.8 Issues and challenges
The increasing development of biometrics in the last decade, related to the number of
important applications where a correct assessment of identity is a crucial point, has
not been followed by extensive research on the biometric quality measurement problem
(Grother and Tabassi, 2007). Biometric data quality is a key factor in the performance
of identification systems, as the biometric community has realized that biometric sys-
tems fail on certain pathological samples. Now that there is international consensus
that a statement of a biometric sample’s quality should be related to its recognition
performance, efforts are going towards an harmonized and universal interpretation of
quality measures by defining the key factors that need to be assessed in each biometric
trait, and by setting good acquisition practices. This will enable a competitive multi-
45

2. QUALITY MEASURES IN BIOMETRIC SYSTEMS
vendor marketplace, allowing interoperability of multiple vendors quality assessment
algorithms.
A biometric system has to be resilient in processing data with heterogeneous quality
yet providing good recognition performance. Although there are several corrective
actions that can be performed to improve the quality of acquired signals, some factors
fall out of our control or cannot be avoided. In this respect, specially challenging
scenarios for biometrics are the ones based on portable devices and/or remote access
through Internet, which are expected to work in an unsupervised environment, with no
control on the ambient noise, on the user-sensor interaction process, or on the sensor
maintenance. Therefore, it is very important upon capture of biometric samples to
assess their quality as well as having specific developments for poor quality signals.
Quality is intrinsically multi-dimensional, with factors of very different nature af-
fecting it. A biometric system must adequately address this multifactor nature of the
sample quality. There are a number of things that quality measures can do for us in the
context of our system to improve the overall performance, such as altering the sample
processing/comparison process, or weighting the results from different systems depend-
ing on the quality. Some research works have dealt with these matters, but much work
is still to be done in this area. Recent independent evaluations of commercial and re-
search prototypes are also starting to include quality studies in their scenarios, as the
Minutiae Interoperability Exchange Test in 2005 (Grother et al., 2005) or the BioSecure
Multimodal Evaluation Campaign in 2007 (BMEC, 2007).
2.9 Chapter summary and conclusions
Since the establishment of biometric research as an specific research area in late 90s
(Jain et al., 2008), the biometric community has focused its efforts in the development
of accurate recognition algorithms. Nowadays, biometric recognition is a mature tech-
nology that is used in many applications (e.g. e-Passports, ID cards or border control
(US-VISIT Program of the U.S. Department of Homeland Security)). However, we
can notice recent studies that demonstrate how performance of biometric systems is
heavily affected by the quality of biometric signals. The problem of biometric quality
measurement has arisen in the last years and at this moment, it is a current research
challenge within the biometric community (Grother and Tabassi, 2007).
In this chapter, we present an overall framework of the different issues that make
up the biometric quality problem. Issues like the factors influencing biometric quality,
the strategies to ensure the best possible quality of acquired biometric samples, or the
46

2.9 Chapter summary and conclusions
role of quality measures within biometric systems are addressed here. We also present
a framework for evaluation of the performance of biometric quality measures, as well
as existing standardization efforts related to biometric quality.
This chapter includes novel contributions regarding the taxonomy of factors affect-
ing biometric quality, the taxonomy of strategies to ensure good quality in acquired
biometric samples, and the taxonomy of roles of quality measures in the context of
biometric systems.
47

2. QUALITY MEASURES IN BIOMETRIC SYSTEMS
48
Chapter 3
Quality Assessment of
Fingerprint Images
Due to its permanence and uniqueness, fingerprint recognition is the most widely
deployed biometric technology (Maltoni et al., 2003). Fingerprints are used in forensic
investigations since the XIX century by Security Forces worldwide. Nowadays, a large
number of convenience applications such as access control or on-line identification also
make use of fingerprints (Jain et al., 2006). Nearly half of invests in the biometric
market go to the fingerprint technology (IBG, 2007).
This chapter compares several representative fingerprint quality measures by study-
ing both their correlation and their utility. We evaluate the impact of the selected image
quality measures in the performance of a minutiae- and a ridge-based matcher, which
are the two most popular approaches for fingerprint verification (Maltoni et al., 2003).
We use for our experiments a multi-session database (Fierrez et al., 2007) acquired with
three sensors of different technology. High correlation is found between quality mea-
sures in most cases, however, some differences are observed depending on the sensor.
Regarding the utility of the selected measures, it has been found that for the approach
based on minutiae, the highest performance improvement is obtained in the False Re-
jection Rate, whereas for the ridge-based approach the highest improvement is observed
in the False Acceptance Rate. We also contribute in this chapter with a comprehensive
survey of existing fingerprint quality algorithms. We provide basic algorithmic descrip-
tions of each quality estimation measure and the rationale behind, including visual
examples that show the behavior of the measures with fingerprint images of different
quality.
49

3. QUALITY ASSESSMENT OF FINGERPRINT IMAGES
Figure 3.1: Acquisition principles of silicon and optical sensors.
This chapter is structured as follows. We first present the basics of fingerprint recog-
nition systems, including its different phases and the most common used algorithms.
We next give a comprehensive description of existing approaches for fingerprint image
quality assessment. After that, we outline the fingerprint matching systems and the
experimental framework used. Results are then described and finally, a summary and
some conclusions are given.
The minutiae-based matcher used in this Chapter is the one released by the National
Institute of Standards and Technology (Watson et al., 2004), and the ridge-based one is
a proprietary system developed at the Biometric Recognition Group - ATVS (Fierrez-
Aguilar et al., 2005b), therefore they are not contributions of this Thesis. Similarly,
quality measures used in this Chapter are not original, although they have been imple-
mented and optimized in the framework of this Ph.D. Thesis. Original contributions
in this chapter are related to the taxonomy of fingerprint image quality assessment
algorithms, the implementation of a representative set of them, the study of correlation
between the selected quality algorithms, and the study of utility of the quality measures
for two different matchers with sensors of different technology.
This chapter is based on the publications: Alonso-Fernandez et al. (2008a, 2007c,
2005b, 2008); Fierrez-Aguilar et al. (2005b).
50
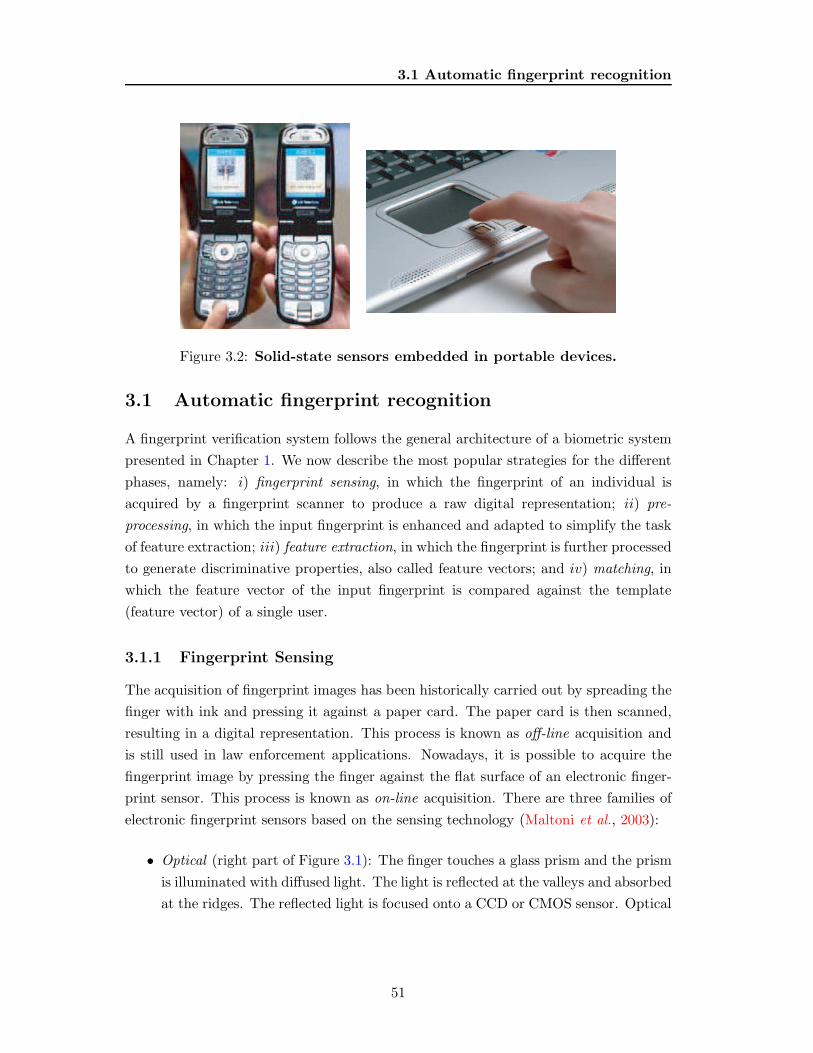
3.1 Automatic fingerprint recognition
Figure 3.2: Solid-state sensors embedded in portable devices.
3.1 Automatic fingerprint recognition
A fingerprint verification system follows the general architecture of a biometric system
presented in Chapter 1. We now describe the most popular strategies for the different
phases, namely: i) fingerprint sensing, in which the fingerprint of an individual is
acquired by a fingerprint scanner to produce a raw digital representation; ii) pre-
processing, in which the input fingerprint is enhanced and adapted to simplify the task
of feature extraction; iii) feature extraction, in which the fingerprint is further processed
to generate discriminative properties, also called feature vectors; and iv) matching, in
which the feature vector of the input fingerprint is compared against the template
(feature vector) of a single user.
3.1.1 Fingerprint Sensing
The acquisition of fingerprint images has been historically carried out by spreading the
finger with ink and pressing it against a paper card. The paper card is then scanned,
resulting in a digital representation. This process is known as off-line acquisition and
is still used in law enforcement applications. Nowadays, it is possible to acquire the
fingerprint image by pressing the finger against the flat surface of an electronic finger-
print sensor. This process is known as on-line acquisition. There are three families of
electronic fingerprint sensors based on the sensing technology (Maltoni et al., 2003):
• Optical (right part of Figure 3.1): The finger touches a glass prism and the prism
is illuminated with diffused light. The light is reflected at the valleys and absorbed
at the ridges. The reflected light is focused onto a CCD or CMOS sensor. Optical
51
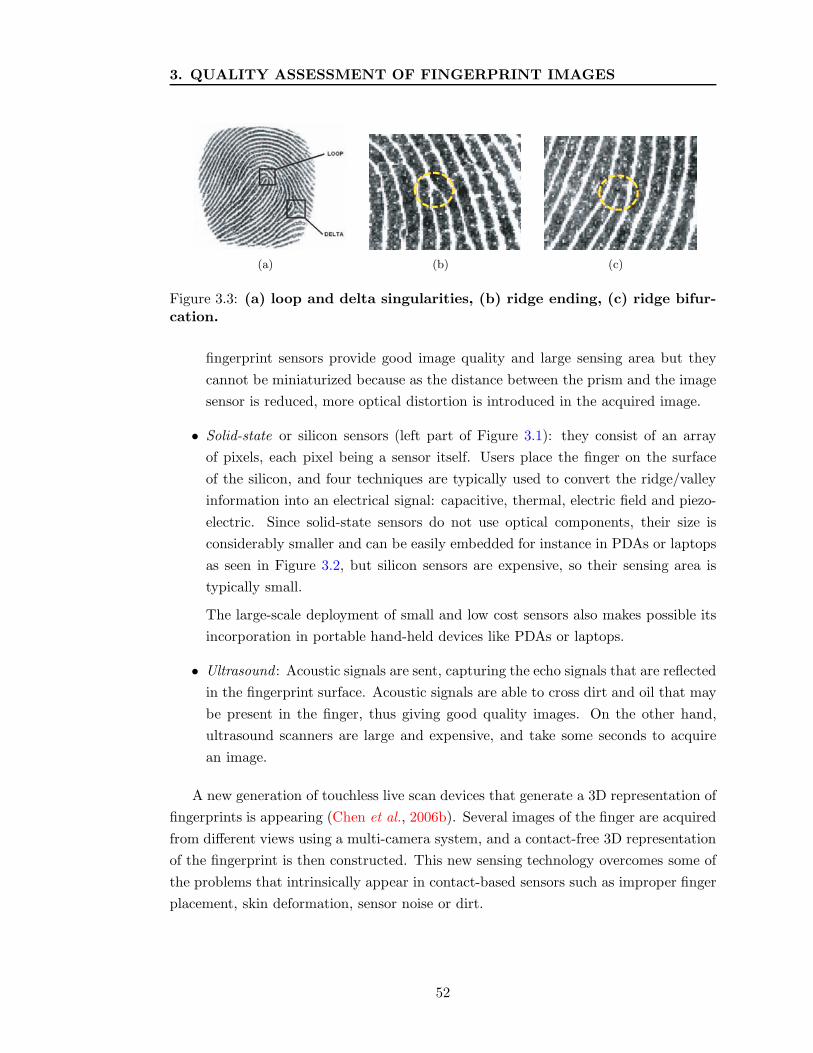
3. QUALITY ASSESSMENT OF FINGERPRINT IMAGES
(a) (b) (c)
Figure 3.3: (a) loop and delta singularities, (b) ridge ending, (c) ridge bifur-cation.
fingerprint sensors provide good image quality and large sensing area but they
cannot be miniaturized because as the distance between the prism and the image
sensor is reduced, more optical distortion is introduced in the acquired image.
• Solid-state or silicon sensors (left part of Figure 3.1): they consist of an array
of pixels, each pixel being a sensor itself. Users place the finger on the surface
of the silicon, and four techniques are typically used to convert the ridge/valley
information into an electrical signal: capacitive, thermal, electric field and piezo-
electric. Since solid-state sensors do not use optical components, their size is
considerably smaller and can be easily embedded for instance in PDAs or laptops
as seen in Figure 3.2, but silicon sensors are expensive, so their sensing area is
typically small.
The large-scale deployment of small and low cost sensors also makes possible its
incorporation in portable hand-held devices like PDAs or laptops.
• Ultrasound : Acoustic signals are sent, capturing the echo signals that are reflected
in the fingerprint surface. Acoustic signals are able to cross dirt and oil that may
be present in the finger, thus giving good quality images. On the other hand,
ultrasound scanners are large and expensive, and take some seconds to acquire
an image.
A new generation of touchless live scan devices that generate a 3D representation of
fingerprints is appearing (Chen et al., 2006b). Several images of the finger are acquired
from different views using a multi-camera system, and a contact-free 3D representation
of the fingerprint is then constructed. This new sensing technology overcomes some of
the problems that intrinsically appear in contact-based sensors such as improper finger
placement, skin deformation, sensor noise or dirt.
52

3.1 Automatic fingerprint recognition
3.1.2 Preprocessing and Feature Extraction
A fingerprint is composed of a pattern of interleaved ridges and valley. They smoothly
flow in parallel and sometimes terminate or bifurcate. At a global level, this pattern
sometimes exhibits a number of particular shapes called singularities which can be
classified into three types: loop, delta and whorl. In Figure 3.3a we can see an example
of loop and delta singularities (the whorl singularity can be defined as two opposing
loops). Singularities at the global level are commonly used for fingerprint classification,
which simplifies search and retrieval across a large database of fingerprint images. At
the local level, the ridges and valleys pattern can exhibit a particular shape called
minutia. There are several types of minutiae but for practical reasons, only two types of
minutiae are considered: ridge ending (Figure 3.3b) and ridge bifurcation (Figure 3.3c).
The gray-scale representation of a fingerprint image is known to be unstable for
fingerprint recognition (Maltoni et al., 2003). Although there are fingerprint matching
techniques that directly compare gray images using correlation-based methods, most
of the fingerprint matching algorithms use features which are extracted from the gray-
scale image. To make this extraction easy and reliable, a set of preprocessing steps is
commonly performed, namely: i) computation of local ridge orientation and ii) local
ridge frequency, iii) enhancement of the fingerprint image, and iv) segmentation of the
fingerprint area from the background.
• The local ridge orientation at a pixel level is defined as the angle that the fin-
gerprint ridges form with the horizontal axis. Most of the algorithms do not
compute the local ridge orientation at each pixel, but over a square-meshed grid
(Figure 3.4). The simplest approach for local ridge orientation estimation is based
on the gray-scale gradient. Since the gradient phase angle denotes the direction
of the maximum pixel-intensity change, the ridge orientation is orthogonal to
this phase angle. There are essentially two orientation estimation techniques:
the direction tensor sampling, (Bigun and Granlund, 1987) and spectral tensor
discretization (Knutsson, 1982) using Gabor filters. For its computational effi-
ciency the method independently suggested by Bigun and Granlund (1987) is the
most commonly utilized in fingerprint applications because the spectral approach
needs more filtering. We refer to Bigun (2006) for a detailed treatment of both
approaches.
• The local ridge frequency at a pixel level is defined as the number of ridges per
unit length along a hypothetical segment centered at this pixel and orthogonal to
53

3. QUALITY ASSESSMENT OF FINGERPRINT IMAGES
Figure 3.4: Local ridge orientation of a fingerprint image computed over asquare-meshed grid: (a) original image, (b) orientation image, (c) smoothedorientation image. Each element of (b) and (c) denotes the local orientationof the ridges. Figure extracted from Simon-Zorita (2003).
Figure 3.5: Modeling of ridges and valleys as a sinusoidal-shaped wave.
the local ridge orientation (Maltoni et al., 2003). As in the case of the local ridge
orientation, the local ridge frequency is computed over a square-meshed grid. Ex-
isting methods (Hong et al., 1998; Kovacs-Vajna et al., 2000; Maio and Maltoni,
1998) usually model the ridge-valley structure as a sinusoidal-shaped wave (Fig-
ure 3.5), where the ridge frequency is set as the frequency of this sinusoid, and
the orientation is used to angle the wave.
• Ideally, in a fingerprint image, ridges and valleys flow smoothly in a locally con-
stant direction. In practice, however, there are factors that affect the quality of a
fingerprint image: wetness or dryness of the skin, noise of the sensor, temporary
or permanent cuts and bruises in the skin, variability in the pressure against the
sensor, etc. Several enhancement algorithms have been proposed in literature
54
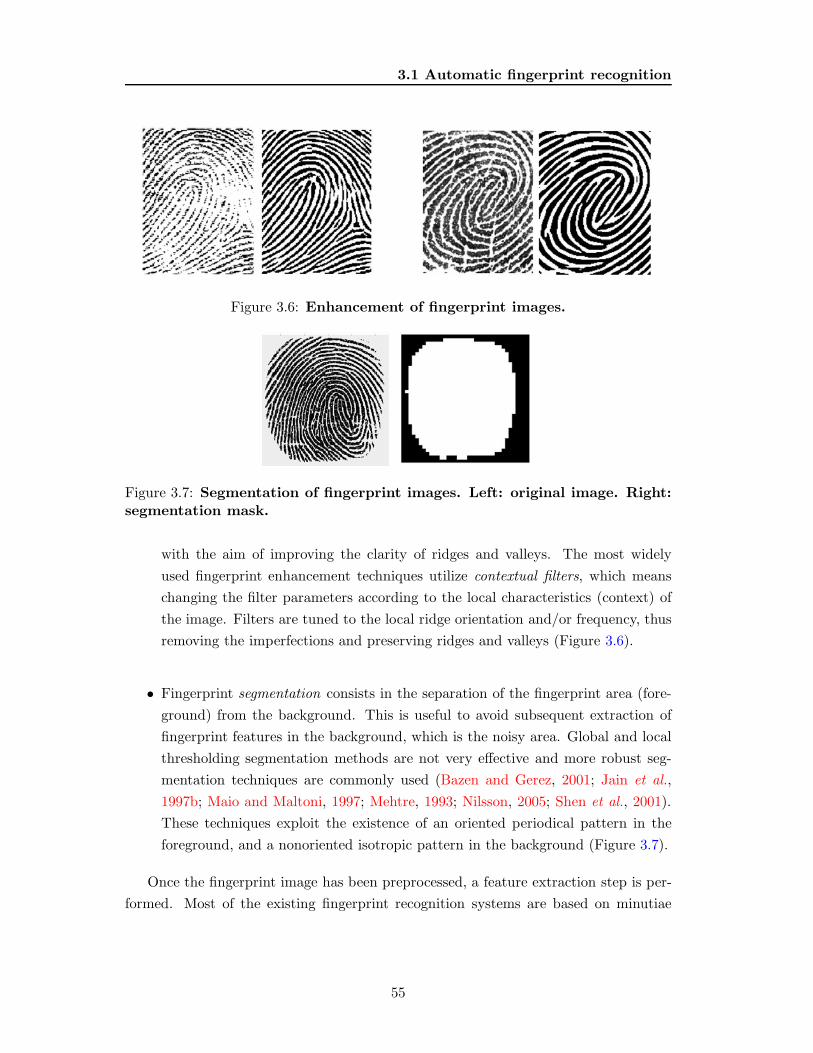
3.1 Automatic fingerprint recognition
Figure 3.6: Enhancement of fingerprint images.
Figure 3.7: Segmentation of fingerprint images. Left: original image. Right:segmentation mask.
with the aim of improving the clarity of ridges and valleys. The most widely
used fingerprint enhancement techniques utilize contextual filters, which means
changing the filter parameters according to the local characteristics (context) of
the image. Filters are tuned to the local ridge orientation and/or frequency, thus
removing the imperfections and preserving ridges and valleys (Figure 3.6).
• Fingerprint segmentation consists in the separation of the fingerprint area (fore-
ground) from the background. This is useful to avoid subsequent extraction of
fingerprint features in the background, which is the noisy area. Global and local
thresholding segmentation methods are not very effective and more robust seg-
mentation techniques are commonly used (Bazen and Gerez, 2001; Jain et al.,
1997b; Maio and Maltoni, 1997; Mehtre, 1993; Nilsson, 2005; Shen et al., 2001).
These techniques exploit the existence of an oriented periodical pattern in the
foreground, and a nonoriented isotropic pattern in the background (Figure 3.7).
Once the fingerprint image has been preprocessed, a feature extraction step is per-
formed. Most of the existing fingerprint recognition systems are based on minutiae
55

3. QUALITY ASSESSMENT OF FINGERPRINT IMAGES
Figure 3.8: Binarization and thinning of fingerprint images using contextualfilters. Figure extracted from Simon-Zorita et al. (2003).
Figure 3.9: Thinning step: (a) typical imperfections appeared during thethinning step, (b) a thinned fingerprint structure before and after removingimperfections.
matching, so that reliable minutiae extraction is needed. Usually, the preprocessed fin-
gerprint image is converted into a binary image which is then thinned using morphol-
ogy (Figure 3.8). The thinning step reduces the ridge thickness to one pixel, allowing
straightforward minutiae detection. During the thinning step, a number of spurious
imperfections may appear (Figure 3.9a) and thus, a postprocessing step is sometimes
performed (Figure 3.9b) in order to remove the imperfections from the thinned image.
Several approaches for binarization, thinning and minutiae detection have been pro-
posed in the literature (Maltoni et al., 2003). However, binarization and thinning suffer
from several problems: i) spurious imperfections, as mentioned; b) loss of structural
information; c) computational cost; and d) lack of robustness in low quality fingerprint
images. Because of that, other approaches that extract minutiae directly from the
gray-scale image have been also proposed (Bolle et al., 2002; Chang and Fan, 2001;
Fronthaler et al., 2006; Jiang et al., 2001; Liu et al., 2000; Maio and Maltoni, 1997).
56

3.1 Automatic fingerprint recognition
Figure 3.10: Minutia represented by its spatial coordinates and angle.
3.1.3 Fingerprint Matching
In the matching step, features extracted from the input fingerprint are compared against
those in a template, which represents a single user (retrieved from the system database
based on the claimed identity). The result of such a procedure is either a degree
of similarity (also called matching score) or an acceptance/rejection decision. There
are fingerprint matching techniques that directly compare gray-scale images (or sub-
images) using correlation-based methods, so that the fingerprint template coincides
with the gray-scale image. However, most of the fingerprint matching algorithms use
features which are extracted from the gray-scale image, as mentioned in Section 3.1.2.
A large number of approaches for fingerprint matching can be found in literature.
They can be classified into: i) correlation-based approaches, ii) minutiae-based ap-
proaches, and iii) ridge or texture-based approaches.
• In the correlation-based approaches, the fingerprint images are superimposed and
the gray-scale images are directly compared using a measure of correlation. Due
to non-linear distortion, different impressions of the same finger may result in dif-
ferences of the global structure, making the comparison unreliable. In addition,
computing the correlation between two fingerprint images is computationally ex-
pensive. To deal with these problems, correlation can be computed only in certain
local regions of the image which can be selected following several criteria. Also,
to speed up the process, correlation can be computed in the Fourier domain or
using heuristic approaches which allow to reduce the number of computational
operations.
• Minutiae-based approaches are the most popular and widely used methods for
fingerprint matching, since they are analogous with the way that forensic experts
57

3. QUALITY ASSESSMENT OF FINGERPRINT IMAGES
Figure 3.11: Alignment between minutiae of two fingerprints. Figure ex-tracted from Jain et al. (1997a).
compare fingerprints. A fingerprint is modeled as a set of minutiae, which are
usually represented by its spatial coordinates and the angle between the tan-
gent to the ridge line at the minutiae position and the horizontal or vertical axis
(Figure 3.10). The minutiae sets of the two fingerprints to be compared are
first aligned, requiring displacement and rotation to be computed, as depicted in
Figure 3.11 (some approaches also compute scaling and other distortion-tolerant
transformations). This involves a minimization problem, the complexity of which
can be reduced in various ways (Chikkerur and Ratha, 2005). Once aligned, cor-
responding minutiae at similar positions in both fingerprints are looked for. A
region of tolerance around the minutiae position is defined in order to compensate
for the variations that may appear in the minutiae position due to noise and dis-
tortion. Likewise, differences in angle between corresponding minutia points are
tolerated. Other approaches use local minutia matching, which means combin-
ing comparisons of local minutia configurations. These kind of techniques relax
global spatial relationships which are highly distinctive (Maltoni et al., 2003) but
naturally more vulnerable to nonlinear deformations. Some matching approaches
combine both techniques by first carrying out a fast local matching and then, if
the two fingerprints match at local level, consolidating the matching at global
level.
• Unfortunately, minutiae are known to be unreliably extracted in low image quality
conditions. For this and other reasons, alternative features have been proposed
in literature as an alternative to minutiae (or to be used in conjunction with
58

3.1 Automatic fingerprint recognition
Figure 3.12: Texture information based on local orientation. Figure extractedfrom Munoz-Serrano (2004).
minutiae) (Maltoni et al., 2003). The alternative feature most widely studied
for fingerprint matching is the texture information. The fingerprint structure
consists of periodical repetitions of a pattern of ridges and valleys that can be
characterized by its local orientation, frequency, symmetry, etc. In Figure 3.12,
ridges with different local orientations are extracted from a fingerprint image.
Texture information is less discriminative than minutiae, but more reliable under
low quality conditions (Fierrez-Aguilar et al., 2005b).
3.1.4 Issues and Challenges
One of the biggest challenges of fingerprint recognition is the high variability commonly
found between different impressions of the same finger. This variability is known as
intra-class variability and is caused by factors like displacement or rotation between
different acquisitions, partial overlap (specially in sensors of small area), noise in the
sensor (for example, residues from previous acquisitions), etc. Some examples are shown
59

3. QUALITY ASSESSMENT OF FINGERPRINT IMAGES
(a) Partial overlap (b) Rotation or displacement
Figure 3.13: Examples of intra-class variability in fingerprints. Figure ex-tracted from Simon-Zorita (2003).
in Figure 3.13. Fingerprint matching remains as a challenging pattern recognition
problem due to the difficulty in matching fingerprints affected by one or several of the
mentioned factors (Maltoni et al., 2003).
A successful approach to enhance the performance of a fingerprint verification sys-
tem is to combine the results of different recognition algorithms. A number of simple
fusion rules and complex trained fusion rules have been proposed in the literature (Bi-
gun et al., 1997; Kittler et al., 1998; Snelick et al., 2005). Examples for combining
minutia- and texture-based approaches are to be found in Alonso-Fernandez et al.
(2008a); Fierrez-Aguilar et al. (2006); Marcialis and Roli (2005); Ross et al. (2003).
Also, a comprehensive study of the combination of different fingerprint recognition sys-
tems is done in Fierrez-Aguilar et al. (2005c). However, it has been found that simple
fusion approaches are not always outperformed by more complex fusion approaches,
calling for further studies of the subject.
Another recent issue in fingerprint recognition is the use of multiple sensors, ei-
ther for sensor fusion (Marcialis and Roli, 2004) or for sensor interoperability (Alonso-
Fernandez et al., 2006c; Ross and Jain, 2004). Fusion of sensors offers some important
potentialities (Marcialis and Roli, 2004): i) the overall performance can be improved
substantially, ii) population coverage can be improved by reducing enrollment and ver-
ification failures, and iii) it may naturally resist spoofing attempts against biometric
systems. Regarding sensor interoperability, most biometric systems are designed under
the assumption that the data to be compared is obtained uniquely and the same for
every sensor, thus being restricted in their ability to match or compare biometric data
originating from different sensors in practise. As a result, changing the sensor may af-
fect the performance of the system. Recent progress has been made in the development
60

3.1 Automatic fingerprint recognition
of common data-exchange formats to facilitate the exchange of feature sets between
vendors (CBEFF, 2001). However, little effort has been invested in the development
of algorithms to alleviate the problem of sensor interoperability. Some approaches to
handle this problem are given in Ross and Jain (2004), one example of which is the
normalization of raw data and extracted features. Interoperability studies have been
included in vendor and algorithm competitions, as in BMEC (2007); Grother et al.
(2005).
Due to the low cost and reduced size of new fingerprint sensors, several devices of
daily use already include fingerprint sensors embedded (e.g. mobile telephones, PC
peripherals, PDAs, etc., see Figure 3.2). However, using small-area sensors implies
having less information available from a fingerprint and little overlap between different
acquisitions of the same finger, which has great impact on the performance of the
recognition system (Maltoni et al., 2003). Some fingerprint sensors are equipped with
mechanical guides in order to constrain the finger position. Another alternative is to
perform several acquisitions of a finger, gathering (partially) overlapping information
during the enrollment, and reconstruct a full fingerprint image.
Biometric systems are also vulnerable to attacks (Uludag and Jain, 2004). Recent
studies have shown the vulnerability of fingerprint systems to fake fingerprints (Galbally-
Herrero et al., 2006; Matsumoto et al., 2002; Putte and Keuning, 2000; Ratha et al.,
2001a). Surprisingly, fake biometric input to the sensor is shown to be quite successful.
Liveness detection could be a solution and it is receiving great attention (Antonelli
et al., 2006; Derakhshani et al., 2003; Schuckers et al., 2004). It has been also shown
that the matching score is a valuable information for the attacker (Martinez-Diaz et al.,
2006; Ratha et al., 2001b; Uludag and Jain, 2004). Using the feedback provided by this
score, signals in the channels of the verification system can be modified iteratively and
the system is compromised in a number of iterations. A solution could be given by
concealing the matching score and just releasing an acceptance/rejection decision, but
this may not be suitable in certain biometric systems (Uludag and Jain, 2004).
With the advances in fingerprint sensing technology, new high resolution sensors are
able to acquire ridge pores and even perspiration activities of the pores. These features
can provide additional discriminative information to existing fingerprint recognition
systems, as studied in Chen and Jain (2007); Jain et al. (2007). In addition, acquiring
perspiration activities of the pores can be used to detect spoofing attacks.
61

3. QUALITY ASSESSMENT OF FINGERPRINT IMAGES
3.2 Literature review of algorithms for fingerprint image
quality estimation
3.2.1 Assessing the quality of fingerprint images
Fingerprint quality can be defined as a measure of the clarity of ridges and valleys and
the “extractability” of the features used for identification (such as minutiae) (Chen
et al., 2005). In good quality images, ridges and valleys flow smoothly in a locally
constant direction (Hong et al., 1998).
Yao et al. (2004) define a number of factors that contribute to poor fingerprint
quality images (some examples are shown in Figure 3.14):
• Inconsistent contact caused by the 3D-2D mapping performed in fingerprint ac-
quisition, which is typically uncontrolled and thus, it results in different mapped
regions across different impressions due to variability in fingerprint placement,
rotation and pressure.
• Nonuniform contact of the ridge-valley structure due to factors like dryness (too
little ridge contact), humidity (neighboring ridges touching each other), sweat,
dirt, etc., resulting in “noisy” images and feature extraction artifacts.
• Irreproducible contact due to injuries of the finger that change the ridge struc-
ture either temporarily or permanently, for example caused by manual works,
accidents, etc.
• Noise introduced by the act of sensing due to residual dirt or fingerprints on the
sensor surface, shadows in optical sensors, electrical noise in capacitive sensors,
etc.
• Distortion of the sensed finger due to imperfect imaging conditions.
These factors are caused by a number of reasons (Joun et al., 2003) that sometimes
cannot be avoided and/or vary along time, as mentioned in Section 2.2. For the case
of fingerprints they are:
• Physiological reasons: age, amputation, diseases, injuries, skin dryness, etc.
• Behavioral reasons: occupation (manual work), stress, motivation, cooperativity,
hobbies, fingernails, rings, false nails, finger positioning, etc.
62
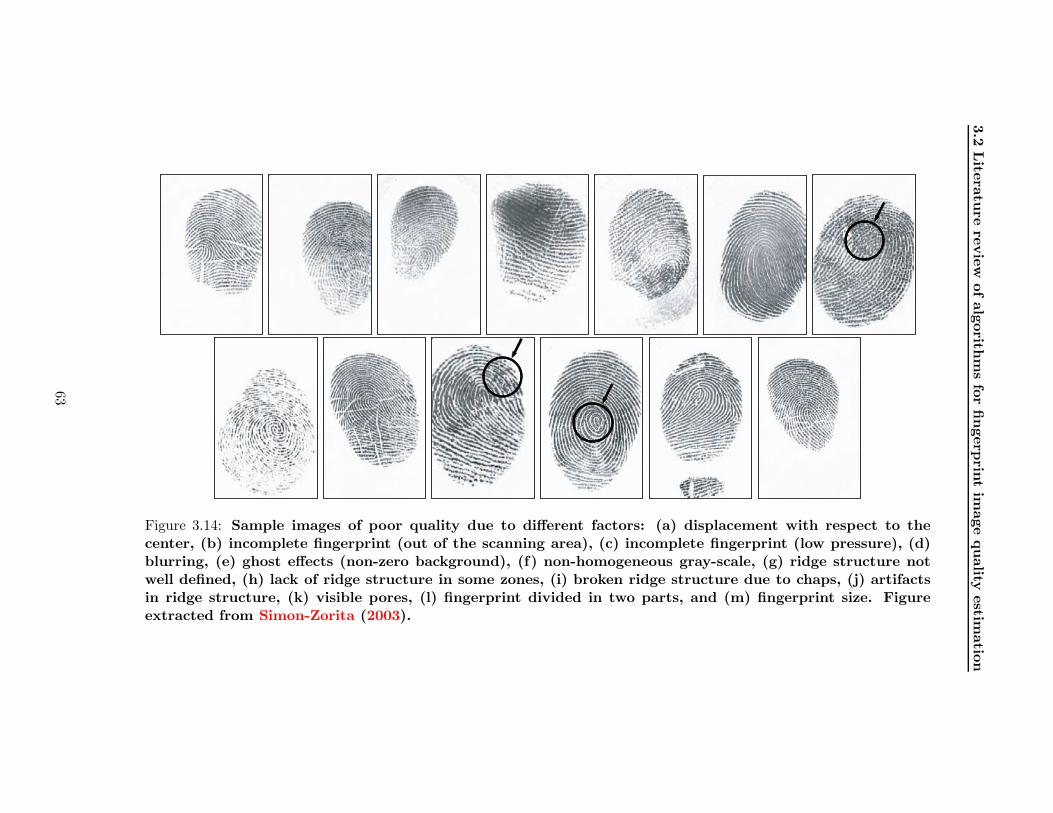
3.2
Lite
ratu
rere
vie
wofalg
orith
ms
for
fingerp
rint
image
quality
estim
atio
n
Figure 3.14: Sample images of poor quality due to different factors: (a) displacement with respect to thecenter, (b) incomplete fingerprint (out of the scanning area), (c) incomplete fingerprint (low pressure), (d)blurring, (e) ghost effects (non-zero background), (f) non-homogeneous gray-scale, (g) ridge structure notwell defined, (h) lack of ridge structure in some zones, (i) broken ridge structure due to chaps, (j) artifactsin ridge structure, (k) visible pores, (l) fingerprint divided in two parts, and (m) fingerprint size. Figureextracted from Simon-Zorita (2003).
63

3. QUALITY ASSESSMENT OF FINGERPRINT IMAGES
• Environmental reasons: light level, weather, humidity, etc.
• Operational reasons: sensor dirt, residual prints, feedback, ease of use, ergonomics,
user familiarity, time ageing, etc.
• Sensor and hardware reasons: type and quality of sensor (size, noise, etc.)
Once the quality of a given fingerprint image is assessed, a number of strategies
can be adopted to overcome the impact of low quality fingerprints as we described in
Section 2.6. For instance, asking the user for a new sample (Grother et al., 2005).
Other strategy is to compensate for the image quality effects in the feature extrac-
tion/matching steps of the recognition system. This is followed by a number of studies,
for example exploiting the signal quality in the segmentation step (Shi et al., 2004), in
the matching step (Chen et al., 2005), or performing quality-based fusion of different
matchers and/or traits at the match score level (Baker and Maurer, 2005; Bigun et al.,
1997; Fierrez-Aguilar et al., 2006, 2005e; Nandakumar et al., 2006; Toh et al., 2004) so
as the weights for the fusion are selected to allow better quality samples to dominate
the fusion.
3.2.2 Fingerprint image quality estimation methods
A number of approaches for fingerprint image quality computation have been described
in the literature. Existing methods assess fingerprint image quality by measuring one or
more of the following properties, see Figure 3.15: ridge strength or directionality, ridge
continuity, ridge clarity, integrity of the ridge-valley structure, or estimated verification
performance when using the image at hand. A number of sources of information are
used to measure these properties: i) angle information provided by the direction field,
ii) Gabor filters, which represent another implementation of the direction angle (Bigun,
2006), iii) pixel intensity of the gray-scale image, iv) power spectrum, and v) Neural
Networks.
Existing approaches for fingerprint image quality estimation can be divided into:
i) those that use local features of the image extracted from non-overlapped blocks;
ii) those that use global features of the image, analyzing it in a holistic manner; and
iii) those that address the problem of quality assessment as a classification problem.
They are described in Sections 3.2.3, 3.2.4 and 3.2.5, respectively. Also, a summary of
existing local and global fingerprint quality measures, including a brief description, is
shown in Tables 3.1 and 3.2, respectively.
64

3.2 Literature review of algorithms for fingerprint image quality estimation
Fingerprint Image Quality Estimation Methods
SourceOrientation field
Gabor filters
Pixel intensity
Power spectrum
Classifiers
PropertyRidge strength
Ridge continuity
Ridge clarity
Ridge integrity
Verification performance
Fingerprint Image Quality Estimation Methods
SourceOrientation field
Gabor filters
Pixel intensity
Power spectrum
Classifiers
PropertyRidge strength
Ridge continuity
Ridge clarity
Ridge integrity
Verification performance
Figure 3.15: Taxonomy of existing fingerprint image quality estimation meth-ods.
The quality measures presented here are aimed to evaluate the utility of fingerprint
images. There are also works aimed to study their fidelity, which is not considered in
this Ph.D. Thesis. The fidelity of quality metrics is studied by Cappelli et al. (2006a);
Van der Weken et al. (2007); Wilson et al. (2000). Wilson et al. (2000) have studied the
effects of image resolution in the matching accuracy, whereas Cappelli et al. (2006a)
have studied the correlation between the quality characteristics of a fingerprint scanner
with the performance they can assure when the acquired images are matched by a
recognition algorithm. In Van der Weken et al. (2007), we can find a number of quality
metrics aimed at objectively assess the quality of an image in terms of the similarity
between a reference image and a degraded version of it.
3.2.3 Methods based on local features
Methods that rely on local features usually divide the image into non-overlapped square
blocks and extract features from each block. Blocks are then classified into groups of
different quality. A local measure of quality is finally generated. This local measure can
be the percentage of blocks classified with “high” or “low” quality, or an elaborated
combination. Some methods assign a relative weight to each block based on its distance
from the centroid of the fingerprint image, since blocks near the centroid are supposed
to provide more reliable information (Chen et al., 2005; Ratha and Bolle, 2004).
3.2.3.1 Based on the local direction
This group of methods use the local direction information provided by the direction
field (Bigun and Granlund, 1987) to compute several local features in each block. For
a comprehensive introduction of the theory and applications of direction fields we refer
the reader to Bigun (2006).
65

3. QUALITY ASSESSMENT OF FINGERPRINT IMAGES
SOURCE: LOCAL DIRECTION
Orientation Certainty Level (Lim et al., 2002)Orientation strength measure computed from the gradient of the gray level image
Ridge frequency, ridge thickness, ridge-to-valley thickness (Lim et al., 2002)Computed from the sinusoid that models ridges/valleys in the direction normal to ridge flow
Local Orientation (Chen et al., 2004)Average absolute difference of local orientation with the surrounding blocks
Spatial Coherence (Chen et al., 2005)Direction coherence measure computed from the gradient of the gray level image
Symmetry features (Fronthaler et al., 2006)Correlation between linear and parabolic symmetry in a fingerprint image
SOURCE: GABOR FILTERS
Gabor features (Shen et al., 2001)Standard deviation of m filter responses with different directions
SOURCE: PIXEL INTENSITY
Directionality (Ratha and Bolle, 2004)Minimum sum of intensity differences between a pixel (i, j) and l pixels selected along a linesegment centered at (i, j), computed for n different directions of the line segment
Variance and local contrast (Joun et al., 2003)
Mean, variation, contrast and eccentric moment (Shi et al., 2004)
Clustering Factor (Lim et al., 2004)Degree to which similar pixels (i.e. ridges or valleys) cluster in the nearby region
Local Clarity (Chen et al., 2004)Overlapping area of the gray level distributions of segmented ridges and valleys
SOURCE: POWER SPECTRUM
DFT of the sinusoid that models ridges and valleys (Lim et al., 2004)
SOURCE: COMBINATION OF LOCAL FEATURES
Amplitude, frequency and variance of the sinusoid that models
ridges and valleys (Hong et al., 1998)
Direction map, low contrast map, low flow map and high curve map (Watson et al., 2004)
Table 3.1: Summary of existing fingerprint quality measures based on localfeatures.
66

3.2 Literature review of algorithms for fingerprint image quality estimation
SOURCE: DIRECTION FIELD
Continuity of the direction field (Lim et al., 2002)Detection of abrupt direction changes between blocks
Uniformity of the frequency field (Lim et al., 2002)Standard deviation of the ridge-to-valley thickness ratio
SOURCE: POWER SPECTRUM
Energy concentration in ring-shaped regions of the spectrum (Chen et al., 2005)
Table 3.2: Summary of existing fingerprint quality measures based on globalfeatures.
The method presented by Lim et al. (2002) computes the following features in
each block: Orientation Certainty Level (OCL), ridge frequency, ridge thickness and
ridge-to-valley thickness ratio. Blocks are then labeled as “good”, “undetermined”,
“bad” or “blank” by setting thresholds for the four features. A local quality score
SL is finally computed based on the total number of “good”, “undetermined” and
“bad” quality image blocks in the image. The Orientation Certainty Level measures
the energy concentration along the dominant direction of ridges. It is computed as
the ratio between the two eigenvalues of the covariance matrix of the gradient vector.
Ridge frequency is used to detect abnormal ridges that are too close or too far whereas
ridge thickness and ridge-to-valley thickness ratio are used to detect ridges that are
unreasonably thick or thin. An example of Orientation Certainty Level computation is
shown in Figure 3.16 for two fingerprints of different quality.
The Orientation Certainty Level is also used by Lim et al. (2004) to detect high
curvature regions of the image. Although high curvature has no direct relationship
with the quality of a fingerprint image (e.g. core and delta points), it could help to
detect regions with invalid curvature. The curvature of a block is captured by (Lim
et al., 2004) by combining the orientations of four quadrants and each of their Certainty
Levels. Both measures are used together to distinguish between blocks with core/deltas
and blocks with invalid curvature due to low quality.
The method presented by Chen et al. (2004) computes the average absolute differ-
ence of local orientation with the surrounding blocks, resulting in a Local Orientation
Quality measure (LOQ). A Global Orientation Quality Score GOQS is finally com-
puted by averaging all the Local Orientation Quality scores of the image. In high quality
images, it is expected that ridge direction changes smoothly across the whole image,
67

3. QUALITY ASSESSMENT OF FINGERPRINT IMAGES
(a) (b)
Figure 3.16: Computation of the Orientation Certainty Level (OCL) for twofingerprints of different quality. Panel (a) are the input fingerprint images.Panel (b) are the block-wise values of the OCL; blocks with brighter colorindicate higher quality in the region.
thus the GOQS provides information about how smoothly local direction changes from
block to block. An example of Local Orientation Quality computation is shown in
Figure 3.17 for two fingerprints of different quality.
Recently, Chen et al. (2005) proposed a local quality index which measures the local
coherence of the intensity gradient, reflecting the clarity of local ridge-valley direction
in each block. A local quality score QS is finally computed by averaging the coherence
of each block.
The method presented by Fronthaler et al. (2006) employs symmetry features for
fingerprint quality assessment. In this approach, the orientation tensor (Bigun et al.,
2004) of a fingerprint image is decomposed into two symmetry representations, allow-
ing to draw conclusions on its quality. On one hand, a coherent ridge flow has linear
symmetry and is thus modeled by symmetry features of order 0. On the other hand,
points of high curvature like minutia, core and delta points exhibit parabolic symmetry
and are therefore represented by symmetry features of order 1. Figure 3.18 depicts
these two symmetry representations for two fingerprints of different quality. In a fur-
ther step, the two symmetries are combined and averaged within small non-overlapped
blocks, yielding Sb. To determine the final local quality Qb, Sb is negatively weighted
with the block-wise correlation between the two involved symmetries. A large negative
correlation is desirable in terms of quality, because this suggests well separated sym-
metries. The local quality Qb is also visualized in the last column of Figure 3.18. An
overall quality measure is derived by averaging over the foreground blocks of Qb.
68

3.2 Literature review of algorithms for fingerprint image quality estimation
(a) (b)
Figure 3.17: Computation of the Local Orientation Quality (LOQ) for twofingerprints of different quality. Panel (a) are the direction fields of theimages shown in Figure 3.16a. Panel (b) are the block-wise values of theaverage absolute difference of local orientation with the surrounding blocks;blocks with brighter color indicate higher difference value and thus, lowerquality.
3.2.3.2 Based on Gabor filters
Gabor filters can be viewed as a filter-bank that can represent the local frequencies.
Two dimensional quadrature mirror filters are close akins of Gabor filters (Knutsson,
1982). Gabor filters were introduced to image processing by Daugman (1988), and
both filter families represent another implementation of the local-direction fields (Bi-
gun, 2006), though they are frequently used stand-alone, without a local-direction field
interpretation.
Shen et al. (2001) proposed a method based on Gabor features. Each block is
filtered using a Gabor filter with m different directions. If a block has high quality (i.e.
strong ridge direction), one or several filter responses are larger than the others. In poor
quality blocks or background blocks, the m filter responses are similar. The standard
deviation of the m filter responses is then used to determine the quality of each block
(“good” and “poor”). A quality index QI of the whole image is finally computed as the
percentage of foreground blocks marked as “good”. If QI is lower than a predefined
threshold, the image is rejected. Poor quality images are additionally categorized as
“smudged” or “dry”. An example of quality estimation using Gabor filters is shown in
Figure 3.19 for two fingerprints of different quality.
69

3. QUALITY ASSESSMENT OF FINGERPRINT IMAGES
(a) Low quality fingerprint
(b) High quality fingerprint
Figure 3.18: Estimation of fingerprint quality using symmetry features. Fig-ure shows the decomposition of two fingerprints of different quality intolinear and parabolic symmetry (second and third column, respectively).The final local quality estimation in blocks is depicted in the fourth column(blocks with brighter color indicate higher quality in the region).
3.2.3.3 Based on pixel intensity
The method described by Ratha and Bolle (2004) classifies blocks into “directional”
and “non-directional” as follows. The sum of intensity differences Dd (i, j) between a
pixel (i, j) and l pixels selected along a line segment of direction d centered at (i, j)
is computed for n different directions. For each different direction d, the histogram of
Dd (i, j) values is obtained for all pixels within a given foreground block. If only one of
the n histograms has a maximum value greater than a prominent threshold, the block
is marked as “directional”. Otherwise, the block is marked as “non-directional”. An
overall quality score Q is finally computed. A relative weight wi is assigned to each
foreground block based on its distance to the centroid of the foreground. The quality
70
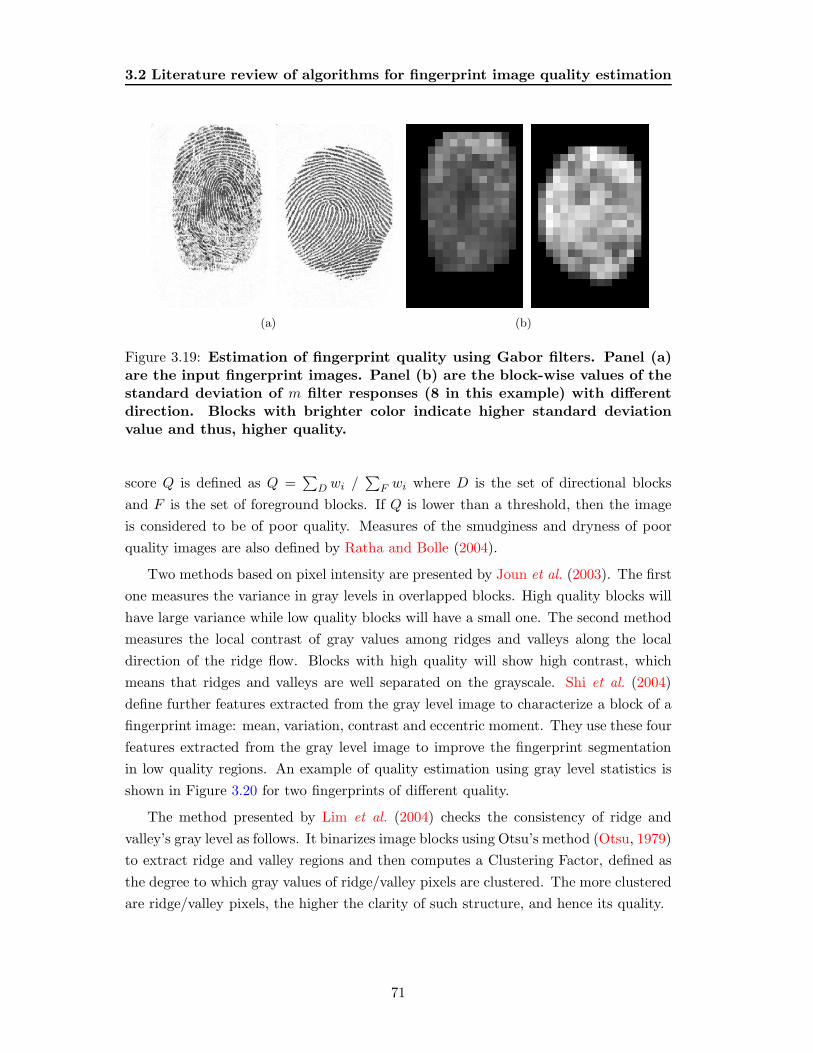
3.2 Literature review of algorithms for fingerprint image quality estimation
(a) (b)
Figure 3.19: Estimation of fingerprint quality using Gabor filters. Panel (a)are the input fingerprint images. Panel (b) are the block-wise values of thestandard deviation of m filter responses (8 in this example) with differentdirection. Blocks with brighter color indicate higher standard deviationvalue and thus, higher quality.
score Q is defined as Q =∑
D wi /∑
F wi where D is the set of directional blocks
and F is the set of foreground blocks. If Q is lower than a threshold, then the image
is considered to be of poor quality. Measures of the smudginess and dryness of poor
quality images are also defined by Ratha and Bolle (2004).
Two methods based on pixel intensity are presented by Joun et al. (2003). The first
one measures the variance in gray levels in overlapped blocks. High quality blocks will
have large variance while low quality blocks will have a small one. The second method
measures the local contrast of gray values among ridges and valleys along the local
direction of the ridge flow. Blocks with high quality will show high contrast, which
means that ridges and valleys are well separated on the grayscale. Shi et al. (2004)
define further features extracted from the gray level image to characterize a block of a
fingerprint image: mean, variation, contrast and eccentric moment. They use these four
features extracted from the gray level image to improve the fingerprint segmentation
in low quality regions. An example of quality estimation using gray level statistics is
shown in Figure 3.20 for two fingerprints of different quality.
The method presented by Lim et al. (2004) checks the consistency of ridge and
valley’s gray level as follows. It binarizes image blocks using Otsu’s method (Otsu, 1979)
to extract ridge and valley regions and then computes a Clustering Factor, defined as
the degree to which gray values of ridge/valley pixels are clustered. The more clustered
are ridge/valley pixels, the higher the clarity of such structure, and hence its quality.
71
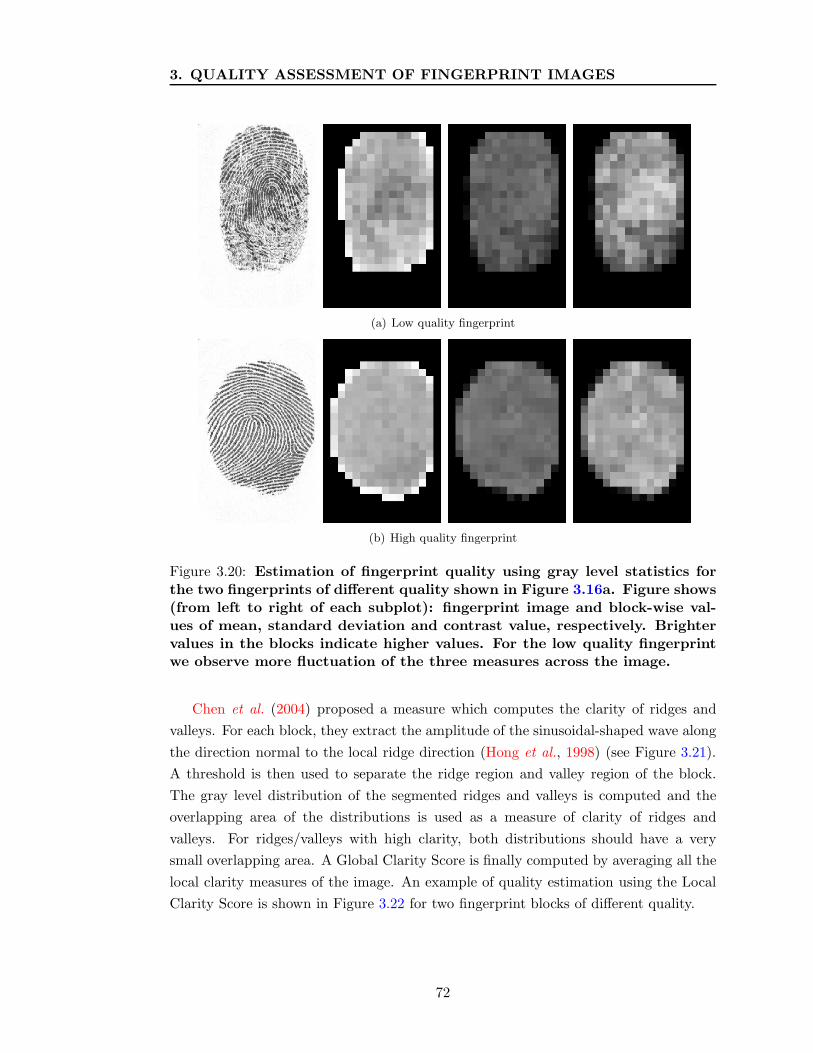
3. QUALITY ASSESSMENT OF FINGERPRINT IMAGES
(a) Low quality fingerprint
(b) High quality fingerprint
Figure 3.20: Estimation of fingerprint quality using gray level statistics forthe two fingerprints of different quality shown in Figure 3.16a. Figure shows(from left to right of each subplot): fingerprint image and block-wise val-ues of mean, standard deviation and contrast value, respectively. Brightervalues in the blocks indicate higher values. For the low quality fingerprintwe observe more fluctuation of the three measures across the image.
Chen et al. (2004) proposed a measure which computes the clarity of ridges and
valleys. For each block, they extract the amplitude of the sinusoidal-shaped wave along
the direction normal to the local ridge direction (Hong et al., 1998) (see Figure 3.21).
A threshold is then used to separate the ridge region and valley region of the block.
The gray level distribution of the segmented ridges and valleys is computed and the
overlapping area of the distributions is used as a measure of clarity of ridges and
valleys. For ridges/valleys with high clarity, both distributions should have a very
small overlapping area. A Global Clarity Score is finally computed by averaging all the
local clarity measures of the image. An example of quality estimation using the Local
Clarity Score is shown in Figure 3.22 for two fingerprint blocks of different quality.
72

3.2 Literature review of algorithms for fingerprint image quality estimation
Figure 3.21: Modeling of ridges and valleys as a sinusoid.
3.2.3.4 Based on Power Spectrum
The method presented by Lim et al. (2004) extracts the sinusoidal-shaped wave along
the direction normal to the local ridge direction (Hong et al., 1998) (see Figure 3.21),
and then computes its Discrete Fourier Transform. Low quality blocks will not exhibit
an obvious dominant frequency, or it will be out of the normal ridge frequency range.
3.2.3.5 Based on a combination of local features
Hong et al. (1998) modeled ridges and valleys as a sinusoidal-shaped wave along the
direction normal to the local ridge direction (see Figure 3.21) and extracted the ampli-
tude, frequency and variance of the sinusoid. Based on these parameters, they classify
blocks as recoverable and unrecoverable.
The minutia detection (MINDTCT) package of the NIST Fingerprint Image Soft-
ware (NFIS) (Watson et al., 2004) locally analyzes the fingerprint image and generates
an image quality map. The quality of each block is assessed by computing several maps:
direction map, low contrast, low flow and high curve. The direction map is indicating
areas of the image with sufficient ridge structure. The low contrast map is marking
blocks with weak contrast, which are considered as background blocks. The low flow
map is representing blocks that could not be assigned a dominant ridge flow. The high
curve map is marking blocks that are in high curvature areas, which usually are core
and delta regions, but also other low quality regions. These maps are integrated into
one quality map, containing 5 levels of quality (an example is shown in Figure 3.23 for
two fingerprints of different quality).
73

3. QUALITY ASSESSMENT OF FINGERPRINT IMAGES
High Q block
Low Q block
(a)
0 50 100 150 200 2500
20
40
60
80
100
120
140
Gray level
Fre
qu
en
cy
Low Q block
Ridge
distribution
Valley distribution
0 50 100 150 200 2500
20
40
60
80
100
120
140
Gray level
Fre
qu
en
cy
High Q block
Ridge
distribution
Valley
distribution
(b)
Figure 3.22: Computation of the Local Clarity Score for two fingerprint blocksof different quality. Panel (a) are the fingerprint blocks. Panel (b) are thegray level distributions of the segmented ridges and valleys. The degree ofoverlapping for the low and high quality block is 0.22 and 0.10, respectively.
3.2.4 Methods based on global features
Methods that rely on global features analyze the image in a holistic manner and com-
pute a global measure of quality based on the features extracted.
3.2.4.1 Based on the direction field
Lim et al. (2002) presented two features to analyze the global structure of a fingerprint
image. Both of them use the local direction information provided by the direction field,
which is estimated in non-overlapping blocks. The first feature checks the continuity
of the direction field. Abrupt direction changes between blocks are accumulated and
mapped into a global direction score. As we can observe in Figure 3.17, ridge direction
changes smoothly across the whole image in case of high quality. The second feature
checks the uniformity of the frequency field (Maltoni et al., 2003). This is done by
computing the standard deviation of the ridge-to-valley thickness ratio and mapping it
into a global score, as large deviation indicates low image quality.
3.2.4.2 Based on Power Spectrum
Global structure is analyzed by Chen et al. (2005) by computing the 2D Discrete
Fourier Transform (DFT). For a fingerprint image, the ridge frequency values lie within
74

3.2 Literature review of algorithms for fingerprint image quality estimation
LOW CONTRAST MAP LOW FLOW MAP HIGH CURVE MAP QUALITY MAP
(a) Low quality fingerprint
LOW CONTRAST MAP LOW FLOW MAP HIGH CURVE MAP QUALITY MAP
(b) High quality fingerprint
Figure 3.23: Fingerprint quality maps provided by the minutia detectionpackage of the NIST Fingerprint Image Software for two fingerprints ofdifferent quality.
a certain range. A region of interest (ROI) of the spectrum is defined as an annular
region with radius ranging between the minimum and maximum typical ridge frequency
values. As the fingerprint image quality increases, the energy will be more concentrated
within the ROI, see Figure 3.24a. The global quality index QF defined by Chen et al.
(2005) is a measure of the energy concentration in ring-shaped regions of the ROI.
For this purpose, a set of bandpass filters is employed to extract the energy in each
frequency band. High quality images will have the energy concentrated in few bands
while poor ones will have a more diffused distribution. The energy concentration is
measured using the entropy. An example of quality estimation using the global quality
index QF is shown in Figure 3.24 for two fingerprints of different quality.
75

3. QUALITY ASSESSMENT OF FINGERPRINT IMAGES
(a) Power spectrum
0 5 10 15 20 25 300
0.05
0.1
0.15
0.2
0.25
Filter band
No
rma
lize
d e
ne
rgy High Q image
Low Q image
(b) Energy concentration
Figure 3.24: Computation of the energy concentration in the power spectrumfor two fingerprints of different quality. Panel (a) are the power spectra ofthe images shown in Figure 3.16a. Panel (b) shows the energy distributionsin the region of interest. The quality values for the low and high qualityimage are 0.35 and 0.88 respectively.
3.2.5 Methods based on classifiers
The method that uses classifiers (Tabassi and Wilson, 2005; Tabassi et al., 2004) de-
fines the quality measure as a degree of separation between the match and non-match
distributions of a given fingerprint. This can be seen as a prediction of the matcher
performance. Tabassi et al. Tabassi and Wilson (2005); Tabassi et al. (2004) extract
the fingerprint features (minutiae in this case) and then compute the quality of each
extracted feature to estimate the quality of the fingerprint image, which is defined as
stated above.
Let s (xii) be the similarity score of a genuine comparison (match) corresponding
to the subject i, and s (xji), i 6= j be the similarity score of an impostor comparison
(non-match) between subject i and impostor j. Quality QN of a biometric sample xii
is then defined as the prediction of
o (xii) =s (xii) − E [s (xji)]
σ (s (xji))(3.1)
where E[.] is mathematical expectation and σ(.) is standard deviation. Eq. (3.1) is a
measure of separation between the match and the non-match distributions, which is
supposed to be higher as image quality increases. The prediction of o (xii) is done by
using a neural network. Output of the neural network is a number that classifies the
quality of the fingerprint into 5 values: 5 (poor), 4 (fair), 3 (good), 2 (very good) and
1 (excellent).
76

3.3 Fingerprint matcher based on minutiae
Input Fingerprint
Generate image maps Binarize image
Detect minutiaeRemove false minutiae
Count neighbor ridges Assess minutiae quality
Output minutiae file
Input Fingerprint
Generate image maps Binarize image
Detect minutiaeRemove false minutiae
Count neighbor ridges Assess minutiae quality
Output minutiae file
Figure 3.25: System architecture of the MINDTCT package of the NISTFingerprint Image Software 2 (NFIS2).
3.3 Fingerprint matcher based on minutiae
As fingerprint minutiae-based matcher for our study, we use the matcher included in
the freely available NIST Fingerprint Image Software 2 - NFIS2 (Watson et al., 2004).
NFIS2 contains software technology, developed for the Federal Bureau of Investigation
(FBI), designed to facilitate and support the automated manipulation and processing
of fingerprint images. Source code for over 50 different utilities or packages and an
extensive User’s Guide are distributed on CD-ROM free of charge (Watson et al.,
2004). For our evaluation and tests with NFIS2, we have used the following packages:
MINDTCT for minutiae extraction, and BOZORTH3 for fingerprint matching.
MINDTCT takes a fingerprint image and locates all minutiae in the image, assigning
to each minutia point its location, orientation, type, and quality. The architecture of
MINDTCT is shown in Figure 3.25 and it can be divided in the following stages:
1. Generation of image quality map.
2. Binarization.
3. Minutiae detection.
4. Removal of false minutiae, including islands, lakes, holes, minutiae in regions of
poor image quality, side minutiae, hooks, overlaps, minutiae that are too wide,
and minutiae that are too narrow (pores).
5. Counting of ridges between a minutia point and its nearest neighbors.
6. Minutiae quality assessment.
77

3. QUALITY ASSESSMENT OF FINGERPRINT IMAGES
Because of the variation of image quality within a fingerprint, MINDTCT analyzes
the image and determines areas that are degraded. Several characteristics are measured,
including regions of low contrast, incoherent ridge flow, and high curvature. These
three conditions represent unstable areas in the image where minutiae detection is
unreliable, and together they are used to represent levels of quality in the image. The
image quality map of the stage 1 is generated integrating these three characteristics.
Images are divided into non-overlapping blocks, where one out of five levels of quality
is assigned to each block.
The minutiae detection step scans the binary image of the fingerprint, identifying
local pixel patterns that indicate the ending or splitting of a ridge. A set of minutia
patterns is used to detect candidate minutia points. Subsequently, false minutiae are
removed and the remaining candidates are considered as the true minutiae of the image.
Fingerprint minutiae marchers often use other information in addition to just the points
themselves. Apart from minutia’s position, direction, and type, MINDTCT computes
ridge counts between a minutia point and each of its nearest neighbors.
In the last stage, MINDTCT assigns a quality/reliability measure to each detected
minutia point. Even after performing the removal stage, false minutiae potentially
remain in the list. Two factors are combined to produce a quality measure for each de-
tected minutia point. The first factor is taken directly from the location of the minutia
point within the quality map generated in the stage 1. The second factor is based on
simple pixel intensity statistics (mean and standard deviation) within the immediate
neighborhood of the minutia point. A high quality region within a fingerprint image is
expected to have significant contrast that will cover the full grayscale spectrum (Watson
et al., 2004).
The BOZORTH3 matching algorithm computes a match score between the minutiae
from any two fingerprints to help determine if they are from the same finger. The
BOZORTH3 matcher uses only the location and orientation of the minutia points to
match the fingerprints, and it is rotation and translation invariant. For fingerprint
matching, compatibility between minutiae pairs of the two images are assessed by
comparing the following measures : i) distance between the two minutiae and ii) angle
between each minutia’s orientation and the intervening line between both minutiae.
This process can be observed in Figure 3.26.
78

3.4 Fingerprint matcher based on ridge information
dij
mi
mj
αij
αji
Fingerprint 1
dklmk
ml
αkl
αlk
Fingerprint 2
dij
mi
mj
αij
αji
Fingerprint 1
dklmk
ml
αkl
αlk
Fingerprint 2
Compatibility between pairs (mi,mj) and (mk,ml)
if dij≈dkl and |αij-αji|≈|αkl-αlk|
Figure 3.26: Compatibility between minutiae pairs of two different finger-prints.
Figure 3.27: Processing steps of the ridge-based matcher. From left to right:original image, filtered image with filter orientation θ = 0 and FingerCode.Figure extracted from Munoz-Serrano (2004).
3.4 Fingerprint matcher based on ridge information
The ridge-based matcher (also referred to as texture-based) uses a set of Gabor filters
to capture the ridge strength (Fierrez-Aguilar et al., 2005b). The input fingerprint
image is tessellated into square cells, and the variance of the filter responses in each
cell across all filtered images is used as feature vector. This feature vector is called
FingerCode because of the similarity to previous research works (Daugman, 2004; Ross
et al., 2003). The automatic alignment is based on the system described in Ross et al.
(2002), in which the correlation between the two FingerCodes is computed, obtaining
the optimal offset. The ridge-based matcher is divided in two phases: i) extraction of
the FingerCode; and ii) matching of the FingerCodes.
No image enhancement is performed since Gabor filters extract information that is
in a specific (usually low-pass) band that is not affected from noise, to the same extent
79

3. QUALITY ASSESSMENT OF FINGERPRINT IMAGES
Figure 3.28: Biosec baseline fingerprint sensors.
as the original image is. The complete processing for extracting the FingerCode consist
in the following three steps:
• Convolution of the input fingerprint image with 8 Gabor filters, obtaining 8 fil-
tered images Fθ.
• Tessellation of the filtered images into equal-sized square disjoint cells.
• Extraction of the FingerCode.
For each cell of each filtered image Fθ, we compute the variance of the pixel intensities.
These standard deviation values constitute the FingerCode of a fingerprint image. A
sample fingerprint image, the resulting convolved image with a Gabor filter of orienta-
tion θ = 0◦, and its FingerCode are shown in Figure 3.27.
The sequence of steps for matching of two FingerCodes is: i) alignment of the
two fingerprints to be compared; and ii) similarity computation between the Finger-
Codes. The matching score is computed as the Euclidean distance between the two
FingerCodes. To determine the alignment between two fingerprints, we compute the 2D
correlation of the two FingerCodes (Ross et al., 2002). Correlation involves multiplying
corresponding entries between the two FingerCodes at all possible translation offsets,
and determining the sum, which is computed more efficiently in the Fourier domain.
The offset that results in the maximum sum is chosen to be the optimal alignment.
Every offset is properly weighted to account for the amount of overlap between the two
FingerCodes. It is worth noting that this procedure does not account for rotational off-
set between the two fingerprints. For the database used in this work, which is acquired
under realistic conditions, we have observed that typical rotations between different
impressions of the same fingerprint are compensated by using the tessellation.
80

3.5 Experimental framework
3.5 Experimental framework
3.5.1 Database and protocol
For the experiments in this chapter, we use the BioSec baseline corpus (Fierrez et al.,
2007). Data consists of 19, 200 fingerprint images acquired from 200 individuals in 2
acquisition sessions, separated typically by one to four weeks, using 3 different sensors.
The fingerprint sensors are:
• Capacitive sensor Authentec AES400, with an image size of 96 pixels width and
96 pixels height.
• Thermal sensor Atmel FCDEM04, with an image size of 400 pixels width and 496
pixels height.
• Optical sensor Biometrika FX2000, with an image size of 400 pixels width and
560 pixels height.
The capacitive sensor has a resolution of 250 dpi1, whereas the thermal and the
optical ones have a resolution of 500 dpi. They are shown in Figure 3.28. A total of 4
captures of the print of 4 fingers (right and left index and middle) were captured with
each of the 3 sensors, interleaving fingers between consecutive acquisitions. The total
number of fingerprint images is therefore 200 individuals × 2 sessions × 4 fingers × 4
captures = 6, 400 images per sensor. In Figure 3.29, some fingerprint samples from the
BioSec baseline corpus are shown.
The 200 subjects included in BioSec Baseline are further divided into: i) the devel-
opment set, including the first 25 and the last 25 individuals of the corpus, totaling 50
individuals; and ii) the test set, including the remaining 150 individuals. The develop-
ment set is used to tune the parameters of the different quality assessment algorithms.
No training of parameters is done on the test set. We consider the different fingers of
the test set as different users enrolled in the system, thus resulting in 150 × 4 = 600
users. For evaluation of the verification performance, the following matchings are de-
fined in the test set: a) genuine matchings: the 4 samples in the first session to the 4
samples in the second session, resulting in 150 individuals × 4 fingers × 4 templates
× 4 test images = 9, 600 genuine scores per sensor; and b) impostor matchings: the
first sample in the first session to the same sample of the remaining users, avoiding
symmetric matches, resulting in (150× 4)× (150× 4− 1)/2 = 179, 700 impostor scores
per sensor.
1The NIST-NFIQ quality measure and the NIST-NFIS2 package are developed for 500 dpi images,thus images from the capacitive sensor are first interpolated using bicubic interpolation.
81

3. QUALITY ASSESSMENT OF FINGERPRINT IMAGES
Figure 3.29: Example images from the BioSec baseline corpus. Fingerprintimages are plotted for the same finger for (i) capacitive sensor (top row),optical sensor (medium row), thermal sensor (bottom row), and (ii) threedifferent fingerprints, one per column.
3.5.2 Selected quality measures
Different measures have been selected from the literature in order to have a represen-
tative set. We have implemented at least one measure that make use of the different
features presented in Tables 3.1 and 3.2: direction information (local direction, Gabor
filters or global direction field), pixel intensity information and power spectrum infor-
mation. The measure that relies on direction information is the Orientation Certainty
Level (OCL) (Lim et al., 2002), the measure based on pixel intensity information is
the Local Clarity Score (LCS) (Chen et al., 2004) and the measure based on the power
spectrum is the energy concentration (Chen et al., 2005). We have also used the ex-
82

3.5 Experimental framework
0 0.2 0.4 0.6 0.8 10
20
40
60
80
100
Quality value
Cu
mu
lati
ve
va
lue
(%
)
Sensor fc (capacitive)
OCL
LCS
Energy
NFIQ
0 0.2 0.4 0.6 0.8 10
20
40
60
80
100
Quality value
Cu
mu
lati
ve
va
lue
(%
)
Sensor ft (thermal)
CAPACITIVE SENSOR
0 0.2 0.4 0.6 0.8 10
20
40
60
80
100
Quality value
Cu
mu
lati
ve
va
lue
(%
)
Sensor fo (optical)
Figure 3.30: Quality distribution of the images of the BioSec baseline corpus(test set). All image quality values are normalized into the [0-1] range,with 0 corresponding to the worst quality and 1 corresponding to the bestquality.
isting measure based on classifiers, NFIQ, which is included in the NIST Fingerprint
Image Software 2 - NFIS2 (Watson et al., 2004).
In the experiments carried out in this chapter, all image quality values are nor-
malized into the [0-1] range for better comparison, with 0 corresponding to the worst
quality and 1 corresponding to the best quality. In Figure 3.30, it is depicted the im-
age quality distribution of the database used in this chapter for the selected quality
measures (test set). Note that the NFIQ measure only have 5 values due to its discrete
nature (Watson et al., 2004).
83

3. QUALITY ASSESSMENT OF FINGERPRINT IMAGES
(a) Capacitive sensor.
(b) Thermal sensor.
(c) Optical sensor.
Figure 3.31: Correlation between the automatic quality assessment algo-rithms tested in this work (x- and y-axis are the quality values of the twoalgorithms under comparison). Pearson correlation value between the twoalgorithms is also shown in each subplot.
84

3.6 Results
3.6 Results
In Figure 3.31 we plot the correlation among the quality measures tested in this chapter
for the test set of the Biosec database. In addition, we show the Neyman-Pearson cor-
relation values (Papoulis, 1984) between them, which are observed to be high, except
when the NFIQ measure is involved. This could be due to the finite number of quality
labels used by this algorithm (Watson et al., 2004). In spite of the high correlation
observed between most of the measures, their values are different depending on the
sensor (e.g. correlation between the OCL and energy measures is 0.8, 0.71 and 0.44 for
the capacitive, thermal and optical, respectively). This suggest that quality measures
work differently with each sensor, which could be due to their different physical acqui-
sition principles. Also worth noting, the lowest correlation values are obtained with the
optical sensor.
In order to evaluate the utility of the compared quality metrics, i.e. their capabil-
ity to predict the performance of a matcher (Grother and Tabassi, 2007), we plot in
Figures 3.32 and 3.33 the similarity scores of the two matchers (minutiae- and ridge-
based) against the average quality of the two involved fingerprint images. We assign
a quality value to a given score, which is computed as√
Qe × Qt, where Qe and Qt
are the quality values of the enrolment and test fingerprint, respectively, corresponding
to the matching (note that the NIST-NFIQ quality measure only provides 5 possible
values for Qe and Qt, and thus, the combined value√
Qe × Qt also exhibit a discrete
nature but with more than 5 possible values). We also give in Figures 3.32 and 3.33 the
Neyman-Pearson correlation between similarity scores and its assigned quality value.
In addition, Figures 3.34 and 3.35 depict the error rates of the two verification systems
as we reject samples (i.e. matching scores) with the lowest quality value. We report the
error rates at three points: the Equal Error Rate (EER), the False Acceptance Rate at
1% FRR, and the False Rejection Rate at 1% FAR.
Minutiae-based matcher.
For the minutiae-based matcher, positive correlation values are observed between
quality measures and genuine similarity scores, as it is plotted in Figure 3.32. On the
other hand, correlation is found to be close to zero for the impostor scores (or even
negative, as in the case of the capacitive sensor).
85

3. QUALITY ASSESSMENT OF FINGERPRINT IMAGES
(a) Capacitive sensor.
(b) Thermal sensor.
(c) Optical sensor.
Figure 3.32: Minutiae-based matcher. Dependence of similarity scores (y-axis) on the average quality of the template and the input images (x-axis).We assign a quality value to a given score, which is computed as
√Qe × Qt,
where Qe and Qt are the quality values of the enrolment and test fingerprintsamples, respectively, corresponding to the matching.
86

3.6 Results
(a) Capacitive sensor.
(b) Thermal sensor.
(c) Optical sensor.
Figure 3.33: Ridge-based matcher. Dependence of similarity scores (y-axis)on the average quality of the template and the input images (x-axis). Weassign a quality value to a given score, which is computed as
√Qe × Qt,
where Qe and Qt are the quality values of the enrolment and test fingerprintsamples, respectively, corresponding to the matching.
87

3. QUALITY ASSESSMENT OF FINGERPRINT IMAGES
As a result of the correlation found between genuine scores and quality values, a
remarkable performance improvement is obtained in the FRR, as can be seen in Fig-
ure 3.34. After rejection of just 5% of the samples, FRR is improved in the best case
about 10%, 30%, and 50% for the capacitive, thermal and optical sensor, respectively.
Significant improvement is also obtained in the EER (about 5%, 20% and 45% , re-
spectively). On the contrary, the smallest improvement is obtained for the FAR (about
7% and 3% for the thermal and optical sensor, respectively) or even no improvement,
as observed in some cases.
Regarding sensor technology, we observe a clear relationship between the sensor
acquisition area and the relative performance improvement: the sensor having the
smallest acquisition area (the capacitive) obtains the lowest improvement, whereas the
sensor with the biggest area (the optical) always results in the highest improvement of
performance. We detail this effect in Table 3.3. It is well known that acquisition surface
of fingerprint sensors has impact on the performance due to the amount of discrimina-
tive information contained in the acquired biometric data (Maltoni et al., 2003). For
a fingerprint matcher based on minutiae features, more acquisition area implies more
minutiae acquired from a fingerprint. As a result, with more acquisition surface, higher
amount of minutiae is affected by quality degradation.
Ridge-based matcher.
As far as the ridge-based matcher is concerned, negative correlation values between
quality measures and similarity scores are found, both for the genuine and impostor
ones (see Figure 3.33). Correlation values are higher for the impostor scores, therefore
the highest improvement of performance when rejecting low quality scores is observed
in the FAR, as can be seen in Figure 3.35. Interestingly enough, no improvement is
observed in the FRR.
In addition, sensor technology does not play a primary role with relative perfor-
mance improvement for the ridge-based matcher, contrarily to what happened with the
minutiae-based matcher. The unique relationship between sensor area and performance
improvement is observed in the FAR.
3.7 Chapter summary and conclusions
In this chapter we have presented a taxonomy of existing approaches for fingerprint
image quality estimation, divided into: i) approaches that use local features of the
88

3.7 Chapter summary and conclusions
image; ii) approaches that use global features of the image; and iii) approaches that
address the problem of quality assessment as a classification problem. They make use
of different local and global image features that are extracted using several sources:
direction field, Gabor filter responses, power spectrum and pixel intensity values.
Based on the proposed taxonomy, we have performed comparative experiments
using a selection of quality estimation algorithms that includes approaches based on
the three classes defined above. We have used for our experiments the Biosec baseline
corpus, which includes 19,200 fingerprint images from 200 individuals acquired with
three fingerprint sensors based on different acquisition principles. High correlation is
found between quality measures in most cases, although different correlation values
are obtained depending on the sensor. This suggest that the quality measures work
differently with each sensor.
We also have studied the capability of the selected quality algorithms to predict
the performance of the two most widely used approaches for fingerprint recognition. It
has been found that for the approach based on minutiae, when rejecting low quality
samples, the highest performance improvement is obtained in the False Rejection Rate,
whereas for the ridge-based approach the highest improvement is observed in the False
Acceptance Rate. We have also observed a relationship between sensor acquisition area
and the achieved relative performance improvement.
This chapter presents novel contributions regarding the taxonomy of fingerprint
quality assessment algorithms, the study of correlation of a representative set of quality
measures and their utility for two different matchers with sensors of different technology.
89

3. QUALITY ASSESSMENT OF FINGERPRINT IMAGES
0 5 10 15 20 2580
80.5
81
81.5
82
82.5
83
Fraction rejected (%)
FA
(%
)
Sensor fc (capacitive) − NIST matcher − FR=1%
-0.7%
0 5 10 15 20 25
12
12.5
13
13.5
14
Fraction rejected (%)
EE
R (
%)
Sensor fc (capacitive) − NIST matcher
-4.8%
0 5 10 15 20 25
25
26
27
28
29
30
31
Fraction rejected (%)
FR
(%
)
Sensor fc (capacitive) − NIST matcher − FA=1%
OCLLCSEnergyNFIQ
-9.6%
(a) Capacitive sensor.
0 5 10 15 20 25
19
20
21
22
Fraction rejected (%)
FA
(%
)
Sensor ft (thermal) − NIST matcher − FR=1%
-7.1%
0 5 10 15 20 251.5
2
2.5
3
3.5
4
4.5
Fraction rejected (%)
FR
(%
)
Sensor ft (thermal) − NIST matcher − FA=1%
-28.6%
0 5 10 15 20 25
1.6
2
2.4
2.8
Fraction rejected (%)
EE
R (
%)
Sensor ft (thermal) − NIST matcher
-21%
1.2
(b) Thermal sensor.
250 5 10 15 203.8
3.9
4
4.1
4.2
4.3
Fraction rejected (%)
FA
(%
)
Sensor fo (optical) − NIST matcher − FR=1%
-2.95%
0 5 10 15 20 25
0.4
0.6
0.8
1
1.2
1.4
1.6
Fraction rejected (%)
FR
(%
)
Sensor fo (optical) − NIST matcher − FA=1%
-53.4%
0 5 10 15 20 25
0.4
0.6
0.8
1
1.2
Fraction rejected (%)
EE
R (
%)
Sensor fo (optical) − NIST matcher
-43.7%
1.4
(c) Optical sensor.
Figure 3.34: Minutiae-based matcher. Verification performance as sampleswith the lowest quality value are rejected. Results are shown for all thequality measures tested in this work in terms of False Acceptance Rate at1% FRR (first column), Equal Error Rate - EER (second column) and FalseRejection Rate at 1% FAR (third column).
90
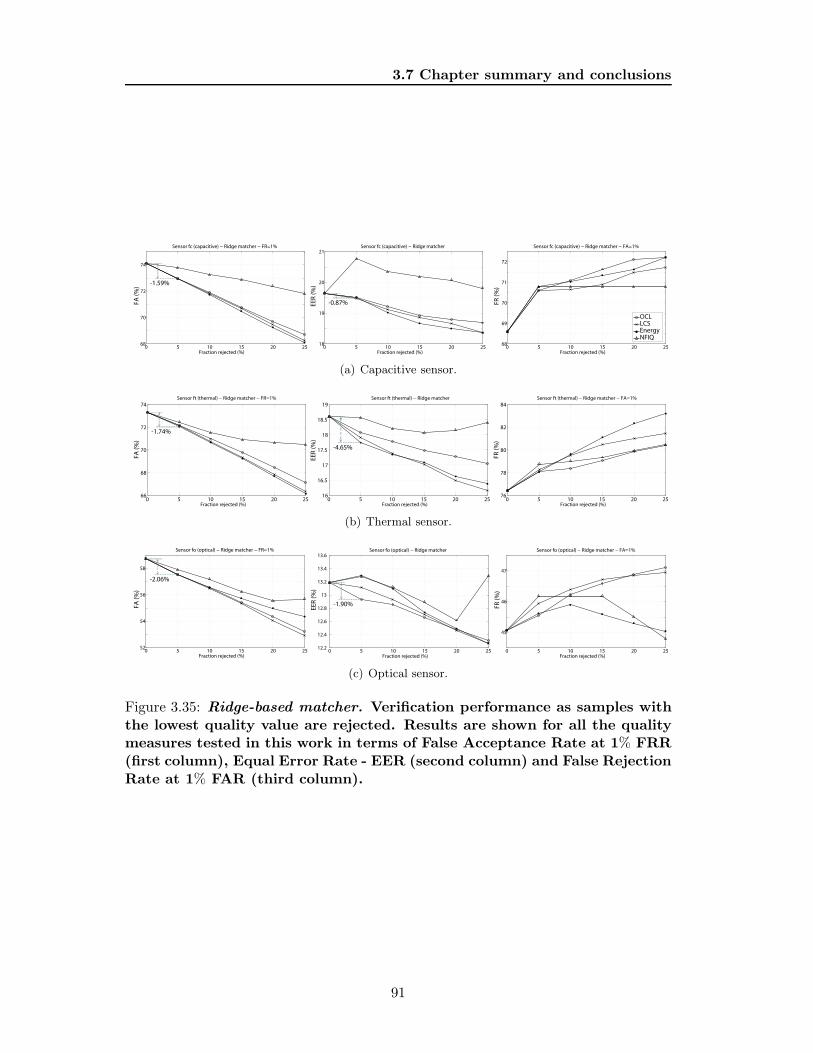
3.7 Chapter summary and conclusions
0 5 10 15 20 2568
70
72
74
Fraction rejected (%)
FA
(%
)
Sensor fc (capacitive) − Ridge matcher − FR=1%
-1.59%
0 5 10 15 20 2518
19
20
21
Fraction rejected (%)
EE
R (
%)
Sensor fc (capacitive) − Ridge matcher
-0.87%
0 5 10 15 20 2568
69
70
71
72
Fraction rejected (%)
FR
(%
)
Sensor fc (capacitive) − Ridge matcher − FA=1%
OCLLCSEnergyNFIQ
(a) Capacitive sensor.
0 5 10 15 20 2566
68
70
72
74
Fraction rejected (%)
FA
(%
)
Sensor ft (thermal) − Ridge matcher − FR=1%
-1.74%
0 5 10 15 20 2516
16.5
17
17.5
18
18.5
19
Fraction rejected (%)
EE
R (
%)
Sensor ft (thermal) − Ridge matcher
-4.65%
0 5 10 15 20 2576
78
80
82
84
Fraction rejected (%)
FR
(%
)
Sensor ft (thermal) − Ridge matcher − FA=1%
CAPACITIVE SENSOR
(b) Thermal sensor.
0 5 10 15 20 2552
54
56
58
Fraction rejected (%)
FA
(%
)
Sensor fo (optical) − Ridge matcher − FR=1%
-2.06%
0 5 10 15 20 2512.2
12.4
12.6
12.8
13
13.2
13.4
13.6
Fraction rejected (%)
EE
R (
%)
Sensor fo (optical) − Ridge matcher
-1.90%
0 5 10 15 20 25
45
46
47
Fraction rejected (%)
FR
(%
)
Sensor fo (optical) − Ridge matcher − FA=1%
CAPACITIVE SENSOR
(c) Optical sensor.
Figure 3.35: Ridge-based matcher. Verification performance as samples withthe lowest quality value are rejected. Results are shown for all the qualitymeasures tested in this work in terms of False Acceptance Rate at 1% FRR(first column), Equal Error Rate - EER (second column) and False RejectionRate at 1% FAR (third column).
91
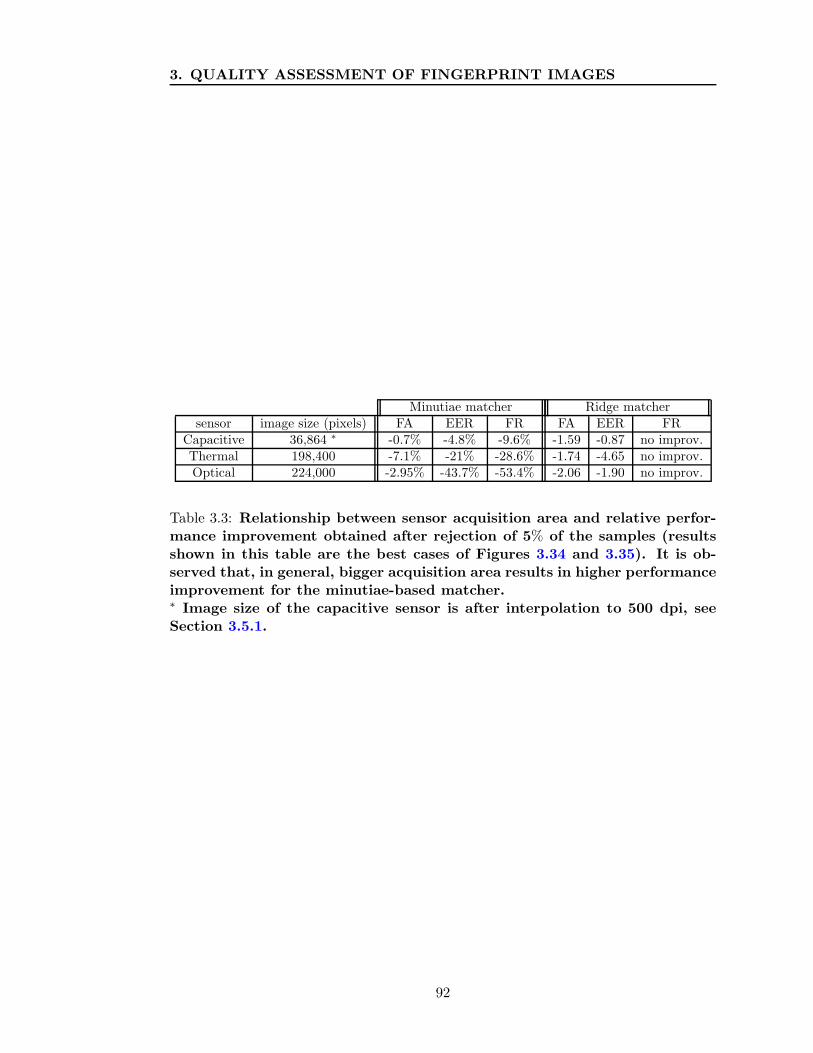
3. QUALITY ASSESSMENT OF FINGERPRINT IMAGES
Minutiae matcher Ridge matchersensor image size (pixels) FA EER FR FA EER FR
Capacitive 36,864 ∗ -0.7% -4.8% -9.6% -1.59 -0.87 no improv.Thermal 198,400 -7.1% -21% -28.6% -1.74 -4.65 no improv.Optical 224,000 -2.95% -43.7% -53.4% -2.06 -1.90 no improv.
Table 3.3: Relationship between sensor acquisition area and relative perfor-mance improvement obtained after rejection of 5% of the samples (resultsshown in this table are the best cases of Figures 3.34 and 3.35). It is ob-served that, in general, bigger acquisition area results in higher performanceimprovement for the minutiae-based matcher.∗ Image size of the capacitive sensor is after interpolation to 500 dpi, seeSection 3.5.1.
92

Chapter 4
Quality Assessment of Signature
Images
The handwritten signature is one of the most widely used individual authenti-
cation methods due to its acceptance in government, legal and commercial transactions
as a method of identity verification (Fairhurst, 1997; Jain et al., 2004b). People are
used to sign documents to confirm their identity in cheques, financial transactions,
credit card validations, contracts, etc. Moreover, signature capture is a very simple
and common process.
This chapter is focused on off-line signature verification, a pattern classification
problem with a long history, involving the discrimination of signatures written on a
piece of paper (Plamondon and Srihari, 2000). It is worth noting that even professional
forensic document examiners perform a correct classification rate of only about 70%,
confirming that this a challenging research area.
This chapter presents several measures aimed to predict the performance of off-line
signature verification systems. They are used as a measure of utility and evaluated on
three matchers that use different approaches based on global and local image analysis.
The proposed measures, extracted from signature images, assess factors like signature
legibility, complexity, stability, duration, etc. Some remarkable findings of this chapter
are that better performance is obtained with legible signatures and skilled forgeries, or
that performance is worsened with highly variable signatures.
This chapter is structured as follows. We first review the state of the art in off-
line signature recognition, describing the most commonly used approaches. Next, we
present the measures used to evaluate the utility of the system. After that, we outline
93

4. QUALITY ASSESSMENT OF SIGNATURE IMAGES
X
Y
P
Az
0 200 400
Al
0 200 400 600 0 200 400 600
Figure 4.1: Example of signatures from MCYT database. The two left sig-natures are genuine and the one on the right is a skilled forgery. Plots be-low each signature correspond to the available on-line information, namely:position trajectories (horizontal x, and vertical y), pressure (p), and peninclination (azimuth and altitude angles).
the experimental framework and the signature matching systems used. Results are
then described and finally, a summary and some conclusions are given.
This chapter present novel contributions in one of the matchers that exploits local in-
formation of the signature, which has been developed jointly with Pecharroman-Balbas
(2007), the proposal of measures to predict the performance of signature systems, and
the study of their utility.
This chapter is based on the publications: Alonso-Fernandez et al. (2007a,b); Gilperez
et al. (2008).
4.1 Automatic off-line signature recognition
There are two main automatic signature recognition approaches (Plamondon and Sri-
hari, 2000): off-line and on-line. Off-line methods consider only the signature image,
so only static information is available for the recognition task. On-line systems use
pen tablets or digitizers which capture dynamic information such as velocity and ac-
celeration of the signing process, see Figure 4.1. These features are then available
for recognition, providing a richer source of information than off-line static images.
On-line signature verification systems have traditionally shown to be more reliable as
94

4.1 Automatic off-line signature recognition
dynamic features provide in general a higher variability between users and are harder
to imitate (Plamondon and Lorette, 1989; Rigoll and Kosmala, 1998). But in spite
of the advantages of on-line signature approaches, off-line signature verification has a
wide field of implementation. Signature capture in off-line systems is a very simple
process and we are used to sign documents to confirm our identity in cheques, financial
transactions, credit card validations, contracts, etc. In fact, some authors have tried to
extract pseudo-dynamic features from signature images in an attempt to enhance the
performance of off-line verification systems (Ammar and Fukumura, 1986; Fang et al.,
1999; Lee and Pan, 1992).
Like other biometric systems, signature verification systems are exposed to forgeries,
which can be easily performed by direct observation and learning of the signature by
the forger. Commonly, two kind of impostors are considered in signature verification
tasks: casual impostors, which produce random forgeries that are visually distinct (e.g.
their own signature) from the target signature, and real impostors, that produce skilled
forgeries which attempt to imitate the target signature (Justino et al., 2001), as the
example shown in the right part of Figure 4.1. A robust system against simple forgeries
may be weak against skilled forgeries.
In this section, we describe the main existing approaches for off-line signature recog-
nition. They are presented according to the general architecture of a biometric system
presented in Chapter 1, namely: i) signature acquisition; ii) preprocessing, iii) fea-
ture extraction and iv) matching. This section is based on publication Martinez-Diaz
(2007).
4.1.1 Signature acquisition and preprocessing
Due to their specific nature, off-line signatures are acquired after the user has produced
its signature. The most common way is by document scanning. After the image has
been captured, signature region is segmented from the background (Ammar et al.,
1988). In some cases, noise reduction techniques are used to enhance the signature
extraction phase. The following steps are commonly performed for these purposes:
1. Binarization. Signature images are converted to binary images in most cases in
order to use them as input for other stages. This step is commonly performed
using classical thresholding techniques, like the Otsu method (Otsu, 1979). An
example is shown in Figure 4.2.
2. Noise reduction. Noise may appear after the binarization step. These can be
deleted using morphological operations such as openings and closings (Gonzalez
95

4. QUALITY ASSESSMENT OF SIGNATURE IMAGES
Figure 4.2: Signature binarization using the Otsu method.
Figure 4.3: Noise removal using morphological closing.
and Woods, 2002), as can be seen in Figure 4.3.
3. Segmentation. Signature images are segmented by extracting signature strokes
from the background in order to process only the signature traces (Lee and
Lizarraga, 1996). In the work presented by Fierrez-Aguilar et al. (2004), signa-
tures are segmented by locating and eliminating the outermost flourish strokes,
considering the signature image only in the inside of a bounding box, as outer-
most flourish strokes usually present more intra-variability. This process can be
seen in Figure 4.4. A sophisticated method for segmenting signature images is
presented by Sabourin and Plamondon (1988), where statistics of directional data
are used to grow regions using a merging algorithm.
4. Normalization and centering. While some authors consider the signature size and
position as user-specific (Murshed et al., 1995; Sabourin and Drouhard, 1992),
signatures are generally aligned and normalized. In Figure 4.5, an example of
size normalization to a fixed width while maintaining the aspect ratio is depicted
for two different signatures. By using this process, all signatures from an specific
subject are normalized to the same size, as can be observed in Figure 4.6.
96

4.1 Automatic off-line signature recognition
Figure 4.4: Elimination of signature outermost flourish strokes. Figure ex-tracted from Alonso-Hermira (2003); Moreno-Marquez (2003).
Figure 4.5: Size normalization to a fixed width. Figure extracted fromAlonso-Hermira (2003); Moreno-Marquez (2003).
Other approaches perform the signature extraction process in different ways, like
the approach known as filiformity detection which is presented by Djeziri et al. (1998).
Some authors perform a thinning process to the signature strokes before the feature
extraction phase (Lee and Pan, 1992).
4.1.2 Feature extraction
A vast quantity of approaches have been proposed in the last few years, most of them
summarized by Dimauro et al. (2004); Hou et al. (2004); Leclerc and Plamondon (1994);
Plamondon and Lorette (1989); Sabourin (1992). Feature extraction methods can be
classified in global and local approaches.
Global approaches extract feature vectors based on the whole signature image. First
works used several classical shape description techniques, such as Fourier descriptors,
Hadamard transforms, etc. (Ammar et al., 1988). Some examples of recent approaches
include:
97

4. QUALITY ASSESSMENT OF SIGNATURE IMAGES
Figure 4.6: Several signatures of two different subjects after size normaliza-tion and centering. Figure extracted from Alonso-Hermira (2003); Moreno-Marquez (2003).
• Directional probability density functions techniques that compute histograms of
the direction of the signature strokes (Sabourin and Drouhard, 1992).
• Vertical and horizontal projection moments, computing the amount of pixels from
each row and column of the image (Bajaj and Chaudhury, 1997).
• Shape-matrices computed over a pseudo-convex hull of the signature image (Sabourin
et al., 1997).
• Slant directions and signature envelope features extracted using morphological
image processing (Lee and Lizarraga, 1996).
• Pixel density based techniques that divide the signature image in cells and com-
pute the amount of signature pixels in each cell (Justino et al., 2000; Rigoll and
Kosmala, 1998).
• Geometrical features such as contour measures based on polar and cartesian co-
ordinates (Ferrer et al., 2005).
• Simple graphometric features such as signature proportion, space between sig-
nature blocks, baseline angle, image area, number of closed loops, number of
crossings, maximum horizontal and vertical projections, global slant angle, num-
ber of edge points, etc. (Baltzakis and Papamarkos, 2001; Justino et al., 2000).
In local approaches, signature images are divided in regions and feature vectors are
then computed from each region. Some recent approaches include:
• Structural descriptors which consider the whole signature as a set of hierarchical
symbols that can be described at different levels in a tree-form structure (Ammar
et al., 1990).
98

4.1 Automatic off-line signature recognition
• In Sabourin et al. (1993), shadow codes are proposed as features. This technique
divides the signature image in cells, and then computes the projection of the
pixels in each cell over different directions.
• Granulometric distributions are proposed by Sabourin et al. (1996). This ap-
proach divides the signature image in cells, which are called retinas, and then
computes the pattern spectrum of the pixels from each retina based on different
morphological operators.
• Simple features such as curvature, angle and size of isolated strokes (Guo et al.,
1997).
• A smoothness index, which allows to compare individual stroke curves based on
their smoothness (Fang et al., 1999).
• Slant directions and signature envelope features extracted from local regions of
the image using morphological image processing (Lee and Lizarraga, 1996).
There are also approaches that combine local and global features similar to the
above-mentioned, as in the works presented by Fierrez-Aguilar et al. (2004); Huang
and Yan (1997); Sabourin et al. (1994).
Features can also been classified in two other types: static and pseudo-dynamic fea-
tures. The features presented until now in this section are all static features. Pseudo-
dynamic features try to extract dynamic information from the signature image, be-
cause, as stated before, dynamic features provide very valuable information to detect
skilled forgeries. In the approach proposed by Ammar and Fukumura (1986), pres-
sure information is retrieved from the strokes structure, thus recovering some dynamic
information which is used to detect skilled forgeries. Directional stroke tracing from
signature images is computed by Lee and Pan (1992); Pan and Lee (1991) by retracing
the signature with an heuristical parametric algorithm emulating the way in which a
human would retrace the signature.
4.1.3 Signature matching
Several techniques have been proposed for off-line signature matching over the past few
decades. They are mainly based on classical pattern classification techniques. Signature
matching approaches can be divided in: minimum distance classifiers, Hidden Markov
Models (HMMs), Neural Networks and Support Vector Machines (SVMs). Other ap-
proaches will be presented at the end of this section.
99

4. QUALITY ASSESSMENT OF SIGNATURE IMAGES
• Minimum distance classifiers. This is the simplest classification technique. It
has been widely used as its implementation is completely straightforward. The
distance between feature vectors is directly computed in order to test their simi-
larity. Two types of distances are the most commonly used: Euclidean (Lee and
Lizarraga, 1996; Sabourin et al., 1993, 1997) and Mahalanobis (Fang et al., 1999;
Lee and Lizarraga, 1996; Nagel and Rosenfeld, 1977) distances. One variant of
the previous methods is the Nearest Neighbor classifier (Sabourin et al., 1993),
which matches the test feature vector to the class of the template that is closer
to it.
• Hidden Markov Models (HMMs). An HMM models a double-stochastic process,
governed by a finite-state Markov Chain and a set of random functions. In each
instant, the process generates an observation symbol, according to the random
function corresponding to the actual state. Each state depends only from previous
states. The correct choice of the model topology is crucial when designing an
HMM classifier. Choosing correct probability density functions associated with
each state is also critical. A brief description of HMMs is done by Rabiner (1989).
Hidden Markov Models application examples in off-line signature verification are
given by Fierrez-Aguilar et al. (2004); Justino et al. (2000); Rigoll and Kosmala
(1998).
• Neural Networks. Neural networks have been widely used in signature verification
as they provide a framework adaptable to many kinds of features. Neural networks
are a combination of perceptrons or neurons, which are simple classifiers that can
be interconnected using as inputs their weighted outputs building in this way
multi-layer neural networks. Some examples of systems that use neural networks
are: Bajaj and Chaudhury (1997); Baltzakis and Papamarkos (2001); Huang and
Yan (1997); Murshed et al. (1995); Sabourin and Drouhard (1992).
• Support Vector Machines (SVMs). SVMs are linear classifiers which compute
the optimum hyperplane that maximizes the class separability. One of their main
advantages is that they allow to deal with high-dimensional feature vectors. This
approach is not common in off-line signature verification systems but it has shown
very promising results, as in the work reported by Martinez et al. (2004), where
an SVM classifier is used with geometric features. A complete description of
SVMs implementation is done by Burges (1998). A comparison between SVM
and HMM approaches is carried out by Justino et al. (2005) showing that, for
100
4.1 Automatic off-line signature recognition
the database and features under consideration, the SVM system performs better
than the HMM system.
In the work presented by Guo et al. (1997), a dynamic programming based approach
is used. This technique models the signature as a set of ordered symbols and computes
the cost function for transforming the test signature symbol set into the template set.
An approach based on relaxation matching is presented by Huang and Yan (2002).
This technique uses statistical classifiers that give soft-decisions which are viewed as
matching-confidence values and combined to compute the matching scores.
Fusion of the scores obtained with different classifiers has also been proposed (Fierrez-
Aguilar et al., 2004). Cordella et al. (1999) present a serial multi-expert approach that
combines two classifiers, one aimed against random forgeries and the other one against
skilled forgeries.
4.1.4 Issues and challenges
Off-line signature verification is a very convenient biometric based validation approach.
Unfortunately, none of the approaches given up to date have attained the same re-
liability as other biometric verification systems based on different traits such as iris,
fingerprint, etc. While systems are reasonably robust against simple forgeries, skilled
forgeries are still a challenge. Off-line signature verification is still an open issue, with
new approaches being proposed constantly. Human expert approaches should also be
taken into account. The perceptual influence in human-based signature verification is
studied by Fairhurst and Kaplani (2003). The authors study how different amounts
and typologies of training data and test data lead to very different error rates. These
results are proposed as a path to improve automatic signature verification systems.
Another problem is the scarcity of available signature templates when a user is
enrolled in a system. Usually, several templates are needed to obtain a reasonable
verification performance, but this is not always possible. Moreover, template signatures
should be captured in different sessions in order to obtain a robust model against
medium- and long-term intra-variability. This is a challenging problem in signature
recognition, as many users tend to have a high variation in their signatures between
different realizations or gradually over medium to long periods of time.
The non-existence of publicly available signature databases makes difficult the eval-
uation of off-line recognition systems. This is normally due to legal issues regarding per-
sonal data protection. Verification systems in the literature use proprietary databases,
usually from very small populations which make nearly impossible to systematically
101

4. QUALITY ASSESSMENT OF SIGNATURE IMAGES
compare their results. Furthermore, signatures from different parts of the world tend
to be very diverse: European signatures are commonly flourished, Asian signatures use
Asian characters, etc. Systems designed to deal with Western signatures may no be
valid for Asian ones (Hou et al., 2004). Capturing a database containing samples of
each type of signature is a very difficult task.
4.2 Contribution: quality estimation of signature samples
In fingerprint images, we can objectively define quality as the strength, continuity,
clarity, uniformity or integrity of the ridge structure. But in behavioral biometric traits
such signature, it is harder to clearly define what quality is. There are works (Allgrove
and Fairhurst, 2000; Muller and Henniger, 2007) postulating that signature stability can
be considered as a measure of signature quality. Signature complexity could be other
quality measure suitable for signatures (Brault and Plamondon, 1993). But these two
factors, complexity and variability, depend on how a signer decides to sign. It is clear
that a blurred image or a weak impression of a fingerprint is not suitable for recognition,
thus a sufficient reason to ask a user for a new fingerprint sample. However, signature
complexity or variability are weak reasons to reject a signature sample, mainly because
subsequent samples provided by the user probably will have the same complexity or
variability. In this case, signature recognition systems should be able to deal with these
features and to adjust the recognition process based on the estimated complexity or
variability. An optimal system could therefore be designed that chooses a feature set
which best suits the characteristics of the signature at hand (Guest, 2004).
In this Section, we present several measures aimed to predict the performance of
off-line signature verification systems (i.e. quality defined as utility). There are also
works aimed to study signature quality as a fidelity measure, which is not considered
in this Ph.D. Thesis, e.g. Vargas et al. (2007). The proposed measures, extracted from
signature images, include:
• Two manually assessed measures, signature legibility and signature type, aimed
at evaluating how the knowledge about letters, syllables or name instances may
help in the process of imitating a signature (Section 4.2.1).
• One measure that computes the area of a signature where slants with different
directions intersect, which could be considered as a measure of complexity (Sec-
tion 4.2.2).
102

4.2 Contribution: quality estimation of signature samples
NAME NO LEGIBLE OR NO NAME
MEDIUM LEGIBILITY
NAME CLEARLY LEGIBLE
Figure 4.7: Signature examples with different degrees of name legibility (fromtop to bottom).
103

4. QUALITY ASSESSMENT OF SIGNATURE IMAGES
• One measure that computes the intra-variability of a given set of signatures with
the aim of estimating its stability (Section 4.2.2).
• Three geometrical measures aimed at evaluating the variance of the pen pres-
sure during the process of signing, the signature duration and the signature area
(Section 4.2.3).
4.2.1 Legibility and type of signature
We focus here on occidental signatures, which typically consist of connected text (i.e.
name) and/or some form of flourish. Sometimes, signatures only consist of a readable
written name (e.g. American signatures). In other cases, as frequently happens in
European countries, signatures may consist of only an elaborated flourish. In contrast to
occidental signatures, oriental signatures consist of independent symbols. Examples of
both oriental and occidental signatures can be found in the First International Signature
Verification Competition (Yeung et al., 2004).
Signature verification systems have been shown to be sensitive to some extent to
signature complexity (Fierrez-Aguilar et al., 2005d). Easy to forge signatures result
in increased False Acceptance Rate. Signature variability also has an impact in the
verification rates attainable (Allgrove and Fairhurst, 2000). It can be hypothesized
that these two factors, complexity and variability, are related in some way with signa-
ture legibility and signature type. Moreover, some studies have been concerned with
the ability of humans in recognizing handwritten script (Brault and Plamondon, 1993;
Fairhurst and Kaplani, 2003). Knowledge about letters, syllables or name instances
may help in the process of imitating a signature, which is not the case for an incom-
prehensible set of strokes that, in principle, are not related to any linguistic knowledge.
Therefore, we propose to evaluate the impact of signature legibility and signature type
in the recognition rates of verification systems. In this work, signature legibility and
type are assessed by a human expert. This is a suitable situation in off-line signa-
ture verification environments, where signature acquisition is typically performed by a
human operator using a scanner or a camera (Plamondon and Srihari, 2000).
All signers in the database used for our experiments are manually assigned a legibility
label and a type label. One of three different legibility labels is assigned: i) name not
legible or no name; ii) uncertain; and iii) name clearly legible. Examples are shown
in Figure 4.7. Condition ii) is used in the case that some characters of the name can
be recognized but it is not possible to extract the name completely. In addition, four
different type labels are assigned based on the following criterion: a) simple flourish;
104

4.2 Contribution: quality estimation of signature samples
SIMPLE FLOURISH COMPLEX FLOURISH
NAME + SIMPLE
FLOURISH
NAME + COMPLEX
FLOURISH
Figure 4.8: Signature examples of the four types encountered in the MCYTcorpus (from left to right).
105

4. QUALITY ASSESSMENT OF SIGNATURE IMAGES
Legibility level Number of users
Non-legible 18 users (24.00%)Medium 19 users (25.33%)Legible 38 users (50.67%)
Type Number of users
Simple flourish 5 users (6.67%)Complex flourish 13 users (17.33%)
Name + simple flourish 35 users (46.67%)Name + complex flourish 22 users (29.33%)
Table 4.1: Distribution of users on the MCYT database (75 users) based onname legibility and signature type.
b) complex flourish; c) name + simple flourish; and d) name + complex flourish. Ex-
amples are shown in Figure 4.8. It should be noted that signatures of class a) and b)
are those assigned to the non-legible class. Similarly, signatures of class c) and d) are
those assigned to the medium and legible classes. The distributions of signers in the
database used in this chapter based on name legibility and signature type are shown in
Table 4.1 (the database is described later in Section 4.3).
4.2.2 Slant and variability measures
We have proposed two measures that can be automatically extracted from off-line
signature images (Alonso-Fernandez et al., 2007a). The first computes the area of a
signature where slants with different directions intersect, which could be considered as
a measure of complexity. The second measure computes the intra-variability of a given
set of signatures with the aim of estimating its stability.
We first preprocess input signature images by performing the following steps: bina-
rization by global thresholding of the histogram (Otsu, 1979), morphological opening
plus closing operations on the binary image for noise removal, segmentation of the
signature outer traces, and normalization of the image size to a fixed width while
maintaining the aspect ratio. Segmentation of the outer traces is done because signa-
ture boundary normally corresponds to flourish, which has high intra-user variability,
whereas normalization of the image size is aimed to make the proportions of different
realizations of an individual to be the same.
Next, slant directions of the signature strokes and those of the envelopes of the
dilated signature images are extracted. For slant direction extraction, the preprocessed
106

4.2 Contribution: quality estimation of signature samples
Figure 4.9: Slant measure. Example of two eroded images (bottom row) ofa given signature image (top row). The middle row shows the two struc-turing elements used for the erosion. The dotted circle denotes a region ofthe signature having various strokes crossing in several directions. In thisregion, no predominant slant direction exists.
signature image is eroded with 32 structuring elements like the ones presented in the
middle row of Figure 4.9, each one having a different orientation regularly distributed
between 0 and 360 degrees (Fierrez-Aguilar et al., 2004), thus generating 32 eroded
images. A slant direction feature sub-vector of 32 components is then generated, where
each component is computed as the signature pixel count in each eroded image. For
envelope direction extraction, the preprocessed signature image is successively dilated 5
times with each one of 6 linear structuring elements, whose orientation is also regularly
distributed, thus generating 5 × 6 dilated images. An envelope direction feature sub-
vector of 5 × 6 components is then generated, where each component is computed as
the signature pixel count in the difference image between successive dilations. The
preprocessed signature is finally parameterized as a vector o with 62 components by
concatenating the slant and envelope feature sub-vectors. For additional details of
these steps, including the structuring elements used for erosion and dilation, we refer
the reader to Fierrez-Aguilar et al. (2004) and the references therein.
4.2.2.1 Slant Measure
The area of a signature where slants with different directions intersect is measured as
follows. Given the 32 eroded images generated as explained above, a small degree of
overlap is expected among them (i.e. any pixel should be marked in as few eroded
107

4. QUALITY ASSESSMENT OF SIGNATURE IMAGES
Signature 1 Signature 2
5 10 15 20 25 300
5
10
15
20
25
Number of erosions
Nu
mb
er
of
pix
els
(%
)
Cumulative histogram
signature 1 signature 2
5 10 15 20 25 300
10
20
30
40
50
60
70
80
90
100
Number of erosionsC
um
ula
tiv
e n
um
be
r o
f p
ixe
ls (
%) Cumulative histogram
Figure 4.10: Slant measure. Histogram (left bottom) and cumulative his-togram (right bottom) of the number of eroded images in which a pixel ismarked for the two example signatures shown.
images as possible). However, there may be regions of the signature having various
strokes crossing with several directions. In these regions, no predominant slant direction
exists or, in other words, any estimation of a dominant slant direction will be unreliable.
As a result, pixels of these regions will be marked in many of the eroded images, as can
be seen in Figure 4.9. For each pixel of the signature, we count the number of eroded
images in which it is marked and then, we plot the histogram and the cumulative
histogram for all the pixels of the image (Figure 4.10). We can see from Figure 4.10
that the histogram of signature 1 is concentrated in low values, whereas it is displaced to
higher values for signature 2. This is because signature 2 exhibits many regions having
various strokes crossing with several directions. We measure the size of these regions by
computing the x-axis point in which the cumulative histogram reaches a certain value
(in our experiments, this value is set to 50%, as seen in Figure 4.10). The higher the
value this point has, the larger is the area of the signature with no predominant slant
direction. For now on, this measure will be denoted as Slant Measure.
108

4.2 Contribution: quality estimation of signature samples
μ
o1
o2
o3
o4
o5
d 1
d2
d3
d5
d4
μ
o1
o2
o3
o4
o5
d 1
d2
d3
d5
d4
Lower variability
Higher variability
Figure 4.11: Variability measure. Example of two signature sets of differentvariability. Vectors {o1, ...,oK} denote the K different signatures (K=5 inthis example). Parameter µ denotes the mean vector of the K signatures{o1, ...,oK}. Parameters di are the Euclidean distances of each signature oi
to the mean vector µ (i = 1, ...,K).
4.2.2.2 Variability Measure
The intra-variability of a given set of K signatures of a client is computed as follows.
We first extract an statistical model µ of the client which is estimated by using the
set of K signatures, parameterized as {o1, ...,oK}. The parameter µ denotes the mean
vector of the K signatures {o1, ...,oK}. We then compute the Euclidean distance
(Theodoridis and Koutroumbas, 2003) of each signature oi (i = 1, ...,K) to the mean
vector µ, resulting in K distances di (i = 1, ...,K). The variability is finally computed
as E(d1, ..., dK), where the operator E(.) is the statistical mean. The idea behind this
measure is shown in Figure 4.11. In the rest of the chapter, this measure will be denoted
as Variability Measure. An example of two signature sets of different variability based
on this measure is shown in Figure 4.12.
Figure 4.13 depicts the cumulative distribution function of the Slant and Variability
measures for all users of the database used in this chapter (Section 4.3).
4.2.3 Geometrical measures
We propose the evaluation of measures related with geometrical features of the signature
image, that can be also extracted automatically:
• Gray level variance across the signature strokes (see Figure 4.14(a)), which can
be considered as a measure of variance of the pen pressure during the process of
signing.
109

4. QUALITY ASSESSMENT OF SIGNATURE IMAGES
(a) Low variability (measure value = 1,877.3)
(b) High variability (measure value = 12,241)
Figure 4.12: Variability measure. Example of two signature sets of differentvariability from the MCYT database.
110
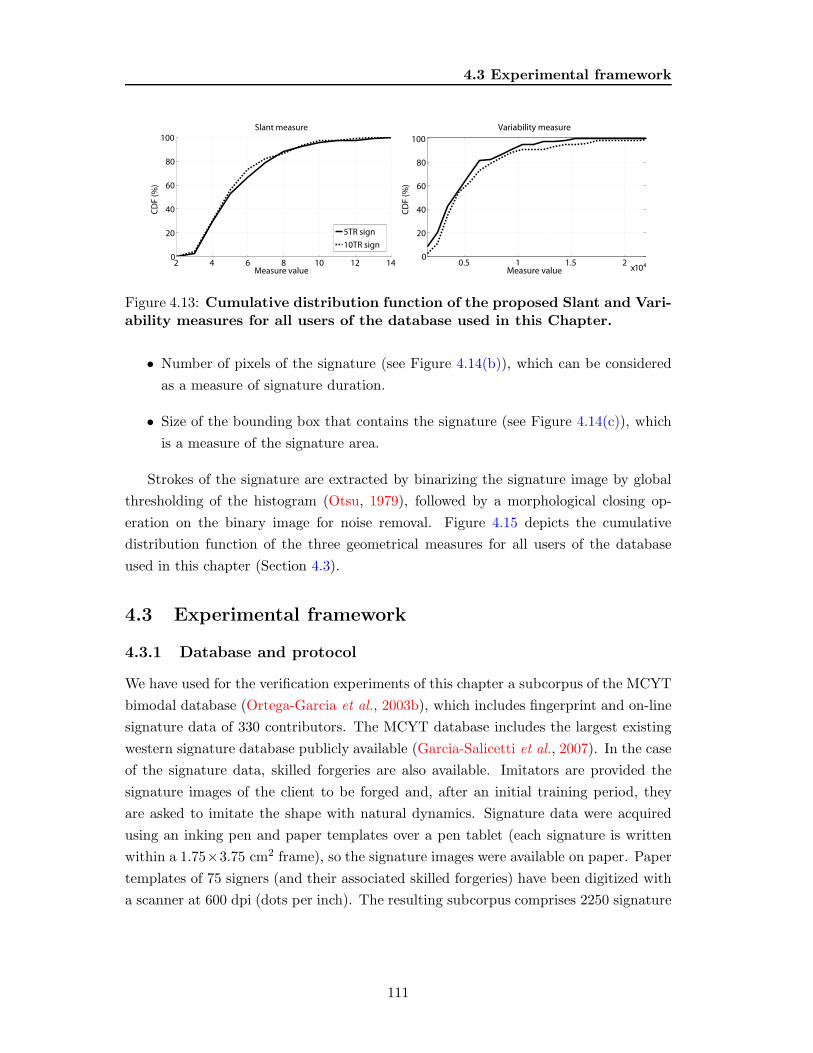
4.3 Experimental framework
2 4 6 8 10 12 140
20
40
60
80
100
Measure value
CD
F (
%)
Slant measure
5TR sign
10TR sign
0.5 1 1.5 2x 1 4
0
20
40
60
80
100
Measure value
CD
F (
%)
Variability measure
0
Figure 4.13: Cumulative distribution function of the proposed Slant and Vari-ability measures for all users of the database used in this Chapter.
• Number of pixels of the signature (see Figure 4.14(b)), which can be considered
as a measure of signature duration.
• Size of the bounding box that contains the signature (see Figure 4.14(c)), which
is a measure of the signature area.
Strokes of the signature are extracted by binarizing the signature image by global
thresholding of the histogram (Otsu, 1979), followed by a morphological closing op-
eration on the binary image for noise removal. Figure 4.15 depicts the cumulative
distribution function of the three geometrical measures for all users of the database
used in this chapter (Section 4.3).
4.3 Experimental framework
4.3.1 Database and protocol
We have used for the verification experiments of this chapter a subcorpus of the MCYT
bimodal database (Ortega-Garcia et al., 2003b), which includes fingerprint and on-line
signature data of 330 contributors. The MCYT database includes the largest existing
western signature database publicly available (Garcia-Salicetti et al., 2007). In the case
of the signature data, skilled forgeries are also available. Imitators are provided the
signature images of the client to be forged and, after an initial training period, they
are asked to imitate the shape with natural dynamics. Signature data were acquired
using an inking pen and paper templates over a pen tablet (each signature is written
within a 1.75×3.75 cm2 frame), so the signature images were available on paper. Paper
templates of 75 signers (and their associated skilled forgeries) have been digitized with
a scanner at 600 dpi (dots per inch). The resulting subcorpus comprises 2250 signature
111

4. QUALITY ASSESSMENT OF SIGNATURE IMAGES
Variance=87.37 Variance=101.44
Variance=114.54
(a) With increasing gray level variance across the signature strokes (fromleft to right).
SIZE=11,012 pixels SIZE=18,003 pixels
SIZE=20,397 pixels
(b) With increasing number of pixels (from left to right).
SIZE=98,160 pixels SIZE=155,364 pixels
SIZE=250,155 pixels
2 2
2
(c) With increasing size of the bounding box (from left to right).
Figure 4.14: Geometrical measures. Example of signatures with differentmeasure value.
112

4.3 Experimental framework
CAPACITIVE SENSOR
80 85 90 95 100 105 110 1150
20
40
60
80
100
Measure value
CD
F (
%)
Gray level variance
0.5 1 1.5 2 2.5 3
x 104
0
20
40
60
80
100
Measure value
CD
F (
%)
Number of pixels of the signature
5TR sign
10TR sign
CAPACITIVE SENSOR
0.5 1 1.5 2 2.5 3
x 105
0
20
40
60
80
100
Measure value
CD
F (
%)
Size of the bounding box
Figure 4.15: Cumulative distribution function of the proposed geometricalmeasures for all users of the database used in this Chapter.
images, with 15 genuine signatures and 15 forgeries per user (contributed by 3 different
user-specific forgers). Examples can be seen in Figures 4.7 and 4.8.
The experimental protocol is as follows. The training set comprises either K =5
or K =10 genuine signatures (depending on the experiment under consideration). The
remaining genuine signatures are used for testing. For a specific target user, casual
impostor test scores are computed by using the genuine samples available from all the
remaining targets. Real impostor test scores are computed by using the skilled forgeries
of each target. As a result, we have 75 × 10 = 750 or 75 × 5 = 375 client similarity
scores, 75×15 = 1, 125 impostor scores from skilled forgeries, and 75×74×10 = 55, 500
or 75 × 74 × 5 = 27, 750 impostor scores from random forgeries.
In order to have an indication of the level of performance with an ideal score align-
ment between users, results here are based on using a posteriori user-dependent score
normalization (Fierrez-Aguilar et al., 2005d). The score normalization function is as
follows s′ = s − sλ(client, impostor), where s is the raw score computed by the sig-
nature matcher, s′ is the normalized matching score and sλ(client, impostor) is the
user-dependent decision threshold at a selected point obtained from the genuine and
113

4. QUALITY ASSESSMENT OF SIGNATURE IMAGES
impostor histograms of user λ. In the work reported here, we report verification results
at three points: EER, FAR=10% and FRR=10%.
4.4 Signature matcher based on global information
This matcher is based on global image analysis and a minimum distance classifier as
proposed by Lee and Lizarraga (1996), and further developed by Fierrez-Aguilar et al.
(2004).
4.4.1 Signature preprocessing
Input signature images are first preprocessed according to the following consecutive
steps: binarization by global thresholding of the histogram (Otsu, 1979), morphological
opening plus closing operations on the binary image (Gonzalez and Woods, 2002),
segmentation of the signature outer traces, and normalization of the image size to a
fixed width of 512 pixels while maintaining the aspect ratio (see Figure 4.16 for an
example). Normalization of the image size is used to make the proportions of different
realizations of an individual to be the same, whereas segmentation of the outer traces is
carried out because a signature boundary typically corresponds to a flourish, which has
high intra-user variability. For this purpose, left and right height-wide blocks having all
columns with signature pixel count lower than threshold Tp and top and bottom width-
wide blocks having all rows with signature pixel count lower than Tp are discarded.
4.4.2 Feature extraction and matching
A feature extraction stage is then performed, in which slant directions of the signature
strokes and those of the envelopes of the dilated signature images are extracted using
mathematical morphology operators (Gonzalez and Woods, 2002), see Figure 4.17.
These descriptors are used as features for recognition as proposed by Lee and Lizarraga
(1996). For slant direction extraction, the preprocessed signature image is eroded with
32 structuring elements, thus generating 32 eroded images. A slant direction feature
sub-vector of 32 components is then generated, where each component is computed as
the signature pixel count in each eroded image. For envelope direction extraction, the
preprocessed signature image is successively dilated 5 times with each one of 6 linear
structuring elements, thus generating 5×6 dilated images. An envelope direction feature
sub-vector of 5 × 6 components is then generated, where each component is computed
as the signature pixel count in the difference image between successive dilations. The
114

4.4
Sig
natu
rem
atch
er
base
don
glo
balin
form
atio
n
Figure 4.16: Preprocessing stage performed in the signature matcher based on global analysis. Figure extractedfrom Alonso-Hermira (2003); Moreno-Marquez (2003).
115

4. QUALITY ASSESSMENT OF SIGNATURE IMAGES
++++++++++- -- --
5 success ive dilations
E NV E L OP E DIR E C T ION E XT R A C T ION
E E -1E E -1
E ros ion with 32 elements
S L A NT DIR E C T ION E XT R A C T ION
E E -9E E -9
E E -32E E -32E E -32
S E -33S E -33
Figure 4.17: Feature extraction stage performed in the signature matcherbased on global analysis. Structuring elements used for slant direction ex-traction (SE-1 to SE-32) and envelope direction extraction (SE-33 to SE-38)are also shown. Origin of the element is indicated in gray. The area of SE-1to SE-32 is 10 pixels and the angle between successive elements is approx-imately 11 degrees. The areas of SE-33/34 and SE-35/36/37/38 are 7 and4 pixels respectively. Figure based on plots appearing in Alonso-Hermira(2003); Moreno-Marquez (2003).
preprocessed signature is finally parameterized as a vector o with 62 components by
concatenating the slant and envelope feature sub-vectors. Each client (enrolee) of the
system is represented by a statistical model λ = (µ,σ) which is estimated by using an
enrolment set of K parameterized signatures {o1, ...,oK}. The parameters µ and σ
denote mean and standard deviation vectors of the K vectors {o1, ...,oK}.
In the similarity computation stage, the similarity score between a claimed model
λ = (µ,σ) and a parameterized test signature o is computed as the inverse of the
Mahalanobis distance (Theodoridis and Koutroumbas, 2003).
116

4.5 Signature matcher based on local HMM analysis
Figure 4.18: Example of division of a signature image into overlapped columnblocks. Figure extracted from Alonso-Hermira (2003); Moreno-Marquez(2003).
4.5 Signature matcher based on local HMM analysis
The local HMM matcher is based on local image analysis and left-to-right Hidden
Markov Models as used by Justino et al. (2001) but with a local parameterization
derived from Lee and Lizarraga (1996), and also detailed by Fierrez-Aguilar et al.
(2004).
In the preprocessing stage, images are first binarized and segmented as described
in Section 4.4. Next, a feature extraction step is performed, in which slant directions
and envelopes are locally analyzed using the approach described in Section 4.4, but
applied to blocks. Preprocessed images are divided into height-wide blocks of 64 pixels
width with an overlapping between adjacent blocks of 75%. An example is shown in
Figure 4.18. A signature is then parameterized as a matrix O whose columns are 62-
tuples, each one corresponding to a block. Each client of the system is represented by
a Hidden Markov Model λ (HMM) (Ortega-Garcia et al., 2003a; Rabiner, 1989), which
is estimated by using an enrolment set of K parameterized signatures {O1, ...,OK}. A
left-to-right topology of four hidden states with no transition skips between states is
used in this work. Estimation of the model is made by using the iterative Baum-Welch
procedure (Rabiner, 1989).
The similarity computation between a claimed model λ and a parameterized test
signature O is computed by using the Viterbi algorithm (Ortega-Garcia et al., 2003a;
Rabiner, 1989).
4.6 Contribution: Signature matcher based on local con-
tour analysis
This matcher is based on features proposed for writer identification and verification
using images of handwriting documents (Bulacu and Schomaker, 2007), and has been
117

4.
QU
ALIT
YA
SSESSM
EN
TO
FSIG
NA
TU
RE
IMA
GES
BINARIZATION NOISE REMOVALCOMPONENT DETECTION
AND CONTOUR EXTRACTION
Moore contour following algorithm
Figure 4.19: Preprocessing stage performed in the signature matcher based on local contour analysis.
118

4.6 Contribution: Signature matcher based on local contour analysis
developed jointly with Pecharroman-Balbas (2007). We have contributed by selecting
and adapting a number of features to be used with handwritten signatures (Gilperez
et al., 2008). The features implemented work at the analysis of the contour level. The
signature is seen as a texture described by some probability distributions computed
from the image and capturing the distinctive visual appearance of the samples. User
individuality is therefore encoded using probability distributions (PDF) extracted from
signature images. The term “feature” is used to denote such a complete PDF, so we
will obtain an entire vector of probabilities capturing the signature uniqueness.
4.6.1 Signature preprocessing
In the preprocessing stage, binarization and morphological closing operation on the
binary image for noise removal are first carried out as described in Section 4.4. Then
a connected component detection, using 8-connectivity, is carried out. In the last step,
internal and external contours of the connected components are extracted using the
Moore’s algorithm (Gonzalez and Woods, 2002). Beginning from a contour pixel of a
connected component, which is set as the starting pixel, this algorithm seeks a pixel
boundary around it following the meaning clockwise, and repeats this process until the
starting pixel is reached for the same position from which it was agreed to begin the
algorithm. The result is a sequence with the pixels coordinates of the boundary of
the component. This vectorial representation is very effective because it allows a rapid
extraction of many of the features used later. The whole preprocessing stage is shown
in Figure 4.19.
4.6.2 Feature extraction
Features are calculated from two representations of the signature extracted during the
preprocessing stage: the binary image without noise and the contours of the connected
components. The features used in this work are summarized in Table 4.2, including the
signature representation used by each one. The signature is shaped like a texture that
is described with probability distribution functions (PDFs). Probability distribution
functions used here are grouped in two different categories: direction PDFs (features
f1, f2, f3h, f3v) and length PDFs (features f5h, f5v). A graphical description of the
extraction of direction PDFs is depicted in Figure 4.20. To be consistent with the work
in which these features where proposed (Bulacu and Schomaker, 2007), we follow the
same nomenclature used in it.
119

4. QUALITY ASSESSMENT OF SIGNATURE IMAGES
Feature Explanation Dimensions Source
f1 p(φ) Contour-direction PDF 12 contours
f2 p(φ1, φ2) Contour-hinge PDF 300 contours
f3h p(φ1, φ3)h Direction co-occurrence PDF, horizontal run 144 contours
f3v p(φ1, φ3)v Direction co-occurrence PDF, vertical run 144 contours
f5h p(rl)h Run-length on background PDF, horizontal run 60 binary image
f5v p(rl)v Run-length on background PDF, vertical run 60 binary image
Table 4.2: Features used in the signature matcher based on local contouranalysis.
Contour-Direction PDF (f1)
This directional distribution is computed directly using the contour representation,
with the additional advantage that the influence of the ink-trace width is eliminated.
The contour-direction distribution f1 is extracted by considering the orientation of
local contour fragments. A fragment is determined by two contour pixels (xk,yk) and
(xk+ǫ,yk+ǫ) taken a certain distance ǫ apart. The angle that the fragment makes with
the horizontal is computed using
φ = arctan(yk+ǫ − yk
xk+ǫ − xk
) (4.1)
As the algorithm runs over the contour, the histogram of angles is built. This angle
histogram is then normalized to a probability distribution f1 which gives the proba-
bility of finding in the signature image a contour fragment oriented with each φ. The
angle φ resides in the first two quadrants because, without online information, we do
not know which inclination the writer signed with. The histogram is spanned in the
interval 0◦-180◦, and is divided in n = 12 sections (bins). Therefore, each section spans
15◦, which is a sufficiently detailed and robust description (Bulacu and Schomaker,
2007). We also set ǫ = 5. These settings will be used for all of the directional features
presented in this chapter.
Contour-Hinge PDF (f2)
In order to capture the curvature of the contour, as well as its orientation, the
“hinge” feature f2 is used. The main idea is to consider two contour fragments at-
tached at a common end pixel and compute the joint probability distribution of the
orientations φ1 and φ2 of the two sides. A joint density function is obtained, which
120

4.6 Contribution: Signature matcher based on local contour analysis
Contour direction (f1) Contour hinge (f2)
CAPACITIVE SENSOR
Horizontal direction co-occurrence (f3h)
Figure 4.20: Graphical description of the feature extraction. From left toright: contour direction (f1), contour hinge (f2) and horizontal directionco-occurrence (f3h).
quantifies the chance of finding two “hinged” contour fragments with angles φ1 and φ2,
respectively. It is spanned in the four quadrants (360◦) and there are 2n sections for
every side of the “contour-hinge”, but only non-redundant combinations are considered
(i.e. φ2 ≥ φ1). For n = 12, the resulting contour-hinge feature vector has 300 dimen-
sions (Bulacu and Schomaker, 2007).
Direction Co-Occurrence PDFs (f3h, f3v)
Based on the same idea of combining oriented contour fragments, the directional
co-occurrence is used. For this feature, the combination of contour-angles occurring at
the ends of run-lengths on the background are used, see Figure 4.20. Horizontal runs
along the rows of the image generate f3h and vertical runs along the columns generate
f3v. They are also joint density functions, spanned in the two first quadrants, and
divided into n2 sections. These features give a measure of a roundness of the written
characters and/or strokes.
121

4. QUALITY ASSESSMENT OF SIGNATURE IMAGES
Run-Length PDFs (f5h, f5v)
These features are computed from the binary image of the signature taking into
consideration the pixels corresponding to the background. They capture the regions
enclosed inside the letters and strokes and also the empty spaces between them. The
probability distributions of horizontal and vertical lengths are used.
4.6.3 Feature matching
Each client of the system (enrolee) is represented by a PDF that is computed using
an enrolment set of K signatures. For each feature, the histogram of the K signatures
together is computed and then normalized to a probability distribution.
To compute the similarity between a claimed identity q and a given signature i, the
χ2 distance is used (Bulacu and Schomaker, 2007):
χ2qi =
N∑
n=1
(pq[n] − pi[n])2
pq[n] + pi[n](4.2)
where p are entries in the PDF, n is the bin index, and N is the number of bins in the
PDF (the dimensionality).
We also perform experiments combining the different features. The final distance
in this case is computed as the mean value of the χ2 distances due to the individual
features, which are first normalized to be similarity scores in the [0, 1] range using the
tanh-estimators described by Jain et al. (2005):
s′ =1
2
{tanh
(0.01
(s − µs
σs
))+ 1
}(4.3)
where s is the raw similarity score, s′ denotes the normalized similarity score, and µs
and σs are respectively the estimated mean and standard deviation of the genuine score
distribution.
4.6.4 System development
The system performance for a posteriori user-dependent score normalization following
the experimental procedure of Section 4.3 is given in Table 4.3 (individual features) and
Table 4.4 (combination of features). DET curves for the individual features without
score normalization are plotted in Figure 4.21.
122
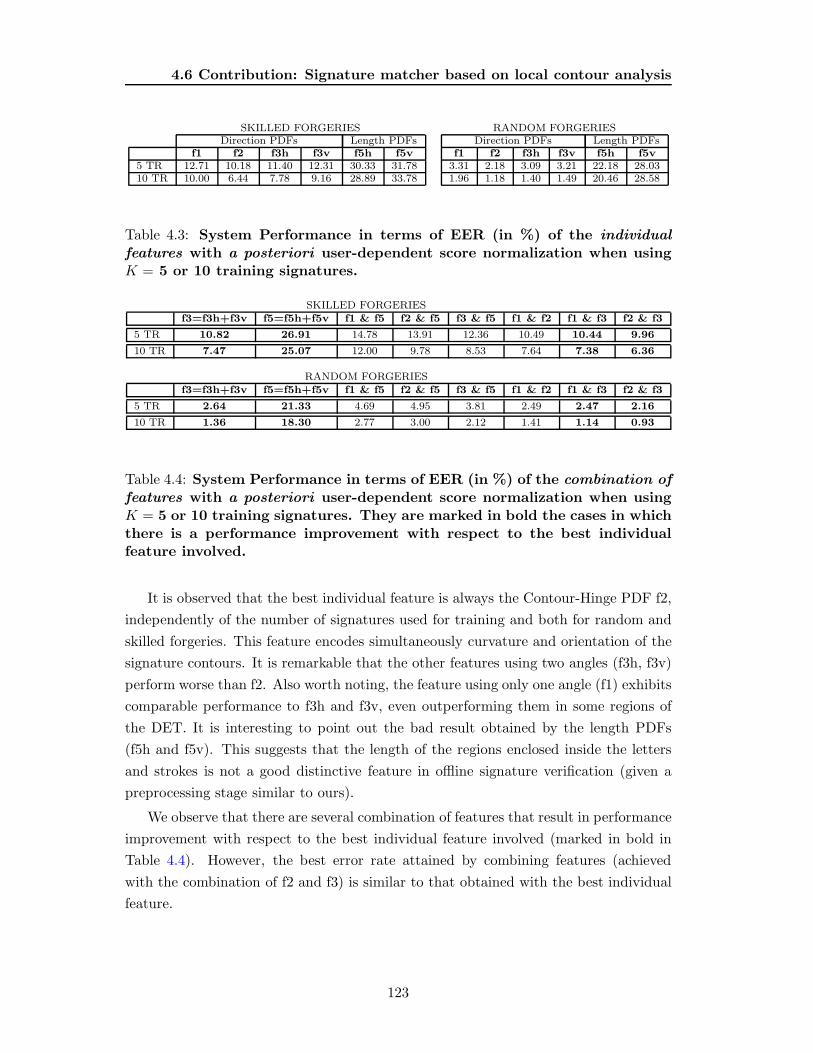
4.6 Contribution: Signature matcher based on local contour analysis
SKILLED FORGERIES RANDOM FORGERIESDirection PDFs Length PDFs Direction PDFs Length PDFs
f1 f2 f3h f3v f5h f5v f1 f2 f3h f3v f5h f5v5 TR 12.71 10.18 11.40 12.31 30.33 31.78 3.31 2.18 3.09 3.21 22.18 28.0310 TR 10.00 6.44 7.78 9.16 28.89 33.78 1.96 1.18 1.40 1.49 20.46 28.58
Table 4.3: System Performance in terms of EER (in %) of the individual
features with a posteriori user-dependent score normalization when usingK = 5 or 10 training signatures.
SKILLED FORGERIESf3=f3h+f3v f5=f5h+f5v f1 & f5 f2 & f5 f3 & f5 f1 & f2 f1 & f3 f2 & f3
5 TR 10.82 26.91 14.78 13.91 12.36 10.49 10.44 9.96
10 TR 7.47 25.07 12.00 9.78 8.53 7.64 7.38 6.36
RANDOM FORGERIESf3=f3h+f3v f5=f5h+f5v f1 & f5 f2 & f5 f3 & f5 f1 & f2 f1 & f3 f2 & f3
5 TR 2.64 21.33 4.69 4.95 3.81 2.49 2.47 2.16
10 TR 1.36 18.30 2.77 3.00 2.12 1.41 1.14 0.93
Table 4.4: System Performance in terms of EER (in %) of the combination of
features with a posteriori user-dependent score normalization when usingK = 5 or 10 training signatures. They are marked in bold the cases in whichthere is a performance improvement with respect to the best individualfeature involved.
It is observed that the best individual feature is always the Contour-Hinge PDF f2,
independently of the number of signatures used for training and both for random and
skilled forgeries. This feature encodes simultaneously curvature and orientation of the
signature contours. It is remarkable that the other features using two angles (f3h, f3v)
perform worse than f2. Also worth noting, the feature using only one angle (f1) exhibits
comparable performance to f3h and f3v, even outperforming them in some regions of
the DET. It is interesting to point out the bad result obtained by the length PDFs
(f5h and f5v). This suggests that the length of the regions enclosed inside the letters
and strokes is not a good distinctive feature in offline signature verification (given a
preprocessing stage similar to ours).
We observe that there are several combination of features that result in performance
improvement with respect to the best individual feature involved (marked in bold in
Table 4.4). However, the best error rate attained by combining features (achieved
with the combination of f2 and f3) is similar to that obtained with the best individual
feature.
123
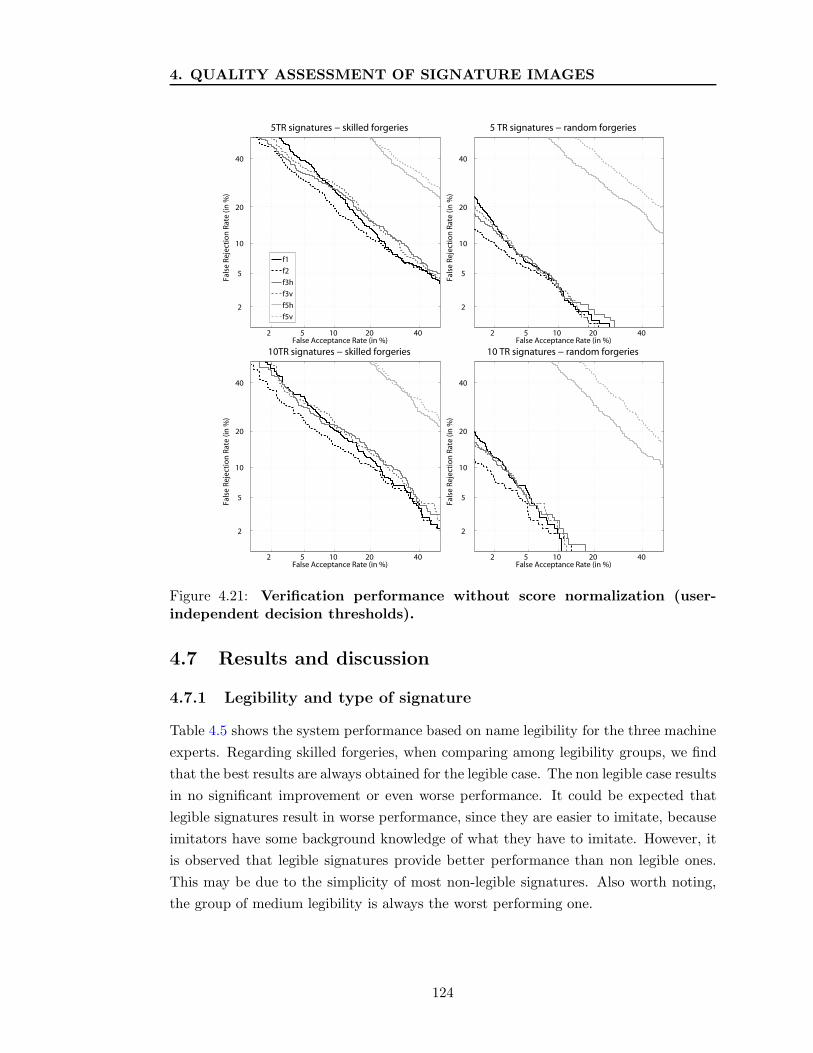
4. QUALITY ASSESSMENT OF SIGNATURE IMAGES
2 5 10 20 40
2
5
10
20
40
False Acceptance Rate (in %)
Fa
lse
Re
ject
ion
Ra
te (
in %
)
5TR signatures − skilled forgeries
f1
f2
f3h
f3v
f5h
f5v
2 5 10 20 40
2
5
10
20
40
False Acceptance Rate (in %)
Fa
lse
Re
ject
ion
Ra
te (
in %
)
5 TR signatures − random forgeries
2 5 10 20 40
2
5
10
20
40
False Acceptance Rate (in %)
Fa
lse
Re
ject
ion
Ra
te (
in %
)
10TR signatures − skilled forgeries
2 5 10 20 40
2
5
10
20
40
False Acceptance Rate (in %)
Fa
lse
Re
ject
ion
Ra
te (
in %
)
10 TR signatures − random forgeries
Figure 4.21: Verification performance without score normalization (user-independent decision thresholds).
4.7 Results and discussion
4.7.1 Legibility and type of signature
Table 4.5 shows the system performance based on name legibility for the three machine
experts. Regarding skilled forgeries, when comparing among legibility groups, we find
that the best results are always obtained for the legible case. The non legible case results
in no significant improvement or even worse performance. It could be expected that
legible signatures result in worse performance, since they are easier to imitate, because
imitators have some background knowledge of what they have to imitate. However, it
is observed that legible signatures provide better performance than non legible ones.
This may be due to the simplicity of most non-legible signatures. Also worth noting,
the group of medium legibility is always the worst performing one.
124

4.7 Results and discussion
Skilled forgeriesTR sign expert Non legible Medium Legible Overall
global 24.91 26.49 21.58 23.785 local HMM 16.67 21.23 16.54 17.76
local contour 10.93 13.42 8.20 10.18
global 21.11 25.17 20.55 22.1310 local HMM 16.67 20.00 10.61 14.44
local contour 7.04 11.58 4.21 6.44
Non legible Medium Legible0
5
10
15
20
25
30
EE
R (
%)
5 TR SIGNATURES − SKILLED FORGERIES
Global expert
Local HMM expert
Local contour expert
−9.25%
−6.87%
−19.45%
+31.83%
+19.54%
+11.40%
Non legible Medium Legible0
5
10
15
20
25
30
EE
R (
%)
10 TR SIGNATURES − SKILLED FORGERIES
Global expert
Local HMM expert
Local contour expert
−7.14%
−26.52%
−34.63%
+13.74%
+38.50%
+13.74%
+79.81%
Random forgeriesTR sign expert Non legible Medium Legible Overall
global 8.41 10.58 9.94 9.795 local HMM 4.45 5.26 5.59 5.21
local contour 2.96 1.70 1.93 2.18
global 6.57 9.47 5.97 7.2610 local HMM 1.51 2.28 3.27 2.74
local contour 2.34 0.49 1.05 1.18
Non legible Medium Legible0
2
4
6
8
10
12
EE
R (
%)
5 TR SIGNATURES − RANDOM FORGERIES
Global expert
Local HMM expert
Local contour expert
−14.10%
−14.59%
−22.02%
+8.07%
+7.29%
+35.78%
Non legible Medium Legible0
2
4
6
8
10
12
EE
R (
%)
10 TR SIGNATURES − RANDOM FORGERIES
Global expert
Local HMM expert
Local contour expert
−17.77%
−44.89% −58.48%
+30.44%
+19.34%+98.31%
Table 4.5: System performance based on name legibility in terms of EER.Results are given in %. Grey dashed lines denote the overall performanceof each matcher in the whole dataset. For each matcher, it is also given therelative gain/loss of performance with respect to the overall results.
125
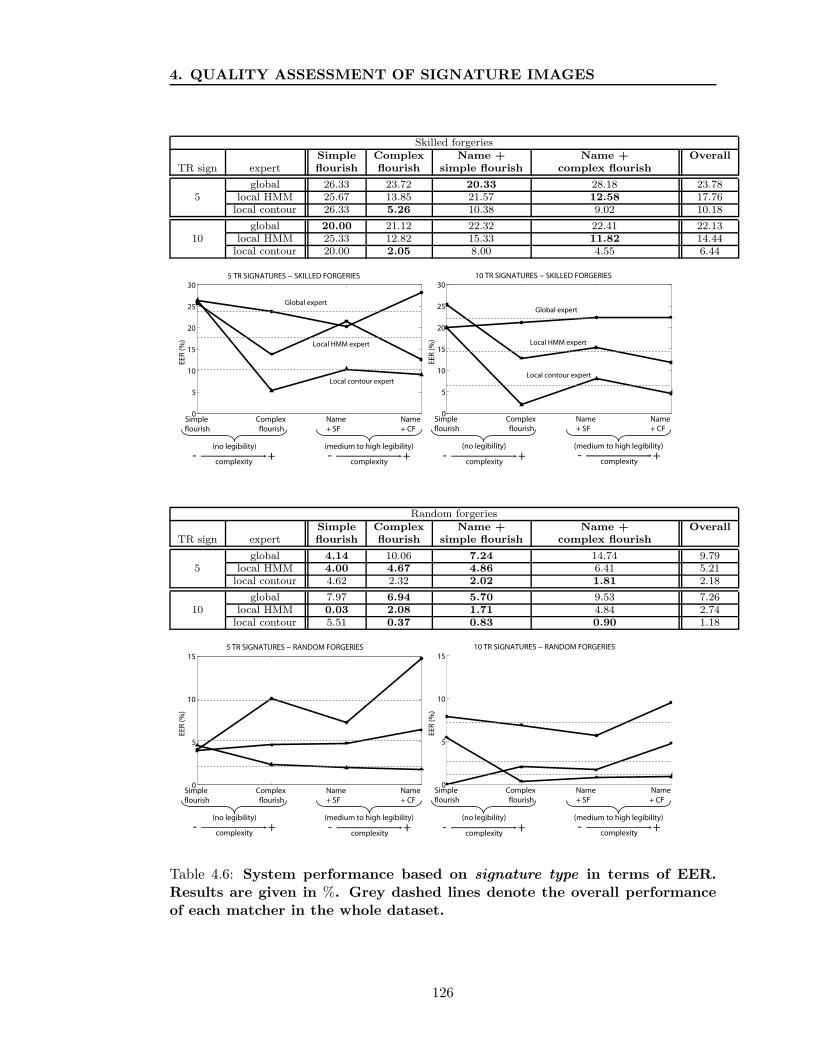
4. QUALITY ASSESSMENT OF SIGNATURE IMAGES
Skilled forgeriesSimple Complex Name + Name + Overall
TR sign expert flourish flourish simple flourish complex flourish
global 26.33 23.72 20.33 28.18 23.785 local HMM 25.67 13.85 21.57 12.58 17.76
local contour 26.33 5.26 10.38 9.02 10.18
global 20.00 21.12 22.32 22.41 22.1310 local HMM 25.33 12.82 15.33 11.82 14.44
local contour 20.00 2.05 8.00 4.55 6.44
Simple
flourish
Complex
flourish
Name
+ SF
Name
+ CF
0
5
10
15
20
25
30
EE
R (
%)
5 TR SIGNATURES − SKILLED FORGERIES
Global expert
Local HMM expert
Local contour expert
(no legibility) (medium to high legibility)
complexity- +
complexity- +
Simple
flourish
Complex
flourish
Name
+ SF
Name
+ CF
0
5
10
15
20
25
30
EE
R (
%)
10 TR SIGNATURES − SKILLED FORGERIES
Global expert
Local HMM expert
Local contour expert
(no legibility) (medium to high legibility)
complexity- +
complexity- +
Random forgeriesSimple Complex Name + Name + Overall
TR sign expert flourish flourish simple flourish complex flourish
global 4.14 10.06 7.24 14.74 9.795 local HMM 4.00 4.67 4.86 6.41 5.21
local contour 4.62 2.32 2.02 1.81 2.18
global 7.97 6.94 5.70 9.53 7.2610 local HMM 0.03 2.08 1.71 4.84 2.74
local contour 5.51 0.37 0.83 0.90 1.18
Simple
flourish
Complex
flourish
Name
+ SF
Name
+ CF
0
5
10
15
EE
R (
%)
5 TR SIGNATURES − RANDOM FORGERIES
(no legibility) (medium to high legibility)
complexity- +
complexity- +
Simple
flourish
Complex
flourish
Name
+ SF
Name
+ CF
0
5
10
15
EE
R (
%)
10 TR SIGNATURES − RANDOM FORGERIES
(no legibility) (medium to high legibility)
complexity- +
complexity- +
Table 4.6: System performance based on signature type in terms of EER.Results are given in %. Grey dashed lines denote the overall performanceof each matcher in the whole dataset.
126
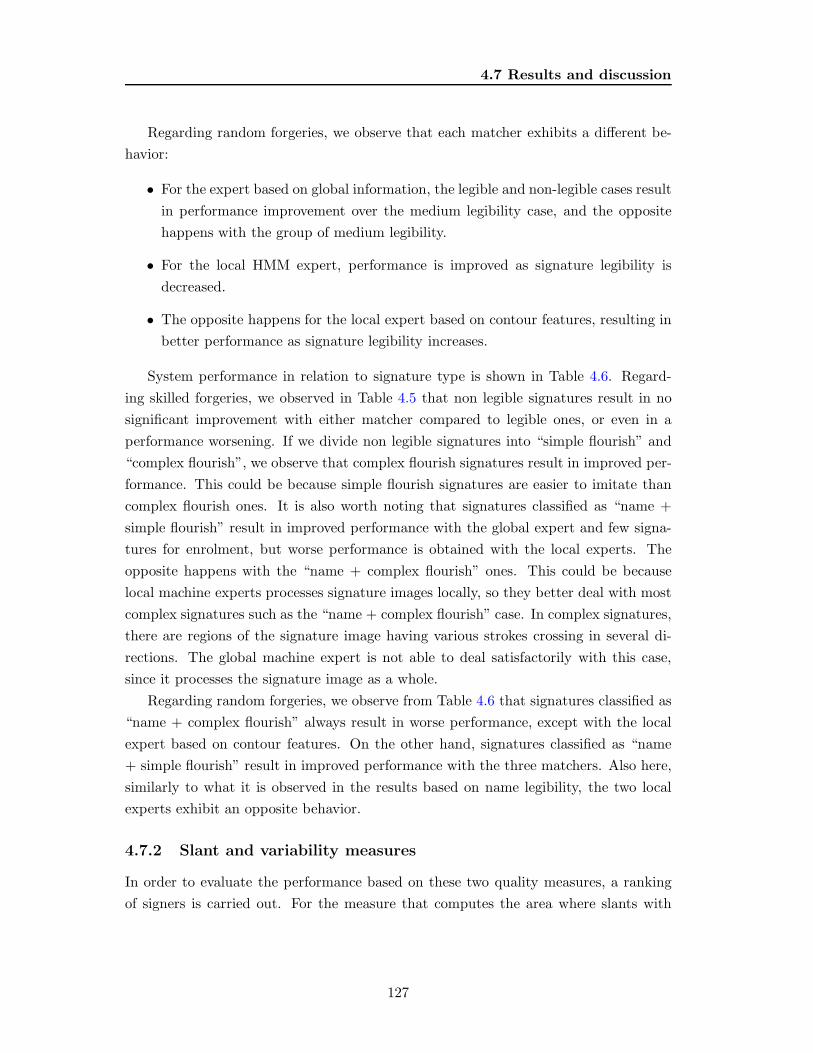
4.7 Results and discussion
Regarding random forgeries, we observe that each matcher exhibits a different be-
havior:
• For the expert based on global information, the legible and non-legible cases result
in performance improvement over the medium legibility case, and the opposite
happens with the group of medium legibility.
• For the local HMM expert, performance is improved as signature legibility is
decreased.
• The opposite happens for the local expert based on contour features, resulting in
better performance as signature legibility increases.
System performance in relation to signature type is shown in Table 4.6. Regard-
ing skilled forgeries, we observed in Table 4.5 that non legible signatures result in no
significant improvement with either matcher compared to legible ones, or even in a
performance worsening. If we divide non legible signatures into “simple flourish” and
“complex flourish”, we observe that complex flourish signatures result in improved per-
formance. This could be because simple flourish signatures are easier to imitate than
complex flourish ones. It is also worth noting that signatures classified as “name +
simple flourish” result in improved performance with the global expert and few signa-
tures for enrolment, but worse performance is obtained with the local experts. The
opposite happens with the “name + complex flourish” ones. This could be because
local machine experts processes signature images locally, so they better deal with most
complex signatures such as the “name + complex flourish” case. In complex signatures,
there are regions of the signature image having various strokes crossing in several di-
rections. The global machine expert is not able to deal satisfactorily with this case,
since it processes the signature image as a whole.
Regarding random forgeries, we observe from Table 4.6 that signatures classified as
“name + complex flourish” always result in worse performance, except with the local
expert based on contour features. On the other hand, signatures classified as “name
+ simple flourish” result in improved performance with the three matchers. Also here,
similarly to what it is observed in the results based on name legibility, the two local
experts exhibit an opposite behavior.
4.7.2 Slant and variability measures
In order to evaluate the performance based on these two quality measures, a ranking
of signers is carried out. For the measure that computes the area where slants with
127
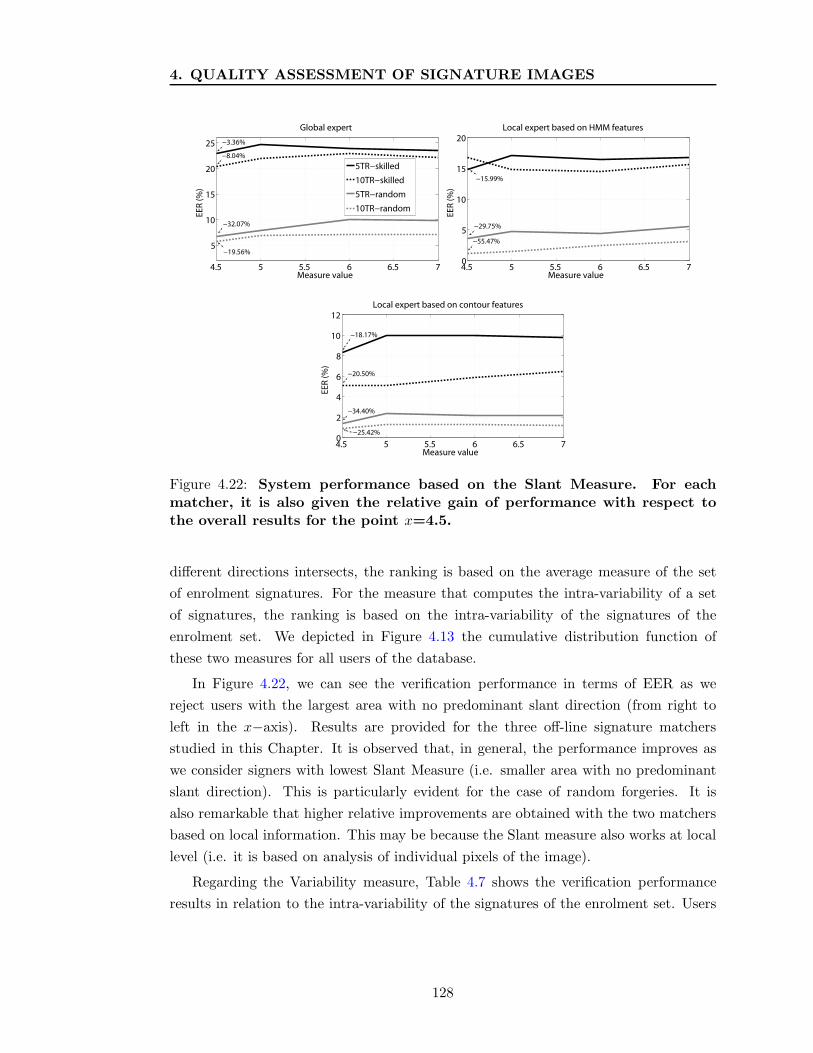
4. QUALITY ASSESSMENT OF SIGNATURE IMAGES
4.5 5 5.5 6 6.5 7
5
10
15
20
25
Measure value
EE
R (
%)
Global expert
5TR−skilled
10TR−skilled
5TR−random
10TR−random
−3.36%
−8.04%
−32.07%
−19.56%
4.5 5 5.5 6 6.5 70
5
10
15
20
Measure value
EE
R (
%)
Local expert based on HMM features
−15.99%
−29.75%
−55.47%
CAPACITIVE SENSOR
4.5 5 5.5 6 6.5 70
2
4
6
8
10
12
Measure value
EE
R (
%)
Local expert based on contour features
−18.17%
−20.50%
−34.40%
−25.42%
Figure 4.22: System performance based on the Slant Measure. For eachmatcher, it is also given the relative gain of performance with respect tothe overall results for the point x=4.5.
different directions intersects, the ranking is based on the average measure of the set
of enrolment signatures. For the measure that computes the intra-variability of a set
of signatures, the ranking is based on the intra-variability of the signatures of the
enrolment set. We depicted in Figure 4.13 the cumulative distribution function of
these two measures for all users of the database.
In Figure 4.22, we can see the verification performance in terms of EER as we
reject users with the largest area with no predominant slant direction (from right to
left in the x−axis). Results are provided for the three off-line signature matchers
studied in this Chapter. It is observed that, in general, the performance improves as
we consider signers with lowest Slant Measure (i.e. smaller area with no predominant
slant direction). This is particularly evident for the case of random forgeries. It is
also remarkable that higher relative improvements are obtained with the two matchers
based on local information. This may be because the Slant measure also works at local
level (i.e. it is based on analysis of individual pixels of the image).
Regarding the Variability measure, Table 4.7 shows the verification performance
results in relation to the intra-variability of the signatures of the enrolment set. Users
128

4.7 Results and discussion
Skilled forgeriesTR sign expert I (low var) II (med) III (high) Overall
global 20.33 25.73 24.27 23.785 local HMM 16.13 18.07 19.2 17.76
local contour 8.13 11.33 11.53 10.18
global 22.67 20.13 23.20 22.1310 local HMM 17.6 10.4 15.33 14.44
local contour 4.93 6.53 7.6 6.44
0
5
10
15
20
25
EE
R (
%)
5TR SIGNATURES − SKILLED FORGERIES
0
5
10
15
20
25
EE
R (
%)
5TR SIGNATURES − SKILLED FORGERIES
Global expert
Local HMMexpert
Local contourexpert
−14.51%
−9.18%
−20.14%
+7.58%
+8.1%
+13.26%
I II IIILow variability Medium variability High variability
0
5
10
15
20
25
EE
R (
%)
10 TR SIGNATURES − SKILLED FORGERIES
Global expert
Local HMM expert
Local contour expert
−9.04%
−27.98%
−23.45%
+4.84%
+21.88%
+18.01%
I II IIILow variability Medium variability High variability
Random forgeriesTR sign expert I (low var) II (med) III (high) Overall
global 8.05 9.85 11.46 9.795 local HMM 2.87 5.62 6.99 5.21
local contour 1.36 2.44 2.55 2.18
global 6.62 5.90 8.91 7.2610 local HMM 1.82 2.58 3.36 2.74
local contour 1.64 0.82 1.17 1.18
I II III
0
2
4
6
8
10
12
EE
R (
%)
5 TR SIGNATURES − RANDOM FORGERIES
Global expert
Local HMM expert
Local contour expert
−17.77%
−37.61%
−44.91%
+17.06%
+34.17%
+16.97%
Low variability Medium variability High variability
0
2
4
6
8
10
12
EE
R (
%)
10 TR SIGNATURES − RANDOM FORGERIES
Global expert
Local HMM expert
Local contour expert
−18.73%
−33.58%
−30.51%
+22.73%
+22.63%
+38.98%
I II IIILow variability Medium variability High variability
Table 4.7: System performance based on the Variability Measure in termsof EER (results are given in %). Grey dashed lines denote the overallperformance of each matcher in the whole dataset. For each matcher, it isalso given the relative gain/loss of performance with respect to the overallresults.
129

4. QUALITY ASSESSMENT OF SIGNATURE IMAGES
Low Medium High
5
10
15
20
25
5TR SIGNATURES − SKILLED FORGERIES
Measure value
EE
R
Global expert
Local HMM expert
Local contour expert
Low Medium High
5
10
15
20
25
10TR SIGNATURES − SKILLED FORGERIES
Measure value
EE
R
Global expert
Local HMM expert
Local contour expert
(a) Skilled forgeries
Low Medium High0
2
4
6
8
10
12
145TR SIGNATURES − RANDOM FORGERIES
Measure value
EE
R
Global expert
Local HMM expert
Local contour expert
Low Medium High0
2
4
6
8
10
12
10TR SIGNATURES − RANDOM FORGERIES
Measure valueE
ER
Global expert
Local HMM expert
Local contour expert
(b) Random forgeries
Figure 4.23: System performance based on the gray level variance acrosssignature strokes. Grey dashed lines denote the overall performance ofeach matcher in the whole dataset.
are classified into three equal-sized disjoint groups, from I (low variability) to III (high
variability), resulting in 25 users per group. It is observed that:
• Performance is always worsened with a highly variable set of signatures (group
III), specially with few enrolment data.
• With few signatures for enrolment, the best performance is obtained with the
least variable set (group I), but allowing more signatures for enrolment, the best
performance is obtained in most cases for the group II.
An explanation of these results is as follows. Supposing high variability and few en-
rolment data, we are not able to build a reliable identity model, suffering lack of data
with which to characterize the signature style. As we increase the size of the enrolment
set, we are able to account for more variability. Nevertheless, very high variability is
a source of uncertainty and it is not desirable, as shown by the fact that signatures of
the group III always result in a worsened performance.
130
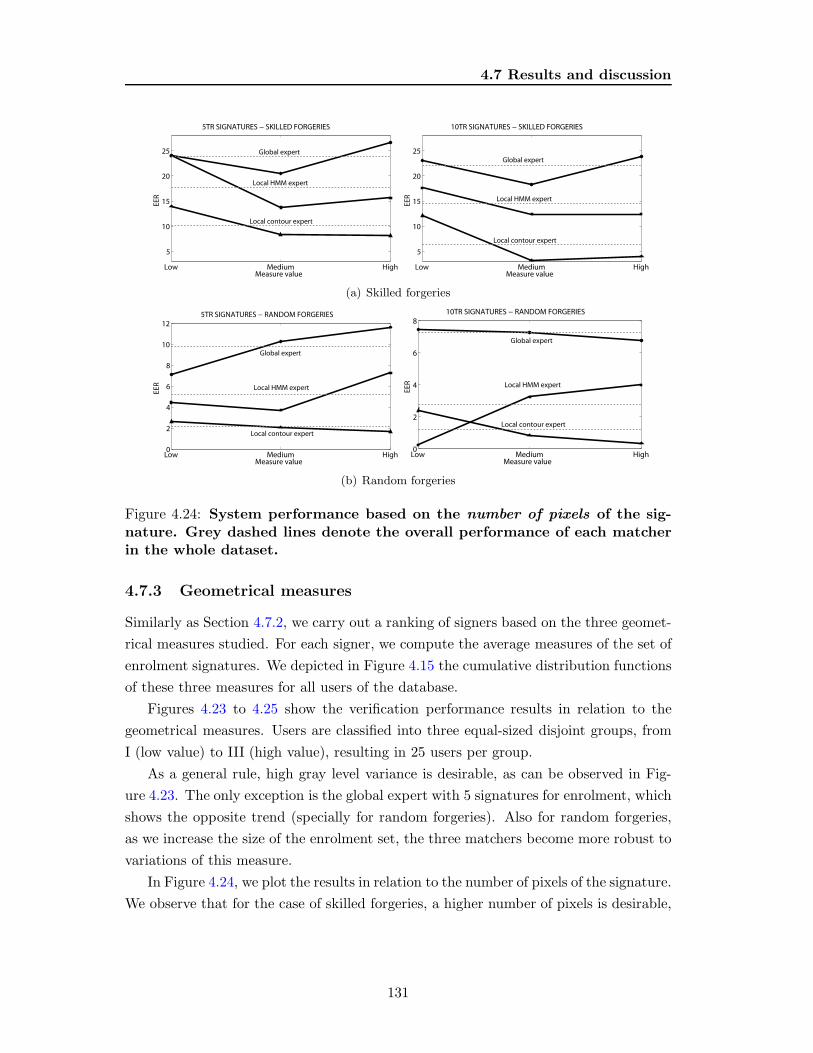
4.7 Results and discussion
Low Medium High
5
10
15
20
25
5TR SIGNATURES − SKILLED FORGERIES
Measure value
EE
RGlobal expert
Local HMM expert
Local contour expert
Low Medium High
5
10
15
20
25
10TR SIGNATURES − SKILLED FORGERIES
Measure value
EE
R
Global expert
Local HMM expert
Local contour expert
(a) Skilled forgeries
Low Medium High0
2
4
6
8
10
125TR SIGNATURES − RANDOM FORGERIES
Measure value
EE
R
Global expert
Local HMM expert
Local contour expert
Low Medium High0
2
4
6
810TR SIGNATURES − RANDOM FORGERIES
Measure value
EE
R
Global expert
Local HMM expert
Local contour expert
(b) Random forgeries
Figure 4.24: System performance based on the number of pixels of the sig-nature. Grey dashed lines denote the overall performance of each matcherin the whole dataset.
4.7.3 Geometrical measures
Similarly as Section 4.7.2, we carry out a ranking of signers based on the three geomet-
rical measures studied. For each signer, we compute the average measures of the set of
enrolment signatures. We depicted in Figure 4.15 the cumulative distribution functions
of these three measures for all users of the database.
Figures 4.23 to 4.25 show the verification performance results in relation to the
geometrical measures. Users are classified into three equal-sized disjoint groups, from
I (low value) to III (high value), resulting in 25 users per group.
As a general rule, high gray level variance is desirable, as can be observed in Fig-
ure 4.23. The only exception is the global expert with 5 signatures for enrolment, which
shows the opposite trend (specially for random forgeries). Also for random forgeries,
as we increase the size of the enrolment set, the three matchers become more robust to
variations of this measure.
In Figure 4.24, we plot the results in relation to the number of pixels of the signature.
We observe that for the case of skilled forgeries, a higher number of pixels is desirable,
131

4. QUALITY ASSESSMENT OF SIGNATURE IMAGES
Low Medium High
5
10
15
20
25
5TR SIGNATURES − SKILLED FORGERIES
Measure value
EE
R
Global expert
Local HMM expert
Local contour expert
Low Medium High
5
10
15
20
25
10TR SIGNATURES − SKILLED FORGERIES
Measure value
EE
R
Global expert
Local HMM expert
Local contour expert
(a) Skilled forgeries
Low Medium High0
2
4
6
8
10
125TR SIGNATURES − RANDOM FORGERIES
Measure value
EE
R
Global expert
Local HMM expert
Local contour expert
Low Medium High0
2
4
6
8
10
1210TR SIGNATURES − RANDOM FORGERIES
Measure valueE
ER
Global expert
Local HMM expert
Local contour expert
(b) Random forgeries
Figure 4.25: System performance based on the size of the bounding box ofthe signature. Grey dashed lines denote the overall performance of eachmatcher in the whole dataset.
except for the global expert. If we consider this measure as an estimation of the
signature duration, we can conclude that longer signatures are in general more robust
to imitations. On ther other hand, for the case of random forgeries we observe that
each matcher exhibits a different behavior:
• For the expert based on global information, the behavior depends of the size of
the enrolment set.
• For the local HMM expert, performance is improved as signature duration is
decreased.
• The opposite happens for the local expert based on contour features, resulting in
better performance as signature duration is increased.
Finally, we plot in Figure 4.25 results in relation to the size of the bounding box
that contains the signature. For this measure, no consensus between the matchers is
found:
132

4.8 Chapter summary and conclusions
• The global expert performs better in general as the size of the box is decreased.
The same behavior is observed for the local HMM expert, except with skilled
forgeries and few training signatures.
• Contrarily, the local expert based on contour features works better as the size
of the box is increased. Also, for random forgeries, this matcher shows high
robustness to variations of this measure.
4.8 Chapter summary and conclusions
The performance of three approaches for off-line signature recognition has been evalu-
ated in terms of several measures that are extracted from signature images. The three
matchers make use of different approaches that are based on global and local image
analysis. The following five measures have been studied in this chapter to predict the
performance of the system:
• Two manually assessed measures, signature legibility and signature type, aimed
at evaluating how the knowledge about letters, syllables or name instances may
help in the process of imitating a signature.
• One measure that computes the area of a signature where slants with different
directions intersect, which could be considered as a measure of complexity.
• One measure that computes the intra-variability of a given set of signatures with
the aim of estimating its stability.
• Three geometrical measures aimed at evaluating the variance of the pen pressure
during the process of signing, the signature duration and the signature area.
A number of experimental findings are obtained in this chapter. First, for skilled
forgeries, we find that the best performance is obtained with legible signatures. Also,
performance is always worsened with highly variable signatures, specially with few
enrolment data, or with low variance of the pen pressure. For the other measures,
different behavior is observed between the matchers.
This chapter presents novel contributions in the verification system based on contour
analysis, in the proposed measures intended to predict the performance of signature
systems, and in the study of their utility for three different matchers.
133

4. QUALITY ASSESSMENT OF SIGNATURE IMAGES
134

Chapter 5
Quality-Based Processing and
Fusion in Multibiometrics
This chapter describes a quality-based fusion strategy developed in the frame-
work of this Thesis that has been submitted to the recent quality-based Evaluation
of the BioSecure Multimodal Evaluation Campaign (BMEC, 2007; Poh and Bourlai,
2007), with very good results (2nd position in terms of Half Total Error Rate out of 13
systems participating) (BMEC, 2007). It makes use of linear logistic regression fusion
(Brummer et al., 2007; Pigeon et al., 2000), a trained classification fusion approach,
in such a way that good calibration of the output score is encouraged. Calibration
means that output scores are mapped to log-likelihood-ratios (LLR). This allows to
efficiently combine scores originated from different biometric devices, as is the case of
the quality-based evaluation.
The aim of this evaluation was to compare several fusion algorithms when bio-
metric signals were originated from several face and fingerprint biometric devices in
mismatched conditions. Face still samples collected with two cameras of different res-
olution and fingerprint samples collected both with an optical and a thermal sensor
were used in the evaluation. Quality information of the biometric samples was also
provided with the aim of adapting the fusion algorithms to the different devices. These
samples were extracted from the recently acquired Biosecure Multimodal Database
(Alonso-Fernandez et al., 2008b), acquired in the framework of this Thesis.
In this chapter, we contribute with a quality-based multibiometric architecture that
is generalizable to biometric systems working with multiple sources of information (dif-
ferent modalities, matchers, acquisition devices, etc.). So far, incorporation of qual-
135

5. QUALITY-BASED PROCESSING AND FUSION INMULTIBIOMETRICS
ity measures has been done mostly by heuristically adapting the biometric system
(Kryszczuk, 2007). With the proposed architecture, newer developments and additional
modalities can be easily incorporated, while efficiently handling information from the
different sources. In our approach, quality is used to switch between different system
modules depending on the data source, and to consider only data of enough quality.
The proposed fusion scheme is compared in this chapter with a set of simple fusion
rules. The use of simple fusion rules is motivated by the fact that complex trained
fusion approaches do not clearly outperform simple fusion approaches, e.g. see Fierrez-
Aguilar et al. (2005c). We demonstrate in our experiments that the proposed system
outperforms the rest when coping with signals originated from heterogeneous biometric
sources, pointing out the effectiveness of the proposed approach. An additional overall
improvement of 25% is observed in the EER by incorporating a quality-based score
rejection scheme, showing the benefits of incorporating quality information in biometric
systems.
This chapter is structured as follows. We first survey the related works on multi-
biometric systems and the use of quality information in biometric systems. Also, the
concepts of calibration and linear logistic regression fusion are introduced. We then
describe the evaluation framework and the dataset used in our experiments. The pro-
posed fusion architecture is then presented, and comprehensive experimental results
are finally given.
Original contributions in this chapter include the definition of a quality-based multi-
biometric architecture that is generalizable to biometric systems working with multiple
sources of information; the use of quality information to estimate the input device used
in the acquisition of biometric data in order to switch between different processing
modules; and the use of a score-rejection scheme that only considers sources of enough
quality in the fusion with the objective of improving the overall performance.
This chapter is based on the publication Alonso-Fernandez et al. (2008b).
5.1 Calibration and fusion of biometric systems
5.1.1 Calibration of scores from a biometric system
A biometric verification system can be defined as a pattern recognition machine that,
by comparing two (or more) samples of input signals such as speech, face images, etc.,
is designed to recognize two different classes. These two classes are known as target
or client class, if both samples were originated by the same subject, and non-target or
impostor class, if both samples were not originated by the same subject. As a result
136

5.1 Calibration and fusion of biometric systems
of the comparison, the biometric system outputs a real number known as score. The
sense of this score is that the higher scores, the more support to the target hypothesis,
and vice-versa. However, if we consider a single isolated score from a biometric system,
it is in general not possible to determine which is the hypothesis the score supports
the most. For instance, if we get a single score of 5 from a biometric system, and if we
do not know the distributions of target or non-target scores from such system or any
threshold, we will not be able to classify the associated biometric sample in general.
Moreover, each biometric system usually outputs scores which are in a range that is
specific of the system. For instance, a particular system can output scores in the [0, 1]
range, whereas another system can output scores in the [−1, 1] range. Therefore, an
score value of 0 has different meaning depending on the system. Even if two systems
output scores in the same range by means e.g. of score normalization (Jain et al., 2005),
the same output value might does not favor the target or non-target hypotheses with
the same strength. In this context, outputs are dependent of the system and thus, the
acceptance/rejection decision also depends on the system.
These problems are addressed with the concept of calibrated score. A calibration
transformation may be trained from a set of target and non-target scores from a given
biometric system, obtained from a database of known individuals. Such calibration
algorithms have been recently explored in the field of speaker recogniton. As it can be
seen in works by Brummer et al. (2007); Brummer and du Preez (2006); Ramos (2007),
a calibration transformation reduces the classification cost if the score is used as the
logarithm of a likelihood ratio (log-likelihood-ratio, LLR):
scal ≃ log
(p (s|ωi)
p (s|ωj)
)(5.1)
where s represents the score of a biometric system and scal the calibrated score. Then,
a decision can be taken using the Bayes decision rule (Duda et al., 2004):
Assign s → ωi ifp(s|ωi)p(s|ωj)
> τ, i 6= j and i, j = {0, 1} (5.2)
where p (s|ωi) /p (s|ωj) is a likelihood ratio and τ = P (ωj)/P (ωi) is a pre-determined
threshold that depends on the a priori probability of observing classes ωj and ωi1.
The more accurate the calibration of scal, the lower the misclassification cost of the
biometric system following Equation 5.2. Moreover, for a given set of scores, it can
1Bayes’ rule as expressed here assumes that the cost of each type of misclassification error is thesame for all possible classes (Duda et al., 2004). Since this particularization has not been consideredin this Thesis, we will not introduce misclassification costs for clarity.
137
5. QUALITY-BASED PROCESSING AND FUSION INMULTIBIOMETRICS
be demonstrated that optimal calibration means that the Bayes classification cost is
achieved (Brummer and du Preez, 2006), which is known to be minimum for the given
score dataset from a biometric system (Duda et al., 2004).
Some advantages of calibrated scores are highlighted here:
• As calibrated scores can be used as LLR in a Bayesian framework, we can therefore
state that a calibrated score is meaningful by itself. This is because, in a Bayesian
context, a LLR of a biometric score means a degree of support of such score for a
given hypothesis. For instance, LLR= 5 means that the score supports the target
hypothesis with a strength of e5 vs. 1 with respect to the non-target hypothesis.
• The meaning of a LLR value is the same across different biometric systems. This
advantage allows to compare systems in the same probabilistic range.
• Under independence assumptions, different calibrated scores from different bio-
metric systems can be easily combined, since the joint LLR of independent scores
is the sum of their individual LLR (Duda et al., 2004). Thus, by summing cali-
brated scores coming from independent sources, we also obtain a fused calibrated
LLR.
This calibration transformation then solves the two previously commented prob-
lems. First, it map scores from a biometric system to a common domain. Second, it
allows the interpretation of scores of a biometric system as a degree of support. Note
that the decision minimum-cost threshold for a calibrated score only depends on the
prior probabilities (Equation 5.2), and therefore it may be changed if such probabilities
change and are known. In this sense, calibration can be viewed as a score normalization
process, where the scores are mapped to a probabilistic domain.
The act of designing and optimizing a calibration transformation is also known as
calibration (Brummer and du Preez, 2006), and several strategies can be used to train
such mapping (Brummer and du Preez, 2006; Ramos, 2007). Among them, logistic
regression have been successfully and recently used for voice biometrics (Brummer et al.,
2007; Brummer and du Preez, 2006; Gonzalez-Rodriguez and Ramos, 2007; Gonzalez-
Rodriguez et al., 2007; Pigeon et al., 2000) and for score fusion using side information
(Ferrer et al., 2008).
5.1.2 Linear logistic regression fusion
We present here a linear logistic regression training method in which the scores of
multiple sub-systems are fused together, primarily to improve the discriminating ability
138

5.1 Calibration and fusion of biometric systems
(measured by ROC or DET curves (Martin et al., 1997)), in such a way as to encourage
good calibration of the output scores. Given N matchers which output the scores
(s1j, s2j , ...sNj) for an input trial j, a linear fusion of these scores is:
fj = a0 + a1 · s1j + a2 · s2j + ... + aN · sNj (5.3)
The constant a0 does not contribute to the discriminating ability of the fusion,
but it can improve the calibration of the fused score. When these weights {a0, ..., aN}are trained via logistic regression, the fused score fj tends to be a well-calibrated log-
likelihood-ratio (Brummer et al., 2007; Brummer and du Preez, 2006).
Let [sij] be an N × NT matrix of scores built from N component systems and NT
target trials, and let [rij ] be an N × NNT matrix of scores built from the same N
component systems with NNT non-target trials. We use a logistic regression objective
(Brummer et al., 2007; Pigeon et al., 2000) that is normalized with respect to the
proportion of target and non-target trials (NT and NNT , respectively), and weighted
with respect to a given prior probability P = P (target). The objective is stated in
terms of a cost C, which must be minimized :
C =P
NT
NT∑
j=1
log(1 + e−fj−logitP
)+
1 − P
NNT
NNT∑
j=1
log(1 + e−gj−logitP
)(5.4)
where the fused target and non-target scores are respectively:
fj = a0 +N∑
i=1aisij
gj = a0 +N∑
i=1airij
(5.5)
and where:
logitP = log
(P
1 − P
)(5.6)
It can be demonstrated that minimizing the objective C with respect to {a0, ..., aN}tends to give good calibration of the fused scores (Brummer et al., 2007; Brummer and
du Preez, 2006). In practice, it is observed that changing the value of P has a small
effect. The default of 0.5 is a good choice for a general application and it will be
used in this work. The optimization objective C is convex and therefore has a unique
global minimum. To find this minimum, a conjugate gradient algorithm can be used
(Brummer).
139
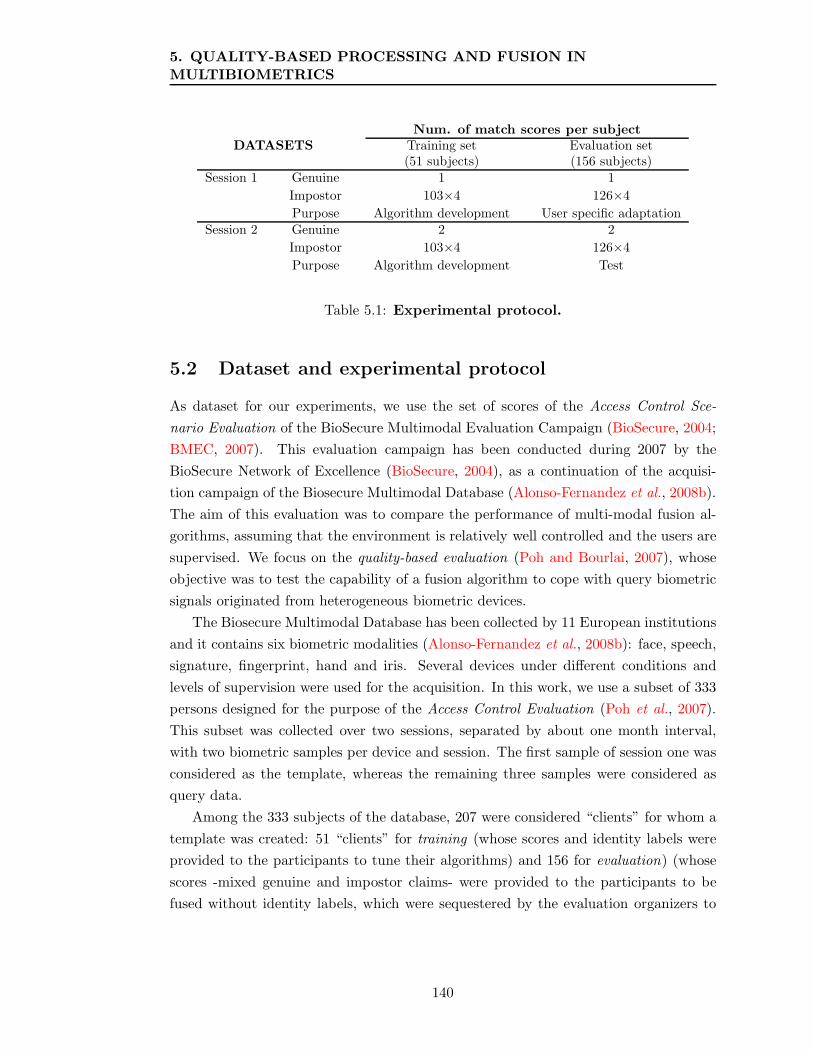
5. QUALITY-BASED PROCESSING AND FUSION INMULTIBIOMETRICS
Num. of match scores per subjectDATASETS Training set Evaluation set
(51 subjects) (156 subjects)Session 1 Genuine 1 1
Impostor 103×4 126×4
Purpose Algorithm development User specific adaptationSession 2 Genuine 2 2
Impostor 103×4 126×4
Purpose Algorithm development Test
Table 5.1: Experimental protocol.
5.2 Dataset and experimental protocol
As dataset for our experiments, we use the set of scores of the Access Control Sce-
nario Evaluation of the BioSecure Multimodal Evaluation Campaign (BioSecure, 2004;
BMEC, 2007). This evaluation campaign has been conducted during 2007 by the
BioSecure Network of Excellence (BioSecure, 2004), as a continuation of the acquisi-
tion campaign of the Biosecure Multimodal Database (Alonso-Fernandez et al., 2008b).
The aim of this evaluation was to compare the performance of multi-modal fusion al-
gorithms, assuming that the environment is relatively well controlled and the users are
supervised. We focus on the quality-based evaluation (Poh and Bourlai, 2007), whose
objective was to test the capability of a fusion algorithm to cope with query biometric
signals originated from heterogeneous biometric devices.
The Biosecure Multimodal Database has been collected by 11 European institutions
and it contains six biometric modalities (Alonso-Fernandez et al., 2008b): face, speech,
signature, fingerprint, hand and iris. Several devices under different conditions and
levels of supervision were used for the acquisition. In this work, we use a subset of 333
persons designed for the purpose of the Access Control Evaluation (Poh et al., 2007).
This subset was collected over two sessions, separated by about one month interval,
with two biometric samples per device and session. The first sample of session one was
considered as the template, whereas the remaining three samples were considered as
query data.
Among the 333 subjects of the database, 207 were considered “clients” for whom a
template was created: 51 “clients” for training (whose scores and identity labels were
provided to the participants to tune their algorithms) and 156 for evaluation) (whose
scores -mixed genuine and impostor claims- were provided to the participants to be
fused without identity labels, which were sequestered by the evaluation organizers to
140
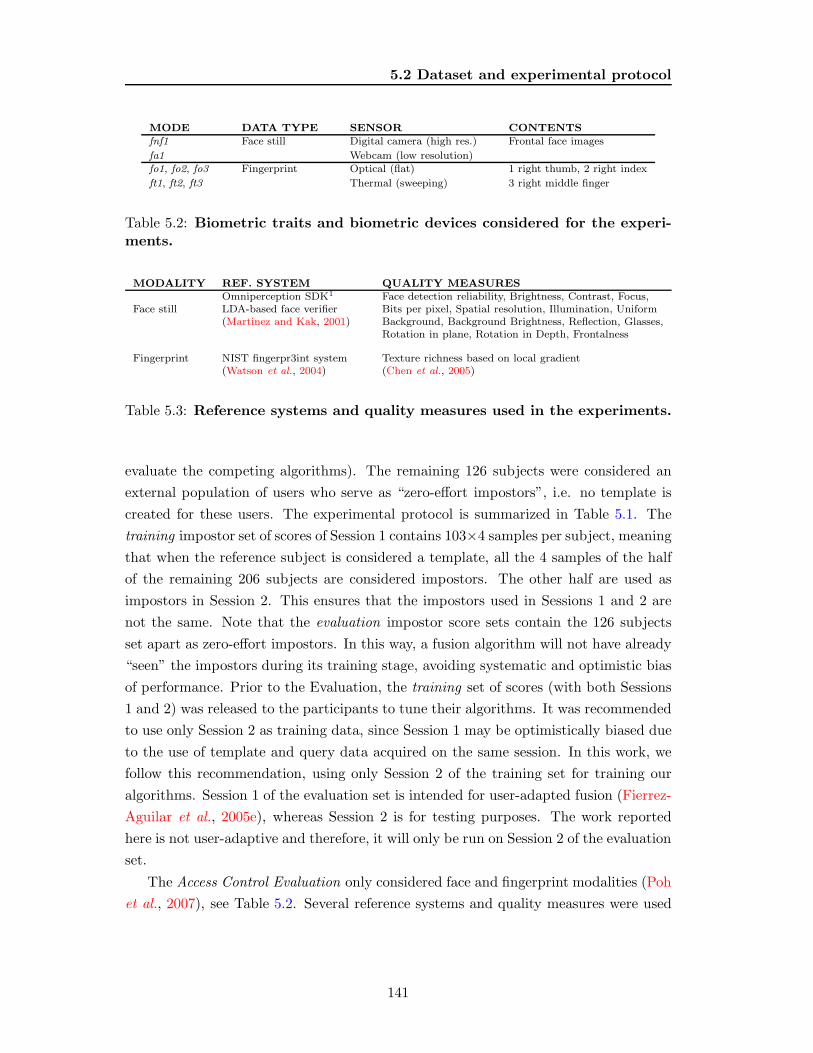
5.2 Dataset and experimental protocol
MODE DATA TYPE SENSOR CONTENTSfnf1 Face still Digital camera (high res.) Frontal face images
fa1 Webcam (low resolution)fo1, fo2, fo3 Fingerprint Optical (flat) 1 right thumb, 2 right index
ft1, ft2, ft3 Thermal (sweeping) 3 right middle finger
Table 5.2: Biometric traits and biometric devices considered for the experi-ments.
MODALITY REF. SYSTEM QUALITY MEASURESOmniperception SDK1 Face detection reliability, Brightness, Contrast, Focus,
Face still LDA-based face verifier Bits per pixel, Spatial resolution, Illumination, Uniform(Martinez and Kak, 2001) Background, Background Brightness, Reflection, Glasses,
Rotation in plane, Rotation in Depth, Frontalness
Fingerprint NIST fingerpr3int system Texture richness based on local gradient(Watson et al., 2004) (Chen et al., 2005)
Table 5.3: Reference systems and quality measures used in the experiments.
evaluate the competing algorithms). The remaining 126 subjects were considered an
external population of users who serve as “zero-effort impostors”, i.e. no template is
created for these users. The experimental protocol is summarized in Table 5.1. The
training impostor set of scores of Session 1 contains 103×4 samples per subject, meaning
that when the reference subject is considered a template, all the 4 samples of the half
of the remaining 206 subjects are considered impostors. The other half are used as
impostors in Session 2. This ensures that the impostors used in Sessions 1 and 2 are
not the same. Note that the evaluation impostor score sets contain the 126 subjects
set apart as zero-effort impostors. In this way, a fusion algorithm will not have already
“seen” the impostors during its training stage, avoiding systematic and optimistic bias
of performance. Prior to the Evaluation, the training set of scores (with both Sessions
1 and 2) was released to the participants to tune their algorithms. It was recommended
to use only Session 2 as training data, since Session 1 may be optimistically biased due
to the use of template and query data acquired on the same session. In this work, we
follow this recommendation, using only Session 2 of the training set for training our
algorithms. Session 1 of the evaluation set is intended for user-adapted fusion (Fierrez-
Aguilar et al., 2005e), whereas Session 2 is for testing purposes. The work reported
here is not user-adaptive and therefore, it will only be run on Session 2 of the evaluation
set.
The Access Control Evaluation only considered face and fingerprint modalities (Poh
et al., 2007), see Table 5.2. Several reference systems and quality measures were used
141

5. QUALITY-BASED PROCESSING AND FUSION INMULTIBIOMETRICS
DATA FORMAT - TRAINING SET<claimed ID> <true ID>
<fnf1 score> <quality measures of template of fnf1> <quality measures of query of fnf1>
<fo1 score> <quality measures of template of fo1> <quality measures of query of fo1>
<fo2 score> <quality measures of template of fo2> <quality measures of query of fo2>
<fo3 score> <quality measures of template of fo3> <quality measures of query of fo3>
<xfa1 score> <quality measures of template of xfa1> <quality measures of query of xfa1>
<xft1 score> <quality measures of template of xft1> <quality measures of query of xft1>
<xft2 score> <quality measures of template of xft2> <quality measures of query of xft2>
<xft3 score> <quality measures of template of xft3> <quality measures of query of xft3>
DATA FORMAT - EVALUATION SET<claimed ID>
<fnf1 |xfa1 score><quality measures of template of fnf1 |xfa1> <quality measures of query of fnf1 |xfa1>
<fo1 |xft1 score><quality measures of template of fo1 |xft1> <quality measures of query of fo1 |xft1>
<fo2 |xft2 score><quality measures of template of fo2 |xft2> <quality measures of query of fo2 |xft2>
<fo3 |xft3 score><quality measures of template of fo3 |xft3> <quality measures of query of fo3 |xft3>
MIXTURE MODALITIES FACE SENSOR FINGERPRINT SENSOR1 (fnf1/fo1/fo2/fo3 ) High resolution Flat acquisition
2 (fnf1/xft1/xft2/xft3 ) High resolution Sweep acquisition
3 (xfa1/fo1/fo2/fo3 ) Low resolution Flat acquisition
4 (xfa1/xft1/xft2/xft3 ) Low resolution Sweep acquisition
Table 5.4: Data format and possible mixtures for each access (the querysensors are specified, all templates acquired with the high resolution facecamera and the flat fingerprint sensor).
142

5.2 Dataset and experimental protocol
Canon EOS 30D Digital camera
Photo jpg 3504x2336 pixels
Philips SPC900NC WebcamPhoto bmp 640x480 pixels
Biometrika FX2000
Optical fingerprint sensor
bmp 296x560 pixels, 569 dpi
Atmel Yubee
Thermal fingerprint sensor
bmp 400x500 pixels, 500 dpi
Figure 5.1: Modalities considered in the Access Control Evaluation. Top row:hardware devices and acquisition samples for the face modality (left: lowresolution webcam, right: high resolution digital camera). Bottom row:hardware devices and acquisition samples for the fingerprint modality (left:optical sensor with flat positioning of the finger, right: thermal sensor withfinger sweeping).
with the biometric modalities in order to compute the scores for the evaluation, which
are summarized in Table 5.3. Low and high quality still frontal face images were col-
lected with two different cameras (denoted as fa1 and fnf1, respectively). The face
reference system used is an LDA-based face verifier (Martinez and Kak, 2001), and the
14 face quality measures indicated in Table 5.3 were computed using the Omnipercep-
tion SDK. The fingerprint data was collected with an optical and a thermal sensor,
denoted as fo{n} and ft{n} respectively, with n = {1=thumb, 2=index, 3=middle}fingers of the right hand. The reference system used is the NIST fingerprint system
(Watson et al., 2004), whereas the quality measure is based on averaging local gradients
(Chen et al., 2005). In Figure 5.1, the biometric sensors as well as acquisition samples
of the modalities used in the evaluation are shown.
The set of scores provided is a text file, with each line representing an access re-
quest. For the quality-based evaluation, each line had the structure shown in Table 5.4.
Mode xfa1 is the mismatched counterpart of fnf1, i.e. the template is captured using
143

5. QUALITY-BASED PROCESSING AND FUSION INMULTIBIOMETRICS
0
5
10
15
20
25
30
35
fnf1 fo1 fo2 fo3 xfa1 x 1 x 2 x 3
TRAINING
EVALUATION
EER (%)
Figure 5.2: Performance in terms or EER of the different modalities definedin Table 5.2 in the training and evaluation sets defined in Table 5.1.
the high resolution camera and the query image is captured using a webcam (low res-
olution). Similarly, xft1 (xft2, xft3 ) is the mismatched counterpart of fo1 (fo2, fo3 ),
i.e. the template is captured using the fingerprint optical sensor (flat positioning of the
finger) and the query image is captured using the thermal sensor (sweeping the finger).
Notation “|” means “either ... or”, so the two streams were mixed during the evaluation
and the fusion algorithm had to determine from which device the query was extracted.
The mixture could be one of the combinations shown at the bottom of Table 5.4 (for a
given access all fingerprints were acquired with the same device). The performance of
the different modalities on the training and evaluation sets are shown in Figure 5.2.
It should be noted that there were missing data in the sets of scores and quality
measures due to the fact that some matchings or quality estimates could not be com-
puted by the algorithms used in the Evaluation. It is not the target of this chapter to
study the effects of and how to deal with missing data in multi-biometrics. Therefore,
prior to the experiments, we have corrected the missing values of the training set as
follows. When a genuine (impostor) score of an specific sensor is missing, its value is
set to the mean value of the remaining valid genuine (impostor) scores over the training
set. Similarly, when a quality measure of an specific sensor is missing, its value is set
to the mean value of the remaining valid measures. For the evaluation set, since it
is not known in advance if we are dealing with a genuine or an impostor access, the
missing score or quality measure will not be taken into account in the fusion process,
as explained later.
144

5.2
Data
set
and
experim
enta
lpro
tocol
MIDDLE
INDEX
Matching
Flat
sensor
Sweep
sensor
fo1
xft1
Quality
Flat fingerprint
templates
Matching
Flat
sensor
Sweep
sensor
fo1
xft1
Quality
Flat fingerprint
templates
Matching
Flat
sensor
Sweep
sensor
fo1
xft1
Quality
Flat fingerprint
templates
Matching
Flat
sensor
Sweep
sensor
fo1
xft1
Quality
Flat fingerprint
templates
THUMB
FACE MODALITY
fnf1 calibration
xfa1 calibration
sface
Matching
High
Resolution
camera
Low
Resolution
camera
fnf1
xfa1
High resolution
templates
Quality
fo/xft fusion
and calibrationMatching
Flat
sensor
Sweep
sensor
fo1
xft1
Quality
Flat fingerprint
templates
sfinger
+ sfused
FINGERPRINT MODALITY
FACE
ID claim
Figure 5.3: Architecture of the proposed fusion strategy, including some quality-based conditional processingsteps (highlighted with dashed ellipses).
145

5. QUALITY-BASED PROCESSING AND FUSION INMULTIBIOMETRICS
5.3 Contribution: System architecture with quality-based
conditional processing
Following the nomenclature presented in Sections 1.2 and 1.3, the system proposed in
this chapter uses a density-based fusion method in which output scores of the indi-
vidual matchers are first mapped to log-likelihood-ratios by linear logistic regression
classification, prior to the fusion stage. This approach allows to combine scores from
different sources, such as multiple biometric modalities, multiple matchers or devices
from the same modality, etc. Quality information is incorporated in two stages: in the
score mapping stage, by estimating the device used in each access in order to switch
between different linear logistic regression classifier, and in the fusion stage by rejecting
scores from low quality biometric samples.
For our fusion experiments, we have used the tools for Linear Logistic Regression
(LLR) included in the toolkit FoCal (Brummer). The architecture of the proposed
fusion mechanism is shown in Figure 5.3. For each access, we compute one calibrated
face score sface and one calibrated fingerprint score sfinger which combines the three
fingerprint scores provided (one from each finger: thumb, index, and middle of the right
hand). Calibrated scores may be viewed as log-likelihood ratios. Therefore, assuming
independence between them (since sface and sfinger are computed from different bio-
metric traits), their sum will tend to be a log-likelihood ratio (Brummer and du Preez,
2006; Duda et al., 2004):
sfused = sface + sfinger (5.7)
Quality information is used in two stages of the system proposed in Figure 5.3:
i) classification stage, using different score normalization functions depending on the
device used for query acquisition, which is estimated from quality signals; and ii) fusion
stage, discarding scores which come from low quality sources. These two stages are
further detailed and evaluated in the following sections, in which they are compared to
a set of common fixed fusion rules: arithmetic mean, minimum and maximum (Kittler
et al., 1998). For these fusion experiments, matching scores are first normalized to be
similarity scores in the [0, 1] range using the tanh-estimators described by Jain et al.
(2005):
s′ =1
2
{tanh
(0.01
(s − µs
σs
))+ 1
}(5.8)
where s is the raw similarity score, s′ denotes the normalized similarity score, and µs
146

5.4 Results
and σs are respectively the estimated mean and standard deviation of the genuine score
distribution. Similarly to the architecture proposed in Figure 5.3, face and fingerprint
scores are normalized separately and subsequently fused.
In the experiments reported in this chapter, we follow the same benchmarking pro-
cedure of the BioSecure Multimodal Evaluation Campaign (see Section 5.2): training
of the fusion scheme (fnf1 and xfa1 calibration functions, and fo{n}/xft{n} fusion and
calibration functions in Figure 5.3, with n = {1, 2, 3}) is carried out only on the Session
2 training set of scores, whereas testing and performance comparison is then done on
the Session 2 evaluation set of scores. We cope with missing values of the evaluation
set as follows. When a fingerprint score of an access is missing, its value is set to the
mean value of the remaining valid scores prior to the fusion (the same applies to the
quality values). If an entire modality is missing, it is not used in the fusion. If both
modalities are missing, the fused score is set to the threshold value at the EER point
on the training set. This was the procedure followed in our submission to the quality-
based evaluation of Biosecure, where the rejection of an access was not allowed (Poh
and Bourlai, 2007). To be consistent with the evaluation, this procedure is also used
in the experiments reported in this chapter, unless indicated.
5.4 Results
5.4.1 Estimation of the input device from quality measures
According to the protocol of the quality-based evaluation (Poh and Bourlai, 2007),
no information was given regarding the device used for query acquisition during the
evaluation. In this scenario, we were interested in exploring the potential benefits of
conditional processing based on a prediction of the input device. For this purpose,
we used the quality measures provided together with the training scores, and assumed
that:
• if the template and the query were from the same device (i.e. fnf1, fo1, fo2, fo3 ),
both images would have similar quality values and they would be high,
• if the template and the query were from different devices (i.e. xfa1, xft1, xft2,
xft3 ), the quality value of the template would be higher than the quality value of
the query, and the quality value of the query would be low.
We estimated the device separately for face and fingerprint modalities. For that
purpose, we used a quadratic discriminant function with multivariate normal densities
147
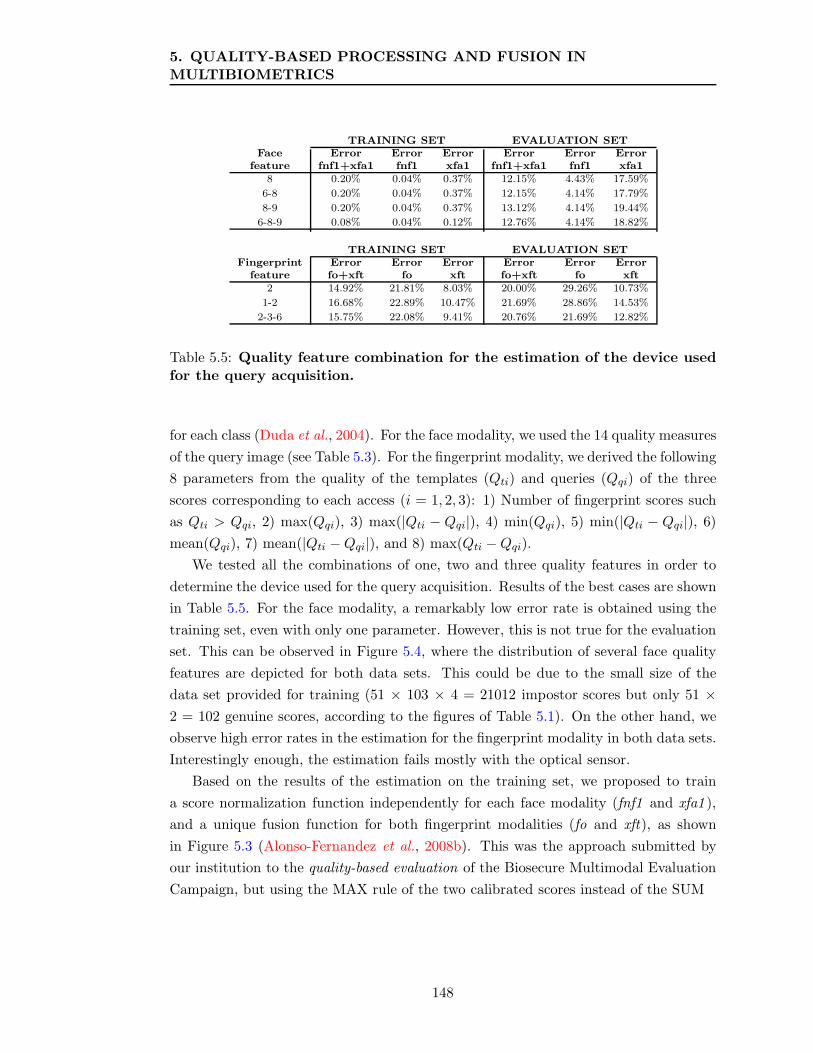
5. QUALITY-BASED PROCESSING AND FUSION INMULTIBIOMETRICS
TRAINING SET EVALUATION SETFace Error Error Error Error Error Error
feature fnf1+xfa1 fnf1 xfa1 fnf1+xfa1 fnf1 xfa18 0.20% 0.04% 0.37% 12.15% 4.43% 17.59%
6-8 0.20% 0.04% 0.37% 12.15% 4.14% 17.79%
8-9 0.20% 0.04% 0.37% 13.12% 4.14% 19.44%
6-8-9 0.08% 0.04% 0.12% 12.76% 4.14% 18.82%
TRAINING SET EVALUATION SETFingerprint Error Error Error Error Error Error
feature fo+xft fo xft fo+xft fo xft2 14.92% 21.81% 8.03% 20.00% 29.26% 10.73%
1-2 16.68% 22.89% 10.47% 21.69% 28.86% 14.53%
2-3-6 15.75% 22.08% 9.41% 20.76% 21.69% 12.82%
Table 5.5: Quality feature combination for the estimation of the device usedfor the query acquisition.
for each class (Duda et al., 2004). For the face modality, we used the 14 quality measures
of the query image (see Table 5.3). For the fingerprint modality, we derived the following
8 parameters from the quality of the templates (Qti) and queries (Qqi) of the three
scores corresponding to each access (i = 1, 2, 3): 1) Number of fingerprint scores such
as Qti > Qqi, 2) max(Qqi), 3) max(|Qti − Qqi|), 4) min(Qqi), 5) min(|Qti − Qqi|), 6)
mean(Qqi), 7) mean(|Qti − Qqi|), and 8) max(Qti − Qqi).
We tested all the combinations of one, two and three quality features in order to
determine the device used for the query acquisition. Results of the best cases are shown
in Table 5.5. For the face modality, a remarkably low error rate is obtained using the
training set, even with only one parameter. However, this is not true for the evaluation
set. This can be observed in Figure 5.4, where the distribution of several face quality
features are depicted for both data sets. This could be due to the small size of the
data set provided for training (51 × 103 × 4 = 21012 impostor scores but only 51 ×2 = 102 genuine scores, according to the figures of Table 5.1). On the other hand, we
observe high error rates in the estimation for the fingerprint modality in both data sets.
Interestingly enough, the estimation fails mostly with the optical sensor.
Based on the results of the estimation on the training set, we proposed to train
a score normalization function independently for each face modality (fnf1 and xfa1 ),
and a unique fusion function for both fingerprint modalities (fo and xft), as shown
in Figure 5.3 (Alonso-Fernandez et al., 2008b). This was the approach submitted by
our institution to the quality-based evaluation of the Biosecure Multimodal Evaluation
Campaign, but using the MAX rule of the two calibrated scores instead of the SUM
148

5.4
Resu
lts
(a) Training set
(b) Evaluation set
Figure 5.4: Face quality features for query device estimation.
149

5. QUALITY-BASED PROCESSING AND FUSION INMULTIBIOMETRICS
0.1 0.2 0.5 1 2 5 10 20 40
0.1
0.2
0.5
1
2
5
10
20
40
False Acceptance Rate (in %)
Fa
lse
Re
ject
ion
Ra
te (
in %
)TRAINING SET − with device estimation
Loglik. SUM fusion − EER=4.16%
Loglik. MAX fusion − EER=3.43%
Arithm. MEAN fusion − EER=5.15%
MAX fusion − EER=9.76%
MIN fusion − EER=9.55%
0.1 0.2 0.5 1 2 5 10 20 40
0.1
0.2
0.5
1
2
5
10
20
40
False Acceptance Rate (in %)F
als
e R
eje
ctio
n R
ate
(in
%)
EVALUATION SET − with device estimation
Loglik. SUM fusion − EER=7.02%
Loglik. MAX fusion − EER=7.72%
Arithm. MEAN fusion − EER=7.57%
MAX fusion − EER=11.73%
MIN fusion − EER=14.45%
(a) With device estimation using quality measures.
0.1 0.2 0.5 1 2 5 10 20 40
0.1
0.2
0.5
1
2
5
10
20
40
False Acceptance Rate (in %)
Fa
lse
Re
ject
ion
Ra
te (
in %
)
TRAINING SET − no device estimation
Loglik. SUM fusion − EER=3.19%
Arithm. MEAN fusion − EER=5.83%
MAX fusion − EER=11.38%
MIN fusion − EER=8.85%
0.1 0.2 0.5 1 2 5 10 20 40
0.1
0.2
0.5
1
2
5
10
20
40
False Acceptance Rate (in %)
Fa
lse
Re
ject
ion
Ra
te (
in %
)
EVALUATION SET − no device estimation
Loglik. SUM fusion − EER=5.49%
Arithm. MEAN fusion − EER=9.63%
MAX fusion − EER=13.46%
MIN fusion − EER=13.98%
(b) Without device estimation (knowing the actual device used in each access).
Figure 5.5: Verification results of the proposed log-likelihood fusion (Loglik.)together with simple fusion rules used for comparison (Loglik. SUM isfurther studied in the present chapter, Loglik. MAX was the approachsubmitted by the authors to the quality-based Biosecure evaluation).
150

5.4 Results
rule used in this chapter. The submitted approach was ranked 2nd in terms of Half Total
Error Rate (HTER) out of 13 participants (BMEC, 2007). Results of both approaches
are shown in Figure 5.5a, together with the simple fusion rules used for comparison.
As it can be observed in Table 5.5, the device estimation did not perform well on the
evaluation set, so with the aim of evaluating the effects of such a bad device estimation,
we also depict in Figure 5.5b results considering the actual device used in each access,
training in this case a modality-specific score normalization function based on linear
logistic regression. Although that was not the protocol in the Biosecure evaluation, it
is reasonable to assume that the specific sensor used in an operational environment is
known.
As can be observed in Figure 5.5a, although the proposed approach based on log-
likelihood fusion results in worse EER value, it outperforms our submission to the
evaluation (which was also based on log-likelihood but using MAX instead of SUM
fusion) in most regions of the DET curve. We also observe that the performance of the
proposed fusion scheme is better than the performance of all simple fusion rules. Only
the arithmetic mean rule result in similar performance on the evaluation set for low
FRR values, being this difference higher when knowing the actual device used in each
access (Figure 5.5b).
Comparing Figure 5.5b to Figure 5.5a, we can also observe the decrease in perfor-
mance when using device estimation in comparison to knowing the actual device used
in each access.
5.4.2 Sensor interoperability
We now evaluate the capability of the proposed log-likelihood fusion algorithm to cope
with query biometric signals originated from heterogeneous biometric devices by re-
porting the performance on the different mixtures of Table 5.4. We report in Table 5.6
the performance of the four possible combinations for an access using the proposed log-
likelihood sum fusion rule sfused and the best simple fusion rule (the arithmetic mean).
DET curves are also plotted in Figure 5.6. It can be observed that for the mixtures
involving only the optical sensor (mixtures 1 and 3), there are not big differences in
performance between the two fusion schemes. On the other hand, for the mixtures in-
volving mismatched fingerprint devices (mixtures 2 and 4), the proposed fusion scheme
outperforms the simple fusion rule. This is specially evident for the mixture 2, which
does not involve mismatched face devices (only the high resolution camera). We can
also see that the proposed scheme performs best in overall terms, i.e. when pooling all
the mixtures.
151

5. QUALITY-BASED PROCESSING AND FUSION INMULTIBIOMETRICS
With device estimation With correct device modelM. Modalities loglik SUM Arithm. mean loglik SUM Arithm. mean1 fnf1/fo1/fo2/fo3 2.88% (-50.30%) 1.64% (-71.70%) 1.55% (-73.25%) 1.61% (-72.22%)
2 fnf1/xft1/xft2/xft3 6.69% (-16.49%) 11.18% (+39.56%) 6.97% (-12.99%) 12.38% (+54.54%)
3 xfa1/fo1/fo2/fo3 2.55% (-56.00%) 2.26% (-61.00%) 1.91% (-67.04%) 1.62% (-72.05%)
4 xfa1/xft1/xft2/xft3 9.24% (-29.81%) 11.35% (-13.79%) 9.26% (-29.66%) 12.05% (-8.47%)ALL 7.02% 7.57% 5.49% 9.63%
Table 5.6: Verification results of the fusion in terms of EER (%) for the fourdifferent mixtures defined in Table 5.4 on the evaluation set. The relativeEER increase with respect to the best modality involved (see Figure 5.2) isalso given in brackets.
It is also worth noting that the best mixtures (mixtures 1 and 3) are the ones
that do not use mismatched fingerprint devices and they also result in the highest
relative improvement with respect to the best individual modality involved, as observed
in Table 5.6. The mixture involving both mismatched fingerprint and face devices
(mixture 4) performs always the worst. However, it should be noted that about a 30%
of improvement is obtained in terms of EER for this mixture when fusing, as compared
to the best single modality.
152

5.4 Results
0.1 0.2 0.5 1 2 5 10 20 40
0.1
0.2
0.5
1
2
5
10
20
40
False Acceptance Rate (in %)
Fa
lse
Re
ject
ion
Ra
te (
in %
)
EVALUATION SET − with device estimation
Loglik SUM − mixture 1
Arithm. SUM − mixture 1
Loglik SUM − mixture 2
Arithm. SUM − mixture 2
Loglik SUM − ALL
Arithm SUM − ALL
0.1 0.2 0.5 1 2 5 10 20 40
0.1
0.2
0.5
1
2
5
10
20
40
False Acceptance Rate (in %)
Fa
lse
Re
ject
ion
Ra
te (
in %
)
EVALUATION SET − with device estimation
Loglik SUM − ALL
Arithm SUM − ALL
Loglik SUM − mixture 4
Arithm. SUM − mixture 4
Loglik SUM − mixture 3
Arithm. SUM − mixture 3
(a) With device estimation using quality measures.
0.1 0.2 0.5 1 2 5 10 20 40
0.1
0.2
0.5
1
2
5
10
20
40
False Acceptance Rate (in %)
Fa
lse
Re
ject
ion
Ra
te (
in %
)
EVALUATION SET − no device estimation
Loglik SUM − ALLArithm SUM − ALL
Loglik SUM − mixture 1
Arithm. SUM − mixture 1
Loglik SUM − mixture 2
Arithm. SUM − mixture 2
0.1 0.2 0.5 1 2 5 10 20 40
0.1
0.2
0.5
1
2
5
10
20
40
False Acceptance Rate (in %)
Fa
lse
Re
ject
ion
Ra
te (
in %
)
EVALUATION SET − no device estimation
Loglik SUM − ALL
Arithm SUM − ALL
Loglik SUM − mixture 3
Arithm. SUM − mixture 3
Loglik SUM − mixture 4
Arithm. SUM − mixture 4
(b) Without device estimation (knowing the actual device used in each access).
Figure 5.6: Verification results of the fusion for the different mixtures definedin Table 5.4.
153

5. QUALITY-BASED PROCESSING AND FUSION INMULTIBIOMETRICS
0.2 0.25 0.3 0.35 0.4 0.45 0.50.5
1
1.5
2
2.5
3
3.5
4
Quality value
EE
R (
%)
Fingerprint fo
optimum
threshold
training setevaluation set
0.15 0.2 0.25 0.3 0.35 0.4 0.4514
15
16
17
18
19
20
21
22
Quality value
EE
R (
%)
Fingerprint xft
optimum
threshold
(a) Fingerprint. Left: template and query with flat acquisition. Right: template and query withflat and sweep acquisition, respectively.
Figure 5.7: Verification performance in terms of EER for the fingerprintmodality as scores with the lowest quality value are discarded.
5.4.3 Quality-dependent multimodal fusion
There is now international consensus in industry (Benini and et al, 2006), academia
(Chen et al., 2005) and government (Tabassi et al., 2004) that a measure of a biometric
sample’s quality should be related to its recognition performance. Broadly, a sample
should be of good quality if it is suitable for automated matching. Based on this con-
cept, sample quality can be formalized as a scalar quantity that is related monotonically
to the performance of biometric matchers (Grother and Tabassi, 2007). Based on this,
an operational approach to incorporate quality information in biometric systems is to
reject low quality samples, as done in several studies (Alonso-Fernandez et al., 2007c,
2008). This policy implies to increase the inconvenience to users whose samples are
rejected by the system who are requested to be recaptured, or even to make a biomet-
ric system unsuitable to certain individuals whose data is not consistently of enough
quality. To cope with this, multibiometric systems use multiple sources of information
(Ross et al., 2006), thus alleviating the problem of asking an individual to be recaptured
when particular samples are of low quality (Fierrez-Aguilar et al., 2005e). Similarly,
users having a trait not suitable to be used (e.g. damaged fingers) still can use the
other available information for recognition.
In this work, we have tested this quality-based modality rejection by not considering
in the fusion the scores having a quality value lower than a predefined threshold. The
quality value of a matching score is defined as min(Qe , Qt), where Qe and Qt are the
qualities of the enrolled and input biometric samples respectively corresponding to the
154

5.4
Resu
lts
55 60 65 70 75 80 85 90 950
1
2
3
4
5
6
7
8
9
Quality value
EE
R (
%)
fnf1 − feature 6
optimum
threshold
0 10 20 30 40 50Quality value
fnf1 − feature 2
optimum
threshold
0 10 20 30 40 50 60Quality value
fnf1 − feature 4
optimum
threshold
training setevaluation set
(a) Face: template and query with high resolution camera.
0 10 20 30 40 50 60 70 80Quality value
xfa1 − feature 6
optimum
threshold
0 10 20 30 40 50 60 70 80Quality value
xfa1 − feature 7
optimum
threshold
0 10 20 30 40 50 60 70 80 905
7
9
11
13
Quality value
EE
R (
%)
xfa1 − feature 1
optimum
threshold
(b) Face: template and query with high and low resolution cameras, respectively.
Figure 5.8: Verification performance in terms of EER for the face modality as scores with the lowest qualityvalue are discarded. Results are shown using the quality features that result in the highest improvement ofthe EER.
155

5.
QU
ALIT
Y-B
ASED
PR
OC
ESSIN
GA
ND
FU
SIO
NIN
MU
LT
IBIO
MET
RIC
S
EVALUATION SET
Modalitydiscarded feature thres. mixture 1 mixture 2 mixture 3 mixture 4 ALL
6 75 1.59% 5.73% - - 5.41%Face (+2.58%) (-17.79%) (-1.45%)
fnf1 2 20 1.56% 6.11% - - 5.37%(+0.65%) (-12.34%) (-2.19%)
4 30 1.57% 6.39% - - 5.44%(+1.29%) (-8.32%) (-0.91%)
1 80 - - 1.33% 8.29% 5.12%Face (-30.37%) (-10.48%) (-6.74%)
xfa1 7 75 - - 1.37% 9.90% 5.52%(-28.27%) (+6.91%) (+0.55%)
6 65 - - 1.49% 9.24% 5.26%(-21.99%) (-0.22%) (-4.19%)
Fing. fo - 0.35 1.51% - 1.40% - 5.57%(-2.58%) (-26.70%) (+1.46%)
Fing. xft - 0.35 - 6.77% - 11.15% 5.91%(-2.87%) (+20.41%) (+7.65%)
Table 5.7: Effects on the performance of the proposed log-likelihood sum fusion on the different mixturesdefined in Table 5.4 in terms of EER as scores with quality value lower than the predefined thresholds arenot considered in the fusion. Results are shown by either discarding face or fingerprint scores, together withthe resulting relative EER increase in brackets (reference results without quality-based score rejection areshown in Table 5.6, fifth column). Threshold values are selected on the basis of Figures 5.7 and 5.8.
156

5.4 Results
matching, so the worse of the two biometric samples drives the score (Grother and
Tabassi, 2007). For a given access (consisting of a face sample and 3 fingerprints, see
Figure 5.3), fingerprint scores whose quality is lower than the threshold are replaced
with the fingerprint score having the maximum quality value. If the three fingerprint
scores of an access have their quality lower than the threshold, then the fingerprint
modality is entirely discarded. In order to set the “optimum” quality threshold, we
used the verification performance of the fingerprint and face modalities as scores with
the lowest quality value are discarded, as shown in Figures 5.7 and 5.8, respectively.
Thresholds are set for each modality by choosing the value that minimizes the EER on
the training set (indicated in Figures 5.7 and 5.8 as vertical lines). Except for the xft
fingerprint modality (template and query with flat and sweep acquisition, respectively),
an EER reduction is also observed on the evaluation set for the selected thresholds.
Once the optimum thresholds are selected, we evaluate the effects on the perfor-
mance of the proposed log-likelihood sum fusion on the mixtures defined in Table 5.1
by separately discarding face or fingerprint scores. The results are shown in Table 5.7.
It is observed in all cases an EER decrease (or at least, no significant EER increase)
except when discarding scores of the xft modality. This is consistent with the results
reported on Figure 5.7, where no reduction on the EER was observed on the evalua-
tion set for the selected quality threshold. Based on these results, no threshold will be
subsequently applied to the xft modality.
Finally, we jointly apply the score quality-based rejection in all the modalities using
the optimum thresholds selected. To be consistent with the constraints of the BioSecure
Multimodal Evaluation Campaign (Poh and Bourlai, 2007), where no access can be
rejected, if all the quality measures of an access are lower than the thresholds, then
the resulting fused score is set to 0. In the proposed log-likelihood fusion strategy,
this means that there is the same likelihood if signals are assumed to be originated or
not by the given subject. However, we also report results discarding these accesses of
the computation of the error rates to show the benefits of this policy. In Figure 5.9,
we show the number of accesses per modality that do not comply with the quality
requirements, showing that the fusion allows to recover a significant number of them.
Verification results of the fusion with the proposed quality-based rejection scheme are
shown in Table 5.8 and Figures 5.10 and 5.11.
157
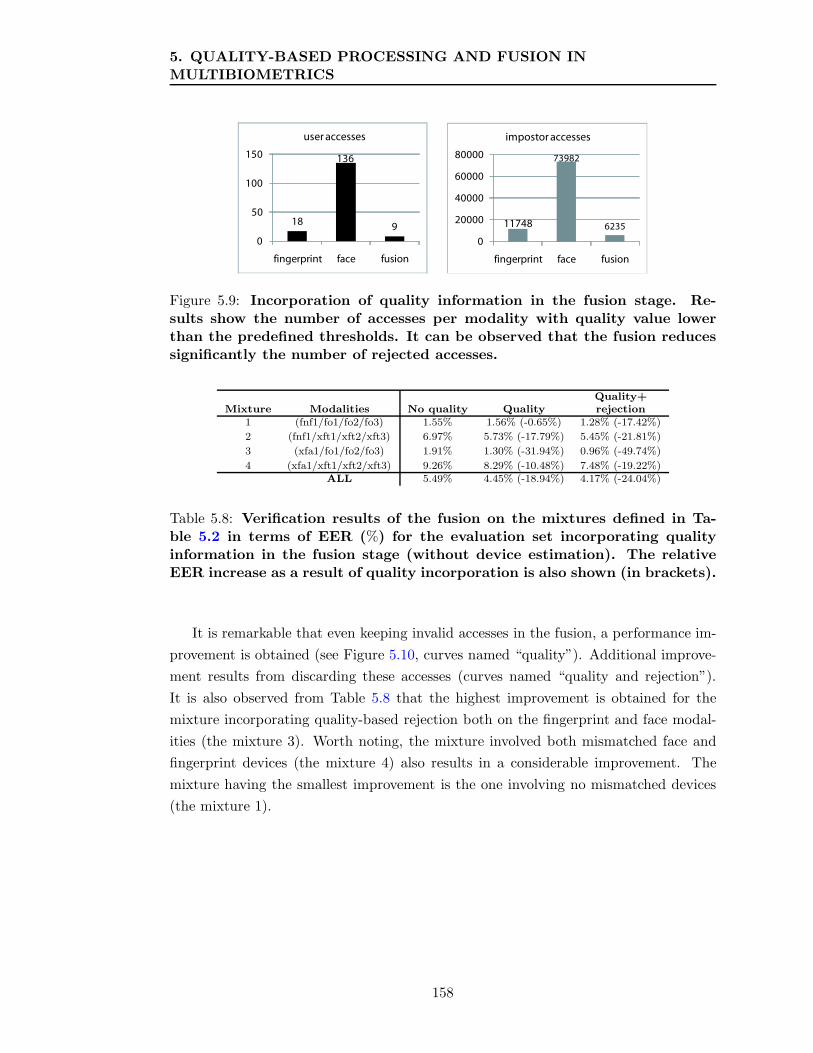
5. QUALITY-BASED PROCESSING AND FUSION INMULTIBIOMETRICS
18
136
9
0
50
100
150
fingerprint face fusion
user accesses
11748
73982
6235
0
20000
40000
60000
80000
fingerprint face fusion
impostor accesses
Figure 5.9: Incorporation of quality information in the fusion stage. Re-sults show the number of accesses per modality with quality value lowerthan the predefined thresholds. It can be observed that the fusion reducessignificantly the number of rejected accesses.
Quality+Mixture Modalities No quality Quality rejection
1 (fnf1/fo1/fo2/fo3) 1.55% 1.56% (-0.65%) 1.28% (-17.42%)
2 (fnf1/xft1/xft2/xft3) 6.97% 5.73% (-17.79%) 5.45% (-21.81%)
3 (xfa1/fo1/fo2/fo3) 1.91% 1.30% (-31.94%) 0.96% (-49.74%)
4 (xfa1/xft1/xft2/xft3) 9.26% 8.29% (-10.48%) 7.48% (-19.22%)ALL 5.49% 4.45% (-18.94%) 4.17% (-24.04%)
Table 5.8: Verification results of the fusion on the mixtures defined in Ta-ble 5.2 in terms of EER (%) for the evaluation set incorporating qualityinformation in the fusion stage (without device estimation). The relativeEER increase as a result of quality incorporation is also shown (in brackets).
It is remarkable that even keeping invalid accesses in the fusion, a performance im-
provement is obtained (see Figure 5.10, curves named “quality”). Additional improve-
ment results from discarding these accesses (curves named “quality and rejection”).
It is also observed from Table 5.8 that the highest improvement is obtained for the
mixture incorporating quality-based rejection both on the fingerprint and face modal-
ities (the mixture 3). Worth noting, the mixture involved both mismatched face and
fingerprint devices (the mixture 4) also results in a considerable improvement. The
mixture having the smallest improvement is the one involving no mismatched devices
(the mixture 1).
158

5.4 Results
0.1 0.2 0.5 1 2 5 10 20 40
0.1
0.2
0.5
1
2
5
10
20
40
False Acceptance Rate (in %)
Fa
lse
Re
ject
ion
Ra
te (
in %
)
EVALUATION SET − no device estimation
no quality
quality
quality and rejection
Figure 5.10: Verification results of the proposed fusion incorporating qualityinformation in the fusion stage (without device estimation).
0.1 0.2 0.5 1 2 5 10 20 40
0.1
0.2
0.5
1
2
5
10
20
40
False Acceptance Rate (in %)
Fa
lse
Re
ject
ion
Ra
te (
in %
)
EVALUATION SET − no device estimation
quality
quality and rejectionMIXTURE 1
MIXTURE 2no quality
quality
quality and rejection
0.1 0.2 0.5 1 2 5 10 20 40
0.1
0.2
0.5
1
2
5
10
20
40
False Acceptance Rate (in %)
Fa
lse
Re
ject
ion
Ra
te (
in %
)
EVALUATION SET − no device estimation
MIXTURE 3
MIXTURE 4
no quality
quality
quality and rejection
quality
quality and rejection
no quality
Figure 5.11: Verification results of the proposed fusion for the different mix-tures defined in Table 5.2 incorporating quality information in the fusionstage (without device estimation).
159
5. QUALITY-BASED PROCESSING AND FUSION INMULTIBIOMETRICS
5.5 Chapter summary and conclusions
As biometric technology is increasingly deployed, it will be a common situation to
replace parts of operational systems with newer designs and/or to operate with infor-
mation from different sources (Poh et al., 2007). The recent quality-based evaluation
of the BioSecure Multimodal Evaluation Campaign (BMEC, 2007; Poh and Bourlai,
2007) was aimed to compare the performance of different multi-modal biometric fusion
architectures and algorithms when biometric signals are originated from heterogeneous
face and fingerprint biometric devices in mismatched conditions. This evaluation op-
erated at the matching score level, providing participants with different sets of scores
which were obtained using several reference systems. Together with the scores, quality
information of the associated biometric signals was also provided.
In this chapter we have described a fusion strategy submitted to this quality-based
evaluation, developed in the framework of this Thesis (Alonso-Fernandez et al., 2008b),
which obtained very good results (2nd position in terms of Half Total Error Rate out
of 13 participants (BMEC, 2007)). In our approach, output scores of the individual
matchers are first mapped to log-likelihood-ratios by linear logistic regression, prior to
the fusion stage. The proposed strategy allows to efficiently combine scores originated
from different biometric sources (modalities, matchers, devices, etc.) since they are
in a comparable domain, and it is generalizable to newer developments or additional
modalities.
Quality-based conditional processing is carried out in two stages of the proposed
strategy: by estimating the device used in each access in order to switch between
different linear logistic regression modules, and by rejecting scores from low quality
biometric samples. Worth noting, a considerable performance improvement has been
obtained when applying the quality-based score rejection.
The proposed fusion approach is also able to cope easily with missing values of any
modality. In the Biosecure quality-based evaluation, the robustness of the submitted
algorithms against missing values was also evaluated, although it has not been studied
in this chapter. The proposed fusion scheme also obtained remarkable results (BMEC,
2007), being the first in terms of HTER when the proportion of missing data was
increased (i.e. higher than 20%).
This chapter presents novel contributions in the definition of a quality-based multi-
biometric architecture, the use of quality information to estimate the input device used
in the acquisition of biometric data, and the use of a score-rejection scheme that only
considers sources of enough quality in the fusion.
160

Chapter 6
Conclusions and Future Work
This PhD Thesis has studied the biometric sample quality assessment problem. Af-
ter a summary of previous work related to this problem, it is explored in two particular
traits: fingerprints and signature images. In anatomical traits like fingerprint, we can
objectively define what quality is. But it is harder to do so in behavioral traits like
signature, where proposed features for quality assessment are related to how a signer
decides to sign. Several quality assessment methods are studied and compared for the
two mentioned traits. Also, the incorporation of quality information in multibiometric
systems is explored, showing its benefits.
6.1 Conclusions
Chapter 1 introduced the topic of biometric systems, biometric modalities, the motiva-
tion of the Thesis, and the contributions originated from this PhD Thesis. Chapter 2
summarized related works and detailed the motivations for this Thesis based on these
previous works.
Chapter 3 studied the problem of quality assessment of fingerprint images. This
chapter provided a taxonomy of existing approaches for fingerprint image quality as-
sessment. It also compared a set of representative fingerprint quality measures by
studying both their correlation and their utility. The impact of image quality in the
performance of a minutiae- and a ridge-based matcher was evaluated with a multi-
session database acquired with three sensors of different technology. High correlation
was observed between quality measures in most cases, with some differences depend-
ing on the sensor used. Regarding the utility, for the approach based on minutiae the
highest performance improvement for good quality was obtained in the False Rejection
161

6. CONCLUSIONS AND FUTURE WORK
Rate, whereas for the ridge-based approach the highest improvement was observed in
the False Acceptance Rate.
Chapter 4 studied the problem of quality assessment of signature images. Several
measures to predict the performance of signature systems were proposed as contribu-
tion. They were aimed to predict features like signature legibility, complexity, stability,
duration, etc. Also, one verification system based on local contour of signatures was
presented. Among the most remarkable findings of this chapter, we have found that for
skilled forgeries, the best performance is obtained with legible signatures. Also, perfor-
mance is worsened with highly variable signatures, specially with few enrolment data,
or with low variance of the pen pressure. For the other measures, different behavior
was observed between the three matchers used.
Chapter 5 finally conducted a study of system adaptation to the quality of biometric
systems. We have contributed with a new quality-based conditional-processing multi-
biometric architecture that is generalizable to biometric systems working with multi-
ple sources of information. In the proposed approach, output scores of the individual
sources are first mapped to log-likelihood-ratios, allowing an efficient combination since
they are in a comparable domain. Quality is then used to switch between different sys-
tem modules depending on the data source, and to consider only data of enough quality.
The effectiveness to cope with signals originated from heterogeneous biometric sources
was also demonstrated by the proposed approach in an standard benchmark test.
To summarize, the main results and contributions obtained from this Thesis are:
• The novel strategies for signature quality assessment and performance prediction.
• The novel quality-based conditional-processing multibiometric architecture aimed
at combining biometric signals originated from heterogeneous sources.
• The individual system developed for off-line signature verification using local
contour information of the signature.
• The multimodal biometric data acquired, which will be released for research pur-
poses in the near future.
• The experimental evaluation of fingerprint and signature quality measures using
different biometric sensors and matchers.
162

6.2 Future work
6.2 Future work
Several research directions arise from the work proposed in this Ph.D. Thesis. We
enumerate here some of them that we consider remarkable:
Application of the proposed evaluation framework to other biometric traits.
The evaluation framework used in this Ph.D. Thesis (Grother and Tabassi, 2007)
is applicable to any biometric trait and it is a clear future area of research. Apart
from the two traits considered in this Ph.D. Thesis (fingerprint and signature),
biometric algorithms have been also proposed for iris (Chen et al., 2006a; Kalka
et al., 2005), voice (Garcia-Romero et al., 2006) and face (Kryszczuk and Dryga-
jlo, 2007). However, prior work on quality evaluation and sample quality analysis
is limited. Biometric quality assessment is a current research challenge and it
is not been until recent years when it has received specific attention from the
research community (Benini and et al, 2006; BQW, 2007; Youmaran and Adler,
2006).
Combination of different approaches for quality estimation. Experiments have
shown that there are quality measures better suited to specific situations (sensor
technology, matching algorithm, etc.). Remarkable differences between quality
measures are found in terms of behavior. Therefore, adaptive quality fusion
methods that exploit these differences could improve the process of assessing the
quality of biometric signals and therefore, the overall performance of the system,
e.g. Fierrez-Aguilar et al. (2006); Fronthaler et al. (2008). This research line will
be explored in the future.
Proposal of new quality measures. Many quality assessment algorithms have been
developed, mainly for fingerprint images (Alonso-Fernandez et al., 2007c). Other
measures have also been recently proposed for iris, voice, face and signature.
However, there is much research that still can be done in this field with the pro-
posal of new quality measures to other biometric traits. Efforts are currently
going towards an harmonized and universal interpretation of quality measures by
defining the key factors that need to be assessed in each biometric trait.
Incorporation of quality measures in biometric systems. Some of the steps of
the recognition system can be adjusted based on the estimated quality in order
to improve the overall performance. There are recent works following this di-
rection (Baker and Maurer, 2005; Chan et al., 2006; Fierrez-Aguilar et al., 2006;
163
6. CONCLUSIONS AND FUTURE WORK
Nandakumar et al., 2006), in which quality measures are used to dynamically as-
signing weights to the outputs of individual matchers based on the quality of the
samples. Other approaches (Chen et al., 2005; Hong et al., 1998; Shi et al., 2004)
exploit the signal quality in different steps of the recognition system in order to
improve the feature extraction process.
Study of quality in new biometric scenarios. Chapter 5 of this Thesis has ad-
dressed the problem of biometric device replacement and the matching of bio-
metric samples originated from different devices. These are common operational
situations that will appear as biometric technology is deployed (Poh et al., 2007).
Other problems that could be a source of future work in this area are: impact
of environmental variations in new applications requiring personal identification
(over the Internet, with mobile platforms in indoor/outdoor environments, etc.),
evaluation of new multibiometric scenarios (e.g. ePassport using face, fingerprint
and iris), etc.
Use of “biometric information” to assess sample quality. Youmaran and Adler
(2006) have developed an approach that measures the information content of bio-
metric data from an information theoretic point of view. Intuitively, degradations
to a biometric sample will reduce the amount of identifiable information available.
They develop a mathematical framework to measure biometric information for a
given system and set of biometric features using the concept of entropy (Duda
et al., 2004). Quantifying the biometric information in different systems individ-
ually also would allow to evaluate the potential gain from fusing them. There are
other efforts related to this issue specifically focused on certain biometric traits,
as Daugman (2003); Kholmatov and Yanikoglu (2008).
Effects of time variability in the quality of acquired signals and the implementation
of template selection and update techniques. As biometric data is subject
to natural variations across time, multiple templates that best represent this
variability should be stored in the database. Also, stored templates should be
updated with new acquisitions by replacing them with better quality samples
captured subsequently. There are initial techniques following this direction (Ko
and Krishnan, 2004; Uludag et al., 2004).
164
Chapter 7
Resumen Extendido de la Tesis
Calidad de muestras biometricas y su
aplicacion en sistemas de autenticacion
multimodal
Se denomina reconocimiento biometrico al proceso que permite determinar la identi-
dad de un individuo de forma automatica mediante el uso de caracterısticas personales
de tipo conductual y/o anatomico, como las huellas, la cara, el iris, la voz, la firma,
etc. (Jain et al., 2006). El analisis cientıfico de evidencias biometricas lleva usandose
en el ambito forense (judicial, policial y pericial) desde hace mas de un siglo. Pero en
los ultimos anos, con el desarrollo de la sociedad de la informacion y con un mundo
cada vez mas interconectado y globalizado, la demanda de aplicaciones que permitan
la identificacion de individuos de modo automatico ha crecido enormemente. Es en
este contexto donde el reconocimiento biometrico ha experimentado una investigacion
y desarrollo considerable.
Aunque el reconocimiento automatico de personas se lleva estudiando mas de treinta
anos (Atal, 1976; Kanade, 1973), hasta la ultima decada no se ha establecido como un
campo de investigacion especıfico, con multiples libros de referencia (Bolle et al., 2004;
Jain et al., 1999, 2008; Li and Jain, 2004; Maltoni et al., 2003; Nanavati et al., 2002;
Ratha and Bolle, 2004; Ross et al., 2006; Wayman et al., 2005; Zhang, 2002), con-
ferencias especıficas en el tema (AVBPA, 2005; BTAS, 2007; ICB, 2007; ICBA, 2004;
165
7. RESUMEN EXTENDIDO DE LA TESIS
SPIE-BTHI, 2008), proyectos internacionales (BioSec, 2004; BioSecure, 2004; COST-
2101, 2006; COST-275, 2003), esfuerzos de estandarizacion (BioAPI, 1998; CBEFF,
2001; INCITS M1, 2007; ISO/IEC JTC1 SC37, 2002) y el desarrollo de evaluaciones
y pruebas comparativas (BMEC, 2007; FpVTE, 2003; FRVT, 2006; FVC2006, 2006;
ICE, 2006; Mansfield and Wayman, 2002; NIST SRE, 2006; SVC, 2004; Wayman et al.,
2005). Tambien ha habido un creciente interes institucional de gobiernos (DoD, 2007),
industria (IBG, 2007), organismos de investigacion (NIST-ITL, 2007) ası como el es-
tablecimiento de consorcios internacionales especıficamente dedicados a la biometrıa
(BC, 2005; EBF, 2003).
Pero pese a la madurez de este campo de investigacion, el reconocimiento biometrico
sigue siendo un area muy activa de investigacion, con numerosos problemas practicos
aun por solucionar (Jain et al., 2004a). Estos problemas practicos han hecho que, pese
al interes de las aplicaciones biometricas, la introduccion en el mercado de estas nuevas
tecnologıas sea mas lenta de lo esperado.
Esta tesis se centra en el analisis de calidad de muestras biometricas, ası como su
aplicacion en sistemas multimodales. En particular, se explora el problema en dos
rasgos: huella y firma “offline”. Al contrario que una imagen de huella, donde se
puede definir su calidad de manera mas o menos objetiva, en el caso de rasgos de
comportamiento como la firma no es sencillo hallar una definicion de calidad.
7.1 Introduccion
El paradigma de la autenticacion biometrica. El reconocimiento de personas
se ha realizado historicamente asociando identidad y “algo que la persona posee” (por
ejemplo, una llave o una tarjeta, que puede ser robado, perdido o duplicado), o bien
“algo que la persona sabe” (por ejemplo, una palabra-clave o un PIN, que puede ser
olvidado o revelado). El reconocimiento biometrico anade a este paradigma una nueva
dimension, asociando persona e identidad personal mediante “algo que la persona es (o
produce)”. “Algo que la persona es” nos indica una caracterıstica fisiologica asociada de
forma inherente a la persona, mientras que “algo que la persona produce” nos indica una
aptitud o acto previamente entrenado que la persona realiza como patron de conducta.
Sistemas biometricos. El reconocimiento biometrico es un termino generico para
denominar a los dos modos de funcionamiento de los sistemas biometricos. De forma
mas precisa, se denomina identificacion biometrica a la tarea que pretende asociar una
muestra biometrica a uno de los N patrones o modelos disponibles del conjunto cono-
166

7.1 Introduccion
cido de individuos registrados. Por este motivo, a esta tarea tambien se la conoce como
comparacion uno-contra-muchos o uno-contra-N . La salida de los sistemas que funcio-
nan bajo este modo suele ser una lista ordenada de candidatos, estando ligado el criterio
de ordenacion al grado de similitud entre muestra de prueba y patron registrado. Por el
contrario, la verificacion (o autenticacion) biometrica es la tarea que pretende decidir
si una determinada muestra de entrada coincide o no con un usuario especıfico (denom-
inado usuario “solicitado”, o “pretendido”). Esta tarea es conocida como problema
uno-contra-uno, y la salida sera una decision binaria (aceptado/rechazado) basada en
la comparacion del grado de similitud (en forma de puntuacion o score entre la muestra
de entrada y el modelo de usuario pretendido) respecto a un determinado umbral de
decision. En esta Tesis nos centramos en el modo de verificacion, cuyas dos etapas,
registro (enrollment) y verificacion (verification), se muestran esquematicamente en la
Figura 1.1.
El objetivo en la verificacion biometrica es decidir entre dos clases, cliente o im-
postor. Dependiendo del rasgo biometrico que se trate, los impostores pueden conocer
y utilizar informacion del rasgo imitado para facilitar el acceso, por ejemplo, la forma
de la firma en el caso de verificacion de firma escrita. Por ello se suelen considerar
dos tipos de impostores: 1) impostores casuales (que producen falsificaciones aleato-
rias), cuando no se conoce informacion del rasgo imitado, y 2) impostores reales (que
producen falsificaciones entrenadas), cuando se conoce y utiliza informacion del rasgo
imitado.
Modalidades biometricas. Hay una serie de modalidades fisiologicas que pueden
ser consideradas como tecnologicamente “maduras”, a saber, la huella dactilar, el iris,
la cara, la geometrıa de los dedos y/o la mano, o la huella palmar. En relacion con las
modalidades conductuales, rasgos como la voz, la escritura y la firma manuscrita, o el
modo de andar (marcha), son modalidades objeto de grandes esfuerzos de investigacion.
La Figura 1.2 muestra algunos ejemplos de rasgos biometricos (Jain et al., 2006). En
teorıa, cualquier caracterıstica humana puede ser considerada como un rasgo biometrico
siempre que satisfaga las siguientes propiedades:
• universal, que indica que toda persona debe poseer dicho rasgo;
• distintivo, que se refiere a que dicho rasgo debe ser lo suficientemente diferente
para diferentes personas;
• permanente, que indica que dicho rasgo debe poseer una representacion que se
mantenga a lo largo del tiempo;
167

7. RESUMEN EXTENDIDO DE LA TESIS
• mensurable, que se refiere a la habilidad de medir dicho rasgo cuantitativamente.
Otras propiedades deseables de cara al uso de rasgos biometricos en sistemas de
autenticacion incluyen:
• rendimiento, que se refiere a la eficiencia, precision, velocidad, robustez, y uso de
recursos de las implementaciones practicas basadas en dicho rasgo;
• aceptabilidad, que indica el grado en el que la gente esta dispuesta a usar dicho
rasgo y en que terminos;
• seguridad, que se refiere a la dificultad de burlar un sistema basado en dicho rasgo
con metodos fraudulentos;
• manejo de excepciones, referido a la capacidad de completar el reconocimiento
de modo manual en el caso de que ciertas personas no sean capaces o no puedan
usar alguna modalidad biometrica;
• coste, referido al coste economico del sistema para su uso normal.
Si se analiza el estado del arte de los sistemas basados en diferentes rasgos biometricos,
podremos observar que no existe ningun rasgo individual que maximice todas las
propiedades indicadas. Algunos rasgos biometricos son altamente distintivos pero son
difıcilmente mensurables (p.ej., el iris, con dispositivos caros y difıciles de utilizar),
mientras que otros se adquieren facilmente pero no son tan distintivos (p.ej., la cara).
No obstante, cuando se consideran varios rasgos simultaneamente, practicamente todas
las propiedades se satisfacen ampliamente, hecho que pretenden explotar los sistemas
multibiometricos.
Sistemas biometricos multimodales. En dichos sistemas se utilizan varios rasgos
biometricos simultaneamente con objeto de compensar las limitaciones de rasgos indi-
viduales (Ross et al., 2006). Como resultado, las tasas de error en verificacion suelen
disminuir, el sistema resultante es mas robusto frente a fallos de los sistemas individ-
uales y frente a ataques externos, y el numero de casos donde el sistema no es capaz de
dar una respuesta se reduce (p.ej., debido a la mala calidad de una muestra biometrica
de uno de los rasgos individuales).
A grandes rasgos, se pueden definir dos niveles de fusion: fusion antes de la com-
paracion, y fusion despues de la comparacion. Fusion antes de la comparacion incluye
fusion a nivel de sensor y fusion a nivel de caracterısticas, mientras que despues de la
168

7.1 Introduccion
comparacion tenemos a nivel de puntuaciones y a nivel de decision. Esta clasificacion
se basa en el hecho de que tras la comparacion, la cantidad de informacion disponible
para fusionar se reduce enormemente.
Entre todos estos tipos de fusion, la mayorıa de estrategias para la combinacion de
rasgos biometricos existentes en la literatura se basan en la fusion de las puntuaciones
o medidas de similitud proporcionadas por los sistemas individuales, por la mayor
facilidad de acceso a las mismas (Fierrez-Aguilar, 2006; Ross et al., 2006). Como
resultado de esta fusion, tenemos una nueva puntuacion o medida de similitud, que
sera lo que usemos para el reconocimiento. A su vez, los metodos de fusion a nivel de
puntuacion se clasifican en tres categorıas: metodos basados en densidades, metodos
basados en transformaciones y metodos basados en clasificadores (Ross et al., 2006).
En los metodos basados en densidades, las funciones de densidad conjunta p (s|ω0)
y p (s|ω1) correspondientes a las clases “usuario genuino” (ω0) e “impostor” (ω1) se
estiman para un vector de puntuaciones dado s = [s1, s2, · · · , sR], donde R es el numero
de comparadores. A continuacion, se aplica la regla de decision de Bayes (Duda et al.,
2004):
Asignar s → ωi sip(s|ωi)p(s|ωj)
> τ, i 6= j y i, j = {0, 1} (7.1)
donde p (s|ωi) /p (s|ωj) es un cociente de verosimilitud y τ = P (ωj)/P (ωi) es un umbral
predeterminado que depende de las probabilidades a priori de observar las clases ωj and
ωi1. La estimacion de la densidad p (s|ωi) se hace usando un conjunto de entrenamiento
de vectores de medidas de similitud mediante tecnicas parametricas o no parametricas.
En la literatura se han propuesto varias estrategias siguiendo estos metodos (Dass
et al., 2005; Kittler et al., 1998; Ross et al., 2006). Para estimar de modo preciso las
funciones de densidad, normalmente se necesita un conjunto grande de muestras de
entrenamiento, sobre todo si la dimensionalidad del vector s es alta.
En los metodos basados en transformaciones, las puntuaciones se combinan directa-
mente mediante operadores sencillos como la suma, la regla del maximo, etc. (Kittler
et al., 1998). En este caso, normalmente es necesario un proceso de normalizacion que
transforme las distintas puntuaciones a un rango comun (Jain et al., 2005).
Los metodos basados en clasificadores utilizan las puntuaciones de los diferentes
comparadores como entrada de un clasificador entrenado (Duda et al., 2004) para de-
1La regla de Bayes, tal como se expresa aquı, asume que el coste de cada error de clasificacion esel mismo para todas las clases posibles (Duda et al., 2004). Puesto que esta particularizacion no seconsidera en esta Tesis, no introducimos aquı terminos de coste de errores de clasificacion por claridad.
169

7. RESUMEN EXTENDIDO DE LA TESIS
terminar directamente la clase (usuario genuino o impostor), en lugar de devolver otra
puntuacion. En este caso, las puntuaciones normalmente no es necesario transformarlas
a un rango comun antes de la clasificacion, aunque sı sera necesario un conjunto grande
de muestras de entrenamiento para el clasificador. En la literatura biometrica se han
propuesto multiples clasificadores para la combinacion de puntuaciones: redes hyper
BF (Brunelli and Falavigna, 1995), k-vecino mas cercano (Verlinde and Chollet, 1999),
arboles de decision (Ben-Yacoub et al., 1999; Ross and Jain, 2003; Verlinde and Chollet,
1999), regresion logıstica lineal (Verlinde and Chollet, 1999), k-media and fuzzy clus-
tering (Chatzis et al., 1999), Maquinas de Vector Soporte (SVM) (Ben-Yacoub et al.,
1999; Fierrez-Aguilar et al., 2005a,e; Garcia-Romero et al., 2003), perceptrones mul-
ticapa (Ben-Yacoub et al., 1999), discriminantes de Fisher (Ben-Yacoub et al., 1999;
Wang et al., 2003), clasificadores Bayesianos (Ben-Yacoub et al., 1999; Bigun et al.,
1997) y redes neuronales (Wang et al., 2003).
Calidad en sistemas biometricos. Existen multiples algoritmos de medida de cal-
idad principalmente para huellas (Alonso-Fernandez et al., 2007c) y mas recientemente
para iris (Chen et al., 2006a; Kalka et al., 2005), voz, (Garcia-Romero et al., 2006;
Richiardi and Drygajlo, 2008; Richiardi et al., 2007), cara (Kryszczuk and Drygajlo,
2007) y firma (Alonso-Fernandez et al., 2007a; Muller and Henniger, 2007). Muchos
de estos trabajos demuestran que la calidad influye decisivamente en el rendimiento de
los sistemas. Es por ello que el analisis de calidad en biometrıa es un area actual de
intensa actividad investigadora (BQW, 2007; Grother and Tabassi, 2007). Tambien hay
importantes esfuerzos encaminados a estandarizar la informacion de calidad biometrica
ası como su incorporacion a estructuras de datos existentes (Benini, 2007; Benini and
et al, 2003, 2006).
Los roles de la calidad en sistemas biometricos son multiples (Benini, 2007; Grother
and Tabassi, 2007):
• como herramienta de monitorizacion y estadıstica para detectar fuentes de datos
erroneos (Ko and Krishnan, 2004);
• como herramienta para recapturar muestras a la entrada hasta cumplir un mınimo
de calidad;
• como mecanismo de ajuste de partes del sistema segun la calidad de las senales
capturadas (procesado de calidad condicional).
Este ultimo rol ha sido fuente de numerosos trabajos recientes para sistemas monomodales
(Alonso-Fernandez et al., 2007c, 2008; Chen et al., 2005, 2006a; Fronthaler et al., 2008;
170

7.1 Introduccion
Grother et al., 2005; Kang et al., 2003; Sickler and Elliott, 2005). La incorporacion de
calidad en mecanismos de fusion multimodal tambien esta siendo un area de trabajo
importante (Fierrez-Aguilar et al., 2006, 2005e; Fronthaler et al., 2008; Garcia-Romero
et al., 2006; Kryszczuk and Drygajlo, 2008; Nandakumar et al., 2006; Poh et al., 2007).
Tipos de errores en verificacion. El modo de verificacion puede ser consider-
ado como una tarea de deteccion, comportando un compromiso entre dos tipos de
errores: 1) Falso Rechazo (FR), que se produce cuando un usuario autentico (lo que se
conoce tambien por usuario genuino o cliente) es rechazado por el sistema, y 2) Falsa
Aceptacion (FA), que sucede cuando un impostor es aceptado por el sistema como si
fuera un usuario autentico. Estos dos tipos de errores tienen relacion inversa entre
sı, pudiendose obtener diversos puntos de funcionamiento del sistema en funcion del
umbral de decision elegido. El punto de trabajo en cada caso dependera de cada apli-
cacion en particular. Por esta razon la caracterizacion de los sistemas biometricos se
realiza mediante las curvas completas que relacionan ambos tipos de error. Por esta
razon tambien, en el caso de caracterizar el rendimiento de un sistema de verificacion
con tasas numericas, se suele optar bien por un par (FA,FR) o por el punto en donde
coinciden ambas tasas, esto es, el punto de igual error (Equal Error Rate –EER).
Representacion del funcionamiento en verificacion. Tradicionalmente se han
venido usando para representar el rendimiento de los sistemas biometricos en modo de
verificacion las curvas ROC (Receiver - o Relative- Operating Characteristic), en las que
se representa la probabilidad de FA frente a la probabilidad de FR para los diferentes
puntos de trabajo (esto es, umbrales de decision) del sistema. En las curvas ROC,
la zona de interes se concentra en la esquina inferior izquierda de la grafica, que se
corresponde con la zona en la que los dos tipos de error se minimizan conjuntamente.
El problema de este tipo de representacion ocurre cuando los sistemas producen bajas
tasas de error, puesto que, en estos casos, las curvas que describen los sistemas tienden
a concentrase, impidiendose de esta forma una visualizacion comparativa clara de sis-
temas competitivos. Con el objeto de solventar este problema, mas recientemente, se
han propuesto las denominadas curvas DET (Detection Error Tradeoff ) (Martin et al.,
1997), que representan tambien los dos tipos de error pero aplicando una transfor-
macion de ejes. Dicha escala produce un efecto de separacion de las graficas de sistema
que en las ROC se concentraban en la esquina inferior izquierda, y ademas consigue
que dichas curvas tiendan a ser lıneas rectas para distribuciones de puntuaciones Gaus-
sianas, haciendo ası que las comparaciones entre sistemas competitivos sean directas y
171
7. RESUMEN EXTENDIDO DE LA TESIS
sencillas. En la Figura 1.3 se muestra una comparacion entre curvas ROC y DET de
dos sistemas hipoteticos de verificacion A y B.
Motivacion para la Tesis. Segun hemos mencionado, el rendimiento de sistemas
biometricos se ve fuertemente afectado por la calidad de las senales biometricas. Esta
tesis se centra en este problema ası como en su aplicacion a sistemas multibiometricos.
Mas particularmente, se basa en las siguientes observaciones de la literatura:
• El trabajo previo en evaluacion de calidad biometrica es relativamente limitado
(Grother and Tabassi, 2007). La comunidad investigadora se ha venido cen-
trando principalmente en el desarrollo de sistemas reconocedores, perfeccionando
los mecanismos de extraccion de caracterısticas biometricas y de reconocimiento.
Igualmente, aunque hay multiples algoritmos de medida de calidad biometrica, to-
dos han sido evaluados individualmente y bajo marcos de evaluacion heterogeneos.
Solo recientemente se ha formalizado el concepto de calidad en biometrıa y se han
propuesto marcos comparativos para su evaluacion (Grother and Tabassi, 2007;
Youmaran and Adler, 2006).
• Para el caso de las huellas dactilares, se ha observado que los dos mecanismos
de reconocimiento por excelencia (minucias y texturas) no sufren de la misma
manera los efectos de la calidad (Fierrez-Aguilar et al., 2006). Algunos estudios
tambien se han enfocado al tipo de sensor utilizado (Grother et al., 2005; Kang
et al., 2003; Sickler and Elliott, 2005). Estos resultados no obstante, han sido
llevados a cabo en marcos limitados, sin efectuar pruebas comparativas extensas
entre varios algoritmos de calidad y/o diferentes tecnologıas de sensores de huella.
• En rasgos de comportamiento como la firma, es difıcil definir el concepto de
calidad. Algunos estudios proponen la complejidad o la variabilidad de la firma
(Allgrove and Fairhurst, 2000; Fierrez-Aguilar et al., 2005d) ası como otras carac-
terısticas locales (Muller and Henniger, 2007). Tambien hay trabajos relacionados
con la voz (Garcia-Romero et al., 2006). No obstante, el analisis de calidad en
rasgos de comportamiento es aun muy limitado.
• Una fuente de problemas adicionales es cuando el sensor de captura se cambia
por otro (Poh et al., 2007), o cuando las muestras a comparar provienen de difer-
entes sensores y/o algoritmos extractores de caracterısticas (Grother et al., 2005).
Estos problemas de interoperabilidad, que normalmente reducen sustancialmente
el rendimiento (Alonso-Fernandez et al., 2005c, 2006c; Grother et al., 2005; Ross
172
7.1 Introduccion
and Jain, 2004), no han sido especıficamente tratados. Por desgracia, a medida
que las aplicaciones biometricas se vaya extendiendo, sera bastante comun cam-
biar el sensor por disenos mas recientes (o cuando se rompa o deteriore), ası como
intercambiar informacion con otros sistemas desarrollados por otras companıas
(Poh et al., 2007).
• La incorporacion de medidas de calidad en sistemas multibiometricos es otro reto
actual (BMEC, 2007; BQW, 2007). Se ha demostrado que estos sistemas son mas
robustos a variaciones en la calidad (Fierrez-Aguilar et al., 2006; Nandakumar
et al., 2006) y puede ser una fuente adicional de mejora (BQW, 2007; Fierrez-
Aguilar et al., 2005e; Grother and Tabassi, 2007). Algunas estrategias que se
proponen consisten en combinar de modo adaptativo las salidas de los diferentes
comparadores en funcion de la calidad de las muestras de entrada (fusion de-
pendiente de calidad) o en modificar las etapas de procesamiento del sistema
(procesado dependiente de la calidad) (Chen et al., 2005).
La Tesis. En esta Tesis se evalua en primer lugar el impacto de la calidad de las
senales biometricas en el rendimiento del sistema bajo un marco comparativo. Dicho
estudio se lleva a cabo para dos rasgos particulares: huella y firma. Tambien se lleva
a cabo un estudio practico de adaptacion de sistemas multibiometricos a la calidad de
las senales. Dentro de este objetivo, se propone una arquitectura de sistema generaliz-
able a cualquier sistema biometrico que trabaje con diferentes fuentes de informacion
heterogeneas.
La Disertacion. En primer lugar se introducen los sistemas biometricos y multi-
biometricos, la evaluacion del rendimiento de sistemas biometricos, la motivacion de la
Tesis, una expresion breve de la Tesis, la organizacion de la Disertacion, y las contribu-
ciones de investigacion relacionadas con la Tesis.
Despues se hace un analisis extenso del estado del arte en calidad biometrica, abor-
dando los distintos factores que pueden afectar la calidad, como asegurar buena calidad
de senal, o cuales son los roles de la misma en un sistema biometrico.
La parte experimental de la Disertacion comienza con el estudio de la calidad en
imagenes de firma. Se contribuye con una taxonomıa de medidas de calidad existentes
y se lleva a cabo un estudio comparativo de un conjunto representativo de medidas de
calidad seleccionadas.
En el caso de verificacion basada en firma, se proponen varias caracterısticas en-
focadas a medir la calidad y a predecir el comportamiento de los sistemas de re-
173

7. RESUMEN EXTENDIDO DE LA TESIS
conocimiento. En esta parte, se introduce un nuevo sistema de verificacion basado
en caracterısticas del contorno de la firma.
Finalmente, se lleva a cabo un estudio de la adaptacion de un sistema multi-
biometrico a la calidad de las senales biometricas. Se propone una arquitectura de
procesado condicional basado en calidad que es capaz de integrar senales biometricas
procedentes de diferentes fuentes. La calidad en este caso se utiliza para conmutar
entre diferentes etapas del sistema ası como para no incluir en la combinacion senales
que no cumplan con una mınima calidad.
La dependencia entre capıtulos se ilustra en la Figure 1.4. Notese que los capıtulos
experimentales, que estan sombreados en la Figure 1.4, contienen referencias a los
metodos utilizados de capıtulos anteriores. De esta manera, y asumiendo conocimientos
generales en sistemas biometricos (Jain et al., 2008) y fusion multimodal (Ross et al.,
2006) los capıtulos experimentales se pueden leer independientemente. Tambien serıa
deseable el conocimiento de tecnicas generales de reconocimiento de patrones (Duda
et al., 2004; Theodoridis and Koutroumbas, 2003) y de procesado de imagen (Gonzalez
and Woods, 2002).
Contribuciones de la Tesis. Las contribuciones de la Tesis se pueden clasificar como
sigue a continuacion (notese que algunas publicaciones se repiten en puntos diferentes
de la lista):
• Revisiones del estado del arte. Taxonomıa de medidas de calidad de huella
(Alonso-Fernandez et al., 2007c, 2005b). Estado del arte en verificacion de huella
(Alonso-Fernandez et al., 2008a).
• Metodos originales. Metodos para medida de calidad y prediccion del rendimiento
con firmas off-line (Alonso-Fernandez et al., 2007a,b). Metodos para verificacion
multimodal basada en calidad con diferentes fuentes de informacion (Alonso-
Fernandez et al., 2008b).
• Nuevos sistemas biometricos. Nuevo sistema de verificacion de firma off-
line basado en caracterısticas del contorno de la firma (Gilperez et al., 2008),
desarrollado conjuntamente con Pecharroman-Balbas (2007).
• Nuevos estudios experimentales. Evaluacion comparativa de medidas de cal-
idad de huella en funcion del sensor utilizado y del tipo de comparador (Alonso-
Fernandez et al., 2007c, 2008; Fierrez-Aguilar et al., 2005b). Estudio del im-
pacto de la legibilidad y del tipo de firma en sistemas de verificacion de firma
174

7.1 Introduccion
off-line (Alonso-Fernandez et al., 2007b). Estudio del rendimiento de sistemas
de verificacion de firma off-line en funcion de nuevas medidas calidad propues-
tas (Alonso-Fernandez et al., 2007a). Estudio de la combinacion de diferentes
caracterısticas del contorno de la firma para verificacion (Gilperez et al., 2008).
Estudio de la adaptacion de sistemas a la calidad de senales biometricas proce-
dentes de diferentes fuentes, incluyendo fusion y procesado adaptado a la calidad
(Alonso-Fernandez et al., 2008b).
• Nuevos datos biometricos. Una nueva base de datos biometricos ha sido
adquirida en el marco de trabajo de la Tesis incluyendo cara, voz, firma, huella,
mano e iris de mas de 650 individuos (Alonso-Fernandez et al., 2008b). Dicha base
de datos es unica en el sentido de que incluye tres nuevos escenarios simultaneos
(Internet, PC en entorno oficina, y dispositivos moviles en entornos exteriores).
Parte de esta base de datos se usa en los experimentos del Capıtulo 5.
Otras contribuciones relacionadas con la Tesis no incluidas en el presente volumen
incluyen:
• Revisiones del estado del arte. Estado del arte en firma manuscrita (Garcia-
Salicetti et al., 2008). Estado del arte en bases de datos y evaluaciones de firma
y huella (Alonso-Fernandez and Fierrez, 2008; Garcia-Salicetti et al., 2008). Re-
vision de aplicaciones biometricas (Alonso Fernandez et al., 2008).
• Nuevos sistemas biometricos. Sistema de reconocimiento de iris basado en carac-
terısticas de Gabor, desarrollado conjuntamente con Tome-Gonzalez (2008).
• Nuevas aplicaciones biometricas. Uso del reconocimiento de firma en dispositivos
portatiles tipo Table PC y PDA (Alonso-Fernandez et al., 2005a, 2006a; Martinez-
Diaz et al., 2007).
• Metodos originales. Esquema adaptativo de fusion multialgoritmo de huella
basado en calidad (Fronthaler et al., 2008). Mecanismo de normalizacion de
score dependiente de usuario en funcion de la calidad (Alonso-Fernandez et al.,
2006b).
• Nuevos datos biometricos. Una nueva base de datos de firma dinamica de 53
sujetos capturada con Tablet PC (?) (Alonso-Fernandez et al., 2005a). Una
nueva base de datos incluyendo voz, iris, cara, firma, huella, mano y tecleo de
400 sujetos en 4 sesiones capturada en el marco del proyecto nacional BiosecurID
(Galbally et al., 2007).
175

7. RESUMEN EXTENDIDO DE LA TESIS
• Nuevos estudios experimentales. Verificacion multialgoritmo de huella y firma
(Alonso-Fernandez et al., 2008a, 2007d; Garcia-Salicetti et al., 2007, 2008). Es-
tudio de la capacidad discriminativa de medidas de calidad de huella (Alonso-
Fernandez et al., 2005b, 2007e, 2008). Estudio de ataques a sistemas de huella
(Galbally-Herrero et al., 2006; Martinez-Diaz et al., 2006) e iris (Ruiz-Albacete
et al., 2008). Estudio de interoperabilidad y fusion de sensores de huella y firma
(Alonso-Fernandez et al., 2005c, 2006c). Estudio del efecto de la calidad en
el rendimiento de los usuarios individuales en huella (Alonso-Fernandez et al.,
2006b).
• Nuevas aplicaciones biometricas. Uso de verificacion de firma dinamica en Tablet
PC y PDA (Alonso-Fernandez et al., 2005a, 2006a; Martinez-Diaz et al., 2007).
7.2 Medidas de calidad en sistemas biometricos
Hasta fechas recientes, no habıa consenso acerca de que es calidad de una muestra
biometrica. A grandes rasgos, podemos decir que una muestra es de buena calidad
si es adecuada para el reconocimiento. Mas formalmente (Benini and et al, 2006) se
han establecido tres puntos de vista diferentes, mostrados en la Figura 2.1: i) caracter,
referido a la calidad inherente al rasgo en terminos de si es adecuado de por sı para
el reconocimiento (por ejemplo, un dedo quemado no lo serıa); ii) fidelidad, referido
al grado de similitud entre la muestra capturada y el rasgo original, atribuible a las
distintas fases de procesado del sistema; y iii) utilidad, referido al impacto de la muestra
en el rendimiento del sistema. El caracter de la fuente y la fidelity de la muestra
procesada contribuyen a la utilidad de dicha muestra. Generalmente se acepta que
la utilidad es la propiedad mas importante, a la que deben orientarse las medidas de
calidad , por tanto, una muestra a la que se la asigna una calidad alta necesariamente
deberıa conducir a una mejor identificacion. No obstante, hay que considerar que no
todos los sistemas o algoritmos se comportan igual ni se ven afectados por los mismos
factores, de modo que una medida de calidad suele estar ligada a un algoritmo o a un
grupo de algoritmos particulares.
Existen multiples factores que pueden afectar a la calidad, resumidos en la Figura 2.2.
Distinguimos entre cuatro tipos principales:
• Factores ligados unicamente al usuario, entre los cuales tenemos los anatomicos y
los de comportamiento (Tablas 2.2 y 2.3). Suelen ser los mas difıciles de controlar
y/o evitar (a veces incluso son inevitables).
176
7.2 Medidas de calidad en sistemas biometricos
• Factores ligados a la interaccion usuario-sensor, entre los cuales se distinguen los
de entorno y los de operacion (Tablas 2.4 and 2.5). Son mas faciles de controlar
que los anteriores, aunque siguen implicando al usuario y por ello no siempre es
posible o recomendable. Podremos tener control sobre estos factores en tanto en
cuanto controlemos el entorno o la operacion de captura del rasgo biometrico.
• Factores ligados al sensor utilizado en la captura.
• Factores ligados al sistema de procesado y reconocimiento.
El primer tipo de factores mencionado tiene impacto en lo que hemos llamado
caracter de una muestra biometrica, mientras que el resto afectan a la fidelidad.
Conocidos los factores que afectan a la calidad de senales biometricas, se definen una
serie de medidas que podemos aplicar para asegurar una buena calidad de las mismas
(las cuales se resumen en la Figura 2.3):
• Actuacion en el punto de captura: supervision, sensor adecuado, interaccion ade-
cuada del usuario, entorno apropiado, mantenimiento del puesto de captura, etc.
• Actuacion en el propio sistema de reconocimiento: incluir algoritmos de tratamiento
de calidad adecuados, incluir herramientas de monitorizacion de calidad, etc.
• Actuacion mediante el propio algoritmo de medida de calidad: calculo en tiempo
real, fiabilidad, posibilidad de recaptura de muestras, etc.
En todo el proceso de aseguramiento de calidad es muy importante la adhesion
a los estandares existentes, obteniendo ası gran flexibilidad, modularidad y rapida
adaptacion a cambios tecnologicos y nuevos avances.
Para la evaluacion de medidas de calidad, se han propuesto recientemente difer-
entes mecanismos para medir la utilidad (Grother and Tabassi, 2007) y la fidelidad
(Youmaran and Adler, 2006) de las muestras. En esta Tesis, nos centraremos en la util-
idad. El primer mecanismo consiste en dividir las muestras en L niveles de acuerdo con
su calidad y calcular L curvas DET ordenadas. Otro mecanismo, el utilizado en esta
Tesis, consiste en pintar las llamadas curvas de error-vs-rechazo. Esta curva modela
el caso donde se rechazan las muestras de menor calidad con el objetivo de mejorar el
rendimiento. Un buen algoritmo de calidad deberıa mejorar su rendimiento a medida
que se rechazan las peores muestras.
Los roles de la calidad en sistemas biometricos son multiples (Benini, 2007; Grother
and Tabassi, 2007; Ko and Krishnan, 2004), los cuales se detallan en la Figura 2.6:
177

7. RESUMEN EXTENDIDO DE LA TESIS
• Como mecanismo de recaptura hasta obtener una muestra que satisfaga una
mınima calidad.
• Como mecanismo de invocacion de intervencion humana, en caso de que no sea
posible obtener una muestra de un usuario con calidad suficiente.
• Para procesado, comparacion de modelos y/o fusion de sistemas dependiente
de calidad, modificando adecuadamente las etapas del sistema en funcion de la
misma.
• Para actualizacion de las plantillas de registro de los usuarios con nuevas plantillas
de mejor calidad.
• Como herramienta de monitorizacion y estadıstica para detectar fuentes de datos
erroneos.
Por ultimo, destacar los esfuerzos estandarizadores que se estan llevando a cabo
recientemente para la incorporacion de medidas de calidad a las estructuras de datos
biometricos existentes (Benini, 2007; Benini and et al, 2006).
7.3 Analisis de calidad en imagenes de huella
Este primer capıtulo experimental se basa en las publicaciones Alonso-Fernandez et al.
(2008a, 2007c, 2005b, 2008); Fierrez-Aguilar et al. (2005b).
El objetivo es comparar varias medidas de calidad representativas mediante el es-
tudio de su correlacion y de su utilidad. Se evalua su impacto en el rendimiento de los
dos algoritmos mas utilizados en reconocimiento de huella: minucias y texturas.
Medidas de calidad en huella. La calidad en huella puede definirse como la clari-
dad de sus crestas y valles, ası como la “extractabilidad” de las caracterısticas usadas
para el reconocimiento (Chen et al., 2005). En huellas de buena calidad, las crestas
y los valles fluyen de modo suave, siguiendo una direccion que localmente se puede
considerar constante (Hong et al., 1998).
Son multiples los factores que especıficamente contribuyen a degradar la calidad
de las huellas, dando lugar a multiples perturbaciones (algunos ejemplos se muestran
el la Figura 3.14): bajo solapamiento entre distintas adquisiciones, rotacion, desplaza-
miento, huella incompleta, baja definicion, ruido de capturas previas, distorsion, etc.
Para detectar los distintos factores de baja calidad, los algoritmos existentes analizan
178

7.3 Analisis de calidad en imagenes de huella
las siguientes propiedades de las huellas: direccionalidad o “fuerza” de las crestas, con-
tinuidad de las mismas, claridad, integridad de las estructura cresta-valle, o rendimiento
estimado al usar dicha muestra. Para ello, se utilizan multiples fuentes de informacion:
angulo local a partir del campo de orientacion, filtros de Gabor, intensidad de gris
de los pıxeles, espectro de potencia, o clasificadores. El analisis de calidad puede ser
local (dividiendo la imagen en bloques solapados o no), global (analizando la imagen
en conjunto), o a partir de clasificadores.
Sistemas y base de datos utilizada. En el estudio de este capıtulo se utiliza un
comparador de minucias desarrollado por en NIST americano (Watson et al., 2004),
de libre obtencion, y un comparador basado en texturas desarrollado por el Grupo
de Reconocimiento Biometrico - ATVS (Fierrez-Aguilar et al., 2005b). La base de
datos utilizada es el corpus BioSec baseline (Fierrez et al., 2007), que incluye 19, 200
imagenes de huella de 200 individuos capturados en 2 sesiones y con 3 sensores de
diferente tecnologıa, mostrados en la Figura 3.28: un sensor de tipo capacitivo, un
sensor de tipo termico y un sensor de tipo optico. Estas tres tecnologıas de sensores
son las mas utilizadas en la actualidad.
Resultados. Para los experimentos de este capıtulo, se ha seleccionado un grupo de
medidas de calidad representativo de las distintas fuentes de informacion mencionadas.
En concreto, se ha elegido una medida que hace uso de informacion de direccion, otra
de intensidad de gris, otra del espectro de potencia y otra basada en clasificadores.
Se ha observado que en general existe una correlacion entre las medidas de calidad
estudiadas (ver Figura 3.31), aunque se observan algunas diferencias en funcion del
sensor, sugiriendo que su funcionamiento es diferente en cada uno de los mismos. En
cuanto a la utilidad de las medidas (ver Figuras 3.32- 3.35, se observa que para el
comparador basado en minucias, el mayor incremento en el rendimiento cuando se
rechazan muestras de baja calidad se obtiene para el Falso Rechazo (Figura 3.34).
Esto se debe a que se observa una clara correlacion entre las medidas de similitud
de usuarios genuinos y su calidad (Figura 3.32), no siendo ası para las medidas de
similitud de impostores. Por otro lado, para el comparador basado en texturas, la
mayor mejora se observa en la Falsa Aceptacion (Figura 3.35), debido a que en este
caso la mayor correlacion se observa entre las medidas de similitud de imposores y su
calidad (Figura 3.33).
179

7. RESUMEN EXTENDIDO DE LA TESIS
7.4 Analisis de calidad en imagenes de firma
Este segundo capıtulo experimental se basa en las publicaciones Alonso-Fernandez et al.
(2007a,b); Gilperez et al. (2008).
El objetivo es presentar nuevas medidas para la prediccion del rendimiento de sis-
temas de verificacion de firma off-line. La utilidad de las medidas propuestas se evalua
en tres algoritmos de reconocimiento, uno de los cuales basado en caracterısticas locales
de contorno es una contribucion en esta Tesis.
Medidas de calidad en firma. Si bien en imagenes de huella podemos definir de
modo objetivo la calidad a partir de la estructura de crestas, en rasgos de compor-
tamiento tales como la firma resulta mas complicado. Algunos estudios proponen le
estabilidad o la complejidad como parametros para medir la calidad (Allgrove and
Fairhurst, 2000; Brault and Plamondon, 1993; Muller and Henniger, 2007). No ob-
stante, estos son factores que dependen totalmente de como el usuario decide firmar,
por lo que si rechazamos una firma en funcion de ellos, es posible que la siguiente vuelva
a “sufrirlos”. En este caso la estrategia debera ser, una vez extraıdos los parametros
de calidad, adaptar el sistema acorde a ellos.
En este capıtulo se presentan varias medidas encaminadas a predecir el compor-
tamiento de un sistema de firma a partir de imagenes off-line:
• Dos medidas, legibilidad y tipo de firma, que se extraen de modo manual (ver
Figuras 4.7 y 4.8). El objetivo aquı es valorar si el hecho de que las firmas posean
letras legibles, rubricas sencillas o complejas, etc. puede afectar al rendimiento
del sistema. El hecho de asignar estas medidas de modo manual es factible en un
entorno de firma off-line, donde la captura se lleva a cabo con un escaner o una
camara.
• Una medida que calcula automaticamente el area de la imagen donde hay varios
trazos cruzandose, y por tanto donde no existe una direccion o trazo predominante
para el analisis (ver Figura 4.9). Esta medida podrıa considerarse como una
medida de complejidad.
• Una medida que calcula la variabilidad de un conjunto dado de firmas, con el
objetivo de medir su estabilidad.
• Tres medidas geometricas a partir de las cuales se calcula la varianza de la presion
ejercida con el lapiz al firmar, la duracion de la firma, y su area.
180

7.4 Analisis de calidad en imagenes de firma
Sistemas y base de datos utilizada. En este capıtulo se utilizan tres sistemas
de verificacion. El primero de ellos se basa en analisis global de la imagen y en un
clasificador de mınima distancia (Fierrez-Aguilar et al., 2004; Lee and Lizarraga, 1996).
El segundo, se basa en analisis local de la imagen y en un comparador basado en Modelos
Ocultos de Markov (Fierrez-Aguilar et al., 2004; Justino et al., 2001; Lee and Lizarraga,
1996). El tercero esta basado en analisis local del contorno de la firma (Bulacu and
Schomaker, 2007), desarrollado en el marco de esta Tesis conjuntamente con Gilperez
et al. (2008).
La base de datos utilizada es un subcorpus de la base de datos bimodal MCYT
(Ortega-Garcia et al., 2003b), que incluye imagenes de huella dactilar y firma escrita
de 330 individuos. La informacion dinamica de las firmas escritas fue capturada con
una tableta digitalizadora Wacom Intuos A6 haciendo uso de un bolıgrafo especial
con tinta sobre papel comun. Este procedimiento permitio capturar por un lado la
informacion dinamica, en forma de trayectorias, presion y angulos de inclinacion del
bolıgrafo respecto al tiempo (ver Figura 4.1); y por el otro lado la informacion estatica
impresa en las hojas, que posteriormente fue digitalizada a 600 puntos por pulgada
para un conjunto total de 2250 firmas de 75 individuos. Cada firma fue escrita en
una rejilla de tamano 3.75 cm × 1.75 cm (ancho × alto). En el conjunto de firmas
digitalizadas, cada usuario posee 15 firmas autenticas y 15 falsificaciones realizadas por
otros usuarios.
Resultados. De los resultados experimentales extraemos que con imitadores entrena-
dos, se obtiene mejor rendimiento usando firmas legibles, a pesar de que cabrıa esperar
que este tipo de firmas son mas faciles de imitar. En cuanto a la legibilidad para el caso
de imitadores casuales, se obtiene un comportamiento diferente para cada comparador,
mostrando una fuente util de complementariedad entre ellos que puede ser explotada.
Otro resultado destacable en este apartado concerniente a la medida de variabilidad
propuesta es que el rendimiento cae considerablemente con conjuntos de firmas muy
variables, especialmente si se usan pocas firmas de entrenamiento.
Finalmente, para las medidas geometrica propuestas, algunas conclusiones son que:
en general es mejor alta varianza en la presion ejercida con el lapiz al firmar, y que las
firmas de mayor duracion son por lo general mas resistentes a imitadores entrenados.
181

7. RESUMEN EXTENDIDO DE LA TESIS
7.5 Procesado y fusion multibiometrica dependiente de
calidad
Este ultimo capıtulo experimental se basa en la publicacion Alonso-Fernandez et al.
(2008b).
El objetivo es analizar el efecto de combinar senales procedentes de distintos sensores
biometricos para una misma modalidad. Se propone una arquitectura de procesado
condicional donde la calidad se utiliza para conmutar entre diferentes etapas del sistema,
ası como para no incluir en la combinacion senales que no cumplan con una mınima
calidad. El sistema aquı descrito se utilizo para participar en la Evaluacion Multimodal
BioSecure (BMEC, 2007; Poh and Bourlai, 2007), con muy buenos resultados (segunda
posicion en terminos de Tasa Media de Error Total entre trece participantes).
Calibracion y fusion en sistemas biometricos. En el sistema propuesto, se hace
uso de fusion basada en regresion logıstica lineal (Brummer et al., 2007; Pigeon et al.,
2000), de manera que las medidas de similitud a la salida esten calibradas. Calibradas
quiere decir que han sido convertidas al logaritmo del cociente de verosimilitudes (LLR),
de tal modo que la medida representa un grado de apoyo con sentido probabilıstico a
las hipotesis de aceptacion o rechazo del individuo. Ası, se puede combinar de modo
facil y eficiente las medidas de similitud proporcionadas por diferentes fuentes.
Sistemas y base de datos utilizada. Como base de datos en este capıtulo, se usa
el conjunto de medidas de similitud empleado en la Evaluacion Multimodal BioSecure,
llevada a cabo en 2007 (BMEC, 2007; Poh and Bourlai, 2007). Las medidas de simili-
tud que incluye proceden de comparaciones con imagenes de cara y de huella extraıdas
de la base de datos BioSecure, capturada en el marco de esta Tesis (Alonso-Fernandez
et al., 2008b). Las imagenes de cara se capturaron con dos camaras de diferente res-
olucion, y las de huella con un sensor optico y uno termico (los sensores junto con
ejemplos de muestras capturadas se muestran en la Figura 5.1). Se considera tambien
el caso de comparar imagenes de un sensor con imagenes capturadas con el otro. Junto
con las medidas de similitud, se proporcionan una serie de medidas de calidad de las
imagenes. Para las comparaciones, se utilizaron sistemas estandar de reconocimiento
(Martinez and Kak, 2001; Watson et al., 2004). Se consideran dos conjuntos de medidas
de similitud diferentes, uno de desarrollo (proporcionado a los participantes antes de
la evaluacion) y uno de prueba (utilizado para la evaluacion y hecho publico tras la
misma).
182
7.6 Lıneas de Trabajo Futuro
Estimacion del sensor usando medidas de calidad. De acuerdo con el protocolo
de la Evaluacion Multimodal BioSecure, no se proporciona informacion referente al
sensor utilizado en las capturas, por lo que es necesario estimarlo. Para ello, en el
sistema propuesto, se hace uso de una funcion discriminante cuadratica con densidades
normales multivariable (Duda et al., 2004). Los parametros que modelan las densidades
son las medidas de calidad proporcionadas, o parametros derivados directamente de
ellas.
Se observa en los resultados la estimacion del sensor de cara funciona correctamente
en el conjunto de desarrollo, no confirmado en el conjunto de prueba, lo cual podrıa
deberse al tamano pequeno del conjunto de desarrollo proporcionado. Por otro lado, el
sensor de huella no es posible estimarlo de modo fiable con este mecanismo en ninguno
de los conjuntos de datos.
Interoperabilidad de sensores. Se estudia en este apartado la capacidad del sis-
tema propuesto para combinar senales de diferentes fuentes biometricas. Para ello, se
analizan las diferentes combinaciones disponibles del uso de sensores en cada modalidad
(4 en total). Se compara asimismo con un conjunto de reglas sencillas de fusion. Los
resultados de este estudio se muestran en la Tabla 5.6 y en la Figura 5.6. Se observa
que cuando se comparan imagenes de un sensor con imagenes capturadas con el otro, el
sistema propuesto funciona considerablemente mejor que las reglas sencillas de fusion.
Asimismo, el rendimiento global del sistema tambien es sustancialmente mejor.
Fusion dependiente de calidad. Por ultimo, en este apartado, se analiza el caso de
rechazar muestras de baja calidad, de manera que en la fusion se consideren solamente
las de buena calidad disponibles. Los resultados de este estudio se muestran en la
Tabla 5.8 y en las Figuras 5.10 y 5.11.
Se observa que el rendimiento del sistema mejora considerablemente al incorporar
esta polıtica de rechazo (hasta un 24%). Una ventaja anadida muy importante es que
en un numero considerable de accesos donde uno de los rasgos (huella o cara) es de
baja calidad, aun es posible utilizar el otro.
7.6 Lıneas de Trabajo Futuro
Se proponen las siguientes lıneas de trabajo futuro relacionadas con el trabajo desar-
rollado en esta Tesis:
• Aplicacion del estudio realizado a otros rasgos biometricos. Se han
183

7. RESUMEN EXTENDIDO DE LA TESIS
propuesto en la literatura medidas de calidad para otros rasgos aparte de los
considerados en esta Tesis: iris (Chen et al., 2006a; Kalka et al., 2005), voz
(Garcia-Romero et al., 2006) y cara (Kryszczuk and Drygajlo, 2007). Una vez
obtenido un consenso acerca de que es la calidad y como evaluarla (Benini and
et al, 2006; BQW, 2007; Youmaran and Adler, 2006), un trabajo futuro es llevarlo
a cabo para todos estos rasgos.
• Combinacion de varias medidas de calidad, una vez que se ha observado
que algunas se comportan de manera diferente en funcion de varios factores,
explotando dichas diferencias, e.g. Fierrez-Aguilar et al. (2006); Fronthaler et al.
(2008).
• Propuesta de nuevas medidas de calidad que complementen a las existentes
o en rasgos donde apenas se ha trabajado este tema.
• Incorporacion de medidas de calidad en sistemas biometricos. Analisis
del ajuste de etapas del sistema (Chen et al., 2005; Hong et al., 1998; Shi et al.,
2004) o de mecanismos de fusion como el propuesto aquı (Baker and Maurer,
2005; Chan et al., 2006; Fierrez-Aguilar et al., 2006; Nandakumar et al., 2006).
• Efecto de la calidad en nuevos escenarios, como resultado de nuevas necesi-
dades que se van planteando con el desarrollo de la biometrıa: sustitucion de sen-
sores, comparacion de muestras procedentes de distintas fuentes, reconocimiento
con sensores moviles personales, etc.
• Analisis de calidad desde el punto de vista de teorıa de la informacion.
Existen algunos esfuerzos encaminados a relacionar la calidad de muestras biometricas
con la cantidad de informacion discriminativa contenida en la misma (Daugman,
2003; Kholmatov and Yanikoglu, 2008; Youmaran and Adler, 2006), la cual con-
stituye un area interesante de trabajo futuro.
• Efecto del paso del tiempo en la calidad de las senales capturadas ası como
desarrollar mecanismos de seleccion y actualizacion de plantillas siguiendo
criterios de calidad. Algunos trabajos iniciales son Ko and Krishnan (2004);
Uludag et al. (2004).
184

References
A. Adler and T. Dembinsky. Human vs. automatic measurement of biometric sample quality. Canadian
Conference on Electrical and Computer Engineering, CCECE, 2006. 38
L. Allano, F. Alonso-Fernandez, J. Alba-Castro, G. Chollet, B. Dorizzi, and A. Mayoue. Biosecure
validated data sets. Technical report, FP6 IST-2002-507634, BioSecure NoE Deliverable D.6.4.1.,
July 2007. 20
C. Allgrove and M. Fairhurst. Enrolment model stability in static signature verification. In L. Schomaker
and L. Vuurpijl, editors, in proceedings Intl. Works. on Frontiers in Handwriting Recognition,
IWFHR, pages 565–570, September 2000. 13, 102, 104, 172, 180
F. Alonso-Fernandez, J. Bigun, J. Fierrez, H. Fronthaler, K. Kollreider, and J. Ortega-Garcia. Guide
to Biometric Reference Systems and Performance Evaluation, chapter Fingerprint recognition.
Springer-Verlag, London, 2008a. 17, 19, 50, 60, 174, 176, 178
F. Alonso-Fernandez, M. Fairhurst, J. Fierrez, and J. Ortega-Garcia. Automatic measures for predicting
performance in off-line signature. Proc. International Conference on Image Processing, ICIP, San
Antonio TX, USA, 1:369–372, September 2007a. 8, 17, 18, 32, 94, 106, 170, 174, 175, 180
F. Alonso-Fernandez, M. Fairhurst, J. Fierrez, and J. Ortega-Garcia. Impact of signature legibility
and signature type in off-line signature verification. Proceedings of Biometric Symposium, Biometric
Consortium Conference, Baltimore, Maryland (USA), 1:1–6, September 2007b. 17, 18, 32, 94, 174,
175, 180
F. Alonso-Fernandez and J. Fierrez. Encyclopedia of Biometrics, chapter Fingerprint Databases and
Evaluation. Springer, 2008. 18, 175
F. Alonso-Fernandez, J. Fierrez, J. Ortega-Garcia, J. Gonzalez-Rodriguez, H. Fronthaler, K. Kollreider,
and J. Bigun. A comparative study of fingerprint image quality estimation methods. IEEE Trans.
on Information Forensics and Security, 2(4):734–743, December 2007c. 8, 9, 17, 18, 32, 38, 50, 154,
163, 170, 174, 178
F. Alonso-Fernandez, J. Fierrez, D. Ramos, and J. Ortega-Garcia. Dealing with sensor interoperability
in multi-biometrics: The UPM experience at the Biosecure Multimodal Evaluation 2007. Defense
and Security Symposium, Biometric Technologies for Human Identification, BTHI, Proc. SPIE, 6944:
69440J1–69440J12, 2008b. 17, 18, 135, 136, 140, 148, 160, 174, 175, 182
185
REFERENCES
F. Alonso-Fernandez, J. Fierrez-Aguilar, F. del-Valle, and J. Ortega-Garcia. On-line signature verifi-
cation using Tablet PC. Proc. IEEE Intl. Symposium on Image and Signal Processing and Analysis,
ISPA, September 2005a. 19, 20, 175, 176
F. Alonso-Fernandez, J. Fierrez-Aguilar, H. Fronthaler, K. Kollreider, J. Ortega-Garcia, J. Gonzalez-
Rodriguez, and J. Bigun. Combining multiple matchers for fingerprint verification: A case study
in biosecure network of excellence. Annals of Telecommunications, 62(1-2):62–82, January-February
2007d. 19, 176
F. Alonso-Fernandez, J. Fierrez-Aguilar, and J. Ortega-Garcia. A review of schemes for fingerprint
image quality computation. Proc. COST-275 Workshop on Biometrics on the Internet, pages 3–6,
2005b. 17, 19, 50, 174, 176, 178
F. Alonso-Fernandez, J. Fierrez-Aguilar, and J. Ortega-Garcia. Sensor interoperability and fusion in
signature verification: a case study using tablet pc. Proc. Intl. Workshop on Biometric Recognition
Systems, IWBRS, Springer LNCS-3781:180–187, 2005c. 13, 19, 172, 176
F. Alonso-Fernandez, J. Fierrez-Aguilar, J. Ortega-Garcia, and J. Gonzalez-Rodriguez. A web-based
secure access system using signature verification over tablet pc. IEEE Aerospace and Electronic
Systems Magazine, 22(4):3–8, 2006a. 19, 175, 176
F. Alonso Fernandez, J. Ortega Garcia, and R. Coomonte Belmonte. Seguridad Biometrica. Fundacin
Rogelio Segovia para el Desarrollo de las Telecomunicaciones, 2008. 19, 175
F. Alonso-Fernandez, F. Roli, G. Marcialis, J. Fierrez, and J. Ortega-Garcia. Comparison of fingerprint
quality measures using an optical and a capacitive sensor. Proc. IEEE Conference on Biometrics:
Theory, Applications and Systems, BTAS, Washington DC (USA), 2007e. 19, 176
F. Alonso-Fernandez, F. Roli, G. Marcialis, J. Fierrez, J. Ortega-Garcia, and J. Gonzalez-Rodriguez.
Performance of fingerprint quality measures depending on sensor technology. SPIE Journal of Elec-
tronic Imaging, 17(1), January-March 2008. 9, 18, 19, 42, 50, 154, 170, 174, 176, 178
F. Alonso-Fernandez, R. Veldhuis, A. Bazen, J. Fierrez-Aguilar, and J. Ortega-Garcia. On the relation
between biometric quality and user-dependent score distributions in fingerprint verification. Proc.
of Workshop on Multimodal User Authentication - MMUA, 2006b. 19, 175, 176
F. Alonso-Fernandez, R. Veldhuis, A. Bazen, J. Fierrez-Aguilar, and J. Ortega-Garcia. Sensor in-
teroperability and fusion in fingerprint verification: A case study using minutiae- and ridge-based
matchers. Proc. IEEE Intl. Conf. on Control, Automation, Robotics and Vision, ICARCV, pages
422–427, 2006c. 13, 19, 60, 172, 176
N. Alonso-Hermira. Fusion unimodal de esquemas de reconocimiento de firma escrita off-line. Master’s
thesis, EUITT, Universidad Politecnica de Madrid, 2003. xxi, xxii, 97, 98, 115, 116, 117
M. Ammar and T. Fukumura. A new effective approach for off-line verification of signatures by using
pressure features. Proc. Intl. Conf. on Pattern Recognition, ICPR, 1986. 95, 99
M. Ammar, Y. Yoshida, and T. Fukumura. Off-line preprocessing and verification of signatures. Inter-
national Journal of Pattern Recognition and Artificial Intelligence, 2:589–602, 1988. 95, 97
186

REFERENCES
M. Ammar, Y. Yoshida, and T. Fukumura. Structural description and classification of signature images.
Pattern Recognition, 23(7):697–710, 1990. 98
A. Antonelli, R. Capelli, D. Maio, and D. Maltoni. Fake finger detection by skin distortion analysis.
IEEE Trans. on Information Forensics and Security, 1:306–373, 2006. 61
B. Atal. Automatic recognition of speakers from their voices. Proceedings of the IEEE, 64:460–475,
1976. 1, 10, 165
AVBPA. Proc. 5th International Conference on Audio- and Video-Based Biometric Person Authenti-
cation, AVBPA, NY, USA, July 20-22, 2005, Springer LNCS-3546, 2005. 2, 165
R. Bajaj and S. Chaudhury. Signature verification using multiple neural classifiers. Pattern Recognition,
30(1):1–7, 1997. 98, 100
J. Baker and D. Maurer. Fusion of biometric data with quality estimates via a bayesian belief network.
Proceedings of Biometric Symposium, Biometric Consortium Conference, Arlington, VA (USA),
pages 21–22, 2005. 64, 163, 184
H. Baltzakis and N. Papamarkos. A new signature verification technique based on a two-stage neural
network classifier. Engineering Applications of Artificial Intelligence, 14:95–103, 2001. 98, 100
A. Bazen and S. Gerez. Segmentation of fingerprint images. Proc. Workshop on Circuits Systems and
Signal Processing, ProRISC, pages 276–280, 2001. 55
BC. Biometrics Consortium - www.biometrics.org, 2005. 2, 166
S. Ben-Yacoub, Y. Abdeljaoued, and E. Mayoraz. Fusion of face and speech data for person identity
verification. IEEE Transactions on Neural Networks, 10(5):1065–1075, September 1999. 8, 170
D. Benini. Biometric sample quality standards: Applications, status, and direction.
Proc. NIST Biometric Quality Workshop, Gaithersburg, MD, USA, November 7-8, 2007 -
http://www.itl.nist.gov/iad/894.03/quality/workshop07/index.html, 2007. 9, 44, 45, 170, 177, 178
D. Benini and et al. Report of the ad hoc group on biometric quality: Document n1128. ISO/IEC,
JTC1 / SC37 / Working Group 3 - http://isotc.iso.org/isotcportal, 2003. 9, 170
D. Benini and et al. ISO/IEC 29794-1 Biometric Quality Framework Standard, first ed.
JTC1/SC37/Working Group 3 - http://isotc.iso.org/isotcportal, 2006. 9, 24, 33, 154, 163, 170,
176, 178, 184
A. Bertillon. Identification anthropometrique et instructions signaletiques. Melun: Imprimerie admin-
istrative, 1893. 1
E. Bigun, J. Bigun, B. Duc, and S. Fischer. Expert conciliation for multi modal person authentication
systems by bayesian statistics. Proc. International Conference on Audio- and Video-Based Biometric
Person Authentication, AVBPA, Springer LNCS-1206:291–300, 1997. 8, 60, 64, 170
J. Bigun. Vision with Direction. Springer, 2006. 17, 53, 64, 65, 69
187

REFERENCES
J. Bigun, T. Bigun, and K. Nilsson. Recognition by symmetry derivatives and the generalized structure
tensor. IEEE Trans. on Pattern Analysis and Machine Intelligence, 26:1590–1605, 2004. 68
J. Bigun and G. Granlund. Optimal orientation detection of linear symmetry. First International
Conference on Computer Vision, pages 433–438, June 1987. 53, 65
BioAPI. BioAPI consortium - Biometric Application Programming Interface - www.bioapi.org. 1998.
2, 44, 166
BioSec. Biometrics and security, FP6 IP, IST - 2002-001766 - http://www.biosec.org. 2004. 2, 166
BioSecure. Biometrics for Secure Authentication, FP6 NoE, IST - 2002-507634 -
http://www.biosecure.info. 2004. 2, 20, 140, 166
BMEC. The Biosecure Multimodal Evaluation Campaign - http://www.int-
evry.fr/biometrics/bmec2007/index.php. 2007. 2, 14, 46, 61, 135, 140, 151, 160, 166, 173,
182
R. Bolle, J. Connell, S. Pankanti, N. Ratha, and A. Senior, editors. Guide to Biometrics. Springer
Verlag, 2004. 2, 165
R. Bolle, A. Serior, N. Ratha, and S. Pankanti. Fingerprint minutiae: A constructive definition. Proc.
Workshop on Biometric Authentication, BIOAW, Springer LNCS-2359:58–66, 2002. 56
BQW. NIST Biometric Quality Workshop, Gaithersburg, MD, USA, November 7-8, 2007 -
http://www.itl.nist.gov/iad/894.03/quality/workshop07/index.html, 2007. 8, 14, 21, 163, 170, 173,
184
J. Brault and R. Plamondon. A complexity measure of handwritten curves: Modeling of dynamic
signature forgery. IEEE Trans. on Systems, Man and Cybernetics, 23:400–413, 1993. 102, 104, 180
N. Brummer. Focal toolkit: MATLAB code for evaluation, fusion and calibration of statistical pattern
recognizers. Available at http://niko.brummer.googlepages.com/. 139, 146
N. Brummer, L. Burget, J. Cernocky, O. Glembek, F. Grezl, M. Karafiat, D. van Leeuwen, P. Matejka,
P. Scwartz, and A. Strasheim. Fusion of heterogeneous speaker recognition systems in the STBU
submission for the NIST speaker recognition evaluation 2006. IEEE Transactions on Audio, Speech
and Signal Processing, 15(7):2072–2084, 2007. 135, 137, 138, 139, 182
N. Brummer and J. du Preez. Application independent evaluation of speaker detection. Computer
Speech and Language, 20:230–275, 2006. 137, 138, 139, 146
R. Brunelli and D. Falavigna. Person identification using multiple cues. IEEE Trans. on Pattern
Analysis and Machine Intelligence, 17(10):955–966, October 1995. 8, 170
BTAS. 1st IEEE Conference on Biometrics: Theory, Applications and Systems. 2007. 2, 165
M. Bulacu and L. Schomaker. Text-independent writer identification and verification using textural
and allographic features. IEEE Trans. on Pattern Analysis and Machine Inteligence, 29(4):701–717,
April 2007. 117, 119, 120, 121, 122, 181
188

REFERENCES
C. Burges. A tutorial on support vector machines for pattern recognition. Data Mining and Knowledge
Discovery, 2:121–167, 1998. 100
R. Cappelli, M. Ferrara, and D. Maltoni. The quality of fingerprint scanners and its impact on the
accuracy of fingerprint recognition algorithms. in proceedings Multimedia Content Representation,
Classification and Security (MRCS), 2006a. 65
R. Cappelli, D. Maio, D. Maltoni, J. L. Wayman, and A. K. Jain. Performance evaluation of fingerprint
verification systems. IEEE Trans. on Pattern Analysis and Machine Intelligence, 28(1):3–18, Jan
2006b. xxv, 8, 21, 22
CBEFF. Common Biometric Exchange File Format - http://www.itl.nist.gov/ div893/ biometrics/
documents/ NISTIR6529A.pdf, 2001. 2, 61, 166
M. Chan, R. Brown, and W. Turner. Incorporating quality metrics in multimodal biometric fusion.
Proc. IEEE Workshop on Biometrics, in association with CVPR, 2006. 163, 184
J. Chang and K. Fan. Fingerprint ridge allocation in direct gray-scale domain. Pattern Recognition,
34:1907–1925, 2001. 56
V. Chatzis, A. Bors, and I. Pitas. Multimodal decision-level fusion for person authentication. IEEE
Trans. on Systems, Man and Cybernetics-Part A: Systems and Humans, 29(6):674–681, November
1999. 8, 170
T. Chen, X. Jiang, and W. Yau. Fingerprint image quality analysis. Proc. International Conference
on Image Processing, ICIP, 2:1253–1256, 2004. 66, 67, 71, 82
Y. Chen, S. Dass, and A. Jain. Fingerprint quality indices for predicting authentication perfor-
mance. Proc. International Conference on Audio- and Video-Based Biometric Person Authenti-
cation, AVBPA, Springer LNCS-3546:160–170, 2005. 9, 14, 33, 36, 41, 62, 64, 65, 66, 67, 68, 74, 75,
82, 141, 143, 154, 164, 170, 173, 178, 184
Y. Chen, S. Dass, and A. Jain. Localized iris image quality using 2-D wavelets. Proc. International
Conference on Biometrics, ICB, Springer LNCS-3832:373–381, 2006a. 8, 9, 32, 41, 163, 170, 184
Y. Chen and A. Jain. Dots and incipients: Extended features for partial fingerprint matching. Pro-
ceedings of Biometric Symposium, Biometric Consortium Conference, Baltimore, Maryland (USA),
2007. 61
Y. Chen, G. Parziale, E. Diaz-Santana, and A. Jain. 3d touchless fingerprints: Compatibility with legacy
rolled images. Proceedings of Biometric Symposium, Biometric Consortium Conference, Baltimore,
Maryland (USA), 2006b. 52
S. Chikkerur and N. K. Ratha. Impact of singular point detection on fingerprint matching performance.
Proc. IEEE AutoID, pages 207–212, 2005. 58
L. Cordella, P. Foggia, C. Sansone, and M. Vento. Document validation by signature: a serial multi-
expert approach. Proc. Intl. Conference on Document Analysis and Recognition, ICDAR, pages
601–604, 1999. 101
189

REFERENCES
COST-2101. Biometrics for identity documents and smart cards - http://www.cost2101.org. 2006. 2,
166
COST-275. Biometrics-based recognition of people over the internet - http://www.fub.it/cost275. 2003.
2, 166
S. Dass, K. Nandakumar, and A. Jain. A principled approach to score level fusion in multimodal
biometric systems. Proc. International Conference on Audio- and Video-Based Biometric Person
Authentication, AVBPA, Springer LNCS-3546:1049–1058, 2005. 8, 169
J. Daugman. Complete discrete 2-D Gabor transforms by neural networks for image analysis and
compression. IEEE Trans. on Acoustics, Speech, and Signal Processing, 36:1169–1179, 1988. 69
J. Daugman. The importance of being random: Statistical principles of iris recognition. Pattern
Recognition, 36(2):279291, 2003. 164, 184
J. Daugman. How iris recognition works. IEEE Transactions on Circuits and Systems for Video
Technology, 14:21–30, 2004. 79
R. Derakhshani, S. Schuckers, L. Hornak, and L. O’Gorman. Determination of vitality from a non-
invasive biomedical measurement for use in fingerprint scanners. Pattern Recognition, 36:383–396,
2003. 61
G. Dimauro, S. Impedovo, M. Lucchese, R. Modugno, and G. Pirlo. Recent advancements in automatic
signature verification. Proc. Intl. Workshop on Frontiers in Handwritting Recognition, IWFHR, pages
179–184, 2004. 97
S. Djeziri, F. Nouboud, and R. Plamondon. Extraction of signatures from check background based on
a filiformity criterion. IEEE Transactions on Image Processing, 7(10):1425–1438, 1998. 97
DoD. Biometrics Management Office, Department of Defense - www.biometrics.dod.mil, 2007. 2, 166
R. Duda, P. Hart, and D. Stork. Pattern Classification - 2nd Edition. 2004. 7, 8, 17, 137, 138, 146,
148, 164, 169, 174, 183
EBF. European Biometrics Forum - www.eurobiometricforum.com, 2003. 2, 166
M. Fairhurst. Signature verification revisited: promoting practical exploitation of biometric technology.
Electronics and Communication Engineering Journal, 9:273–280, December 1997. 93
M. Fairhurst and E. Kaplani. Perceptual analysis of handwritten signatures for biometric authentica-
tion. IEE Proc. Vis. Image Signal Process, 150:389–394, 2003. 101, 104
B. Fang, Y. Wang, C. Leung, Y. Tang, P. Kwok, K. Tse, and Y. Wong. A smoothness index based
approach for off-line signature verification. Proc. Intl. Conference on Document Analysis and Recog-
nition, ICDAR, pages 785–787, 1999. 95, 99, 100
FBI Biometric Specifications (BioSpecs). http://www.fbibiospecs.org. 44
190

REFERENCES
L. Ferrer, M. Graciarena, A. Zymnis, and E. Shriberg. System combination using auxiliary informa-
tion for speaker verification. Proc. IEEE International Conference on Acoustics, Speech and Signal
Processing, ICASSP, Las Vegas, Nevada, March 2008. 138
M. Ferrer, J. Alonso, and C. Travieso. Offline geometric parameters for automatic signature verification
using fixed-point arithmetic. IEEE Trans. on Pattern Analysis and Machine Intelligence, 27:993–997,
2005. 98
J. Fierrez, J. Ortega-Garcia, D. Torre-Toledano, and J. Gonzalez-Rodriguez. BioSec baseline corpus:
A multimodal biometric database. Pattern Recognition, 40(4):1389–1392, April 2007. 49, 81, 179
J. Fierrez-Aguilar. Adapted Fusion Schemes for Multimodal Biometric Authentication. PhD thesis,
Universidad Politecnica de Madrid, 2006. 7, 169
J. Fierrez-Aguilar, N. Alonso-Hermira, G. Moreno-Marquez, and J. Ortega-Garcia. An off-line signature
verification system based on fusion of local and global information. Proc. Workshop on Biometric
Authentication, BIOAW, Springer LNCS-3087:295–306, 2004. 96, 99, 100, 101, 107, 114, 117, 181
J. Fierrez-Aguilar, Y. Chen, J. Ortega-Garcia, and A. Jain. Incorporating image quality in multi-
algorithm fingerprint verification. Proc. International Conference on Biometrics, ICB, Springer
LNCS-3832:213–220, 2006. 10, 13, 14, 41, 60, 64, 163, 171, 172, 173, 184
J. Fierrez-Aguilar, D. Garcia-Romero, J. Ortega-Garcia, and J. Gonzalez-Rodriguez. Adapted user-
dependent multimodal biometric authentication exploiting general information. Pattern Recognition
Letters, 26:2628–2639, 2005a. 8, 170
J. Fierrez-Aguilar, L. Munoz-Serrano, F. Alonso-Fernandez, and J. Ortega-Garcia. On the effects of
image quality degradation on minutiae- and ridge-based automatic fingerprint recognition. Proc.
IEEE Intl. Carnahan Conf. on Security Technology, ICCST, pages 79–82, 2005b. 18, 36, 50, 59, 79,
174, 178, 179
J. Fierrez-Aguilar, L. Nanni, J. Ortega-Garcia, R. Capelli, and D. Maltoni. Combining multiple match-
ers for fingerprint verification: A case study in FVC2004. Proc. Int Conf on Image Analysis and
Processing, ICIAP, Springer LNCS-3617:1035–1042, 2005c. 60, 136
J. Fierrez-Aguilar, J. Ortega-Garcia, and J. Gonzalez-Rodriguez. Target dependent score normaliza-
tion techniques and their application to signature verification. IEEE Trans. on Systems, Man and
Cybernetics-Part C, 35(3), 2005d. 13, 104, 113, 172
J. Fierrez-Aguilar, J. Ortega-Garcia, J. Gonzalez-Rodriguez, and J. Bigun. Discriminative multimodal
biometric authentication based on quality measures. Pattern Recognition, 38(5):777–779, 2005e. 8,
10, 14, 41, 64, 141, 154, 170, 171, 173
FpVTE. Fingerprint Vendor Technology Evaluation - http://fpvte.nist.gov. 2003. 2, 166
H. Fronthaler, K. Kollreider, and J. Bigun. Automatic image quality assessment with application in
biometrics. Proc. IEEE Workshop on Biometrics, in Association with CVPR, pages 30–35, 2006.
56, 66, 68
191

REFERENCES
H. Fronthaler, K. Kollreider, J. Bigun, J. Fierrez, F. Alonso-Fernandez, J. Ortega-Garcia, and
J. Gonzalez-Rodriguez. Fingerprint image quality estimation and its application to multi-algorithm
verification. IEEE Trans. on Information Forensics and Security, 3(2):331–338, June 2008. 9, 10,
19, 40, 41, 163, 170, 171, 175, 184
FRVT. Face Recognition Vendor Test - http://www.frvt.org. 2006. 2, 10, 166
FVC2006. Fingerprint Verification Competition - http://bias.csr.unibo.it/fvc2006/default.asp. 2006.
2, 10, 166
J. Galbally, J. Fierrez, J. Ortega-Garcia, M. Freire, F. Alonso-Fernandez, J. Siguenza, J. Garrido-Salas,
E. Anguiano-Rey, G. Gonzalez-de-Rivera, R. Ribalda, M. Faundez-Zanuy, J. Ortega, V. Cardeoso-
Payo, A. Viloria, C. Vivaracho, Q. Moro, J. Igarza, J. Sanchez, I. Hernaez, and C. Orrite-Uruuela.
BiosecurID: a Multimodal Biometric Database. Proc. MADRINET Workshop, pages 68–76, Novem-
ber 2007. 20, 175
J. Galbally-Herrero, J. Fierrez-Aguilar, J. Rodriguez-Gonzalez, F. Alonso-Fernandez, J. Ortega-Garcia,
and M. Tapiador. On the vulnerability of fingerprint verification systems to fake fingerprint attacks.
Proc. IEEE Intl. Carnahan Conf. on Security Technology, ICCST, 2006. 19, 61, 176
D. Garcia-Romero, J. Fierrez-Aguilar, J. Gonzalez-Rodriguez, and J. Ortega-Garcia. Support vector
machine fusion of idiolectal and acoustic speaker information in spanish conversational speech. IEEE
Proc. Int. Conf. on Acoustics, Speech and Signal Processing ICASSP, 2:229–232, 2003. 8, 170
D. Garcia-Romero, J. Fierrez-Aguilar, J. Gonzalez-Rodriguez, and J. Ortega-Garcia. Using quality
measures for multilevel speaker recognition. Computer Speech and Language, 20:192–209, 2006. 8,
10, 13, 32, 41, 163, 170, 171, 172, 184
S. Garcia-Salicetti, J. Fierrez-Aguilar, F. Alonso-Fernandez, C. Vielhauer, R. Guest, L. Allano, T. Doan
Trung, T. Scheidat, B. Ly Van, J. Dittmann, B. Dorizzi, J. Ortega-Garcia, J. Gonzalez-Rodriguez,
M. B. di Castiglione, and M. Fairhurst. Biosecure reference systems for on-line signature verification:
A study of complementarity. Annals of Telecommunications, 62(1-2):36–61, January-February 2007.
19, 111, 176
S. Garcia-Salicetti, N. Houmani, B. Ly-Van, B. Dorizzi, F. Alonso-Fernandez, J. Fierrez, J. Ortega-
Garcia, C. Vielhauer, and T. Scheidat. Guide to Biometric Reference Systems and Performance
Evaluation, chapter Online Handwritten Signature Verification. Springer-Verlag, London, 2008. 18,
19, 175, 176
A. Gilperez, F. Alonso-Fernandez, S. Pecharroman, J. Fierrez, and J. Ortega-Garcia. Off-line sig-
nature verification using contour features. International Conference on Frontiers in Handwriting
Recognition, ICFHR (submitted), 2008. 17, 18, 94, 119, 174, 175, 180, 181
R. Gonzalez and R. Woods. Digital Image Processing. Addison-Wesley, 2002. 17, 95, 114, 119, 174
J. Gonzalez-Rodriguez and D. Ramos. Speaker Classification Collection, Volume 1: Fundamentals, Fea-
tures and Methods, volume Springer LNCS-4343, chapter Forensic Automatic Speaker Classification
in the Coming Paradigm Shift. Springer, 2007. 138
192

REFERENCES
J. Gonzalez-Rodriguez, P. Rose, D. Ramos, D. Toledano, and J. Ortega-Garcia. Emulating DNA:
Rigorous quantification of evidential weight in transparent and testable forensic speaker recognition.
IEEE Trans. on Audio, Speech and Language Processing, 15(7):2104–2115, 2007. 138
P. Grother, M. McCabe, C. Watson, M. Indovina, W. Salamon, P. Flanagan, E. Tabassi, E. Newton,
and C. Wilson. MINEX - Performance and interoperability of the INCITS 378 fingerprint template.
NISTIR 7296 - http://fingerprint.nist.gov/minex, 2005. 9, 13, 46, 61, 64, 171, 172
P. Grother and E. Tabassi. Performance of biometric quality measures. IEEE Trans. on Pattern
Analysis and Machine Intelligence, 29:531–543, 2007. 8, 9, 12, 13, 14, 21, 24, 32, 33, 34, 35, 36, 37,
45, 46, 85, 154, 157, 163, 170, 172, 173, 177
R. Guest. The repeatability of signatures. Proc. Intl. Workshop on Frontiers in Handwritting Recog-
nition, IWFHR, 2004. 102
J. Guo, D. Doermann, and A. Rosenfeld. Local correspondence for detecting random forgeries. Proc.
Intl. Conference on Document Analysis and Recognition, ICDAR, pages 319–323, 1997. 99, 101
I. Guyon, J. Makhoul, R. Schwartz, and V. Vapnik. What size test set gives good error rate estimates?
IEEE Trans. on Pattern Analysis and Machine Intelligence, 20:52–64, 1998. 12
L. Hong, Y. Wan, and A. Jain. Fingerprint imagen enhancement: Algorithm and performance evalua-
tion. IEEE Trans. on Pattern Analysis and Machine Intelligence, 20(8):777–789, August 1998. 54,
62, 66, 72, 73, 164, 178, 184
W. Hou, X. Ye, and K. Wang. A survey of off-line signature verification. Proc. Intl. Conf. on Intelligent
Mechatronics and Automation, pages 536–541, 2004. 97, 102
K. Huang and H. Yan. Off-line signature verification based on geometric feature extraction and neural
network classification. Pattern Recognition, 30(1):9–19, 1997. 99, 100
K. Huang and H. Yan. Off-line signature verification using structural feature correspondences. Pattern
Recognition, 35:2467–2477, 2002. 101
IBG. International Biometric Group - www.biometricgroup.com, 2007. 2, 49, 166
ICB. Proc. 2nd International Conference on Biometrics, ICB, Seoul, Korea, 27-29 August 2007,
Springer LNCS-4642, 2007. 2, 165
ICBA. Proc. 1st International Conference on Biometric Authentication, ICBA, Hong Kong, China,
15-17 July 2004, Springer LNCS-3072, 2004. 2, 165
ICE. Iris Challenge Evaluation - http://iris.nist.gov/ice. 2006. 2, 10, 166
INCITS M1. InterNational Committee for Information Technology Standards - Technical Committee
M1 - Biometrics (INCITS M1) - http://m1.incits.org/, 2007. 2, 43, 166
International Biometric Industry Association (IBIA). CBEFF (Common Biometric Exchange Formats
Framework) registry. http://www.ibia.org. 45
193

REFERENCES
ISO/IEC JTC1 SC37. ISO/IEC JTC1 on Information technology, SC37 on Biometrics -
www.jtc1.org/sc37, 2002. 2, 43, 166
A. Jain, R. Bolle, and S. Pankanti, editors. Biometrics - Personal Identification in Networked Society.
Kluwer Academic Publishers, 1999. 2, 165
A. Jain, Y. Chen, and M. Demirkus. Pores and ridges: High resolution fingerprint matching using level
3 features. IEEE Trans. on Pattern Analysis and Machine Intelligence, 29(1):15–27, January 2007.
61
A. Jain, R. Duin, and J. Mao. Statistical pattern recognition: A review. IEEE Transactions on Pattern
Analysis and Machine Intelligence, 22(1):4–37, 2000. 3, 17
A. Jain, P. Flynn, and A. Ross, editors. Handbook of Biometrics. Springer, 2008. 2, 3, 17, 28, 46, 165,
174
A. Jain, L. Hong, and R. Bolle. On-line fingerprint verification. IEEE Trans. on Pattern Analysis and
Machine Intelligence, 19(4):302–314, April 1997a. xviii, 58
A. Jain, K. Nandakumar, and A. Ross. Score normalization in multimodal biometric systems. Pattern
Recognition, 38(12):2270–2285, December 2005. 8, 122, 137, 146, 169
A. Jain, S. Pankanti, S. Prabhakar, L. Hong, A. Ross, and J. L. Wayman. Biometrics: A grand
challenge. Proc. Intl. Conf. on Pattern Recognition, ICPR, 2:935–942, 2004a. 166
A. Jain and A. Ross. Multibiometric systems. Communications of the ACM, 47(1):34–40, January
2004. 17
A. Jain, A. Ross, and S. Pankanti. Biometrics: A tool for information security. IEEE Trans. on
Information Forensics and Security, 1:125–143, 2006. 1, 2, 4, 14, 17, 49, 165, 167
A. Jain, A. Ross, and S. Prabhakar. An introduction to biometric recognition. IEEE Transactions on
Circuits and Systems for Video Technology, 14(1):4–20, January 2004b. 2, 5, 17, 93
A. K. Jain, L. Hong, S. Pankanti, and R. Bolle. An identity authentication system using fingerprints.
Proc. IEEE, 85(9):1365–1388, September 1997b. 55
X. Jiang, W. Yau, and W. Ser. Detecting the fingerprint minutiae by adaptive tracing the gray-level
ridge. Pattern Recognition, 34:999–1013, 2001. 56
S. Joun, H. Kim, Y. Chung, and D. Ahn. An experimental study on measuring image quality of infant
fingerprints. Proc. Intl. Conf. Knowledge-Based Intelligent Information and Engineering Systems,
Springer LNCS-2774:1261–1269, 2003. 62, 66, 71
E. Justino, F. Bortolozzi, and R. Sabourin. Off-line signature verification using HMM for random,
simple and skilled forgeries. Proc. Intl. Conf. on Document Analysis and Recognition, ICDAR,
pages 1031–1034, 2001. 95, 117, 181
E. Justino, F. Bortolozzi, and R. Sabourin. A comparison of SVM and HMM classifiers in the off-line
signature verification. Pattern Recognition Letters, 26:1377–1385, 2005. 100
194
REFERENCES
E. Justino, A. Yacoubi, F. Bortolozzi, and R. Sabourin. An off-line signature verification using Hidden
Markov Models and cross-validation. Proc. XIII Brazilian Symposium on Computer Graphics and
Image Processing, SIBGRAPI, pages 105–112, 2000. 98, 100
N. Kalka, V. Dorairaj, Y. Shah, N. Schmid, and B. Cukic. Image quality assessment for iris biometric.
Proceedings of Biometric Symposium, Biometric Consortium Conference, Arlington, VA (USA),
2005. 8, 32, 163, 170, 184
T. Kanade. Picture Processing System by Computer Complex and Recognition of Human Faces. PhD
thesis, Kyoto University, 1973. 1, 10, 165
H. Kang, B. Lee, H. Kim, D. Shin, and J. Kim. A study on performance evaluation of fingerprint sen-
sors. Proc. International Conference on Audio- and Video-Based Biometric Person Authentication,
AVBPA, Springer LNCS-2688:574–583, 2003. 9, 13, 171, 172
A. Kholmatov and B. Yanikoglu. An individuality model for online signatures. Defense and Security
Symposium, Biometric Technologies for Human Identification, BTHI, Proc. SPIE, 6944:6944071–
69440712, 2008. 164, 184
J. Kittler, M. Hatef, R. Duin, and J. Matas. On combining classifiers. IEEE Trans. on Pattern Analysis
and Machine Intelligence, 20(3):226–239, March 1998. 8, 60, 146, 169
H. Knutsson. Filtering and reconstruction in image processing. PhD thesis, Linkoping University, 1982.
53, 69
T. Ko and R. Krishnan. Monitoring and reporting of fingerprint image quality and match accuracy for
a large user application. Proc. 33rd Applied Image Pattern Recognition Workshop, pages 159–164,
2004. 9, 31, 40, 41, 164, 170, 177, 184
Z. Kovacs-Vajna, R. Rovatti, and M. Frazzoni. Fingerprint ridge distance computation methodologies.
Pattern Recognition, 33:69–80, 2000. 54
K. Kryszczuk. Improving biometrics verification with class-independent quality information.
Proc. NIST Biometric Quality Workshop, Gaithersburg, MD, USA, November 7-8, 2007 -
http://www.itl.nist.gov/iad/894.03/quality/workshop07/index.html, 2007. 136
K. Kryszczuk and A. Drygajlo. Improving classification with class-independent quality measures:
Qstack in face verification. Proc. International Conference on Biometrics, ICB, Springer LNCS-
4642:1124–1133, 2007. 8, 32, 163, 170, 184
K. Kryszczuk and A. Drygajlo. Credence estimation and error prediction in biometric identity verifi-
cation. Signal Processing, 88:916–925, 2008. 10, 41, 171
F. Leclerc and R. Plamondon. Automatic signature verification: The state of the art. International
Journal of Pattern Recognition and Artificial Intelligence, 8(3):643–660, 1994. 97
L. Lee and M. Lizarraga. An off-line method for human signature verification. In Proc. of the Intl.
Conf. on Pattern Recognition, ICPR, page 195198, 1996. 96, 98, 99, 100, 114, 117, 181
195
REFERENCES
S. Lee and J. Pan. Off-line tracing and representation of signatures. IEEE Transactions on Systems,
Man and Cybernetics, 22(4):755–771, 1992. 95, 97, 99
S. Li and A. Jain, editors. Handbook of Face Recognition. Springer Verlag, 2004. 2, 165
E. Lim, X. Jiang, and W. Yau. Fingerprint quality and validity analysis. Proc. International Conference
on Image Processing, ICIP, 1:469–472, 2002. 66, 67, 74, 82
E. Lim, K. Toh, P. Suganthan, X. Jiang, and W. Yau. Fingerprint image quality analysis. Proc.
International Conference on Image Processing, ICIP, pages 1241–1244, 2004. 66, 67, 71, 73
J. Liu, Z. Huang, and K. Chan. Direct minutiae extraction from gray-level fingerprint image by
relationship examination. Proc. Int. Conf. on Image Processing, 2:427–300, 2000. 56
D. Maio and D. Maltoni. Direct gray-scale minutiae detection in fingerprints. IEEE Trans. on Pattern
Analysis and Machine Inteligence, 19(1):27–40, January 1997. 55, 56
D. Maio and D. Maltoni. Ridge-line density estimation in digital images. Proc. Int. Conf. on Pattern
Recognition, pages 534–538, 1998. 54
D. Maio, D. Maltoni, R. Capelli, J. Wayman, and A. Jain. FVC2000: Fingerprint verification com-
petition. IEEE Trans. on Pattern Analysis and Machine Intelligence, 24(3):402–412, March 2002.
12
D. Maltoni, D. Maio, A. Jain, and S. Prabhakar. Handbook of Fingerprint Recognition. Springer, New
York, 2003. ISBN 0-387-95431-7. 2, 5, 49, 51, 53, 54, 56, 58, 59, 60, 61, 74, 88, 165
A. Mansfield and J. Wayman. Best Practices in Testing and Reporting Performance of Biometric
Devices, v 2.01 - http://www.cesg.gov.uk/site/ast/biometrics/media/BestPractice.pdf, 2002. 2, 10,
166
T. Mansfield. The application of quality scores in biometric recognition. Proc.
NIST Biometric Quality Workshop, Gaithersburg, MD, USA, November 7-8, 2007 -
http://www.itl.nist.gov/iad/894.03/quality/workshop07/index.html, 2007. 33
G. Marcialis and F. Roli. Fingerprint verification by fusion of optical and capacitive sensors. Pattern
Recognition Letters, 25:1315–1322, 2004. 60
G. Marcialis and F. Roli. Fusion of multiple fingerprint matchers by single-layer perceptron with
class-separation loss function. Pattern Recognition Letters, 26:1830–1839, 2005. 60
A. Martin, G. Doddington, T. Kamm, M. Ordowski, and M. Przybocki. The DET curve in assessment
of decision task performance. In Proc. EuroSpeech, 1997. 11, 36, 139, 171
A. Martinez and A. Kak. PCA versus LDA. IEEE Trans. on Pattern Analysis and Machine Intelligence,
23(2):228–233, 2001. 141, 143, 182
L. Martinez, C. Travieso, J. Alonso, and M. Ferrer. Parameterization of a forgery handwritten signature
verification system using SVM. Proc. IEEE Intl. Carnahan Conf. on Security Technology, ICCST,
pages 193–196, 2004. 100
196

REFERENCES
M. Martinez-Diaz. Off-line signature verification: State of the art overview. Technical report, Escuela
Politecnica Superior, Universidad Autonoma de Madrid, 2007. 95
M. Martinez-Diaz, J. Fierrez, J. Galbally, F. Alonso-Fernandez, and J. Ortega-Garcia. Signature
verification on handheld devices. Proc. MADRINET Workshop,Salamanca, Spain, pages 87–95,
November 2007. 19, 175, 176
M. Martinez-Diaz, J. Fierrez-Aguilar, F. Alonso-Fernandez, J. Ortega-Garcia, and J. Siguenza. Hill-
climbing and brute-force attacks on biometric systems: A case study in match-on-card fingerprint
verification. Proc. IEEE Intl. Carnahan Conf. on Security Technology, ICCST, 2006. 19, 61, 176
T. Matsumoto, H. Matsumoto, K. Yamada, and S. Hoshino. Impact of artificial gummy fingers on
fingerprint systems. Proc. of SPIE, Optical Security and Counterfeit Deterrence Techniques IV,
4677:275–289, 2002. 61
B. Mehtre. Fingerprint image analysis for automatic identification. Machine Vision and Applications,
6:124–139, 1993. 55
G. Moreno-Marquez. Sistema de reconocimiento de firma escrita off-line basado en modelos ocultos de
markov. Master’s thesis, EUITT, Universidad Politecnica de Madrid, 2003. xxi, xxii, 97, 98, 115,
116, 117
S. Muller and O. Henniger. Evaluating the biometric sample quality of handwritten signatures. Proc.
International Conference on Biometrics, ICB, Springer LNCS-4642:407–414, 2007. 8, 13, 32, 102,
170, 172, 180
L.-M. Munoz-Serrano. Sistema automtico de reconocimiento de huella dactilar basado en informacin
de textura. Master’s thesis, ETSIT, Universidad Politecnica de Madrid, 2004. xviii, xx, 59, 79
N. Murshed, F. Bortolozzi, and R. Sabourin. Off-line signature verification using fuzzy artmap neural
network. Proc. International Conference on Neural Networks, 4:2179–2184, 1995. 96, 100
R. Nagel and A. Rosenfeld. Computer detection of freehand forgeries. IEEE Transactions on Comput-
ers, C-26(9):895–905, 1977. 100
S. Nanavati, M. Thieme, and R. Nanavati, editors. Biometrics: Identity Verification in a Networked
World. Wiley, 2002. 2, 165
K. Nandakumar, Y. Chen, A. Jain, and S. Dass. Quality-based score level fusion in multibiometric
system. Proc. Intl. Conf. on Pattern Recognition, ICPR, 4:473–476, 2006. 10, 14, 41, 64, 164, 171,
173, 184
K. Nilsson. Symmetry filters applied to fingerprints. PhD thesis, Chalmers University of Technology,
Sweden, 2005. 55
NIST-BQH. NIST Biometric Quality Homepage - http://www.itl.nist.gov/ iad/ 894.03/ quality/ in-
dex.html, 2007. 32
NIST-ITL. The Biometrics Resource Center - Information Technology Laboratory - National Institute
of Standards and Technology - www.itl.nist.gov/div893/biometrics/, 2007. 2, 43, 166
197

REFERENCES
NIST SRE. NIST Speaker Recognition Evaluation - http://www.nist.gov/speech/tests/spk/index.htm.
2006. 2, 10, 166
J. Ortega-Garcia and F. Alonso-Fernandez. A software tool for the acquisition of the new missing
modalities. Technical report, FP6 IST-2002-507634, BioSecure NoE Deliverable D.1.1.2., July 2005a.
20
J. Ortega-Garcia and F. Alonso-Fernandez. Toolset for controlled degradation of databases. Technical
report, FP6 IST-2002-507634, BioSecure NoE Deliverable D.1.1.3., July 2005b. 20
J. Ortega-Garcia, F. Alonso-Fernandez, and J. Fierrez-Aguilar. Legal requirements in multimodal
database design, acquisition and usage. Technical report, FP6 IST-2002-507634, BioSecure NoE
Deliverable D.6.1.1., June 2006a. 20
J. Ortega-Garcia, F. Alonso-Fernandez, and J. Fierrez-Aguilar. Recommendations for the design and
settings of the biosecure application-oriented multimodal biometric database. Technical report, FP6
IST-2002-507634, BioSecure NoE Deliverable D.1.1.4., January 2006b. 20
J. Ortega-Garcia, F. Alonso-Fernandez, and J. Fierrez-Aguilar. Software tool and acquisition equip-
ment recommendationis for the three scenarios considered. Technical report, FP6 IST-2002-507634,
BioSecure NoE Deliverable D.6.2.1., June 2006c. 20
J. Ortega-Garcia, F. Alonso-Fernandez, J. Fierrez-Aguilar, J. Alba-Castro, C. Garcia-Mateo, L. Allano,
A. Mayoue, and B. Dorizzi. Biosecure application oriented multimodal biometric database. Technical
report, FP6 IST-2002-507634, BioSecure NoE Deliverable D.6.3.1., July 2007. 20
J. Ortega-Garcia, F. Alonso-Fernandez, D. Petrovska, E. Krichen, J. Hennebert, and B. Ben Amor.
Additional databases complementing the existing biometric databases. Technical report, FP6 IST-
2002-507634, BioSecure NoE Deliverable D.1.1.5., January 2006d. 20
J. Ortega-Garcia, J. Bigun, D. Reynolds, and J. Gonzalez-Rodriguez. Authentication gets personal
with biometrics. IEEE Signal Processing Magazine, 21:50–62, 2004. 11
J. Ortega-Garcia, J. Fierrez-Aguilar, J. Martin-Rello, and J. Gonzalez-Rodriguez. Complete signal
modelling and score normalization for function-based dynamic signature verification. Proc. Interna-
tional Conference on Audio- and Video-Based Biometric Person Authentication, AVBPA, Springer
LNCS-2688:658–667, 2003a. 117
J. Ortega-Garcia, J. Fierrez-Aguilar, D. Simon, J. Gonzalez, M. Faundez-Zanuy, V. Espinosa, A. Satue,
I. Hernaez, J. Igarza, C. Vivaracho, D. Escudero, and Q. Moro. MCYT baseline corpus: a bimodal
biometric database. IEE Proceedings on Vision, Image and Signal Processing, 150(6):395–401, De-
cember 2003b. 111, 181
N. Otsu. A threshold selection method for gray-level histograms. IEEE Trans. on Systems, Man and
Cibernetics, 9:62–66, December 1979. 71, 95, 106, 111, 114
B. Paltridge. Thesis and dissertation writing: an examination of published advice and actual practice.
English for specific purposes, 21:125–143, 2002. 15
198

REFERENCES
J. Pan and S. Lee. Off-line tracing and representation of signatures. IEEE Computer Society Conference
on Computer Vision and Pattern Recognition, pages 679–680, 1991. 99
A. Papoulis. Probability, Random Variables, and Stochastic Processes. McGraw-Hill Co., 1984. 12, 85
S. Pecharroman-Balbas. Identificacin de escritor independiente de texto basada en caractersticas alo-
grficas y de textura. Master’s thesis, EPS, Universidad Autonoma de Madrid, 2007. 17, 94, 119,
174
S. Pigeon, P. Druyts, and P. Verlinde. Applying logistic regression to the fusion of the nist’99 1-speaker
submissions. Digital Signal Processing, 10:237–248, 2000. 135, 138, 139, 182
R. Plamondon and G. Lorette. Automatic signature verification and writer identification - the state of
the art. Pattern Recognition, 22(2):107–131, 1989. 95, 97
R. Plamondon and S. Srihari. On-line and off-line handwriting recognition: A comprehensive survey.
IEEE Trans. on Pattern Analysis and Machine Intelligence, 22(1):63–84, 2000. 93, 94, 104
N. Poh and T. Bourlai. The Biosecure Desktop DS2 Evaluation Documentation.
http://biosecure.ee.surrey.ac.uk/, 2007. 135, 140, 147, 157, 160, 182
N. Poh, J. Kittler, and T. Bourlai. Improving biometric device interoperability by likelihood ratio-based
quality dependent score normalization. Proc. IEEE Conference on Biometrics: Theory, Applications
and Systems, BTAS, Washington DC (USA), 2007. 10, 13, 140, 141, 160, 164, 171, 172, 173
T. Putte and J. Keuning. Biometrical fingerprint recognition: dont get your fingers burned. Proc. IFIP
TC8/WG8.8, Fourth Working Conf. Smart Card Research and Adv. App., pages 289–303, 2000. 61
L. Rabiner. A tutorial on hidden markov models and selected applications in speech recognition.
Proceedings of the IEEE, 77:257–286, 1989. 100, 117
D. Ramos. Forensic Evaluation of the Evidence Using Automatic Speaker Recognition Systems. PhD
thesis, Depto. de Ingenieria Informatica, Escuela Politecnica Superior, Universidad Autonoma de
Madrid, Madrid, Spain, 2007. Available at http://atvs.ii.uam.es. 137, 138
N. Ratha and R. Bolle, editors. Automatic Fingerprint Recognition Systems. Springer-Verlag, New
York, 2004. ISBN 0-387-95593-3. 2, 65, 66, 70, 71, 165
N. Ratha, J. Connell, and R. Bolle. An analysis of minutiae matching strength. Proc. International
Conference on Audio- and Video-Based Biometric Person Authentication, AVBPA, Springer LNCS-
2091:223–228, 2001a. 61
N. Ratha, J. Connell, and R. Bolle. Enhancing security and privacy in biometrics-based authentication
systems. IBM Systems Journal, 40(3):614–634, 2001b. 61
J. Richiardi and A. Drygajlo. Evaluation of speech quality measures for the purpose of speaker ver-
ification. Proc. of Odyssey, The Speaker and Language Recognition Workshop, Stellenbosch, South
Africa, 2008. 8, 32, 170
199
REFERENCES
J. Richiardi, K. Kryszczuk, and A. Drygajlo. Quality measures in unimodal and multimodal biometric
verification. Proc. 15th European Conference on Signal Processing, EUSIPCO, Poznan, Poland,
2007. 8, 32, 170
G. Rigoll and A. Kosmala. A systematic comparison between on-line and off-line methods for signature
verification with Hidden Markov Models. Proc. International Conference on Pattern Recognition,
ICPR, 2:1755–1757, 1998. 95, 98, 100
A. Ross, P. Flynn, and A. Jain, editors. Handbook of Multibiometrics. Springer, 2006. 2, 6, 7, 8, 17,
41, 42, 154, 165, 168, 169, 174
A. Ross and A. Jain. Information fusion in biometrics. Pattern Recognition Letters, 24(13):2115–2125,
September 2003. 8, 170
A. Ross and A. Jain. Biometric sensor interoperability: A case study in fingerprints. Proc. Workshop
on Biometric Authentication, BIOAW, Springer LNCS-3087:134–145, May 2004. 13, 60, 61, 172
A. Ross, A. Jain, and J. Reisman. A hybrid fingerprint matcher. Pattern Recognition, 36(7):1661–1673,
July 2003. 60, 79
A. Ross, K. Reisman, and A. Jain. Fingerprint matching using feature space correlation. Proc. Work-
shop on Biometric Authentication, BIOAW, Springer LNCS-2359:48–57, 2002. 79, 80
V. Ruiz-Albacete, P. Tome-Gonzalez, F. Alonso-Fernandez, J. Galbally, J. Fierrez, and J. Ortega-
Garcia. Direct attacks using fake images in iris verification. COST 2101 Workshop on Biometrics
and Identity Management, BIOID, 2008. 19, 176
R. Sabourin. Off-line signature verification: Recent advantages and perspectives. Advances in Document
Image Analysis, Springer LNCS-1339:84–98, 1992. 97
R. Sabourin, M. Cheriet, and G. Genest. An extended-shadow-code based approach for off-line signature
verification. Proc. Intl. Conf. on Document Analysis and Recognition, ICDAR, 1993. 99, 100
R. Sabourin and J. Drouhard. Off-line signature verification using directional pdf and neural networks.
Proc. Intl. Conf. on Pattern Recognition, ICPR, 1992. 96, 98, 100
R. Sabourin, J. Drouhard, and E. Wak. Shape matrices as a mixed shape factor for off-line signature
verification. Proc. Intl. Conf. on Document Analysis and Recognition, ICDAR, 2:661–665, 1997. 98,
100
R. Sabourin, G. Genest, and F. Preteux. Pattern spectrum as a local shape factor for off-line signature
verification. Proc. Intl. Conf. on Pattern Recognition, ICPR, 3:43–48, 1996. 99
R. Sabourin and R. Plamondon. Segmentation of handwritten signature images using the statistics of
directional data. Proc. Intl. Conf. on Pattern Recognition, ICPR, pages 282–285, 1988. 96
R. Sabourin, R. Plamondon, and L. Beaumier. Structural interpretation of handwritten signature
images. International Journal of Pattern Recognition and Artificial Intelligence, 8(3):709–748, 1994.
99
200

REFERENCES
S. Schuckers, S. Parthasaradhi, R. Derakshani, and L. Hornak. Comparison of classification methods
for time-series detection of perspiration as a liveness test in fingerprint devices. Proc. International
Conference on Biometric Authentication, ICBA,, Springer LNCS-3072:256–263, 2004. 61
L. Shen, A. Kot, and W. Koo. Quality measures of fingerprint images. Proc. 3rd International Confer-
ence on Audio- and Video-Based Biometric Person Authentication, AVBPA, Springer LNCS-2091:
266–271, 2001. 55, 66, 69
Z. Shi, Y. Wang, J. Qi, and K. Xu. A new segmentation algorithm for low quality fingerprint image.
Proc. IEEE Intl. Conf. on Image and Graphics (ICIG), pages 314 – 317, 2004. 64, 66, 71, 164, 184
N. Sickler and S. Elliott. An evaluation of fingerprint image quality across an elderly population vis-a-
vis an 18-25 year old population. Proc. IEEE Intl. Carnahan Conf. on Security Technology, ICCST,
pages 68–73, 2005. 9, 13, 171, 172
D. Simon-Zorita. Reconocimiento automtico mediante patrones de huella dactilar. PhD thesis, Univer-
sidad Politecnica de Madrid, 2003. xvii, xviii, 54, 60, 63
D. Simon-Zorita, J. Ortega-Garcia, J. Fierrez-Aguilar, and J. Gonzalez-Rodriguez. Image quality and
position variability assessment in minutiae-based fingerprint verification. IEE Proceedings - Vis.
Image Signal Process., 150(6):402–408, December 2003. xviii, 56
R. Snelick, U. Uludag, A. Mink, M. Indovina, and A. Jain. Large-scale evaluation of multimodal bio-
metric authentication using state-of-the-art systems. IEEE Trans. on Pattern Analysis and Machine
Intelligence, 27(3):450–455, Mar 2005. 60
SPIE-BTHI. SPIE Biometric Technology for Human Identification V, BTHI, Orlando, FL, USA, 16 -
20 March 2008, 2008. 2, 166
SVC. Signature Verification Competition - http://www.cs.ust.hk/svc2004. 2004. 2, 10, 166
E. Tabassi and C. Wilson. A novel approach to fingerprint image quality. Proc. International Conference
on Image Processing, ICIP, 2:37–40, 2005. 36, 76
E. Tabassi, C. Wilson, and C. Watson. Fingerprint image quality. NIST research report NISTIR7151,
August 2004. 33, 76, 154
S. Theodoridis and K. Koutroumbas. Pattern Recognition. Academic Press, 2003. 17, 109, 116, 174
K. Toh, W. Yau, E. Lim, L. Chen, and C. Ng. Fusion of auxiliary information for multimodal biometrics
authentication. Proc. International Conference on Biometric Authentication, ICBA,, pages 678–685,
2004. 64
P. Tome-Gonzalez. Reconocimiento biomtrico de personas basado en imgenes del iris. Master’s thesis,
EPS, Universidad Autonoma de Madrid, 2008. 19, 175
P. Tome-Gonzalez, F. Alonso-Fernandez, and J. Ortega-Garcia. On the effects of time variability in
iris recognition. Proc. IEEE Conference on Biometrics: Theory, Applications and Systems, BTAS,
Washington DC (USA), 2008. 19
201

REFERENCES
U. Uludag and A. Jain. Attacks on biometric systems: a case study in fingerprints. Proc. SPIE-EI
2004, Security, Seganography and Watermarking of Multimedia Contents VI, pages 622–633, 2004.
61
U. Uludag, A. Ross, and A. Jain. Biometric template selection and update: a case study in fingerprints.
Pattern Recognition, 37:1533–1542, 2004. 31, 40, 164, 184
US-VISIT Program of the U.S. Department of Homeland Security. http://www.dhs.gov/us-visit. 46
D. Van der Weken, M. Nachtegael, and E. Kerre. Combining neighborhood-based and histogram
similarity measures for the design of image quality measures. Image and Vision Computing, 25:
184–195, 2007. 65
J. Vargas, M. Ferre, C. Travieso, and J. Alonso. Off-line signature verification system performance
against image acquisition resolution. Proceedings of International Conference on Document Analysis
and Recognition, ICDAR, 2:834–838, 2007. 102
R. Veldhuis, F. Alonso-Fernandez, A. Bazen, J. Fierrez, A. Franco, H. Fronthaler, K. Kollreider,
J. Ortega-Garcia, and H. Xu. Progress report on the jointly executed research carried out on
fingerprint modality. Technical report, FP6 IST-2002-507634, BioSecure NoE Deliverable D.7.3.3.,
July 2006. 20
R. Veldhuis, F. Alonso-Fernandez, A. Franco, R. Cappelli, H. Fronthaler, K. Kollreider, J. Bigun, and
H. Xu. Final report on the jointly executed research carried out on fingerprint modality. Technical
report, FP6 IST-2002-507634, BioSecure NoE Deliverable D.7.3.4., July 2007. 20
P. Verlinde and G. Chollet. Comparing decision fusion paradigms using k-nn based classifiers, decision
trees and logistic regression in multimodal identity verification application. Proc. International
Conference on Audio- and Video-Based Biometric Person Authentication, AVBPA, pages 188–193,
March 1999. 8, 170
Y. Wang, T. Tan, and A. Jain. Combining face and iris biometrics for identity verification. Proc.
International Conference on Audio- and Video-Based Biometric Person Authentication, AVBPA,
Springer LNCS-2688:805–813, June 2003. 8, 170
C. Watson, M. Garris, E. Tabassi, C. Wilson, R. McCabe, and S. Janet. User’s Guide to Fingerprint
Image Software 2 - NFIS2 (http://fingerprint.nist.gov/NFIS). NIST, 2004. 50, 66, 73, 77, 78, 83,
85, 141, 143, 179, 182
J. Wayman, A. Jain, D. Maltoni, and D. Maio, editors. Biometric Systems: Technology, Design and
Performance Evaluation. Springer, 2005. 2, 165, 166
C. Wilson, C. Watson, and E. Paek. Effect of resolution and image quality on combined optical and
neural network fingerprint matching. Pattern Recognition, 33:317–331, 2000. 65
M. Yao, S. Pankanti, and N. Haas. Automatic Fingerprint Recognition Systems, chapter 3. Fingerprint
Quality Assessment, pages 55–66. Springer-Verlag, New York, 2004. ISBN 0-387-95593-3. 62
202

REFERENCES
D. Yeung, H. Chang, Y. Xiong, S. George, R. Kashi, T. Matsumoto, and G. Rigoll. SVC2004: First
international signature verification competition. Proc. International Conference on Biometric Au-
thentication, ICBA, Springer LNCS-3072:15–17, July 2004. 104
R. Youmaran and A. Adler. Measuring biometric sample quality in terms of biometric information. Pro-
ceedings of Biometric Symposium, Biometric Consortium Conference, Baltimore, Maryland (USA),
2006. 13, 33, 163, 164, 172, 177, 184
D. Zhang, editor. Biometric Solutions for Authentication in an E-World. Kluwer Academic Publishers,
2002. 2, 165
203