
Biomes and Climate Sections 4.1, 4.4, and 4.5 in Text Begins Week 13 and Includes Art Project Dr....
30
Biomes and Climate Sections 4.1, 4.4, and 4.5 in Text Begins Week 13 and Includes Art Project Dr. Thornton OAPB Freshman Biology
-
Upload
juliana-joseph -
Category
Documents
-
view
216 -
download
0
Transcript of Biomes and Climate Sections 4.1, 4.4, and 4.5 in Text Begins Week 13 and Includes Art Project Dr....

Biomes and Climate
Sections 4.1, 4.4, and 4.5 in TextBegins Week 13 and Includes Art Project
Dr. ThorntonOAPB
Freshman Biology

Biomes(and their sub categories)
• Forest
• Grasslands
• Tundra
• Desert
• Marine
• Freshwater

Global Wind Patterns

Choose a Biome Picture for
Triptych Assignment
Week 13: Canvas

What else Affects Climate?

Factors that Influence Climate Variability in Florida
Phenomenon
PeriodicityEl Nino Southern Oscillation (ENSO)
3-7 years
Atlantic Multi-Decadal Oscillation (AMO)
55-70 years
Pacific Decadal Oscillation (PDO)
20-30 years
North Atlantic Oscillation/ Atlantic Oscillation (NAO/AO)
highly variable,
high
frequency
Short Term Solar eruptive activity
highly variable,
high frequency
11 - Year Solar Cycle
9-14 years
90 - Year Solar Cycle
80-90 years
200 - Year Solar Cycle
190-210 years
Shifts in the south Florida regional climate associated with Polar Jet streams

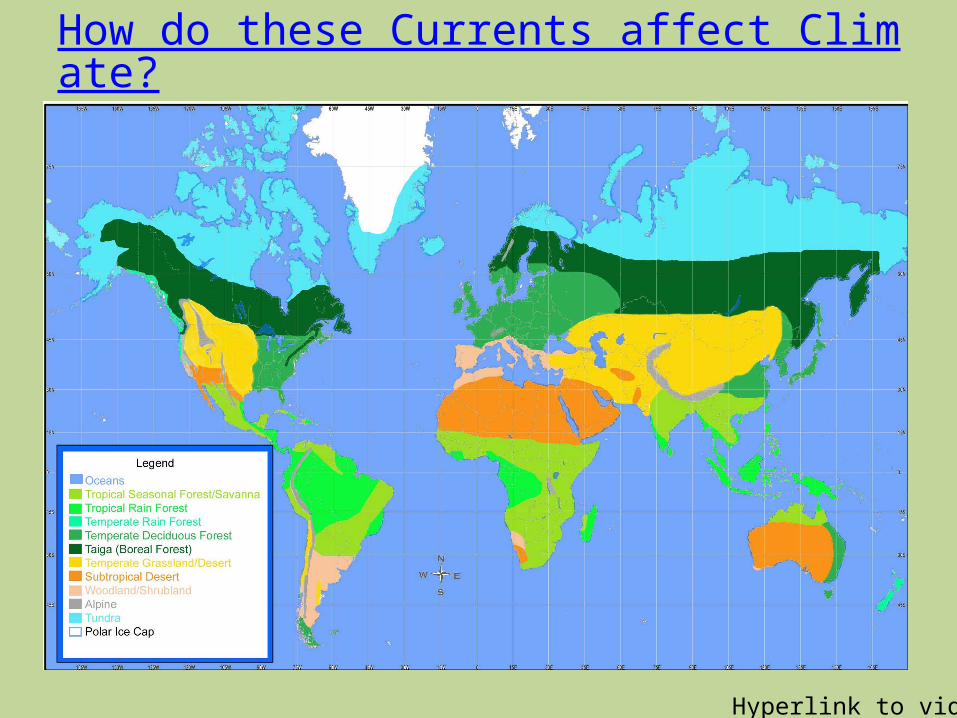
How does this relate to wet and dry climates?

La Niña
El Niño
Neutral
Usually, the wind blows strongly from east to west along the equator in the Pacific. This actually piles up water (about half a meter's worth) in the western part of the Pacific. In the eastern part, deeper water (which is colder than the sun-warmed surface water) gets pulled up from below to replace the water pushed west. So, the normal situation is warm water (about 30 C) in the west, cold (about 22 C) in the east.
The winds pushing that water around get weaker. As a result, some of the warm water piled up in the west slumps back down to the east, and not as much cold water gets pulled up from below. Both these tend to make the water in the eastern Pacific warmer, which is one of the hallmarks of an El Niño.The warmer ocean then affects the winds--it makes the winds weaker! So if the winds get weaker, then the ocean gets warmer, which makes the winds get weaker, which makes the ocean get warmer ... this is called a positive feedback, and is what makes an El Niño grow.
During La Niña years, the trade winds are unusually strong due to an enhanced pressure gradient between the eastern and western Pacific. As a result, upwelling is enhanced along the coast of South America, contributing to colder than normal surface waters over the eastern tropical Pacific and warmer than normal surface waters in the western tropical Pacific.
NASA.GOV

El Nino vs La Nina
http://www.appinsys.com/GlobalWarming/ENSO.htm

The Jet Stream and Climate(January-March)
In the winter Florida is typically wetter than normal during El Niño events and drier than normal during La Niña events
http://www.appinsys.com/GlobalWarming/ENSO.htm

Pacific Decadal Oscillation
Comparison of the Pacific Decadal Oscillation Warm phase and El Niño. The spatial pattern of anomalies in sea surface temperature (shading, degrees Celsius) and sea level pressure (contours) associated with the warm phase of PDO for the period 1900-1992.
Contour interval is 1 mb, with additional contours drawn for +0.25 and 0.5 mb. Positive (negative) contours are dashed (solid). Positive (warm) and Negative (cool) phases of the PDO,
Showing primary effects in the North Pacific and Secondary Effects in the Tropics.
The "Pacific Decadal Oscillation" (PDO) is a long-lived El Niño-like pattern of Pacific climate variability. While the two climate oscillations have similar spatial climate fingerprints, they have very different behavior in time.
THINK SPECIFIC HEAT!

Summary of Pacific and North American climate anomalies associated with extreme phases of the PDO.
Climate Anomalies Warm Phase PDO Cool Phase PDO
Ocean surface temperatures in the northeastern and tropical Pacific
Above average Below average
October-March northwestern North American air temperatures
Above average Below average
October-March Southeastern US air temperatures
Below average Above average
October-March southern US/Northern Mexico precipitation
Above average Below average
October-March Northwestern North America and Great Lakes
precipitation
Below average Above average
Northwestern North American spring time snow pack and water year
(October-September) stream flow
Below average Above average
Winter and spring time flood risk in the Pacific Northwest
Below average Above average
http://www.atmos.washington.edu/~mantua/REPORTS/PDO/PDO_egec.htm

Two main characteristics distinguish PDO from El Niño/Southern Oscillation (ENSO): • 20th century PDO "events" persisted for 20-to-30 years, while typical ENSO events persisted
for 6 to 18 months• the climatic fingerprints of the PDO are most visible in the North Pacific/North American
sector, while secondary signatures exist in the tropics - the opposite is true for ENSO.
Comparison of the Pacific Decadal Oscillation Warm phase and El Niño. The spatial pattern of anomalies in sea surface temperature (shading, degrees Celsius) and sea level pressure (contours) associated with the warm phase of PDO for the period 1900-1992.
Contour interval is 1 millibar (mb), with additional contours drawn for +0.25 and 0.5 mb. Positive (negative) contours are dashed (solid).
The spatial patterns are very similar: • anomalously warm sea surface
temperatures near the equator and
along the coast of North America
• anomalously cool sea surface
temperatures in the central North
Pacific.
(The cool phases for PDO and ENSO, which are not shown, have
the opposite patterns of SST anomalies: cool along the equator
and the coast of North America and warm in the central north
Pacific.)
Sea surface temperature (SST) anomalies that are associated with the warm phase of PDO.

Several independent studies find evidence for just two full PDO cycles in the past century:• "cool" PDO regimes prevailed from 1890-1924 and again from 1947-1976, • "warm" PDO regimes dominated from 1925-1946 and from 1977 through (at least) the
mid-1990's. • Shoshiro Minobe has shown that 20th century PDO fluctuations were most energetic in two
general periodicities, one from 15-to-25 years, and the other from 50-to-70 years.

Correlation Coefficient between US Climate Division Precipitation and Niño3 or PDO.
Correlation: Precipitation with Niño3 Correlation: Precipitation with PDO
November through AprilNovember through April

• Atmospheric (left)
• Sea Surface Temperature
Anomaly (right)
• Features of the North
Atlantic Oscillation during
the positive and negative
modes
Source: AIRMAP, University of New Hampshire.

http://www.appinsys.com/globalwarming/AO_NAO.htm

“Historical observations suggest that the very active hurricane seasons of 2004 and 2005 may be part of a natural cycle in Earth’s climate system that is related to changes in mean sea-surface temperature (SST) in
the North Atlantic Ocean.” -USGS
Comparison of land falling major hurricanes for the negative and positive phases of the AMO

DO
YO
U N
OTI
CE A
NY
PATT
ERN
S??
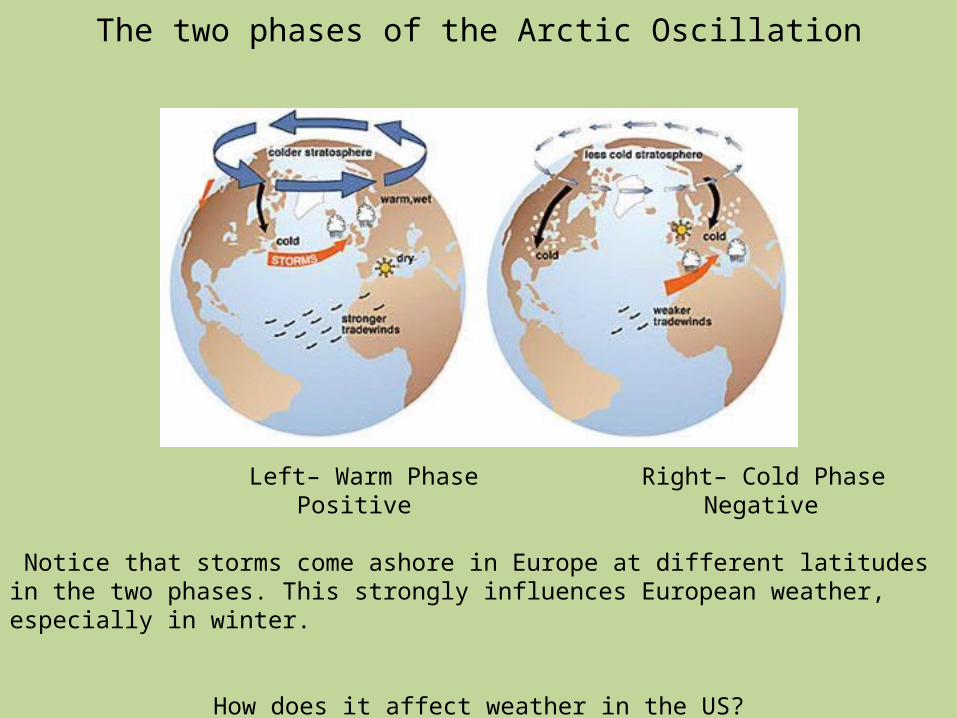
The two phases of the Arctic Oscillation
Left– Warm Phase Right– Cold Phase
Positive Negative
Notice that storms come ashore in Europe at different latitudes in the two phases. This strongly influences European weather, especially in winter.
How does it affect weather in the US?

+ -
Norm EL LA

Wind Patterns

Time series of the annual PDO and AMO. Shaded areas indicate combinations of positive (+) and negative (–) PDO and AMO periods.
McCabe G J et al. PNAS 2004;101:4136-4141
©2004 by National Academy of Sciences

Pacific Decadal and Atlantic Multi-Decadal Oscillations in Relation to Drought (absence of precipitation events)
http://www.appinsys.com/GlobalWarming/PDO_AMO.htm
Positive values are shaded red, and negative values are shaded blue. Darker shades indicate values >0.4 or <–0.4.

• Solar ultra-violet, visible and heat radiation are the primary factors for the Earth's climate, including global average temperatures, and these energy sources appear to be quite constant. (think wind movement and atmospheric water levels)
Solar Activity and Climate

Many scientists have observed correlations between the solar magnetic activity, which is reflected in the sunspot frequency,
and climate parameters at the Earth.
Solar Activity and Climate
(Reference: Friis-Christensen, E., and K. Lassen, Length of the solar cycle: An indicator of solar activity closely associated with climate, Science, 254, 698-700, 1991).

Solar Activity and Climate
The red curve illustrates the solar activity, which is generally increasing through an interval of 100 years, since the cycle length has decreased from around 11.5 years to less than 10 years.
Within the same interval the Earth's average temperature as indicated by the blue curve has increased by approximately 0.7 degree C.
Even the finer structures in the two curves have similar appearances.
(Reference: Friis-Christensen, E., and K. Lassen, Length of the solar cycle: An indicator of solar activity closely associated with climate, Science, 254, 698-700, 1991).
Sunspots has been recorded through several hundreds of years which makes it possible to compare their variable frequency to climate variations to the extent
that reliable climatological records exists.

What is meant by land-use changes and
green house gases?

Triptych Assignment
Biome Project in Canvas