
Biomedical Instrumentation - Yıldız Teknik Üniversitesinaydin/BmE/lectures/PDF/BmE_10.pdf ·...
5
12-May-11 1 Prof. Dr. Nizamettin AYDIN [email protected] [email protected] http://www.yildiz.edu.tr/~naydin Biomedical Instrumentation 1 Blood Pressure and Sound Figure 7.1 The left ventricle ejects blood into the systemic circulatory system. The right ventricle ejects blood into the pulmonary circulatory system. Figure 7.2 Typical values of circulatory pressures SP is the systolic pressure, DP the diastolic pressure, and MP the mean pressure. fig_07_03 Figure 7.3 Extravascular pressure- sensor system A catheter couples a flush solution (heparinized saline) through a disposable pressure sensor with an integral flush device to the sensing port. The three-way stopcock is used to take blood samples and zero the pressure sensor. Figure 7.4 (a) Schematic diagram of an intravascular fiber-optic pressure sensor. Pressure causes deflection in a thin metal membrane that modulates the coupling between the source and detector fibers, (b) Characteristic curve for the fiber- optic pressure sensor.
Transcript of Biomedical Instrumentation - Yıldız Teknik Üniversitesinaydin/BmE/lectures/PDF/BmE_10.pdf ·...
12-May-11
1
Prof. Dr. Nizamettin AYDIN
[email protected]://www.yildiz.edu.tr/~naydin
Biomedical Instrumentation
1
Blood Pressure and Sound
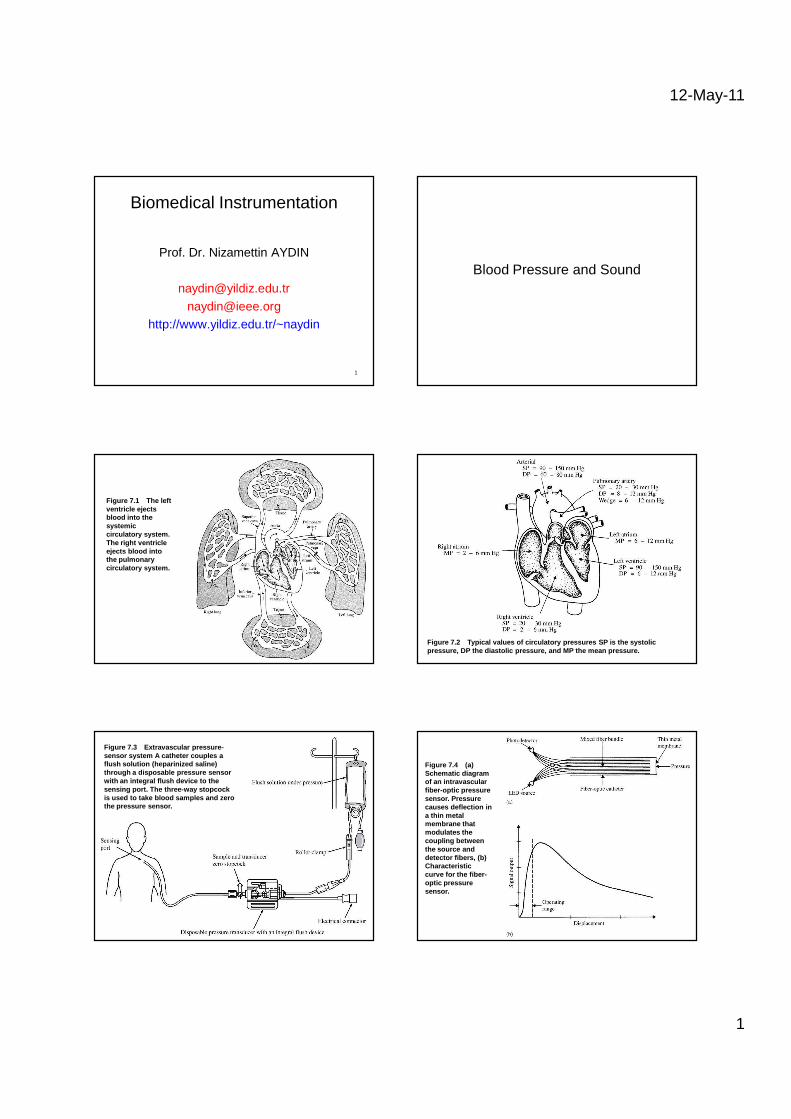
Figure 7.1 The left ventricle ejects blood into the systemic circulatory system. The right ventricle ejects blood into the pulmonary circulatory system.
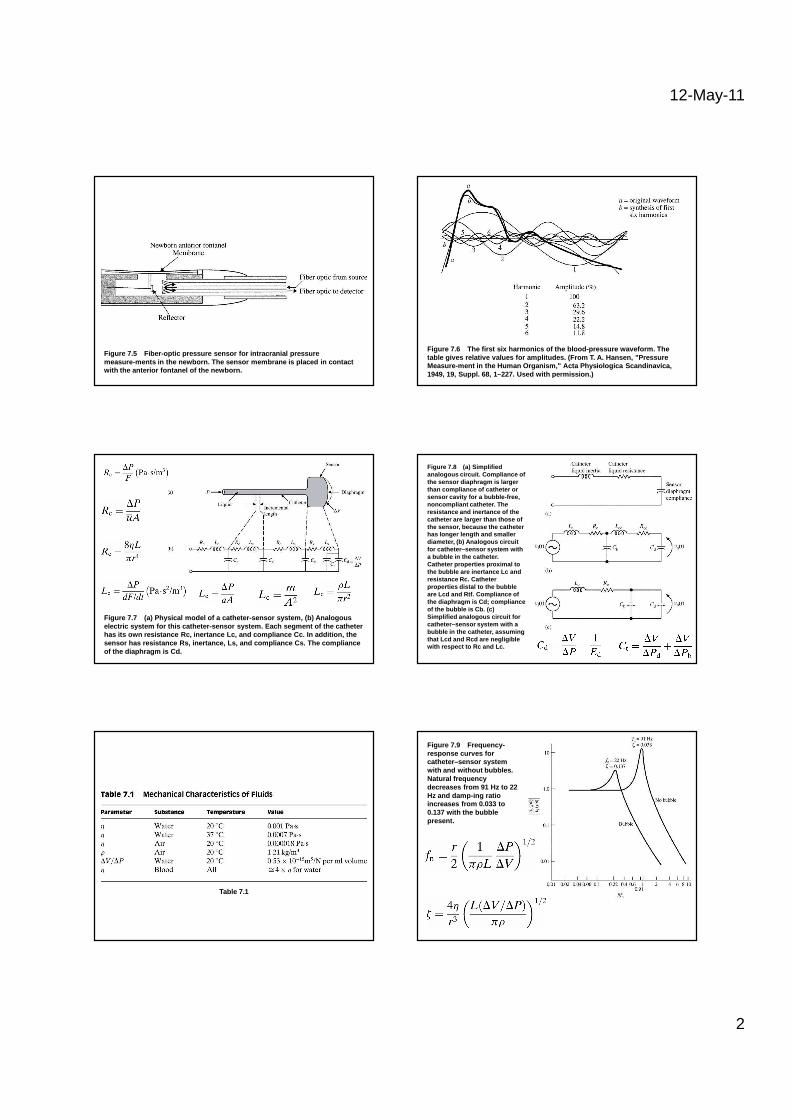
Figure 7.2 Typical values of circulatory pressures S P is the systolic pressure, DP the diastolic pressure, and MP the mea n pressure.
fig_07_03
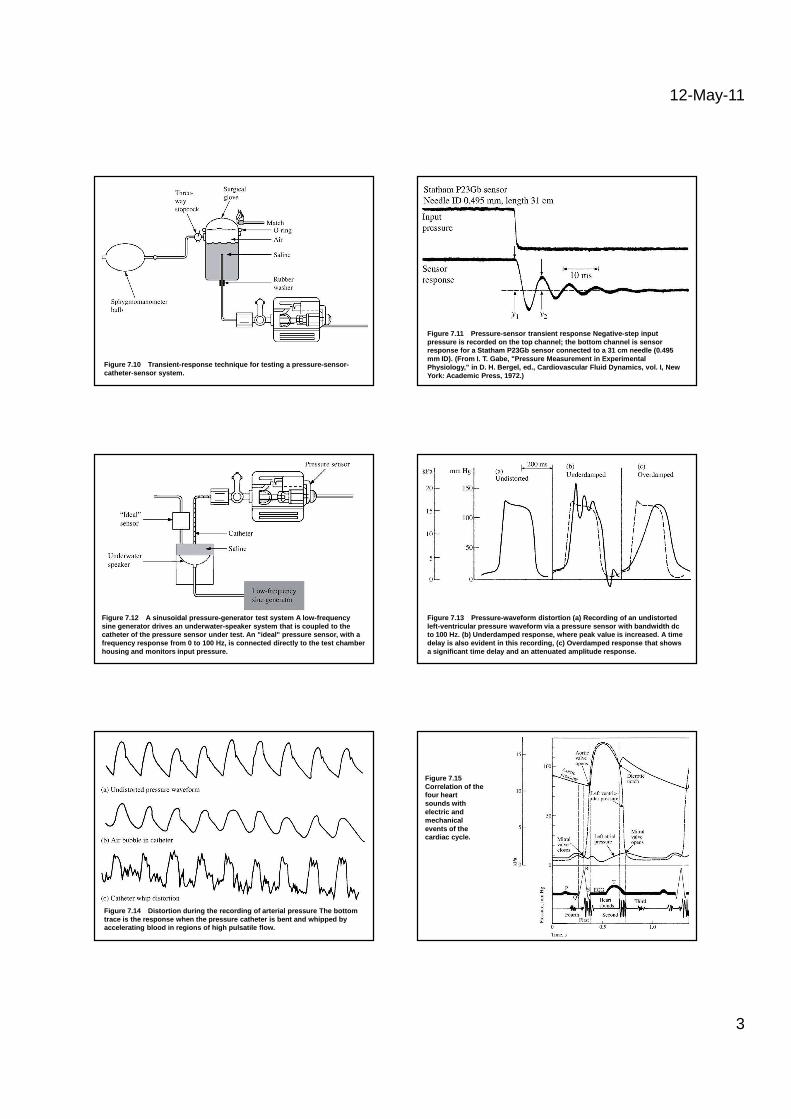
Figure 7.3 Extravascular pressure-sensor system A catheter couples a flush solution (heparinized saline) through a disposable pressure sensor with an integral flush device to the sensing port. The three-way stopcock is used to take blood samples and zero the pressure sensor.
Figure 7.4 (a) Schematic diagram of an intravascular fiber-optic pressure sensor. Pressure causes deflection in a thin metal membrane that modulates the coupling between the source and detector fibers, (b) Characteristic curve for the fiber-optic pressure sensor.
12-May-11
2
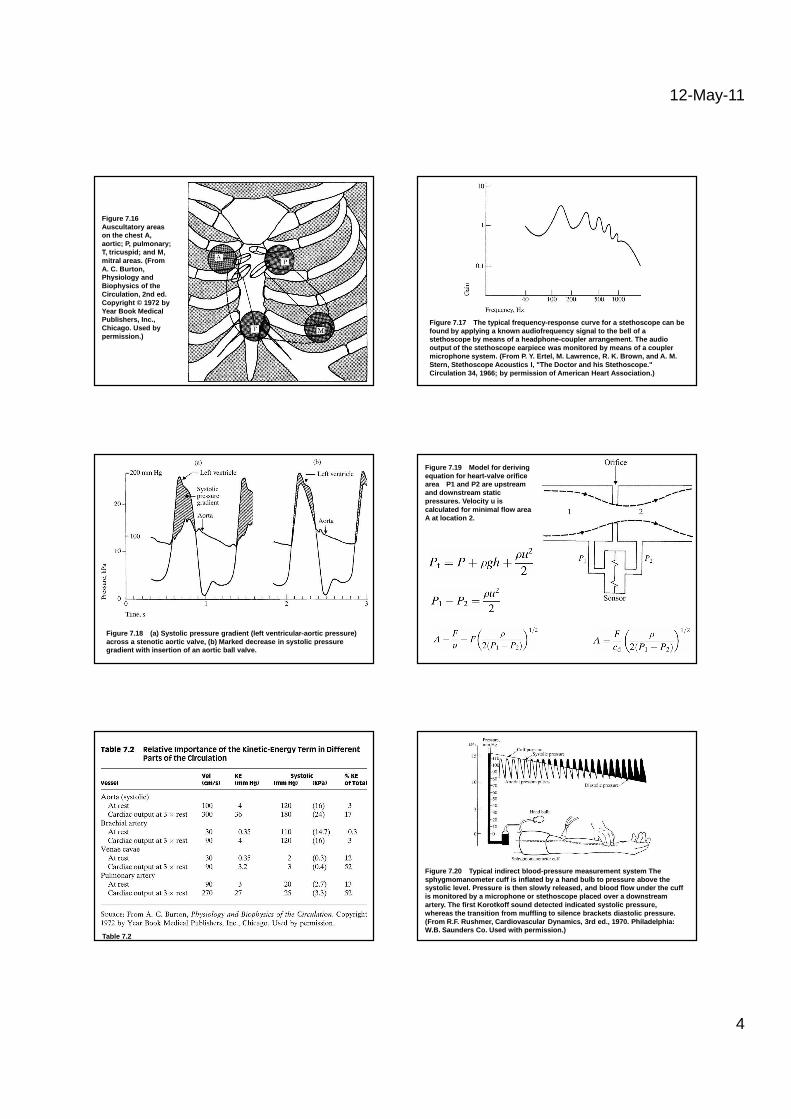
Figure 7.5 Fiber-optic pressure sensor for intracran ial pressure measure-ments in the newborn. The sensor membrane i s placed in contact with the anterior fontanel of the newborn.
Figure 7.6 The first six harmonics of the blood-pres sure waveform. The table gives relative values for amplitudes. (From T . A. Hansen, "Pressure Measure-ment in the Human Organism," Acta Physiologica Scandinavica, 1949, 19, Suppl. 68, 1–227. Used with permission.)
Figure 7.7 (a) Physical model of a catheter-sensor s ystem, (b) Analogous electric system for this catheter-sensor system. Ea ch segment of the catheter has its own resistance Rc, inertance Lc, and compliance Cc. In addition, the sensor has resistance Rs, inertance, Ls, and compliance Cs. The compliance of the diaphragm is Cd.
Figure 7.8 (a) Simplified analogous circuit. Compliance of the sensor diaphragm is larger than compliance of catheter or sensor cavity for a bubble-free, noncompliant catheter. The resistance and inertance of the catheter are larger than those of the sensor, because the catheter has longer length and smaller diameter, (b) Analogous circuit for catheter–sensor system with a bubble in the catheter. Catheter properties proximal to the bubble are inertance Lc and resistance Rc. Catheter properties distal to the bubble are Lcd and Rtf. Compliance of the diaphragm is Cd; compliance of the bubble is Cb. (c) Simplified analogous circuit for catheter–sensor system with a bubble in the catheter, assuming that Lcd and Rcd are negligible with respect to Rc and Lc.
Table 7.1
Figure 7.9 Frequency-response curves for catheter–sensor system with and without bubbles. Natural frequency decreases from 91 Hz to 22 Hz and damp-ing ratio increases from 0.033 to 0.137 with the bubble present.
12-May-11
3
Figure 7.10 Transient-response technique for testing a pressure-sensor-catheter-sensor system.
Figure 7.11 Pressure-sensor transient response Negat ive-step input pressure is recorded on the top channel; the bottom channel is sensor response for a Statham P23Gb sensor connected to a 31 cm needle (0.495 mm ID). (From I. T. Gabe, "Pressure Measurement in Experimental Physiology," in D. H. Bergel, ed., Cardiovascular F luid Dynamics, vol. I, New York: Academic Press, 1972.)
Figure 7.12 A sinusoidal pressure-generator test sys tem A low-frequency sine generator drives an underwater-speaker system that is coupled to the catheter of the pressure sensor under test. An "ide al" pressure sensor, with a frequency response from 0 to 100 Hz, is connected di rectly to the test chamber housing and monitors input pressure.
Figure 7.13 Pressure-waveform distortion (a) Recordi ng of an undistorted left-ventricular pressure waveform via a pressure s ensor with bandwidth dc to 100 Hz. (b) Underdamped response, where peak valu e is increased. A time delay is also evident in this recording, (c) Overda mped response that shows a significant time delay and an attenuated amplitud e response.
Figure 7.14 Distortion during the recording of arter ial pressure The bottom trace is the response when the pressure catheter is bent and whipped by accelerating blood in regions of high pulsatile flo w.
Figure 7.15Correlation of the four heart sounds with electric and mechanical events of the cardiac cycle.
12-May-11
4
Figure 7.16Auscultatory areas on the chest A, aortic; P, pulmonary; T, tricuspid; and M, mitral areas. (From A. C. Burton, Physiology and Biophysics of the Circulation, 2nd ed. Copyright © 1972 by Year Book Medical Publishers, Inc., Chicago. Used by permission.)
Figure 7.17 The typical frequency-response curve for a stethoscope can be found by applying a known audiofrequency signal to the bell of a stethoscope by means of a headphone-coupler arrange ment. The audio output of the stethoscope earpiece was monitored by means of a coupler microphone system. (From P. Y. Ertel, M. Lawrence, R. K. Brown, and A. M. Stern, Stethoscope Acoustics I, "The Doctor and his Stethoscope." Circulation 34, 1966; by permission of American Hea rt Association.)
Figure 7.18 (a) Systolic pressure gradient (left ven tricular-aortic pressure) across a stenotic aortic valve, (b) Marked decrease in systolic pressure gradient with insertion of an aortic ball valve.
Figure 7.19 Model for deriving equation for heart-valve orifice area P1 and P2 are upstream and downstream static pressures. Velocity u is calculated for minimal flow area A at location 2.
Table 7.2
Figure 7.20 Typical indirect blood-pressure measurem ent system The sphygmomanometer cuff is inflated by a hand bulb to pressure above the systolic level. Pressure is then slowly released, a nd blood flow under the cuff is monitored by a microphone or stethoscope placed over a downstream artery. The first Korotkoff sound detected indicate d systolic pressure, whereas the transition from muffling to silence bra ckets diastolic pressure. (From R.F. Rushmer, Cardiovascular Dynamics, 3rd ed., 1970. Philadelphia: W.B. Saunders Co. Used with permission.)
12-May-11
5
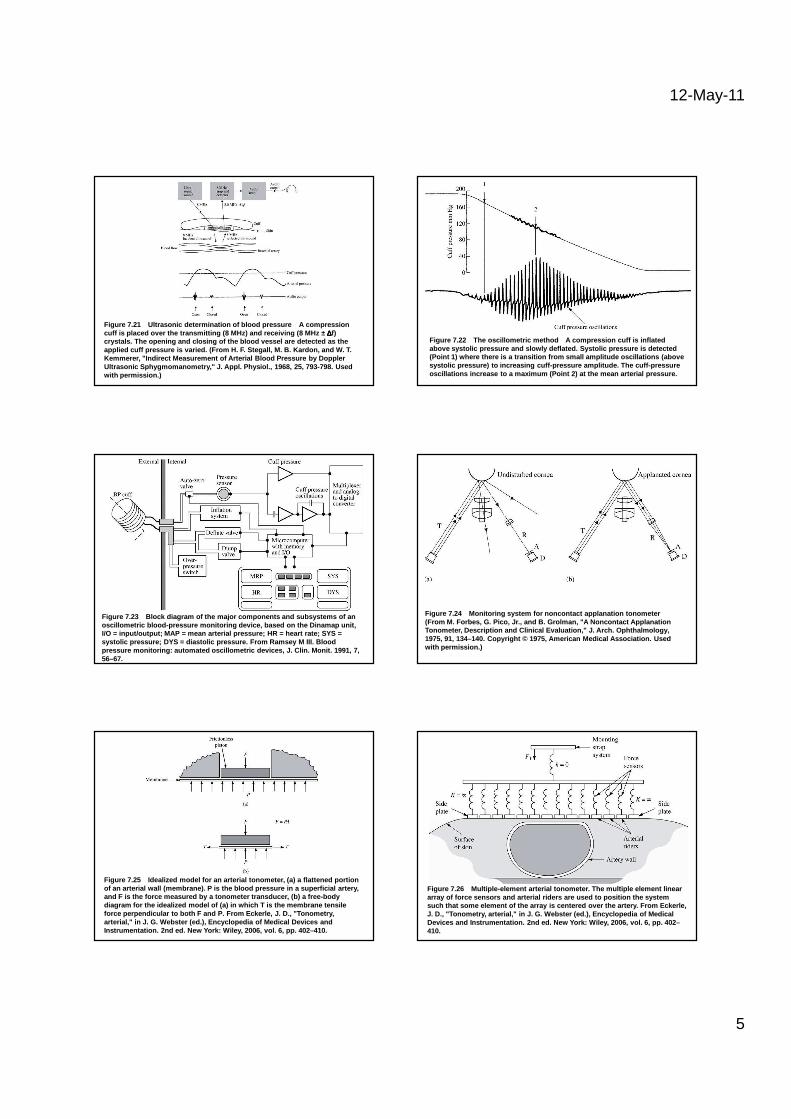
Figure 7.21 Ultrasonic determination of blood pressu re A compression cuff is placed over the transmitting (8 MHz) and rec eiving (8 MHz ± ∆∆∆∆f) crystals. The opening and closing of the blood vess el are detected as the applied cuff pressure is varied. (From H. F. Stegal l, M. B. Kardon, and W. T. Kemmerer, "Indirect Measurement of Arterial Blood P ressure by Doppler Ultrasonic Sphygmomanometry," J. Appl. Physiol., 1968, 25, 793-798. Used with permission.)
Figure 7.22 The oscillometric method A compression cu ff is inflated above systolic pressure and slowly deflated. Systol ic pressure is detected (Point 1) where there is a transition from small am plitude oscillations (above systolic pressure) to increasing cuff-pressure ampl itude. The cuff-pressure oscillations increase to a maximum (Point 2) at the mean arterial pressure.
Figure 7.23 Block diagram of the major components an d subsystems of an oscillometric blood-pressure monitoring device, bas ed on the Dinamap unit, I/O = input/output; MAP = mean arterial pressure; H R = heart rate; SYS = systolic pressure; DYS = diastolic pressure. From R amsey M III. Blood pressure monitoring: automated oscillometric device s, J. Clin. Monit. 1991, 7, 56–67.
Figure 7.24 Monitoring system for noncontact applana tion tonometer(From M. Forbes, G. Pico, Jr., and B. Grolman, "A N oncontact Applanation Tonometer, Description and Clinical Evaluation," J. Arch. Ophthalmology, 1975, 91, 134–140. Copyright © 1975, American Medic al Association. Used with permission.)
Figure 7.25 Idealized model for an arterial tonometer , (a) a flattened portion of an arterial wall (membrane). P is the blood pressure in a superficial artery, and F is the force measured by a tonometer transducer, (b ) a free-body diagram for the idealized model of (a) in which T is the membrane tensile force perpendicular to both F and P. From Eckerle, J. D., "Tonometry, arterial," in J. G. Webster (ed.), Encyclopedia of Medical Devices and Instrumentation. 2nd ed. New York: Wiley, 2006, vol. 6, pp. 402–41 0.
Figure 7.26 Multiple-element arterial tonometer. The multiple element linear array of force sensors and arterial riders are used to position the system such that some element of the array is centered ove r the artery. From Eckerle, J. D., "Tonometry, arterial," in J. G. Webster (ed. ), Encyclopedia of Medical Devices and Instrumentation. 2nd ed. New York: Wiley, 2006, vol. 6, pp. 402–410.