BIOMED CENTRAL
16
RESEARCH ARTICLE Open Access A genome-wide DNA methylation study in colorectal carcinoma Muhammad G Kibriya 1* , Maruf Raza 2 , Farzana Jasmine 1 , Shantanu Roy 1 , Rachelle Paul-Brutus 1 , Ronald Rahaman 1 , Charlotte Dodsworth 1 , Muhammad Rakibuz-Zaman 3 , Mohammed Kamal 2 and Habibul Ahsan 1,4,5,6 Abstract Background: We performed a genome-wide scan of 27,578 CpG loci covering 14,475 genes to identify differentially methylated loci (DML) in colorectal carcinoma (CRC). Methods: We used Illumina’s Infinium methylation assay in paired DNA samples extracted from 24 fresh frozen CRC tissues and their corresponding normal colon tissues from 24 consecutive diagnosed patients at a tertiary medical center. Results: We found a total of 627 DML in CRC covering 513 genes, of which 535 are novel DML covering 465 genes. We also validated the Illumina Infinium methylation data for top-ranking genes by non-bisulfite conversion q-PCR-based methyl profiler assay in a subset of the same samples. We also carried out integration of genome- wide copy number and expression microarray along with methylation profiling to see the functional effect of methylation. Gene Set Enrichment Analysis (GSEA) showed that among the major “gene sets” that are hypermethylated in CRC are the sets: “inhibition of adenylate cyclase activity by G-protein signaling”, “Rac guanyl- nucleotide exchange factor activity”, “regulation of retinoic acid receptor signaling pathway” and “estrogen receptor activity”. Two-level nested cross validation showed that DML-based predictive models may offer reasonable sensitivity (around 89%), specificity (around 95%), positive predictive value (around 95%) and negative predictive value (around 89%), suggesting that these markers may have potential clinical application. Conclusion: Our genome-wide methylation study in CRC clearly supports most of the previous findings; additionally we found a large number of novel DML in CRC tissue. If confirmed in future studies, these findings may lead to identification of genomic markers for potential clinical application. Background Colorectal carcinoma (CRC) is one of the most common human malignancies worldwide, and an increasing inci- dence of CRC in Asia has been reported [1,2]. CRC cells develop several genetic and epigenetic alterations in can- cer-related genes to achieve malignant status [3]. Pro- moter hypermethylation coupled with loss of heterozygosity at the same locus results in loss of gene function in many tumor cells [4]. Alterations in DNA methylation in cancer, in general, have been known for 25 years, including hypomethylation of oncogenes and hypermethylation of tumor suppressor genes [5]. Identi- fication of specific DNA methylation markers would be helpful for understanding pathogenetic mechanisms, as well as for developing new therapeutic strategies. So far most of the studies addressing DNA methylation and cancer have followed the candidate gene approach, or addressed a handful of genes, or have used cell lines [6-8]. Recently Ang et al. used Illumina’ s GoldenGate array covering 1,505 loci and found a total of 202 loci covering 132 genes to be differentially methylated in CRC [9]. Attempts are being made to classify CRC by methylation patterns that correlate with prognosis [10-15]. A recent study suggests that there may be a sig- nificant difference in DNA methylation profiles between cancer cell lines and original tumor tissue emphasizing the need to be cautious in using cell lines as a tumor model for molecular studies of cancer [16]. To our knowledge, there is no published study from Southeast Asia addressing these molecular features in * Correspondence: [email protected] 1 Department of Health Studies, The University of Chicago, Chicago, IL 60637, USA Full list of author information is available at the end of the article Kibriya et al. BMC Medical Genomics 2011, 4:50 http://www.biomedcentral.com/1755-8794/4/50 © 2011 Kibriya et al; licensee BioMed Central Ltd. This is an Open Access article distributed under the terms of the Creative Commons Attribution License (http://creativecommons.org/licenses/by/2.0), which permits unrestricted use, distribution, and reproduction in any medium, provided the original work is properly cited.
-
Upload
government-medical-college -
Category
Documents
-
view
26 -
download
0
Transcript of BIOMED CENTRAL
RESEARCH ARTICLE Open Access
A genome-wide DNA methylation study incolorectal carcinomaMuhammad G Kibriya1*, Maruf Raza2, Farzana Jasmine1, Shantanu Roy1, Rachelle Paul-Brutus1, Ronald Rahaman1,Charlotte Dodsworth1, Muhammad Rakibuz-Zaman3, Mohammed Kamal2 and Habibul Ahsan1,4,5,6
Abstract
Background: We performed a genome-wide scan of 27,578 CpG loci covering 14,475 genes to identifydifferentially methylated loci (DML) in colorectal carcinoma (CRC).
Methods: We used Illumina’s Infinium methylation assay in paired DNA samples extracted from 24 fresh frozenCRC tissues and their corresponding normal colon tissues from 24 consecutive diagnosed patients at a tertiarymedical center.
Results: We found a total of 627 DML in CRC covering 513 genes, of which 535 are novel DML covering 465genes. We also validated the Illumina Infinium methylation data for top-ranking genes by non-bisulfite conversionq-PCR-based methyl profiler assay in a subset of the same samples. We also carried out integration of genome-wide copy number and expression microarray along with methylation profiling to see the functional effect ofmethylation. Gene Set Enrichment Analysis (GSEA) showed that among the major “gene sets” that arehypermethylated in CRC are the sets: “inhibition of adenylate cyclase activity by G-protein signaling”, “Rac guanyl-nucleotide exchange factor activity”, “regulation of retinoic acid receptor signaling pathway” and “estrogen receptoractivity”. Two-level nested cross validation showed that DML-based predictive models may offer reasonablesensitivity (around 89%), specificity (around 95%), positive predictive value (around 95%) and negative predictivevalue (around 89%), suggesting that these markers may have potential clinical application.
Conclusion: Our genome-wide methylation study in CRC clearly supports most of the previous findings;additionally we found a large number of novel DML in CRC tissue. If confirmed in future studies, these findingsmay lead to identification of genomic markers for potential clinical application.
BackgroundColorectal carcinoma (CRC) is one of the most commonhuman malignancies worldwide, and an increasing inci-dence of CRC in Asia has been reported [1,2]. CRC cellsdevelop several genetic and epigenetic alterations in can-cer-related genes to achieve malignant status [3]. Pro-moter hypermethylation coupled with loss ofheterozygosity at the same locus results in loss of genefunction in many tumor cells [4]. Alterations in DNAmethylation in cancer, in general, have been known for25 years, including hypomethylation of oncogenes andhypermethylation of tumor suppressor genes [5]. Identi-fication of specific DNA methylation markers would be
helpful for understanding pathogenetic mechanisms, aswell as for developing new therapeutic strategies. So farmost of the studies addressing DNA methylation andcancer have followed the candidate gene approach, oraddressed a handful of genes, or have used cell lines[6-8]. Recently Ang et al. used Illumina’s GoldenGatearray covering 1,505 loci and found a total of 202 locicovering 132 genes to be differentially methylated inCRC [9]. Attempts are being made to classify CRC bymethylation patterns that correlate with prognosis[10-15]. A recent study suggests that there may be a sig-nificant difference in DNA methylation profiles betweencancer cell lines and original tumor tissue emphasizingthe need to be cautious in using cell lines as a tumormodel for molecular studies of cancer [16].To our knowledge, there is no published study from
Southeast Asia addressing these molecular features in
* Correspondence: [email protected] of Health Studies, The University of Chicago, Chicago, IL 60637,USAFull list of author information is available at the end of the article
Kibriya et al. BMC Medical Genomics 2011, 4:50http://www.biomedcentral.com/1755-8794/4/50
© 2011 Kibriya et al; licensee BioMed Central Ltd. This is an Open Access article distributed under the terms of the Creative CommonsAttribution License (http://creativecommons.org/licenses/by/2.0), which permits unrestricted use, distribution, and reproduction inany medium, provided the original work is properly cited.
CRC to better understand the underlying pathology.There is epidemiologic evidence of a link between ethni-city, certain food habits (more red meat, less vegetables)and CRC [17]. With very few exceptions in the tribalareas, the Bangladeshi population is relatively homoge-nous ethnically and has a more or less similar pattern offood habit. In this study we have used Illumina’s Infi-nium methylation assay to study the methylation statusin 27,578 CpG sites covering 14,475 genes in pairedCRC and surrounding healthy tissue from Bangladeshipatients with CRC to identify differentially methylatedloci involved in CRC.
MethodsTissue SamplesThe samples were collected from surgically removedcolonic specimens received by the department of Pathol-ogy, Bangabandhu Sheikh Mujib Medical University(BSMMU), Dhaka, Bangladesh during the period ofDecember 2009 to March 2010. All samples were col-lected by one surgical pathology fellow (MR) from theoperating room immediately after the surgical resection.We considered the consecutive 24 eligible cases withhistologically confirmed diagnosis of CRC. Histopathol-ogy was done independently by two histopathologists(MK & MR), and there was concordance in all 24 cases.For each patient, one sample was collected from thetumor mass, and another sample was taken from theresected unaffected part of the colon about 5-10 cmaway from the tumor mass. Thus, from each individualwe obtained a pair of tumor and normal tissues. Fromeach site, the tissue was collected as fresh frozen andalso in RNA-stabilizing buffer. The samples wereshipped on dry ice to the molecular genomics lab atThe University of Chicago for subsequent DNA extrac-tion and methylation assay. Patient characteristics areshown in Additional File 1 Table S1. For each patient,we also abstracted key demographic and clinical dataand tumor characteristics from hospital medical records.Written informed consent was obtained from all partici-pants. The research protocol was approved by the “Ethi-cal Review Committee, Bangabandhu Sheikh MujibMedical University”, Dhaka, Bangladesh (BSMMU/2010/10096) and by the “Biological Sciences Division, Univer-sity of Chicago Hospital Institutional Review Board”,Chicago, IL, USA (10-264-E).
DNA extraction and quality controlDNA was extracted from fresh frozen tissue using Pure-gene Core kit (Qiagen, Maryland, USA). The average260/280 ratio was 1.85. Electropherogram from AgilentBioAnalyzer with Agilent DNA 12000 chips showed thefragment size to be >10000 bp (Additional File 2 FigureS1).
RNA extraction and quality controlRNA was extracted from RNA Later preserved colonictissue using Ribopure tissue kit (Ambion, USA, Cat#AM1924). Quality was checked on Agilent BioAnalyzer.RNA from two patients showed poor quality and thatwas also reflected on the microarray data.
Genome-wide methylation assayThe Infinium Methylation-27Assay was used to detect27,578 CpG sites genome-wide, spanning 14,495 genes.The CpG sites were located within the proximal promo-ter regions of genes, with the distance to transcriptionstart site (TSS) ranging from 0 to 1499 bp averaged at389 ± 341 bp. For bisulfite conversion, EZ DNA methy-lation kit (Zymo Research, USA) was used. Paired sam-ples (CRC and corresponding normal) were processedon the same chip, and all the 48 samples were processedon 4 chips (12 samples/chip) at the same time to avoidbatch effect. The Illumina protocol was followed for themethylation assay. A Tecan Evo robot was used forautomated sample processing and the chips werescanned on a single BeadArray reader (S-428). Controlpanel in the BeadStudio analytical software showedexcellent intensity for staining (above 15,000), clear clus-tering for the hybridization probes, good target removalintensity (<400) and satisfactory bisulfite conversion.
Validation of Infinium methylation platform by q-PCRarrayWe used commercially available custom Methyl profilerPCR array from Qiagen-SABiosciences, which does notrequire bisulfite conversion. Manufacturer’s protocol(http://www.sabiosciences.com/dna_methylation_cus-tom_PCRarray.php) was followed for the assay andABI7900 RT-PCR instrument was used to read theplates. Basically, the assay relies on differential cleavageof target sequences by two different restriction endonu-cleases - methyl specific (MS) and methyl dependent(MD), whose activity require either the presence orabsence of methylated cytosines respectively in theirrecognition sequences. Details of the assay are publishedelsewhere [18]. Using the standard ΔΔCt method theproportion of hypermethylated and intermediatelymethylated DNA was calculated [18] using the manufac-turer supplied Excel macro spreadsheet.
High density SNP assayWe used Illumina 610 Quad BeadChip (Illumina Inc.) toobtain the copy number data from a total of 620,901mar-kers (592,532 SNPs and 28,369 CNV probes).
Genome-wide gene expression microarrayWe used HT12 v4 BeadChip (Illumina Inc.) for geneexpression. The chip contains a total of 47,231 probes
Kibriya et al. BMC Medical Genomics 2011, 4:50http://www.biomedcentral.com/1755-8794/4/50
Page 2 of 16
covering 31,335 genes. Paired samples were processed insame chip (12 samples/chip) and all 48 samples wereprocessed in a single batch using 4 chips to minimizebatch effect.
Statistical analysisTo compare the continuous variables (e.g. number ofdetected loci/samples or average signal intensity/averageb value etc. among the two groups), we used one-wayanalysis of variance (ANOVA).
Genome-wide Methylation data analysisFor measuring methylation, we used the Illumina Bead-Studio software to generate the b value for each locusfrom the intensity of methylated and unmethylatedprobes. We used the intensity values with and withoutbackground normalization. The background value isderived by averaging the signals of built-in negative con-trol bead types, which are designed to be thermodyna-mically equivalent to the regular probes but lack aspecific target in the transcriptome. The b is calculatedas (intensity of methylated probe)/(intensity of methy-lated probe + intensity of unmethylated probe). Hence,b ranges between 0 (least methylated) and 1 (mostmethylated) and is proportional to the degree of methy-lated state of any particular loci. The methylation mod-ule of BeadStudio was used for differential methylationanalysis using Illumina custom model. The model oper-ates under the assumption that the methylation value bis normally distributed among biological replicates cor-responding to a set of biological conditions (tumor andnormal in the present scenario). DiffScore of a probe iscomputed as:
DiffScore = 10 sign (βtumor − βnormal) log10p
DeltaB = (βtumor − βnormal)
In addition to the Illumina BeadStudio differentialmethylation analysis, we exported the BeadStudio gener-ated b-values to PARTEK Genomic Suite [19] forfurther statistical analyses. For statistical analysis weused these b-values with and without quantile normali-zation. In this way, initially we examined four sets ofdata - (1) no normalization of signal intensity, no nor-malization of b-values; (2) no normalization of signalintensity to calculate b-values initially, but subsequentlyquantile normalization of b-values were used; (3) back-ground normalization of signal intensity to calculate b-values, but no normalization of b-values were used; (4)background normalization of signal intensity to calculateb-values, and quantile normalization of b-values wereused. Principal component analysis (PCA) and samplehistograms were checked as a part of quality controlanalyses of the data. Mixed-model multi-way ANOVA
(which allows more than one ANOVA factor to beentered in each model) was used to compare the indivi-dual CpG loci methylation data across different groups.In general, “tissue” (tumor/adjacent normal), sex (male/female) and tumor location (proximal colon/distalcolon) were used as categorical variables with fixedeffect since the levels “tumor/normal”, “male/female”,and “proximal/distal” represent all conditions of interest;whereas “case ID#” (as proxy of inter-person variation)was treated as categorical variable with random effect,since the person ID is only a random sample of all thelevels of that factor. Method of moments estimation wasused to obtain estimates of variance components formixed models [20]. As per the study design, we pro-cessed both the CRC tissue and the corresponding adja-cent normal sample from one individual in a single chip(one chip accommodates 12 samples) and all the fourchips required to run a total of 48 samples were run ina single batch to avoid batch effect. In the ANOVAmodel, the b-value for the CpG loci was used as theresponse variable, and “tissue” (tumor or normal), caseID#, “sex” and “location” were entered as ANOVA fac-tors. It may be noted that “sex” and “location” werenested within “case ID#”. One example of a model is asfollows:
Yijklm = μ + Tissuei + Sexj + Locationk + CaseID(Sex ∗ Location)jkl + εijklm
where Yijklm represents the m-th observation on the i-th Tissue j-th Sex k-th Location l-th CaseID, μ is thecommon effect for the whole experiment, εijklm repre-sents the random error present in the m-th observationon the i-th Tissue j-th Sex k-th Location l-th CaseID.The errors εijklm are assumed to be normally and inde-pendently distributed with mean 0 and standard devia-tion δ for all measurements.In GO Enrichment analysis, we tested if the genes
found to be differentially methylated fell into a GeneOntology category more often than expected by chance.We used chi-square test to compare “number of signifi-cant genes from a given category/total number of signif-icant genes” vs. “number of genes on chip in thatcategory/total number of genes on the microarray chip”.Negative log of the p-value for this test was used as theenrichment score. Therefore, a GO group with a highenrichment score represents a lead functional group.The enrichment scores were analyzed in a hierarchicalvisualization and in tabular form.In addition to looking at differential methylation at the
level of individual CpG loci, we also examined the dif-ferential methylation of “gene sets” using the Gene SetEnrichment Analysis (GSEA) [21]. Given an a prioridefined set of genes S (sharing the same GO category),the goal of GSEA was to determine whether the
Kibriya et al. BMC Medical Genomics 2011, 4:50http://www.biomedcentral.com/1755-8794/4/50
Page 3 of 16
members of S were randomly distributed throughout theranked list or primarily found at the top or bottom.Considering the fact that GSEA can look at single vari-able (unadjusted b-value), we also used GO-ANOVAwhich offers adjustments for other factors such as “per-son-to-person” variation, “tissue type” variation etc.GO-ANOVA is a mixed model ANOVA to test the
methylation of a set of genes (sharing the same GOcategory) instead of an individual gene in differentgroups [19]. The analysis is performed at the gene level,but the result is expressed at the level of the GO-cate-gory by averaging the member genes’ results. The equa-tion for the model was:
Model : Y = μ + T + P + G + S (T ∗ P) + ε
where Y represents the methylation status of a GO-category, μ is the common effect or average methylationof the GO-category, T is the tissue-to-tissue (tumor/healthy) effect, P is the patient-to-patient effect, G is thegene-to-gene effect (differential methylation of geneswithin the GO-category independent of tissue types), S(T*P) is the sample-to-sample effect (this is a randomeffect, and nested in tissue and patient) and ε representsthe random error.
Cross-validationFor the one-level cross validation, the data was firstdivided into 10 random partitions. In each iteration,10% of samples were held out for testing while theremaining 90% samples were used to fit the parametersof the model. We also used a 6 × 10 two-level nestedcross-validation [22]. In the outer cross-validation, withrandom 1/6-th of the samples (n = 8) were held out astest samples, and the remaining 40 samples were usedin an inner 10-fold cross-validation (1/10-th of thesesamples (n = 4) were held out at each iteration, and itwas repeated 10 times) to determine the optimal predic-tor variables and other classifier parameters. The modelthat performed the best on the inner cross-validationwas applied to the 8 test samples that were held-out inthe outer cross-validation. This was repeated 6 times.Thus we had a total of 10 × 6 or 60 permutations forinner cross-validation and 6 for the outer cross-valida-tion. The inner cross-validation was performed in orderto select predictor variables and optimal model para-meters, and the outer cross-validation was used to pro-duce overall accuracy estimates for the classifier.Initially we tested several classification methods: (a) K-Nearest Neighbor (KNN) with Euclidean distance mea-sure and 1-neighbor, (b) K-Nearest Neighbor (KNN)with Euclidean distance measure and 3-neighbor (c)nearest centroid with equal prior probability and (d) lin-ear discriminent analysis with equal prior probability.
Based on the results (normalized correct rate), we finallyused KNN with Euclidean distance measure and 3-neighbor as the classifier, and regarding the number ofvariables, we tested 1 through 50 variables. For auto-mated variable selection, we used 2-way ANOVA wheretissue type and case ID# were used as ANOVA factors.One of the loci with maximum delta-b (DAB2IP) wasforced into the model.
Genome-wide Copy number (CN) analysisBeadStudio normalized intensity values were importedinto PARTEK genomic suit [19]. Intensity data from thenormal tissue was used as reference for generating copynumber data for each marker. Standard PCA and sam-ple histogram were generated as part of QC. Genomicsegmentation was done with a setting of minimum of 10markers, p-value threshold of 0.001 for two neighboringregions having significantly differing means. A segmentwas considered as amplification if the mean CN was≥2.5 and deletion if the mean was ≤1.5. The phenotype(CRC or normal) was tested for association with amplifi-cation/deletion status of the sample using Pearson’s Chi-square test.
Genome-wide Gene Expression analysisIn BeadStudio, quantile normalization was used for theintensity data. PCA detected the arrays from the sametwo patients as outlier which showed poor RNA qualityon Agilent BioAnalyzer. Microarray data from those twopatients were excluded from the analysis. Differentialgene expression analysis was done using the samemixed model multi-way ANOVA [19] as in case ofmethylation analysis. We report genes to be differen-tially expressed only if that shows at least 1.3 foldchange in either direction at FDR 0.05. We used this 1.3fold as cut-off based on the power calculation from ourdata. Given the sample size, we had 80% power to detect90% of the truly differentially genes at 1.3 fold.
Correlation between methylation/gene expression andmethylation/copy numberTo investigate the effect of DNA methylation on geneexpression, we used Spearman’s rank to test correlationbetween the beta-value of a methylation locus and thelog2-transformed normalized expression value of a genewithin a maximum distance of 2 Kb from that methyla-tion locus. Correlated methylation and expression datawere taken from the same samples. In the same way, tosee the effect of copy number on gene expression, wealso used Spearman’s rank to test correlation betweenthe average copy number of a genomic segment and thelog2-transformed normalized expression value of a geneoverlapping with that genomic segment. Copy numberand methylation data were also from the same samples.
Kibriya et al. BMC Medical Genomics 2011, 4:50http://www.biomedcentral.com/1755-8794/4/50
Page 4 of 16
ResultsOur study was conducted on 24 patients (17 male, 7female) with CRC with a mean age of 45.5 years (SD16.8) (Additional File 1 Table S1). There were a total of27,578 loci covering 14,495 genes (average 1.9 CpG lociper gene) that were studied for methylation status persample. On average, about 27,511 loci (95% CI 27,488 -27,534) were detected in each sample at p < 0.05 level.A locus was said to be detected at p < 0.05 level if themean signal intensity from multiple probes for that CpGlocus was significantly higher (at the level of p < 0.05)than the negative control on the same chip. Mean num-ber of loci detected at p < 0.05 in tumor and normal tis-sue was similar: 27483.88 (SD 114.75) vs. 27507.25 (SD65.84) (p = 0.41). There was a very strong correlation(r2 = 0.9932) of the total signal intensity (methylatedand unmethylated) of the 27,578 loci between the 24normal tissues and corresponding 24 tumor tissues sug-gesting uniform amplification and hybridization for allsamples. However, when the average b of tumor tissuesamples were plotted against that of corresponding nor-mal tissue samples, there were clearly a number of locithat were differentially methylated in CRC tissues com-pared to normal tissues. The data discussed in the publi-cation have been deposited in NCBI’s Gene ExpressionOmnibus [23] and will be accessible through GEO
Series accession number GSE29490 (http://www.ncbi.nlm.nih.gov/geo/query/acc.cgi?acc=GSE29490).
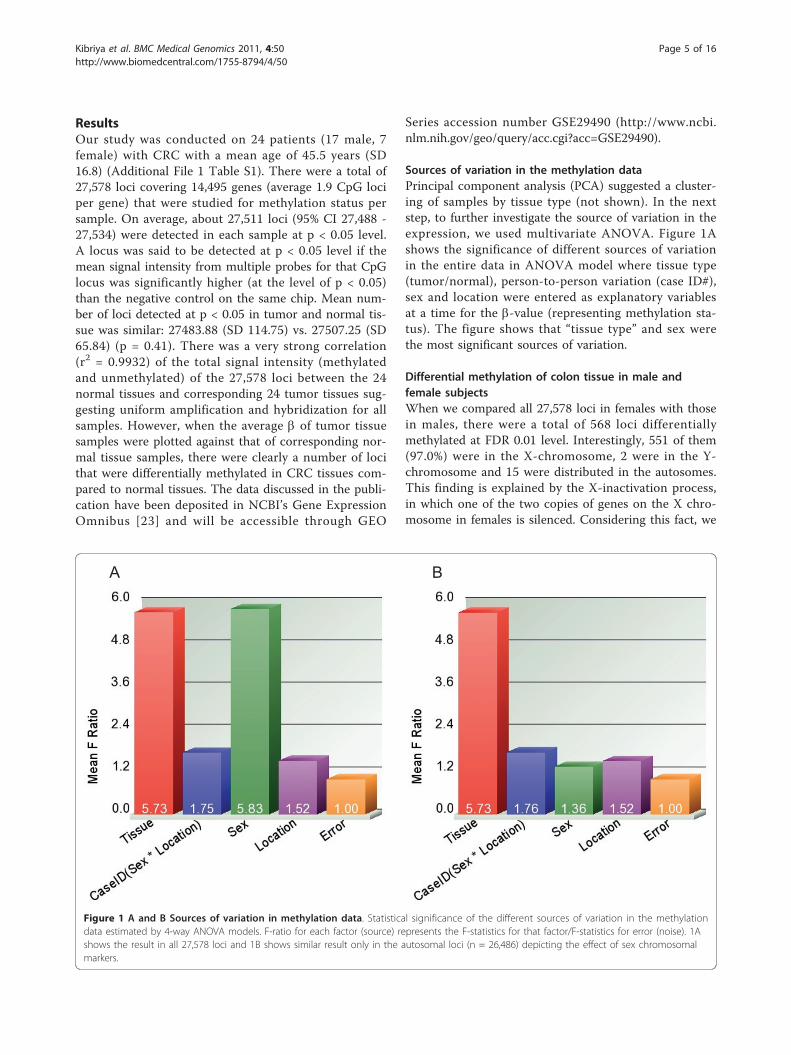
Sources of variation in the methylation dataPrincipal component analysis (PCA) suggested a cluster-ing of samples by tissue type (not shown). In the nextstep, to further investigate the source of variation in theexpression, we used multivariate ANOVA. Figure 1Ashows the significance of different sources of variationin the entire data in ANOVA model where tissue type(tumor/normal), person-to-person variation (case ID#),sex and location were entered as explanatory variablesat a time for the b-value (representing methylation sta-tus). The figure shows that “tissue type” and sex werethe most significant sources of variation.
Differential methylation of colon tissue in male andfemale subjectsWhen we compared all 27,578 loci in females with thosein males, there were a total of 568 loci differentiallymethylated at FDR 0.01 level. Interestingly, 551 of them(97.0%) were in the X-chromosome, 2 were in the Y-chromosome and 15 were distributed in the autosomes.This finding is explained by the X-inactivation process,in which one of the two copies of genes on the X chro-mosome in females is silenced. Considering this fact, we
A B
Figure 1 A and B Sources of variation in methylation data. Statistical significance of the different sources of variation in the methylationdata estimated by 4-way ANOVA models. F-ratio for each factor (source) represents the F-statistics for that factor/F-statistics for error (noise). 1Ashows the result in all 27,578 loci and 1B shows similar result only in the autosomal loci (n = 26,486) depicting the effect of sex chromosomalmarkers.
Kibriya et al. BMC Medical Genomics 2011, 4:50http://www.biomedcentral.com/1755-8794/4/50
Page 5 of 16
excluded all the sex chromosome markers (n = 1092, ofwhich 1085 in X-chromosome and 7 in Y-chromosome)from subsequent analysis for differential methylation inCRC compared to normal. The significance of differentsources of variation in the methylation data in auto-somes only is shown in Figure 1B.
Differential methylation in colorectal carcinoma tissuecompared to adjacent normal colon tissueIn a total set of 48 samples (tumor and correspondingadjacent normal tissue from 24 patients with CRC), welooked at genome-wide differential methylation in CRCtissue compared to normal tissue. There were a total of26,486 CpG loci in the autosomes covering 13,890genes. Here we present the analysis of b-value calculatedfrom background normalized signal intensity. No furthernormalization of derived b-value was used. In themethylation module of BeadStudio, using the in-builtIllumina custom model, we found a total of 875 signifi-cantly differentially methylated autosomal loci in CRCtissue compared to normal colonic tissue, of which 275were hypomethylated (DiffScore = < -30 and delta-b =<-0.2) and 600 were hypermethylated (DiffScore > = 30and delta b> = 0.2). Univariate and unpaired analysiswas used for this.In the next step, we used multi-way mixed model
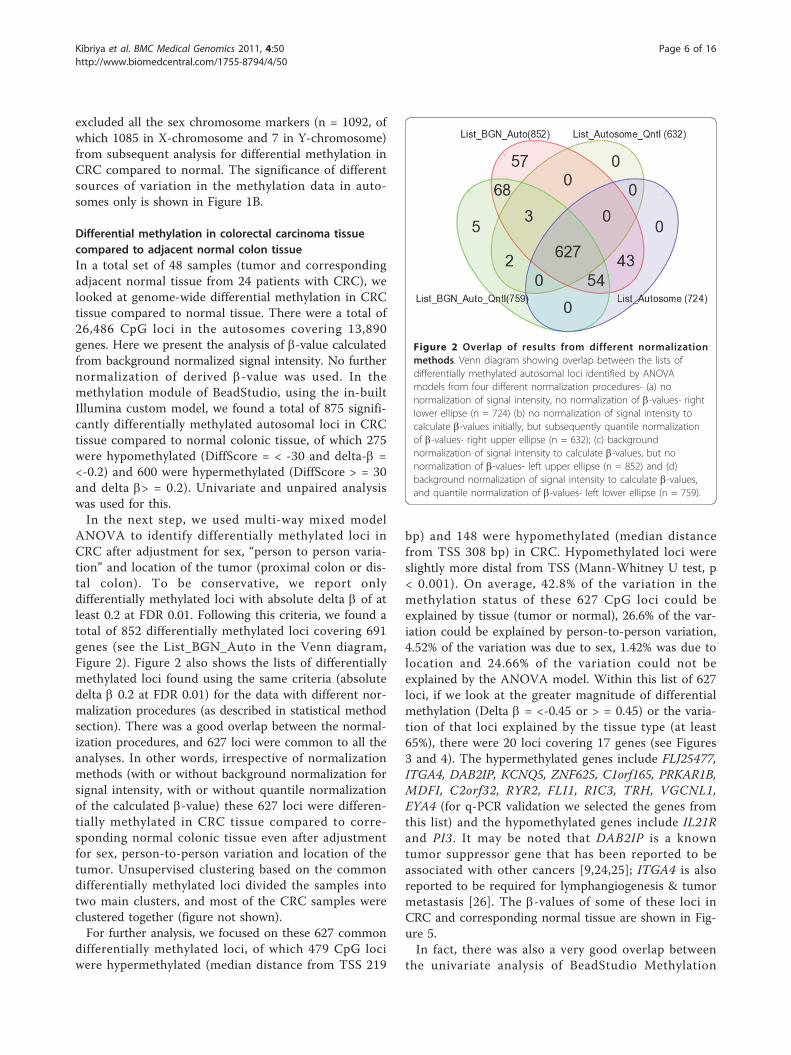
ANOVA to identify differentially methylated loci inCRC after adjustment for sex, “person to person varia-tion” and location of the tumor (proximal colon or dis-tal colon). To be conservative, we report onlydifferentially methylated loci with absolute delta b of atleast 0.2 at FDR 0.01. Following this criteria, we found atotal of 852 differentially methylated loci covering 691genes (see the List_BGN_Auto in the Venn diagram,Figure 2). Figure 2 also shows the lists of differentiallymethylated loci found using the same criteria (absolutedelta b 0.2 at FDR 0.01) for the data with different nor-malization procedures (as described in statistical methodsection). There was a good overlap between the normal-ization procedures, and 627 loci were common to all theanalyses. In other words, irrespective of normalizationmethods (with or without background normalization forsignal intensity, with or without quantile normalizationof the calculated b-value) these 627 loci were differen-tially methylated in CRC tissue compared to corre-sponding normal colonic tissue even after adjustmentfor sex, person-to-person variation and location of thetumor. Unsupervised clustering based on the commondifferentially methylated loci divided the samples intotwo main clusters, and most of the CRC samples wereclustered together (figure not shown).For further analysis, we focused on these 627 common
differentially methylated loci, of which 479 CpG lociwere hypermethylated (median distance from TSS 219
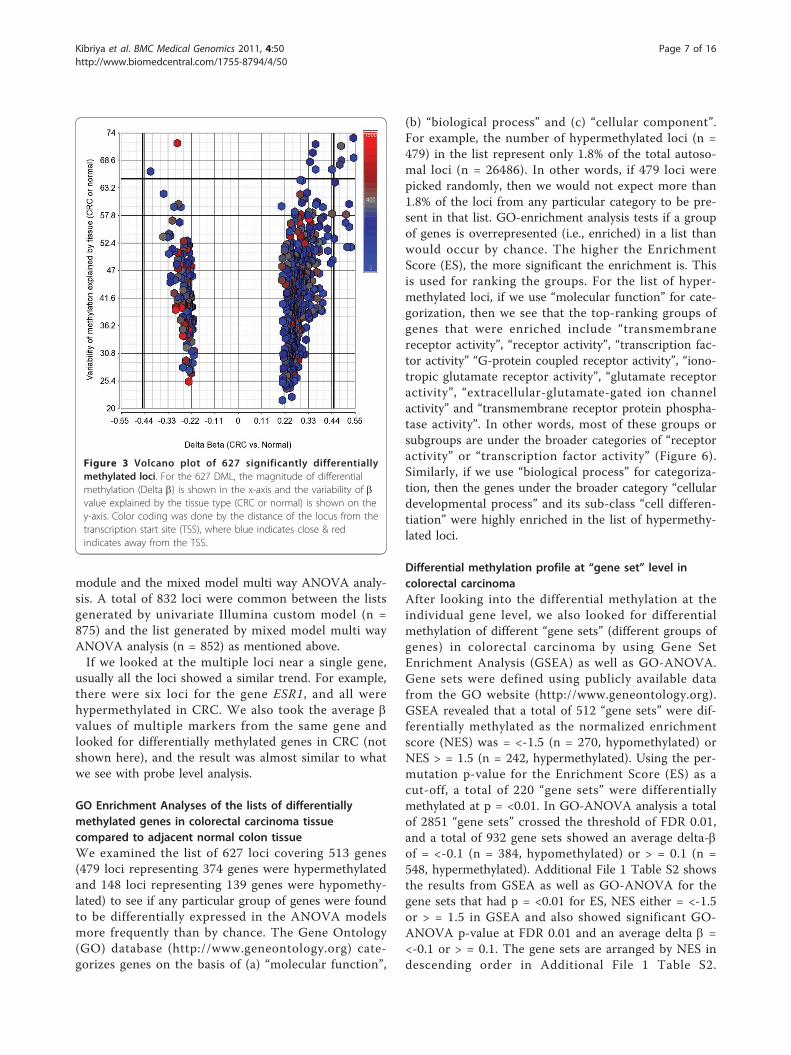
bp) and 148 were hypomethylated (median distancefrom TSS 308 bp) in CRC. Hypomethylated loci wereslightly more distal from TSS (Mann-Whitney U test, p< 0.001). On average, 42.8% of the variation in themethylation status of these 627 CpG loci could beexplained by tissue (tumor or normal), 26.6% of the var-iation could be explained by person-to-person variation,4.52% of the variation was due to sex, 1.42% was due tolocation and 24.66% of the variation could not beexplained by the ANOVA model. Within this list of 627loci, if we look at the greater magnitude of differentialmethylation (Delta b = <-0.45 or > = 0.45) or the varia-tion of that loci explained by the tissue type (at least65%), there were 20 loci covering 17 genes (see Figures3 and 4). The hypermethylated genes include FLJ25477,ITGA4, DAB2IP, KCNQ5, ZNF625, C1orf165, PRKAR1B,MDFI, C2orf32, RYR2, FLI1, RIC3, TRH, VGCNL1,EYA4 (for q-PCR validation we selected the genes fromthis list) and the hypomethylated genes include IL21Rand PI3. It may be noted that DAB2IP is a knowntumor suppressor gene that has been reported to beassociated with other cancers [9,24,25]; ITGA4 is alsoreported to be required for lymphangiogenesis & tumormetastasis [26]. The b-values of some of these loci inCRC and corresponding normal tissue are shown in Fig-ure 5.In fact, there was also a very good overlap between
the univariate analysis of BeadStudio Methylation
Figure 2 Overlap of results from different normalizationmethods. Venn diagram showing overlap between the lists ofdifferentially methylated autosomal loci identified by ANOVAmodels from four different normalization procedures- (a) nonormalization of signal intensity, no normalization of b-values- rightlower ellipse (n = 724) (b) no normalization of signal intensity tocalculate b-values initially, but subsequently quantile normalizationof b-values- right upper ellipse (n = 632); (c) backgroundnormalization of signal intensity to calculate b-values, but nonormalization of b-values- left upper ellipse (n = 852) and (d)background normalization of signal intensity to calculate b-values,and quantile normalization of b-values- left lower ellipse (n = 759).
Kibriya et al. BMC Medical Genomics 2011, 4:50http://www.biomedcentral.com/1755-8794/4/50
Page 6 of 16
module and the mixed model multi way ANOVA analy-sis. A total of 832 loci were common between the listsgenerated by univariate Illumina custom model (n =875) and the list generated by mixed model multi wayANOVA analysis (n = 852) as mentioned above.If we looked at the multiple loci near a single gene,
usually all the loci showed a similar trend. For example,there were six loci for the gene ESR1, and all werehypermethylated in CRC. We also took the average bvalues of multiple markers from the same gene andlooked for differentially methylated genes in CRC (notshown here), and the result was almost similar to whatwe see with probe level analysis.
GO Enrichment Analyses of the lists of differentiallymethylated genes in colorectal carcinoma tissuecompared to adjacent normal colon tissueWe examined the list of 627 loci covering 513 genes(479 loci representing 374 genes were hypermethylatedand 148 loci representing 139 genes were hypomethy-lated) to see if any particular group of genes were foundto be differentially expressed in the ANOVA modelsmore frequently than by chance. The Gene Ontology(GO) database (http://www.geneontology.org) cate-gorizes genes on the basis of (a) “molecular function”,
(b) “biological process” and (c) “cellular component”.For example, the number of hypermethylated loci (n =479) in the list represent only 1.8% of the total autoso-mal loci (n = 26486). In other words, if 479 loci werepicked randomly, then we would not expect more than1.8% of the loci from any particular category to be pre-sent in that list. GO-enrichment analysis tests if a groupof genes is overrepresented (i.e., enriched) in a list thanwould occur by chance. The higher the EnrichmentScore (ES), the more significant the enrichment is. Thisis used for ranking the groups. For the list of hyper-methylated loci, if we use “molecular function” for cate-gorization, then we see that the top-ranking groups ofgenes that were enriched include “transmembranereceptor activity”, “receptor activity”, “transcription fac-tor activity” “G-protein coupled receptor activity”, “iono-tropic glutamate receptor activity”, “glutamate receptoractivity”, “extracellular-glutamate-gated ion channelactivity” and “transmembrane receptor protein phospha-tase activity”. In other words, most of these groups orsubgroups are under the broader categories of “receptoractivity” or “transcription factor activity” (Figure 6).Similarly, if we use “biological process” for categoriza-tion, then the genes under the broader category “cellulardevelopmental process” and its sub-class “cell differen-tiation” were highly enriched in the list of hypermethy-lated loci.
Differential methylation profile at “gene set” level incolorectal carcinomaAfter looking into the differential methylation at theindividual gene level, we also looked for differentialmethylation of different “gene sets” (different groups ofgenes) in colorectal carcinoma by using Gene SetEnrichment Analysis (GSEA) as well as GO-ANOVA.Gene sets were defined using publicly available datafrom the GO website (http://www.geneontology.org).GSEA revealed that a total of 512 “gene sets” were dif-ferentially methylated as the normalized enrichmentscore (NES) was = <-1.5 (n = 270, hypomethylated) orNES > = 1.5 (n = 242, hypermethylated). Using the per-mutation p-value for the Enrichment Score (ES) as acut-off, a total of 220 “gene sets” were differentiallymethylated at p = <0.01. In GO-ANOVA analysis a totalof 2851 “gene sets” crossed the threshold of FDR 0.01,and a total of 932 gene sets showed an average delta-bof = <-0.1 (n = 384, hypomethylated) or > = 0.1 (n =548, hypermethylated). Additional File 1 Table S2 showsthe results from GSEA as well as GO-ANOVA for thegene sets that had p = <0.01 for ES, NES either = <-1.5or > = 1.5 in GSEA and also showed significant GO-ANOVA p-value at FDR 0.01 and an average delta b =<-0.1 or > = 0.1. The gene sets are arranged by NES indescending order in Additional File 1 Table S2.
Figure 3 Volcano plot of 627 significantly differentiallymethylated loci. For the 627 DML, the magnitude of differentialmethylation (Delta b) is shown in the x-axis and the variability of bvalue explained by the tissue type (CRC or normal) is shown on they-axis. Color coding was done by the distance of the locus from thetranscription start site (TSS), where blue indicates close & redindicates away from the TSS.
Kibriya et al. BMC Medical Genomics 2011, 4:50http://www.biomedcentral.com/1755-8794/4/50
Page 7 of 16
Obviously sorting by GO-ANOVA p-value wouldchange the ranking. The major groups or “gene sets”that are hypermethylated in CRC are “inhibition of ade-nylate cyclase activity by G-protein signaling” (Figure 7),“Rac guanyl-nucleotide exchange factor activity”, “regu-lation of retinoic acid receptor signaling pathway” and“estrogen receptor activity”.
Comparisons to colorectal carcinoma signatures fromprior studiesWe compared our conservative list of 513 differentiallymethylated genes to lists obtained by a number of pre-vious studies. In a 2010 review paper, Kim et al. [27]compiled a comprehensive list of differentially methy-lated genes in CRC tissue and other clinical samplesfrom patients with CRC. These were mainly candidategene approach based studies. There were a total of 59unique genes reported to have differential methylationin CRC tissue. Out of those 59 genes, 40 of them were
also studied in our present study. In fact there were 245loci on the chip we used that covered these 40 genes. Itmay be noted that 17 of those 40 genes (42.5%) werealso found in our conservative list of 513 differentiallymethylated genes. In addition to comparing the genelists, we also looked at the differential methylation pat-tern of these 245 loci covering those 40 genes in oursetting. A volcano plot (Additional File 3 Figure S2A)clearly shows that most of these loci were differentiallymethylated, but the number actually depends on thestrictness of the criteria used to define differentialmethylation. In fact 32 of them (80%) were significant atFDR 0.05 level without considering the delta b. RecentlyAng et al. published a study on CRC using a genomewide approach using Illumina’s GoldenGate methylationpanel of 1505 CpG loci [9]. They reported a total of 202differentially methylated loci in CRC covering 132 genes[9]. Of those 132 genes, 37 were common to our list.But again, if we look at the methylation data, then we
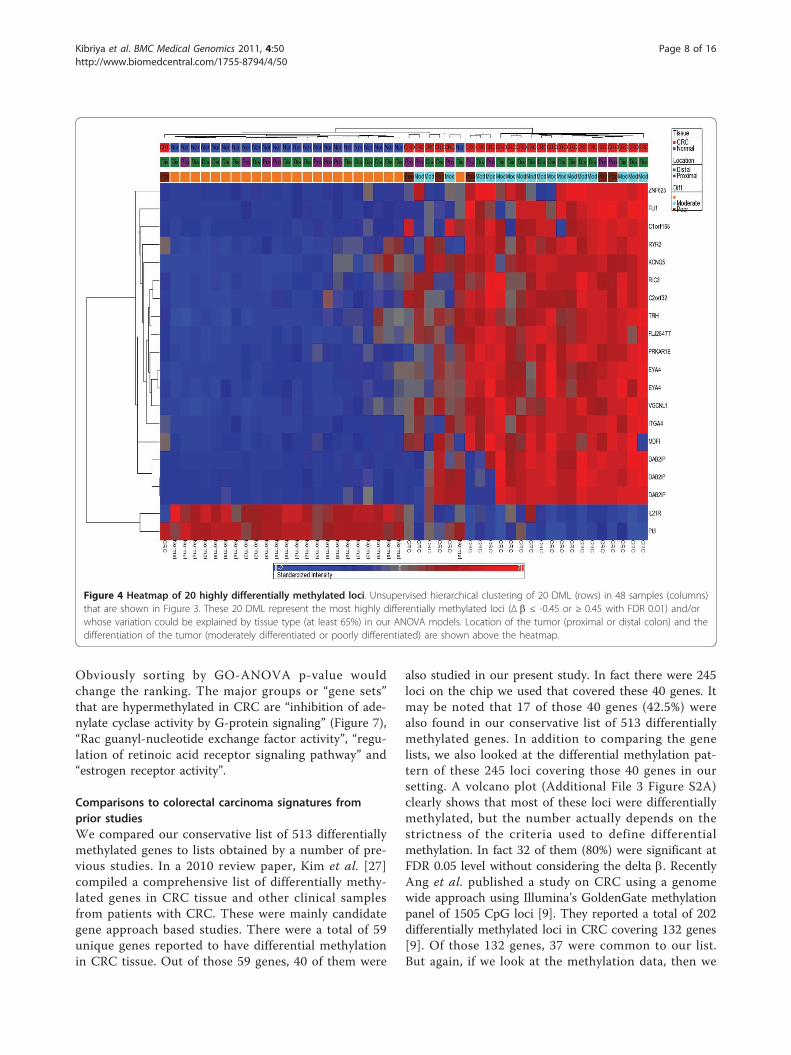
Figure 4 Heatmap of 20 highly differentially methylated loci. Unsupervised hierarchical clustering of 20 DML (rows) in 48 samples (columns)that are shown in Figure 3. These 20 DML represent the most highly differentially methylated loci (Δ b ≤ -0.45 or ≥ 0.45 with FDR 0.01) and/orwhose variation could be explained by tissue type (at least 65%) in our ANOVA models. Location of the tumor (proximal or distal colon) and thedifferentiation of the tumor (moderately differentiated or poorly differentiated) are shown above the heatmap.
Kibriya et al. BMC Medical Genomics 2011, 4:50http://www.biomedcentral.com/1755-8794/4/50
Page 8 of 16
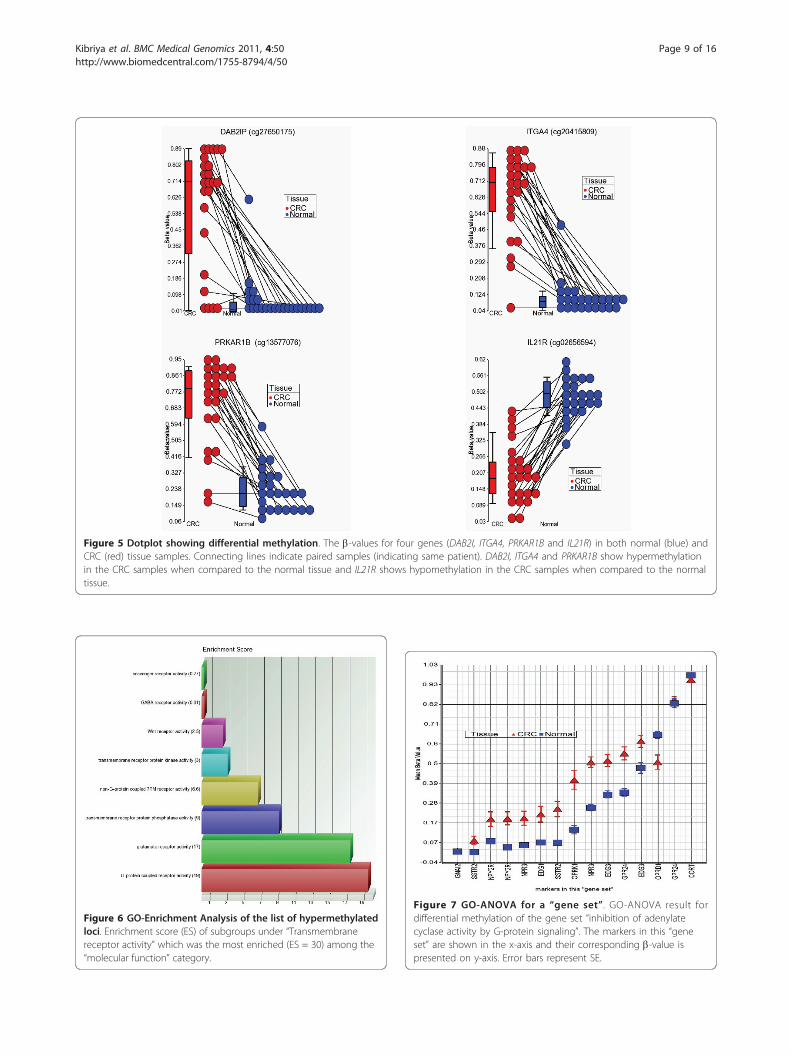
Figure 5 Dotplot showing differential methylation. The b-values for four genes (DAB2I, ITGA4, PRKAR1B and IL21R) in both normal (blue) andCRC (red) tissue samples. Connecting lines indicate paired samples (indicating same patient). DAB2I, ITGA4 and PRKAR1B show hypermethylationin the CRC samples when compared to the normal tissue and IL21R shows hypomethylation in the CRC samples when compared to the normaltissue.
Figure 6 GO-Enrichment Analysis of the list of hypermethylatedloci. Enrichment score (ES) of subgroups under “Transmembranereceptor activity” which was the most enriched (ES = 30) among the“molecular function” category.
Figure 7 GO-ANOVA for a “gene set”. GO-ANOVA result fordifferential methylation of the gene set “inhibition of adenylatecyclase activity by G-protein signaling”. The markers in this “geneset” are shown in the x-axis and their corresponding b-value ispresented on y-axis. Error bars represent SE.
Kibriya et al. BMC Medical Genomics 2011, 4:50http://www.biomedcentral.com/1755-8794/4/50
Page 9 of 16
see that in our assay there were a total of 376 loci cov-ering those genes and 263 of those loci (70%) were alsodifferentially methylated at FDR 0.05 in our data set(Additional File 3 Figure S2B). Therefore, it is importantto take the selection criteria of a list into account whilecomparing the gene list. Hence, our genome-widemethylation assay not only clearly supports most of theprevious findings from the literature, but in addition tothat we found a large number of novel differentiallymethylated loci in CRC tissue compared to surroundinghealthy colon tissue. The complete list of differentiallymethylated loci is presented as additional material(Additional File 1 Table S3) that shows the loci thathave been previously reported as well as the novel locifound in present study. Kim et al. [27] also compiled alist of genes that were reported in the literature to bedifferentially methylated in other clinical samples(serum/plasma or stool) from CRC patients. The authorsreported a total of 19 unique genes (there were 129 lociin the chip we used that covered 18 of these 19 genes)and interestingly 9 (50%) of those genes were also foundin our conservative list of 513 differentially methylatedgenes in CRC. In fact, 63 of the loci covering 14 ofthose 18 genes (77.8%) were significantly differentiallymethylated at FDR 0.05 level.In addition to looking only at CRC methylation sig-
natures in the literature, we also compared our list tothat of hypo- and hyper-methylated genes in cancer asa whole. In a 2009 review, Pogribny et al. compiled alist of 38 unique genes that are reported to be hypo-methylated in different human cancers [28]. Only fourof those (ESR1, HSPE2, TCL1 and TNFRSF8) werecommon in our list, and we found that all four ofthem were found to be hypermethylated to somedegree in CRC in our study. In contrast these fourgenes were reported to be hypomethylated in differentcancers - endometrial carcinoma, prostate cancer, T-cell Lymphocytic leukemia and in Hodgkin lymphomarespectively.
In a2007 review, Esteller et al. [29] compiled a list of47 genes that were reported to be hypermethylated indifferent human cancers. Eight of those (CDH13,CDKN2A, ESR1, TMEFF2, GATA4, SFRP1, TP73 andSOCS3) were common in our list and all were hyper-methylated in CRC in our study.DNA repair genes are known to be important for the
pathogenesis of carcinoma in general. In a review,Ronen and Glickman compiled a list of 261 DNA repairgenes [30]. It was interesting to note that none of these261 genes were common to our list of 513 genes withdifferential methylation in CRC.
Uses of methylation signaturesWe attempted to identify some models for differentiat-ing CRC samples from normal samples based on methy-lation status. The models were identified using a 2-levelnested cross validation method. Though an independentsample set was unavailable for this study, this methodprovided a means to estimate the accuracy of the mod-els that may be expected in an independent set of sam-ples. However we agree that statistical model can notreplace the need of validation in an independent set ofreal samples.The overall idea was to set aside a random set of sam-
ples, and then use the rest of the samples from the pre-sent study to identify an optimal combination of locithat would classify the samples as CRC or normal, andthen to test the expected accuracy and different testcharacteristics [sensitivity, specificity, positive predictivevalue and negative predictive value] of the model in adifferent set of samples that was held out initially.Table 1 shows the summary of different models. Forexample, the model with 4 loci - Illumina ID#cg02656594, cg13577076, cg20415809 and cg27650175 isexpected to correctly predict the diagnosis (normal orCRC) in 94% of the samples. These loci are locatedclose to the transcription start site of the genes IL21R,PRKAR1B, ITGA4 and DAB2IP respectively. It may be
Table 1 Results from two-level nested cross-validation
No. of variables in KNN model Expected test characteristics in another set of data
Accuracy SEN (%) SPEC (%) PPV (%) NPV (%)
4 variables 94.44 91.67 95.83 95.65 92.00
6 variables 92.36 87.50 95.83 95.45 88.46
8 variables 92.36 87.50 95.83 95.45 88.46
10 variables 92.36 87.50 95.83 95.45 88.46
21 variables 93.05 89.58 95.83 95.56 90.20
31 variables 92.36 87.50 95.83 95.45 88.46
41 variables 92.36 89.58 95.83 95.56 90.20
51 variables 93.06 89.58 95.83 95.56 90.20
K-Nearest Neighborhood model with Euclidean distance measure & 3 neighbor was used; SEN: sensitivity; SPEC: specificity; PPV: Positive Predictive Value; NPV:Negative Predictive Value.
Kibriya et al. BMC Medical Genomics 2011, 4:50http://www.biomedcentral.com/1755-8794/4/50
Page 10 of 16

noted that the other models involving more variablesalso give reasonable sensitivity (around 89%), specificity(around 95%), positive predictive value (around 95%)and negative predictive value (around 89%). Therefore,these markers may be considered for clinical application.We also attempted to identify methylation signatures
that could differentiate histopathological findings inCRC. Although the present study was not designed toaddress this issue, we analyzed the 24 CRC samplesusing different phenotypes, including tumor stage,tumor grade, differentiation of the tumor, tumor infiltra-tion by lymphocytes, extracellular mucin and signet ringcell. Irrespective of the histopathological diagnosis (ade-nocarcinoma or mucinous adenocarcinoma) and age atdiagnosis (= <45 yrs vs. >45 yrs), a total of 14 loci weresignificantly differentially methylated in CRC of theproximal colon than those of the distal colon. Unsuper-vised hierarchical clustering of those loci in the CRCsamples is shown in the Additional File 4 Figure S3.GO-Enrichment analysis of these 14 genes showed sig-nificant enrichment of genes related to “gutmorphogenesis”.
Results from q-PCR validationWe selected the top-ranking hypermethylated 12 genes(shown in Figure 3) for validation of the Infiniummethylation platform data using a methyl profiler assay.Assay development was not feasible for PRKAR1B fortechnical reasons and so that gene was replaced by thenext highest-ranking gene, TRH. For validation we usedpaired DNA samples from 10 randomly selected patientsfrom the same sample set. To compare the data from q-PCR to the b-value in the microarray, we added the pro-portion of intermediate methylation and hypermethyla-tion in the q-PCR data to obtain the proportion ofmethylated DNA. Figure 8 and Additional File 1 TableS4 summarizes the differential methylation of these
genes in CRC tissue compared to corresponding adja-cent normal colonic mucosa. It may be noted that 10out of these 12 genes were also found to be significantlyhypermethylated in the q-PCR experiment. Amongthese 10 validated genes, 7 are novel (TRH, C2orf32,FLJ25477, KCNQ5, C1orf165, MDFI and RIC3) and theremaining three (ITGA4, DAB2IP and FLI1) were pre-viously reported by others [9,27]. The correlation coeffi-cients ("r”) also suggest reasonably good correlationbetween the q-PCR data and the microarray data (Addi-tional File 1 Table S4).
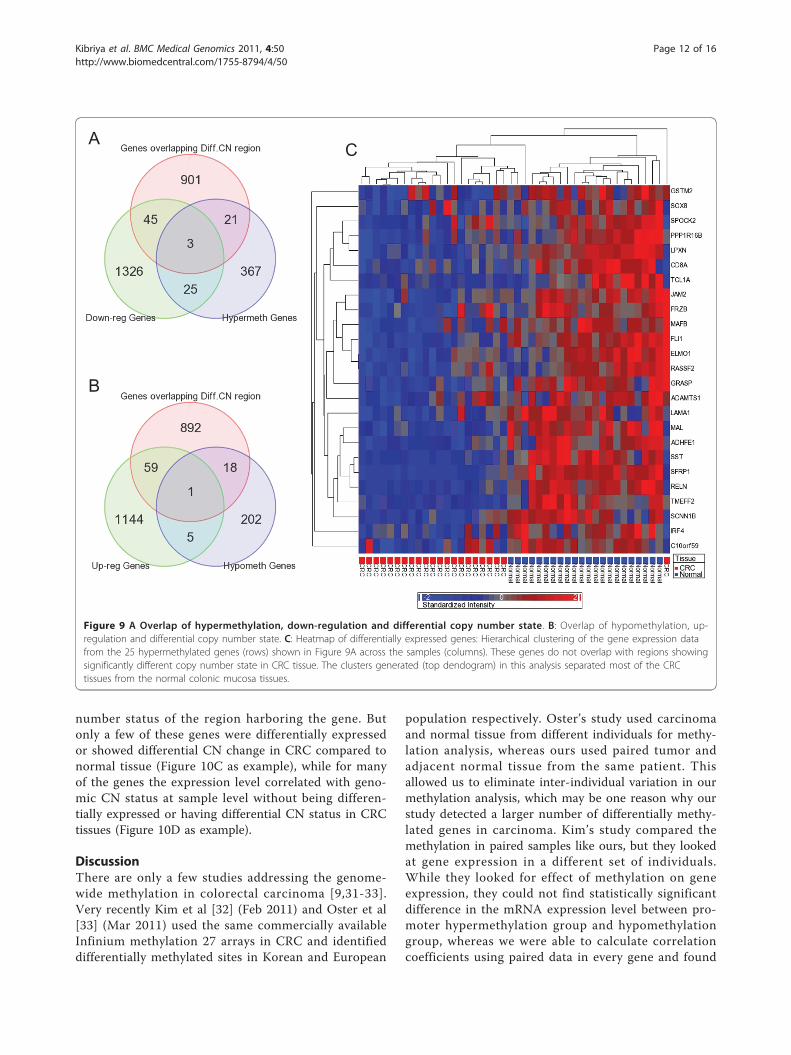
Does the differential methylation status correlate withchromosomal abnormalities and differential geneexpression in CRC?To address this issue, we also did a high density oligo-nucleotide SNP array (610 Quad) to detect cytogenomicabnormalities and a genome-wide gene expression assay(HT12 v4), for the same 24 patients. We detected atotal of 1196 genomic segmentation regions (harboring970 genes), for which the copy number significantly (p <0.05, chi-square test) differs between CRC and normalmucosa. We also detected a total of 1399 down-regu-lated and 1209 up-regulated genes (at least 1.3 fold atFDR 0.01) in CRC compared to normal mucosa. Only28 hypermethylated genes were down-regulated, and 48down-regulated genes were among the genes located ingenomic regions that show significant copy numberchange in CRC compared to normal colonic mucosa(Figure 9A). Similarly, only 6 of the hypomethylatedgenes were up-regulated in CRC, and 60 up-regulatedgenes were among the genes located in genomic regionsthat show significant copy number change in CRC com-pared to normal colonic mucosa (Figure 9B). In otherwords, there are relatively few genes for which eitherdifferential methylation or copy number change alonecan account for the observed changes in gene expres-sion. This clearly depicts the complexity of genomic andepi-genomic interplay in carcinogenesis. Figure 9Cshows the heatmap for gene expression of those 25genes which are down-regulated by hypermethylationirrespective of CN status.In general, statistically significant cis-correlation (with
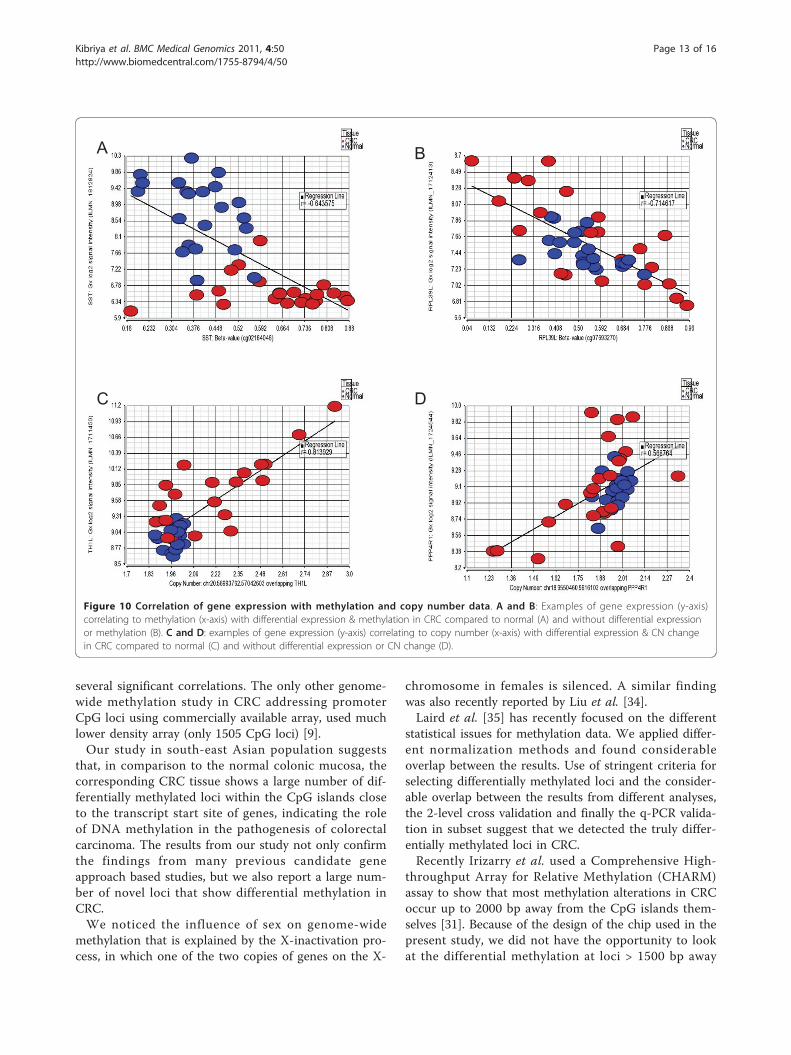
in 2 kb region, with rank correlation p = <0.05) betweenmethylation and gene expression was observed at 704loci. However, only a few of these genes were differen-tially methylated or expressed in CRC compared to nor-mal tissue (Figure 10A as example), while for many ofthe genes the methylation status correlated with geneexpression at sample level without being differentiallymethylated or expressed in CRC tissues (Figure 10B). Inthe same line, we found that in a total of 3850 genomicsegmentation regions, the gene expression was signifi-cantly correlated (rank correlation p = <0.05) to copy
0%
10%
20%
30%
40%
50%
60%
70%
80%
90%
100%
C1o
rf165
_N
C1o
rf165
_CR
C
C2o
rf32_
N
C2o
rf32_
CR
C
DA
B2I
P_N
DAB
2IP
_CR
C
FLJ2
5477
_N
FLJ2
5477
_CR
C
FLI1
_N
FLI1
_CR
C
ITG
A4_
N
ITG
A4_
CR
C
KC
NQ
5_N
KC
NQ
5_C
RC
MD
FI_N
MD
FI_C
RC
RIC
3_N
RIC
3_C
RC
RY
R2_
N
RY
R2_
CR
C
TRH
_N
TRH
_CR
C
ZNF6
25_N
ZNF6
25_C
RC
Gene and tissue source
Mea
n %
DN
A m
ethy
latio
n
Hypermethylation Intermediately Methylation Unmethylation
Figure 8 Validation of methylation by q-PCR. Differentialmethylation of selected genes in CRC tissue (_CRC) compared toadjacent normal colon mucosa (_N), as determined by MethylProfiler q-PCR assay.
Kibriya et al. BMC Medical Genomics 2011, 4:50http://www.biomedcentral.com/1755-8794/4/50
Page 11 of 16
number status of the region harboring the gene. Butonly a few of these genes were differentially expressedor showed differential CN change in CRC compared tonormal tissue (Figure 10C as example), while for manyof the genes the expression level correlated with geno-mic CN status at sample level without being differen-tially expressed or having differential CN status in CRCtissues (Figure 10D as example).
DiscussionThere are only a few studies addressing the genome-wide methylation in colorectal carcinoma [9,31-33].Very recently Kim et al [32] (Feb 2011) and Oster et al[33] (Mar 2011) used the same commercially availableInfinium methylation 27 arrays in CRC and identifieddifferentially methylated sites in Korean and European
population respectively. Oster’s study used carcinomaand normal tissue from different individuals for methy-lation analysis, whereas ours used paired tumor andadjacent normal tissue from the same patient. Thisallowed us to eliminate inter-individual variation in ourmethylation analysis, which may be one reason why ourstudy detected a larger number of differentially methy-lated genes in carcinoma. Kim’s study compared themethylation in paired samples like ours, but they lookedat gene expression in a different set of individuals.While they looked for effect of methylation on geneexpression, they could not find statistically significantdifference in the mRNA expression level between pro-moter hypermethylation group and hypomethylationgroup, whereas we were able to calculate correlationcoefficients using paired data in every gene and found
A
B
C
Figure 9 A Overlap of hypermethylation, down-regulation and differential copy number state. B: Overlap of hypomethylation, up-regulation and differential copy number state. C: Heatmap of differentially expressed genes: Hierarchical clustering of the gene expression datafrom the 25 hypermethylated genes (rows) shown in Figure 9A across the samples (columns). These genes do not overlap with regions showingsignificantly different copy number state in CRC tissue. The clusters generated (top dendogram) in this analysis separated most of the CRCtissues from the normal colonic mucosa tissues.
Kibriya et al. BMC Medical Genomics 2011, 4:50http://www.biomedcentral.com/1755-8794/4/50
Page 12 of 16
several significant correlations. The only other genome-wide methylation study in CRC addressing promoterCpG loci using commercially available array, used muchlower density array (only 1505 CpG loci) [9].Our study in south-east Asian population suggests
that, in comparison to the normal colonic mucosa, thecorresponding CRC tissue shows a large number of dif-ferentially methylated loci within the CpG islands closeto the transcript start site of genes, indicating the roleof DNA methylation in the pathogenesis of colorectalcarcinoma. The results from our study not only confirmthe findings from many previous candidate geneapproach based studies, but we also report a large num-ber of novel loci that show differential methylation inCRC.We noticed the influence of sex on genome-wide
methylation that is explained by the X-inactivation pro-cess, in which one of the two copies of genes on the X-
chromosome in females is silenced. A similar findingwas also recently reported by Liu et al. [34].Laird et al. [35] has recently focused on the different
statistical issues for methylation data. We applied differ-ent normalization methods and found considerableoverlap between the results. Use of stringent criteria forselecting differentially methylated loci and the consider-able overlap between the results from different analyses,the 2-level cross validation and finally the q-PCR valida-tion in subset suggest that we detected the truly differ-entially methylated loci in CRC.Recently Irizarry et al. used a Comprehensive High-
throughput Array for Relative Methylation (CHARM)assay to show that most methylation alterations in CRCoccur up to 2000 bp away from the CpG islands them-selves [31]. Because of the design of the chip used in thepresent study, we did not have the opportunity to lookat the differential methylation at loci > 1500 bp away
A B
C D
Figure 10 Correlation of gene expression with methylation and copy number data. A and B: Examples of gene expression (y-axis)correlating to methylation (x-axis) with differential expression & methylation in CRC compared to normal (A) and without differential expressionor methylation (B). C and D: examples of gene expression (y-axis) correlating to copy number (x-axis) with differential expression & CN changein CRC compared to normal (C) and without differential expression or CN change (D).
Kibriya et al. BMC Medical Genomics 2011, 4:50http://www.biomedcentral.com/1755-8794/4/50
Page 13 of 16
from the TSS. However, similar to results from Irizarryet al. [31], we also found that the hypomethylated lociwere slightly more upstream than the hypermethylatedloci.The cross-validation results are very encouraging as a
potential biomarker, but we have cross-validated only incolon tissues and not in circulating plasma DNA. In thefuture we would like to test the markers in an indepen-dent sample set of circulating plasma or serum DNA inCRC patients and healthy individuals. Recently He et al.[36] selected three methylation markers from the pub-lished literature and tested the practical use of thosemarkers in peripheral blood sample from CRC patients.They found a sensitivity of 81% and a specificity of 90%.We had the advantage of profiling a very large numberof CpG loci in paired CRC and normal colonic mucosatissue, and our 2-level cross validation suggested thatthe four markers could be used as biomarkers withslightly better test characteristics.Tanaka et al. [37] have recently applied an analytical
strategy known as structural equation modeling tounderstanding methylation in CRC. Using a large data-base of over 800 samples, the authors were able to con-struct causality pathways of KRAS and BRAF mutations,as well as various phenotypes, on methylation of specificgenes. This strategy was not feasible for our currentstudy because of our smaller sample size and becausewe had not obtained information on KRAS and BRAFmutations. Nonetheless, it will be valuable for ourplanned future study with an expanded cohort.Illumina’s methylation assay has been compared to
other platforms by others and has shown dependableresults with the correlation ranging from 0.8 to 0.9[32,33,38]. We also have validated the methylation dataform Infinium methylation for 12 of the highly differen-tially methylated genes in our study and also foundsimilar high correlations with Methyl Profiler assay (seeAdditional File 1 Table-S4 and Additional File 5 FigureS4). In another study, reproducibility tests of Infiniummethylation platform was reported to have correlationgreater than 0.98 between technical replicates [39]. Weare aware of the fact that Illumina’s Methylation27 assaydetects the methylation status of on average ~2 CpGsites per gene for most genes. However, for the genesfor which there were multiple CpG loci on the array (e.g. ESR1 or DAB2IP), we found all of the loci to be dif-ferentially methylated in the same direction. We alsovalidated Illumina’s platform in the top-ranking genesby methyl profiler PCR array which is (a) not dependenton bisulfite conversion and also (b) provides an overallmethylation status of the target region as opposed tosingle loci. This paper was focused mainly to look atDML in CRC. However, we have also explored the linkbetween chromosomal abnormalities (copy number),
methylation and gene expression. Regulation of geneexpression is complex and is not dependant only onmethylation status or copy number status. Using inte-gration of molecular cytogenetics, genome-wide copynumber and expression microarray profiling, Camps etal have demonstrated the effect of copy number on geneexpression in CRC [40]. To our knowledge, our study isthe first one to comprehensively look at the genome-wide methylation, copy number and gene expression -all three together in primary CRC tissue. In our study,expression of a small proportion of genes was found tobe correlated to methylation and another small propor-tion was correlated to copy number changes seen inCRC. Although methylation status of many loci couldnot explain the functional relevance to gene expression,these promoters methylation may be used clinically asbiomarkers.
ConclusionsOur genome-wide methylation study in CRC clearlysupports most of the previous findings from the litera-ture, and in addition to that we found a large number ofnovel DML in CRC tissue, some of which may be usedfor clinical application. Further study is warranted toconfirm these findings.
Additional material
Additional File 1: Table S1: Patient characteristics. Table S2: Resultfrom Gene Set Enrichment Analysis (GSEA) and GO-ANOVA. Table S3:Differentially methylated loci (DML) in CRC compared to adjacent normalcolonic mucosa. Table S4: Validation of microarray methylation data byqPCR-based methyl profiler assay of twelve genes in paired samples from10 patients (20 samples).
Additional File 2: Figure S1: Electropherogram of DNA samples.Agilent 2100 BioAnalyzer electropherogram of 10 DNA samples (indifferent colors) overlaid on ladder marker (shown in violet). Size (bp) ofeach peak of the DNA ladder in shown on the top of each peak. Thefigure shows DNA fragment size >10000 bp.
Additional File 3: Figure S2: Volcano plot showing methylationstatus of previously reported genes in our samples. The Delta b isshown on x-axis and ANOVA p-value on the y-axis. A: represents the 245loci covering the previously reported genes mainly from candidate geneapproach-based studies; B: represents the 376 loci covering the 132genes reported from a single study based on genome-wide approach(although testing only 1505 CpG sites). The side bar shows the colorscale depending on Delta b where blue indicates hypomethylation andred indicates hypermethylation in CRC.
Additional File 4: Figure S3: Heatmap of 14 loci that aredifferentially methylated in proximal CRC compared to distal CRC.Unsupervised hierarchical clustering of the 14 loci (rows) in 24 CRCsamples (columns). Thirteen of these loci were hypermethylated inproximal CRC compared to distal CRC. The two major clusters generated(top dendogram) in this analysis separated most of the proximal CRCtissues from the distal CRC tissues. Age at diagnosis (>45 yrs or = <45 yrsand the differentiation of the tumor (moderately differentiated or poorlydifferentiated) are shown above the heatmap.
Additional File 5: Figure S4. Comparison between q-PCR andmicroarray methylation data. Graphs are shown for the 12 genesvalidated by q-PCR. The y-axis plots the b value from microarray data.
Kibriya et al. BMC Medical Genomics 2011, 4:50http://www.biomedcentral.com/1755-8794/4/50
Page 14 of 16

The x-axis plots the proportion of intermediately methylated andhypermethylated DNA.
AcknowledgementsThis work was supported by the National Institutes of Health grants U01CA122171, P30 CA 014599, P42ES010349, R01CA102484, and R01CA107431.
Author details1Department of Health Studies, The University of Chicago, Chicago, IL 60637,USA. 2Bangabandhu Sheikh Mujib Medical University (BSMMU), Dhaka 1000,Bangladesh. 3Columbia University and University of Chicago Research Officein Bangladesh, Dhaka, Bangladesh. 4Department of Human Genetics, TheUniversity of Chicago, Chicago, IL 60637, USA. 5Department of Medicine, TheUniversity of Chicago, Chicago, IL 60637, USA. 6Comprehensive CancerCenter, The University of Chicago, Chicago, IL 60637, USA.
Authors’ contributionsMGK conceived and designed the study, performed data analysis and wrotethe manuscript, FJ designed and carried out the genome-wide methylationassay and drafted the manuscript, MR collected the tissue samples and didthe histopathology, SR processed the tissue samples and carried out thegene expression and validation assay, RPB processed the tissue samples, andhelped in methylation microarray and high density SNP array; RR and CDhelped in manuscript, MRZ helped in sample collection and transportationof the samples to USA, MK organized & supervised the tissue collection andwas responsible for histopathology, HA helped in manuscript, supported andcoordinated the study. All authors read and approved the final manuscript.
Received: 23 March 2011 Accepted: 23 June 2011Published: 23 June 2011
References1. Soon MS, Soon A, Lin TY, Lin OS: Distribution of colon neoplasia in
Chinese patients: implications for endoscopic screening strategies. Eur JGastroenterol Hepatol 2008, 20(7):642-647.
2. Sung JJ, Lau JY, Goh KL, Leung WK: Increasing incidence of colorectalcancer in Asia: implications for screening. Lancet Oncol 2005,6(11):871-876.
3. Vogelstein B, Kinzler KW: Cancer genes and the pathways they control.Nat Med 2004, 10(8):789-799.
4. Jones PA, Baylin SB: The fundamental role of epigenetic events in cancer.Nat Rev Genet 2002, 3(6):415-428.
5. Feinberg AP, Tycko B: The history of cancer epigenetics. Nat Rev Cancer2004, 4(2):143-153.
6. Ogino S, Kawasaki T, Nosho K, Ohnishi M, Suemoto Y, Kirkner GJ, Fuchs CS:LINE-1 hypomethylation is inversely associated with microsatelliteinstability and CpG island methylator phenotype in colorectal cancer. IntJ Cancer 2008, 122(12):2767-2773.
7. Tanaka H, Deng G, Matsuzaki K, Kakar S, Kim GE, Miura S, Sleisenger MH,Kim YS: BRAF mutation, CpG island methylator phenotype andmicrosatellite instability occur more frequently and concordantly inmucinous than non-mucinous colorectal cancer. Int J Cancer 2006,118(11):2765-2771.
8. Weisenberger DJ, Siegmund KD, Campan M, Young J, Long TI, Faasse MA,Kang GH, Widschwendter M, Weener D, Buchanan D, et al: CpG islandmethylator phenotype underlies sporadic microsatellite instability and istightly associated with BRAF mutation in colorectal cancer. Nat Genet2006, 38(7):787-793.
9. Ang PW, Loh M, Liem N, Lim PL, Grieu F, Vaithilingam A, Platell C,Yong WP, Iacopetta B, Soong R: Comprehensive profiling of DNAmethylation in colorectal cancer reveals subgroups with distinctclinicopathological and molecular features. BMC Cancer 2010, 10:227.
10. Aoyagi H, Iida S, Uetake H, Ishikawa T, Takagi Y, Kobayashi H, Higuchi T,Yasuno M, Enomoto M, Sugihara K: Effect of classification based oncombination of mutation and methylation in colorectal cancerprognosis. Oncol Rep 2011.
11. Chang E, Park DI, Kim YJ, Kim BK, Park JH, Kim HJ, Cho YK, Sohn CI,Jeon WK, Kim BI, et al: Detection of colorectal neoplasm using promoter
methylation of ITGA4, SFRP2, and p16 in stool samples: a preliminaryreport in Korean patients. Hepatogastroenterology 2010, 57(101):720-727.
12. Kaneda A, Yagi K: Two groups of DNA methylation markers to classifycolorectal cancer into three epigenotypes. Cancer Sci 2011, 102(1):18-24.
13. Ogino S, Cantor M, Kawasaki T, Brahmandam M, Kirkner GJ,Weisenberger DJ, Campan M, Laird PW, Loda M, Fuchs CS: CpG islandmethylator phenotype (CIMP) of colorectal cancer is best characterisedby quantitative DNA methylation analysis and prospective cohortstudies. Gut 2006, 55(7):1000-1006.
14. Shima K, Nosho K, Baba Y, Cantor M, Meyerhardt JA, Giovannucci EL,Fuchs CS, Ogino S: Prognostic significance of CDKN2A (p16) promotermethylation and loss of expression in 902 colorectal cancers: Cohortstudy and literature review. Int J Cancer 2011, 128(5):1080-1094.
15. Yagi K, Akagi K, Hayashi H, Nagae G, Tsuji S, Isagawa T, Midorikawa Y,Nishimura Y, Sakamoto H, Seto Y, et al: Three DNA methylationepigenotypes in human colorectal cancer. Clin Cancer Res 2010,16(1):21-33.
16. Houshdaran S, Hawley S, Palmer C, Campan M, Olsen MN, Ventura AP,Knudsen BS, Drescher CW, Urban ND, Brown PO, et al: DNA methylationprofiles of ovarian epithelial carcinoma tumors and cell lines. PLoS One2010, 5(2):e9359.
17. Reedy J, Wirfalt E, Flood A, Mitrou PN, Krebs-Smith SM, Kipnis V,Midthune D, Leitzmann M, Hollenbeck A, Schatzkin A, et al: Comparing 3dietary pattern methods–cluster analysis, factor analysis, and indexanalysis–With colorectal cancer risk: The NIH-AARP Diet and HealthStudy. Am J Epidemiol 2010, 171(4):479-487.
18. Ordway JM, Bedell JA, Citek RW, Nunberg A, Garrido A, Kendall R,Stevens JR, Cao D, Doerge RW, Korshunova Y, et al: Comprehensive DNAmethylation profiling in a human cancer genome identifies novelepigenetic targets. Carcinogenesis 2006, 27(12):2409-2423.
19. Downey T: Analysis of a multifactor microarray study using Partekgenomics solution. Methods Enzymol 2006, 411:256-270.
20. Eisenhart C: The assumptions underlying the analysis of variance.Biometrics 1947, 3(1):1-22.
21. Subramanian A, Tamayo P, Mootha VK, Mukherjee S, Ebert BL, Gillette MA,Paulovich A, Pomeroy SL, Golub TR, Lander ES, et al: Gene set enrichmentanalysis: a knowledge-based approach for interpreting genome-wideexpression profiles. Proc Natl Acad Sci USA 2005, 102(43):15545-15550.
22. Tibshirani RJ, Efron B: Pre-validation and inference in microarrays. StatAppl Genet Mol Biol 2002, 1:Article1.
23. Edgar R, Domrachev M, Lash AE: Gene Expression Omnibus: NCBI geneexpression and hybridization array data repository. Nucleic Acids Res 2002,30(1):207-210.
24. Xie D, Gore C, Liu J, Pong RC, Mason R, Hao G, Long M, Kabbani W, Yu L,Zhang H, et al: Role of DAB2IP in modulating epithelial-to-mesenchymaltransition and prostate cancer metastasis. Proc Natl Acad Sci USA 2010,107(6):2485-2490.
25. Xie D, Gore C, Zhou J, Pong RC, Zhang H, Yu L, Vessella RL, Min W,Hsieh JT: DAB2IP coordinates both PI3K-Akt and ASK1 pathways for cellsurvival and apoptosis. Proc Natl Acad Sci USA 2009, 106(47):19878-19883.
26. Garmy-Susini B, Avraamides CJ, Schmid MC, Foubert P, Ellies LG, Barnes L,Feral C, Papayannopoulou T, Lowy A, Blair SL, et al: Integrin alpha4beta1signaling is required for lymphangiogenesis and tumor metastasis.Cancer Res 2010, 70(8):3042-3051.
27. Kim MS, Lee J, Sidransky D: DNA methylation markers in colorectalcancer. Cancer Metastasis Rev 2010, 29(1):181-206.
28. Pogribny IP, Beland FA: DNA hypomethylation in the origin andpathogenesis of human diseases. Cell Mol Life Sci 2009, 66(14):2249-2261.
29. Esteller M: Cancer epigenomics: DNA methylomes and histone-modification maps. Nat Rev Genet 2007, 8(4):286-298.
30. Ronen A, Glickman BW: Human DNA repair genes. Environ Mol Mutagen2001, 37(3):241-283.
31. Irizarry RA, Ladd-Acosta C, Wen B, Wu Z, Montano C, Onyango P, Cui H,Gabo K, Rongione M, Webster M, et al: The human colon cancermethylome shows similar hypo- and hypermethylation at conservedtissue-specific CpG island shores. Nat Genet 2009, 41(2):178-186.
32. Kim YH, Lee HC, Kim SY, Yeom YI, Ryu KJ, Min BH, Kim DH, Son HJ,Rhee PL, Kim JJ, et al: Epigenomic Analysis of Aberrantly MethylatedGenes in Colorectal Cancer Identifies Genes Commonly Affected byEpigenetic Alterations. Ann Surg Oncol 2011.
Kibriya et al. BMC Medical Genomics 2011, 4:50http://www.biomedcentral.com/1755-8794/4/50
Page 15 of 16
33. Oster B, Thorsen K, Lamy P, Wojdacz TK, Hansen LL, Birkenkamp-Demtroder K, Sorensen KD, Laurberg S, Orntoft TF, Andersen CL:Identification and validation of highly frequent CpG islandhypermethylation in colorectal adenomas and carcinomas. Int J Cancer2011.
34. Liu J, Morgan M, Hutchison K, Calhoun VD: A study of the influence of sexon genome wide methylation. PLoS One 2010, 5(4):e10028.
35. Laird PW: Principles and challenges of genome-wide DNA methylationanalysis. Nat Rev Genet 2010, 11(3):191-203.
36. He Q, Chen HY, Bai EQ, Luo YX, Fu RJ, He YS, Jiang J, Wang HQ:Development of a multiplex MethyLight assay for the detection ofmultigene methylation in human colorectal cancer. Cancer GenetCytogenet 2010, 202(1):1-10.
37. Tanaka N, Huttenhower C, Nosho K, Baba Y, Shima K, Quackenbush J,Haigis KM, Giovannucci E, Fuchs CS, Ogino S: Novel application ofstructural equation modeling to correlation structure analysis of CpGisland methylation in colorectal cancer. Am J Pathol 2010,177(6):2731-2740.
38. Bock C, Tomazou EM, Brinkman AB, Muller F, Simmer F, Gu H, Jager N,Gnirke A, Stunnenberg HG, Meissner A: Quantitative comparison ofgenome-wide DNA methylation mapping technologies. Nat Biotechnol2010, 28(10):1106-1114.
39. Weisenberger, D. J. Comprehensive DNA methylation analysis on theIllumina Infinium assay platform (Illumina, San Diego, California, USA,2008). [http://www.illumina.com/Documents/products/appnotes/appnote_infinium_methylation.pdf].
40. Camps J, Nguyen QT, Padilla-Nash HM, Knutsen T, McNeil NE, Wangsa D,Hummon AB, Grade M, Ried T, Difilippantonio MJ: Integrative genomicsreveals mechanisms of copy number alterations responsible fortranscriptional deregulation in colorectal cancer. Genes ChromosomesCancer 2009, 48(11):1002-1017.
Pre-publication historyThe pre-publication history for this paper can be accessed here:http://www.biomedcentral.com/1755-8794/4/50/prepub
doi:10.1186/1755-8794-4-50Cite this article as: Kibriya et al.: A genome-wide DNA methylationstudy in colorectal carcinoma. BMC Medical Genomics 2011 4:50.
Submit your next manuscript to BioMed Centraland take full advantage of:
• Convenient online submission
• Thorough peer review
• No space constraints or color figure charges
• Immediate publication on acceptance
• Inclusion in PubMed, CAS, Scopus and Google Scholar
• Research which is freely available for redistribution
Submit your manuscript at www.biomedcentral.com/submit
Kibriya et al. BMC Medical Genomics 2011, 4:50http://www.biomedcentral.com/1755-8794/4/50
Page 16 of 16