
BIOLOGY - Study of Life - Homevarunyilunusabowebsite.weebly.com/uploads/3/7/5/4/...Page 2 of 35 2011...
35
Page 1 of 35 2011 Biology National Qualifying Examination Australian Science Innovations ABN 81731558309 BIOLOGY 2011 National Qualifying Examination Time Allowed: Reading Time: 10 minutes Examination Time: 120 minutes INSTRUCTIONS Attempt ALL questions in ALL sections of this paper. Permitted materials: Non-programmable, non-graphical calculator, pens, pencils, erasers and a ruler. Answer SECTIONS A and B on the Multiple Choice Answer Sheet provided. Use a pencil. Answer SECTION C in the answer booklet provided. Write in pen and use pencil only for graphs. Ensure that your diagrams are clear and labelled. All numerical answers must have correct units. Marks will not be deducted for incorrect answers. Do not write on this question paper. It will not be marked. MARKS SECTION A 43 multiple choice questions 43 marks SECTION B 22 short answer questions 20 marks SECTION C 5 written answer questions 42 marks Total marks for the paper 105 marks
Transcript of BIOLOGY - Study of Life - Homevarunyilunusabowebsite.weebly.com/uploads/3/7/5/4/...Page 2 of 35 2011...

Page 1 of 35
2011 Biology National Qualifying Examination
Australian Science Innovations ABN 81731558309
BIOLOGY
2011 National Qualifying Examination
Time Allowed:
Reading Time: 10 minutes
Examination Time: 120 minutes
INSTRUCTIONS
Attempt ALL questions in ALL sections of this paper.
Permitted materials: Non-programmable, non-graphical calculator, pens, pencils,
erasers and a ruler.
Answer SECTIONS A and B on the Multiple Choice Answer Sheet provided. Use a
pencil.
Answer SECTION C in the answer booklet provided. Write in pen and use pencil
only for graphs.
Ensure that your diagrams are clear and labelled.
All numerical answers must have correct units.
Marks will not be deducted for incorrect answers.
Do not write on this question paper. It will not be marked.
MARKS
SECTION A 43 multiple choice questions 43 marks
SECTION B 22 short answer questions 20 marks
SECTION C 5 written answer questions 42 marks
Total marks for the paper 105 marks

Page 2 of 35
2011 Biology National Qualifying Examination
Australian Science Innovations ABN 81731558309
SECTION A: MULTIPLE CHOICE
USE THE ANSWER SHEET PROVIDED
1. Which of the following would be found in an animal cell but not in a bacterial cell?
a. DNA.
b. Cell wall.
c. Ribosomes.
d. Plasma membrane.
e. Endoplasmic reticulum.
2. Which of the following is true of an amino acid and starch? Both:
a. contain nitrogen.
b. contain oxygen.
c. are found in proteins.
d. are large polymers.
e. are the functional components of lipids.
3. Which element occurs in nucleic acids but not in carbohydrates?
a. Phosphorous.
b. Sulfur.
c. Carbon.
d. Iron.
e. Hydrogen.

Page 3 of 35
2011 Biology National Qualifying Examination
Australian Science Innovations ABN 81731558309
4. Hydrophilic substances are ________________, whereas hydrophobic substances are
________________
a. water-fearing; water-loving.
b. non-polar; polar.
c. soluble in water; soluble in lipid.
d. charged; neutral.
e. hydrogen bonding; non-hydrogen bonding.
5. Cellulose is a major carbohydrate component of plant cell walls. Most animals are unable to
digest cellulose whilst they can digest other carbohydrate polymers such as starch. What is
the correct explanation for this?
a. There are many hydrogen bonds holding the subunits together.
b. Cellulose is made up of chitin, which is indigestible.
c. The bonds holding cellulose subunits together are stronger than those in any other
macromolecule.
d. They don't have the correct enzyme to break the bonds between the cellulose
subunits.
6. You are conducting an experiment to test the hypothesis that dairy cows will give more milk
during milking if they are listening to classical music. Your 20 experimental cows listen to
classical music during milking; you collect all their milk and measure how much there is.
Your 20 control cows should experience identical experimental conditions except that they
should:
a. listen to classical music at a louder volume.
b. listen to classical music all the time, not just during milking.
c. listen to a different type of music, like heavy metal.
d. not listen to any music.
e. not be milked.
Page 4 of 35
2011 Biology National Qualifying Examination
Australian Science Innovations ABN 81731558309
7. Two animal cells were placed in a 0.5% sucrose solution. Initially both cells started to
increase in size. However, cell A soon ceased to enlarge whilst Cell B increased in size until it
burst. Which statement was true at the start of the experiment?
a. Cell A was hypotonic to the solution and cell B was hypertonic.
b. Cell A was hypertonic to cell B.
c. Cell A was hypertonic to the solution and cell B was hypotonic.
d. Cell B was hypertonic to cell A.
8. A plant suspension was prepared by grinding up plant material. The component parts were
then separated via centrifugation. At the end of this process, there was a layer of sediment at
the bottom of the test tube covered by an aqueous solution. Organelles found in the sediment
took up carbon dioxide and produced oxygen when illuminated. The organelles are likely to
be:
a. ribosomes.
b. mitochondria.
c. nuclei.
d. chloroplasts.
e. endoplasmic reticulum.
9. A species of insect was found to have developed resistance to a commonly used insecticide.
Which of the following is the most likely explanation?
a. The insecticide caused development of resistance in the insects.
b. The original gene pool included genes that conferred resistance to the insecticide.
c. The insecticide stimulated development of resistance in certain individuals and this was
inherited.
d. The insecticide caused a mutation that conferred resistance and this was inherited.

Page 5 of 35
2011 Biology National Qualifying Examination
Australian Science Innovations ABN 81731558309
Use the following information to answer questions 10-14
In an experiment to test the hypothesis that leaves need both light and chlorophyll to make starch,
a stencil was fixed to both sides of a leaf of a variegated geranium plant as shown.
The hole cut in the stencil was covered by a small piece of transparent sellotape. As a result of this
treatment, the leaf had been divided into FIVE parts experiencing different conditions, the
positions of which are indicated by the letters V – Z in the diagram above.
V contained chlorophyll but was in darkness.
W contained chlorophyll and was open to the light but was covered with sellotape.
X contained chlorophyll and was open to the light but not covered with sellotape.
Y had no chlorophyll and was open to the light.
Z had no chlorophyll and was in darkness.
The plant was then left in bright light for 48 hours, after which the stencil was removed and the
leaf tested for starch.
10. Which of the diagrams A - E would indicate the appearance of the leaf after testing for starch?
(Note: Starch positive = grey area)

Page 6 of 35
2011 Biology National Qualifying Examination
Australian Science Innovations ABN 81731558309
11. The purpose of the sellotape covering over the hole in the stencil was to
a. protect the leaf from excessive light.
b. prevent the part of the leaf under the stencil from drying out.
c. reflect excessive light.
d. ensure an equal air supply to the illuminated and darkened parts of the leaf .
e. prevent too much carbon dioxide from reaching the leaf.
12. After testing for starch, which two parts of the leaf would you have to compare in order to
decide whether light is necessary for the leaf to make starch?
a. V and W.
b. W and X.
c. V and Y.
d. W and Y.
e. X and Y.
13. After testing for starch, which two parts of the leaf would you have to compare in order to
decide whether chlorophyll is necessary for the leaf to make starch?
a. V and W.
b. W and X.
c. V and Y.
d. W and Y.
e. X and Y.

Page 7 of 35
2011 Biology National Qualifying Examination
Australian Science Innovations ABN 81731558309
14. An ‘L’-shaped area was painted on the lower side of a de-starched leaf using clear nail
varnish. A few centimetres away from the ‘L’, a ‘U’ shape was painted on the upper surface
of the same leaf. The leaf was then exposed to bright light for 4 hours and tested for starch.
Which of the following diagrams would show the appearance of the leaf? (The leaf is shown
from above).
15. If a molecule of carbon dioxide released into the blood in your left foot travels out of your
nose, it must pass through all of the following structures except the:
a. right atrium.
b. pulmonary vein.
c. alveolus.
d. bronchus.
e. pulmonary artery.
16. Which of the following can children only inherit from their mother? A mutation:
a. on the X chromosome.
b. on the Y chromosome.
c. in the mitochondrial genome.
d. in the chloroplast genome.
e. in the ribosomal RNA.

Page 8 of 35
2011 Biology National Qualifying Examination
Australian Science Innovations ABN 81731558309
17. We often draw upon the idea of similarities between species to support an argument for
evolution. Which of the following pairs are analogous structures?
a. The front leg of a horse and a human arm.
b. The front leg of a frog and a bat wing.
c. The wing of a bird and a bat wing.
d. The front flipper of a porpoise and a human arm.
e. The wing of a bird and a butterfly wing.
Use the following information to answer questions 18-19
The table below shows the production in two ecosystems in the temperate zone: a rainforest and a
field with an annual crop. All results are stated in MJ/m2 / year (1 MJ = 10
6J).
[I] Rainforest [II] Field with an annual crop
Gross Primary Production (GPP) 188 102
Respiration (autotrophs) 134 38
Respiration (heterotrophs) 53 3
18. Of these two ecosystems, which has a higher ratio of respiration by heterotrophic organisms to
net primary production (NPP)?
a. I.
b. II.
c. They are the same.
19. What is the reason?
a. The rainforest has larger GPP and more consumers than the crop field.
b. The rainforest has larger NPP and more consumers than the crop field.
c. The rainforest has smaller GPP and more consumers than the crop field.
d. The rainforest has smaller NPP and more consumers than the crop field.
e. The rainforest has smaller NPP and less consumers than the crop field.
Page 9 of 35
2011 Biology National Qualifying Examination
Australian Science Innovations ABN 81731558309
20. The energy input into food webs typically depends upon which of the following factors?
a. The extent of grazing of the primary consumers.
b. The mineral cycling efficiency of the whole ecosystem.
c. The efficiency of producers converting solar radiation energy into chemical energy.
d. The action of nitrogen-fixing bacteria.
e. The amount of energy lost as heat at each trophic level.
21. A particular flower farm has four rows of flowers. Each row has fives pots. The farm produces
yellow, red, green and blue flowers. There must be blue flowers in each row to attract bees,
and yellow flowers must be in groups of two or more, and there are more pots of red flowers
in the middle two rows than in the outer two rows. The farm produces an equal amount of
each flower colour. Which cannot be a combination of the middle two rows?
a. YYRBB and GGRRB.
b. YYRRB and YYYRR.
c. BYYYY and RRRRB.
d. GRRBG and GRRBG.

Page 10 of 35
2011 Biology National Qualifying Examination
Australian Science Innovations ABN 81731558309
22. The phenotypes of three experimental populations of plants are shown in the following
graphs.
The three populations X, Y and Z represent, respectively, the:
a. F1, F2 and F3 generations.
b. P, F1 and F2 generations.
c. F2, P and F1 generations.
d. F3, F1 and F2 generations.
Height
Rela
tiv
e f
req
uen
cy
Rela
tiv
e f
req
uen
cy
Height
Rela
tiv
e f
req
uen
cy
Height
X Y Z

Page 11 of 35
2011 Biology National Qualifying Examination
Australian Science Innovations ABN 81731558309
Use the following information to answer questions 23-25.
The diagram below shows the Miller-Urey experimental set up to test the Oparin-Haldane
hypothesis about the origin of life on earth.
From http://upload.wikimedia.org/wikipedia/commons/thumb/5/54/Miller-Urey_experiment-en.svg/500px-Miller-Urey_experiment-
en.svg.png
23. What was the source of energy in this experiment?
a. Ultraviolet light.
b. Lightning.
c. Electrical spark.
d. Radioactivity.

Page 12 of 35
2011 Biology National Qualifying Examination
Australian Science Innovations ABN 81731558309
24. Which of the gases in the ‘primitive atmosphere’ gave rise to amino acids in the cooled water
a week after the experiment had started?
a. Carbon monoxide and methane.
b. Carbon monoxide and water.
c. Methane and ammonia.
d. Hydrogen and ammonia.
25. One of the elements NOT present in the original Miller-Urey experiment but thought to be
abundant in the early earth’s formation is:
a. Hydrogen.
b. Carbon monoxide.
c. Nitrogen.
d. Sulfur.

Page 13 of 35
2011 Biology National Qualifying Examination
Australian Science Innovations ABN 81731558309
26. Coefficient of relatedness' (or 'genetic relatedness') refers to the probability of two related
individuals inheriting a particular allele of a single gene from their common ancestor.
In this family tree of diploid individuals, which of the following 'coefficient of relatedness' is
not true? Coefficient of relatedness of:
a. A being 1/2.
b. B being 1/2.
c. C being 1/4.
d. D being 1.
e. E being 1/4.

Page 14 of 35
2011 Biology National Qualifying Examination
Australian Science Innovations ABN 81731558309
Use the following information to answer questions 27-28.
The diagram below depicts the exit of nerves from different areas of the spinal cord.
.
It is known that:
sensory information from the skin on the left side of the body ascends through the left
side of the spinal cord.
pain information from the skin on the left side of the body ascends through the right side
of the spinal cord.
motor neurons on the left side of the spinal cord control contraction on the left side of the
body.
the upper limbs are innervated by nerves exiting the spinal cord in the cervical region.

Page 15 of 35
2011 Biology National Qualifying Examination
Australian Science Innovations ABN 81731558309
27. From this information, which of the following statements is plausible regarding the motor
and/or sensory function of a patient who has injured the left side of the spinal cord at T4?
a. Abnormal touch sensation in the right foot.
b. Impaired movement of the right leg.
c. Normal pain perception in the left leg.
d. No cutaneous sensation in the left hand
e. Impaired pain perception in the right arm.
28. A patient that feels no pain when a pin is inserted into their left big toe has damage to:
a. nerves exiting the spinal cord at C6.
b. nerves entering the spinal cord C6.
c. the left side of the spinal cord at T1.
d. the right side of the spinal cord at T5.
e. the left side of the spinal cord at S4.

Page 16 of 35
2011 Biology National Qualifying Examination
Australian Science Innovations ABN 81731558309
29. Some fruit flies (Drosophila melanogaster) have a mutation that makes them shake. These
fruit flies are called ‘shakers’. An experimental cross to determine the pattern of inheritance of
this mutation is shown below:
What kind of inheritance best explains the inheritance pattern for the shaker gene?
a. Somatic dominant.
b. Somatic recessive.
c. X-linked recessive.
d. X-linked dominant.
e. Y-linked dominant.

Page 17 of 35
2011 Biology National Qualifying Examination
Australian Science Innovations ABN 81731558309
Use the following information to answer question 30 on the following page.
Within a particular ecosystem there are 4 moth species known as Species A, 1, 2 and 3. Moth
species A is palatable to predators such as birds. Moth species 1, 2 and 3 (pictured below), are
unpalatable to the same predators and after capturing and tasting species 1, 2 and 3, birds learn to
avoid eating them.
Within species A there is variation in body pigmentation such that lighter individuals resemble
species 1, individuals with intermediate pigmentation resemble species 2 and individuals with
darker pigmentation resemble species 3. The diagram below depicts the frequency of body
pigmentation phenotypes within Species A in this ecosystem.
Increasing pigmentation

Page 18 of 35
2011 Biology National Qualifying Examination
Australian Science Innovations ABN 81731558309
30. If Species 3 was to become the most abundant moth species within this ecosystem which of the
following graphs would most accurately represent the resulting frequencies of pigmentation
phenotypes in species A? (The dotted line shows the location of the original mean pigmentation).
A
.
B
.
C D
E
Page 19 of 35
2011 Biology National Qualifying Examination
Australian Science Innovations ABN 81731558309
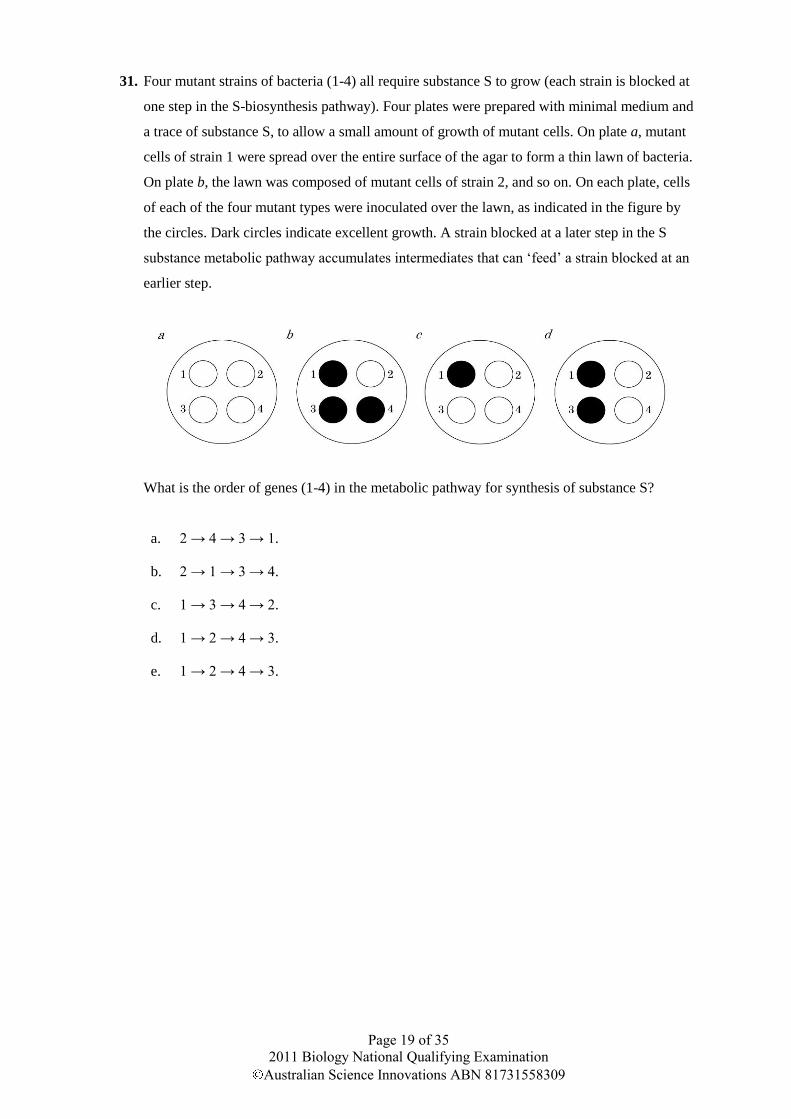
31. Four mutant strains of bacteria (1-4) all require substance S to grow (each strain is blocked at
one step in the S-biosynthesis pathway). Four plates were prepared with minimal medium and
a trace of substance S, to allow a small amount of growth of mutant cells. On plate a, mutant
cells of strain 1 were spread over the entire surface of the agar to form a thin lawn of bacteria.
On plate b, the lawn was composed of mutant cells of strain 2, and so on. On each plate, cells
of each of the four mutant types were inoculated over the lawn, as indicated in the figure by
the circles. Dark circles indicate excellent growth. A strain blocked at a later step in the S
substance metabolic pathway accumulates intermediates that can ‘feed’ a strain blocked at an
earlier step.
What is the order of genes (1-4) in the metabolic pathway for synthesis of substance S?
a. 2 → 4 → 3 → 1.
b. 2 → 1 → 3 → 4.
c. 1 → 3 → 4 → 2.
d. 1 → 2 → 4 → 3.
e. 1 → 2 → 4 → 3.

Page 20 of 35
2011 Biology National Qualifying Examination
Australian Science Innovations ABN 81731558309
Use the following information to answer questions 32-33
In general, arsenic is considered to be very poisonous to living things. In the past, it was used in
paints, skin creams, and medicinal treatments for some infections before the advent of penicillin.
Arsenic has been associated with many premature deaths including that of Cezanne, an artist who
worked with Emerald Green, an arsenic-rich pigment.
In biological systems, arsenic inhibits essential enzymes in the body. A recent paper by Wolfe-
Simon in the journal Science (December 2010) presented evidence that bacteria from the arsenic-
rich Lake Mono could grow in vitro in a medium with no phosphorous. It appeared that some
bacteria were able to ‘replace’ phosphorous with arsenic. The scientific world reacted to the
publication as it was a controversial finding.
32. In which macromolecules would you expect to see arsenic in these ‘arsenic bacteria’?
a. Carbohydrates.
b. Lipids.
c. Proteins.
d. DNA.
33. The scientific world was so surprised to learn about the ‘arsenic bacteria’ apparently living in
Lake Mono because it suggested that:
a. an environment considered hostile to life due to the presence of poisonous arsenic
could support living organisms.
b. bacteria incorporated the arsenic into a variety of macromolecules in their cells.
c. these bacteria may provide evidence of different life forms originated from outer
space.
d. other life forms that do not depend on phosphorous have evolved on earth.
Page 21 of 35
2011 Biology National Qualifying Examination
Australian Science Innovations ABN 81731558309
34. In pea plants, the allele for green colour of seeds (G) is dominant over that for yellow colour
(g) while the allele for round seeds (R) is dominant over that for wrinkled seed (r). The results
of an experimental cross with such garden pea plants are tabulated below:
Seed phenotype Number
Green and round 32
Green and wrinkled 28
Yellow and round 12
Yellow and wrinkled 9
The parental genotypes are most likely to be:
a. GgRr and Ggrr.
b. Ggrr and GgRR.
c. GgRr and GgRr.
d. GgRR and ggRr.
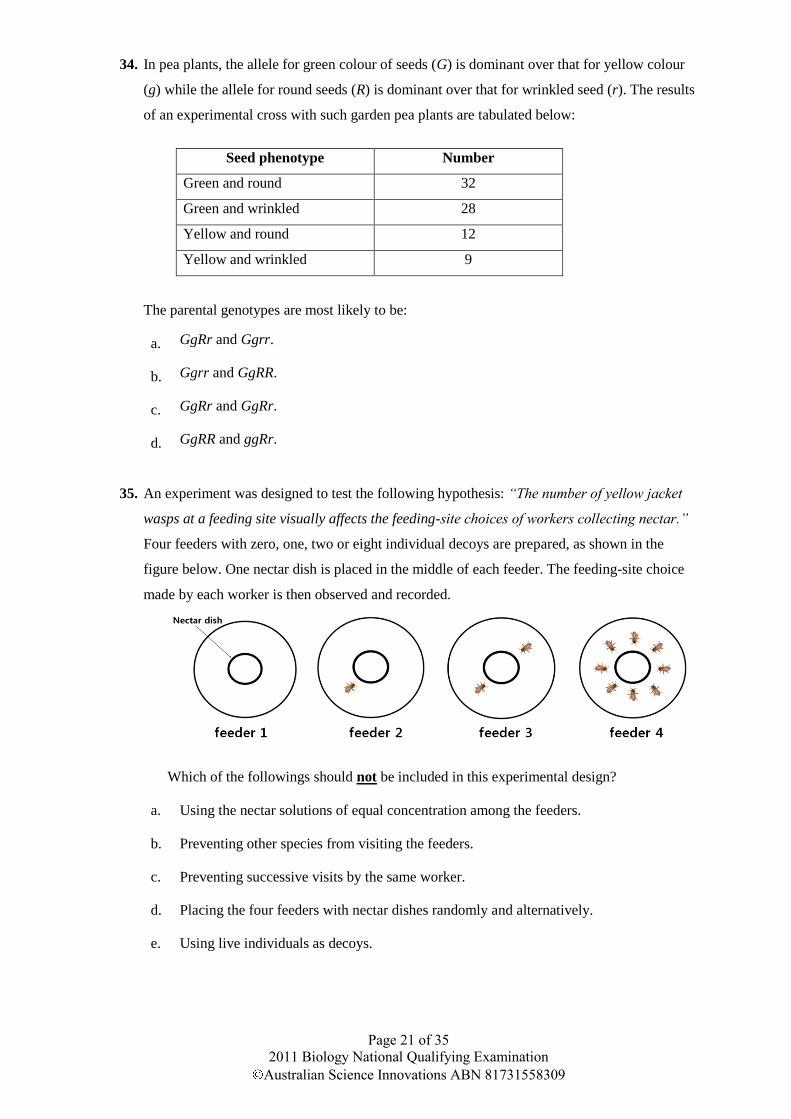
35. An experiment was designed to test the following hypothesis: “The number of yellow jacket
wasps at a feeding site visually affects the feeding-site choices of workers collecting nectar.”
Four feeders with zero, one, two or eight individual decoys are prepared, as shown in the
figure below. One nectar dish is placed in the middle of each feeder. The feeding-site choice
made by each worker is then observed and recorded.
Which of the followings should not be included in this experimental design?
a. Using the nectar solutions of equal concentration among the feeders.
b. Preventing other species from visiting the feeders.
c. Preventing successive visits by the same worker.
d. Placing the four feeders with nectar dishes randomly and alternatively.
e. Using live individuals as decoys.

Page 22 of 35
2011 Biology National Qualifying Examination
Australian Science Innovations ABN 81731558309
36. An ecologist is comparing the growth of a herbaceous plant species growing in two different
sites; A and B. To compare the populations from the two sites, she has harvested 30
individuals from each site, then measured the root length, root biomass, and shoot biomass of
each individual. A summary of those measurements are as follows:
Location Mean root length
(cm) Mean root biomass
(g) Mean shoot biomass
(g)
Site A 27.2 + 0.2 348.7 + 0.5 680.7 + 0.1
Site B 13.4 + 0.3 322.4 + 0.6 708.9 + 0.2
Based on the data presented, which of the following statements is likely to be true?
a. Soil water availability is lower in Site B than in Site A.
b. Plant productivity is higher in Site A than in Site B.
c. Soil water availability is lower in Site A than in Site B.
d. Soil nutrient availability is lower in Site B than in Site A.
37. Excessive hairiness, or hypertrichosis, used to be known as the werewolf syndrome. A mild
example is hairiness of the ear, inherited as an X-linked dominant trait in humans. If a man
with mild hypertrichosis marries a woman without hypertrichosis, what types of children may
they have?
a. All of their children of both sexes have hypertrichosis.
b. All the sons have hypertrichosis, but none of their daughters.
c. Half of their sons, but none of their daughters will have hypertrichosis.
d. All the daughters have hypertrichosis, but none of their sons.
e. Half of their daughters have hypertrichosis, and half of their sons.

Page 23 of 35
2011 Biology National Qualifying Examination
Australian Science Innovations ABN 81731558309
38. DNA helicase, a key enzyme for DNA replication, separates double-stranded DNA into
single-stranded DNA. The following describes an experiment to find out the characteristics of
this enzyme.
A linear 6 kb ssDNA was annealed with a short (300 bp) complementary ssDNA that is
labeled with radioactive nucleotides as shown in a. The annealed DNA was then treated in one
of three ways:
o with DNA helicase.
o boiling without helicase.
o boiled helicase.
DNA fragments in the treated samples were separated using gel electrophoresis on an agarose
gel. (Note: shorter fragments of DNA migrate more rapidly through the gel). The gel in b
shows the DNA bands that could be detected in the gel by autoradiography. Note: assume that
the ATP required for the reaction has been provided.
Which of the following explanation about this experiment is correct?
a. The band appearing in the top part of the gel is the 6.3 kb ssDNA only.
b. The band appearing in the lower part of the gel is the labelled 300 bp DNA.
c. If the annealed DNA is treated only with DNA helicase and the reaction is complete,
the band pattern looks like the lane 3 in b.
d. If the annealed DNA is treated only with DNA helicase and the reaction is complete,
the band pattern looks like the lane 2 in b.
e. If the annealed DNA is treated only with boiled helicase, the band pattern will
look like lane 1 in b.

Page 24 of 35
2011 Biology National Qualifying Examination
Australian Science Innovations ABN 81731558309
39. Plants are known to have a day / night cycle, called photoperiodism. One of the plant
photoreceptors involved in photoperiodism is phytochrome. This exists in two different forms:
red-light absorbing Pr and far-red light absorbing Pfr. An investigation explored how plant
flowering was affected by different light flashes [white (W), red (R), or far-red (FR) light]
applied during the dark period. It also looked at the affect of darkness during the light-period.
The figure below shows the experimental results for all scenarios tested except 4 and 5.
Based on these results, select the most accurate explanation (or expectation) for the control of
flowering in this plant. This plant:
a. flowers whenever the total dark time experiences within 24 hours exceeds a 12 hr
threshold.
b. is likely to be a short-day plant that requires a certain length of uninterrupted light period
for flowering.
c. will flower in experiment 3 if it is irradiated with a flash of far-red light, instead of
white.
d. will flower in experiment 4.
e. will not flower in experiment 5.

Page 25 of 35
2011 Biology National Qualifying Examination
Australian Science Innovations ABN 81731558309
Use the following information to answer questions 40 - 43.
The table below shows the data on breathing rate, heart rate and body temperature, of four
different mammals; A, B, C, and D.
Study the data and determine which of these animals has the greatest and lowest surface area per
unit volume as well as the total volume of blood. Indicate your conclusions by filling in the boxes
in the answer sheet with appropriate letters (A to D).
40. Which animal has the highest surface area to volume ratio?
41. Which animal has the lowest surface area to volume ratio?
42. Which animal has the greatest volume of blood in the body?
43. Which animal has the lowest volume of blood in the body?
Animals Breathing rate
(inhalations/min)
Heart rate
(beats/min) Body temperature (°C)
A. 160 500 36.5
B. 15 40 37.2
C. 28 190 38.2
D. 8 28 35.9
Page 26 of 35
2011 Biology National Qualifying Examination
Australian Science Innovations ABN 81731558309
SECTION B
USE THE ANSWER SHEET PROVIDED
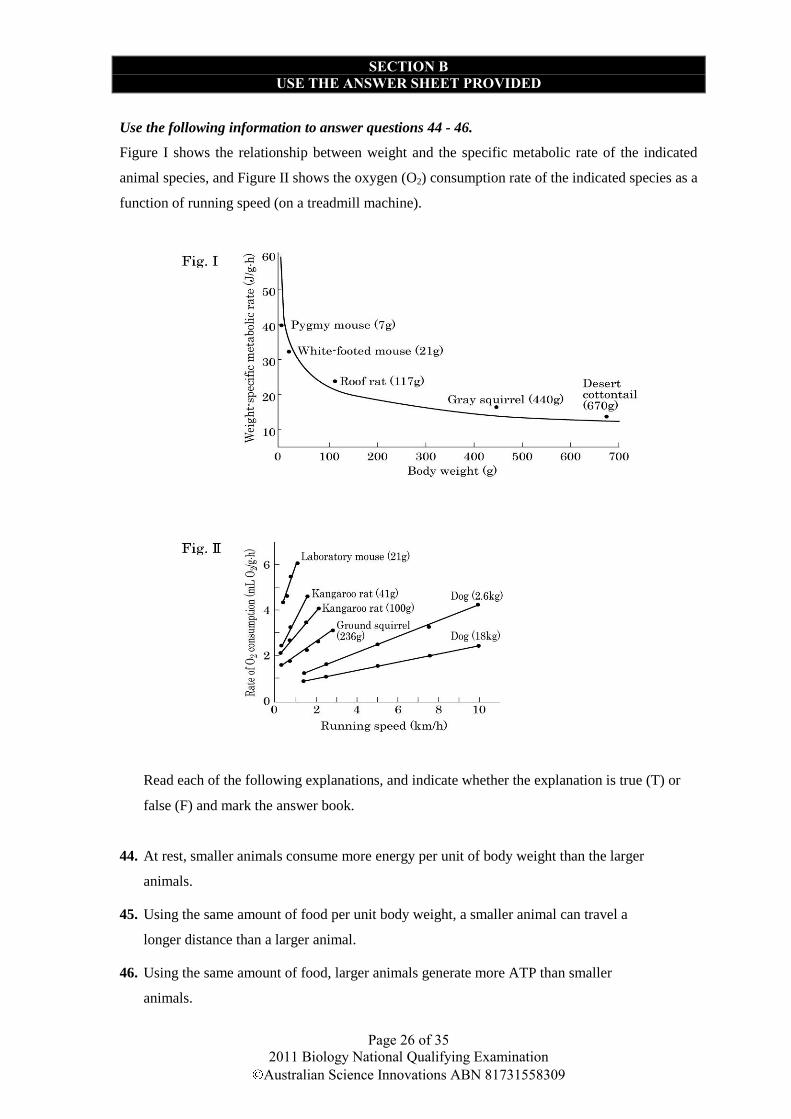
Use the following information to answer questions 44 - 46.
Figure I shows the relationship between weight and the specific metabolic rate of the indicated
animal species, and Figure II shows the oxygen (O2) consumption rate of the indicated species as a
function of running speed (on a treadmill machine).
Read each of the following explanations, and indicate whether the explanation is true (T) or
false (F) and mark the answer book.
44. At rest, smaller animals consume more energy per unit of body weight than the larger
animals.
45. Using the same amount of food per unit body weight, a smaller animal can travel a
longer distance than a larger animal.
46. Using the same amount of food, larger animals generate more ATP than smaller
animals.

Page 27 of 35
2011 Biology National Qualifying Examination
Australian Science Innovations ABN 81731558309
Use the following information to answer questions 47 – 50.
Over a number of generations, two strains of rats were selected in a normal environment for their
increased or decreased maze-learning ability: ‘maze-bright’ rats versus 'maze-dull’ rats.
For the experimental test, rats from each strain were reared in three environments that differed in
the amount of visual stimuli present: restricted, normal, and enriched.
The graph below shows the behavioural performance of adults in terms of the number of errors
committed in running a maze for the maze-bright and maze-dull rats.
Decide whether each of the conclusions below is true (T) or false (F) and mark the answer
book.
47. This experiment proves that selection for a behavioural trait leads to genetic differences
between strains.
48. If the two strains of rats are raised in a normal environment, the two strains make a similar
number of errors.
49. This experiment shows that exposure to visual cues during early development influences
behavioural performance in adult rats.
50. The threshold amount of visual stimuli that markedly improves adult behavioural performance
is different for maze-dull and maze-bright rats.
Page 28 of 35
2011 Biology National Qualifying Examination
Australian Science Innovations ABN 81731558309
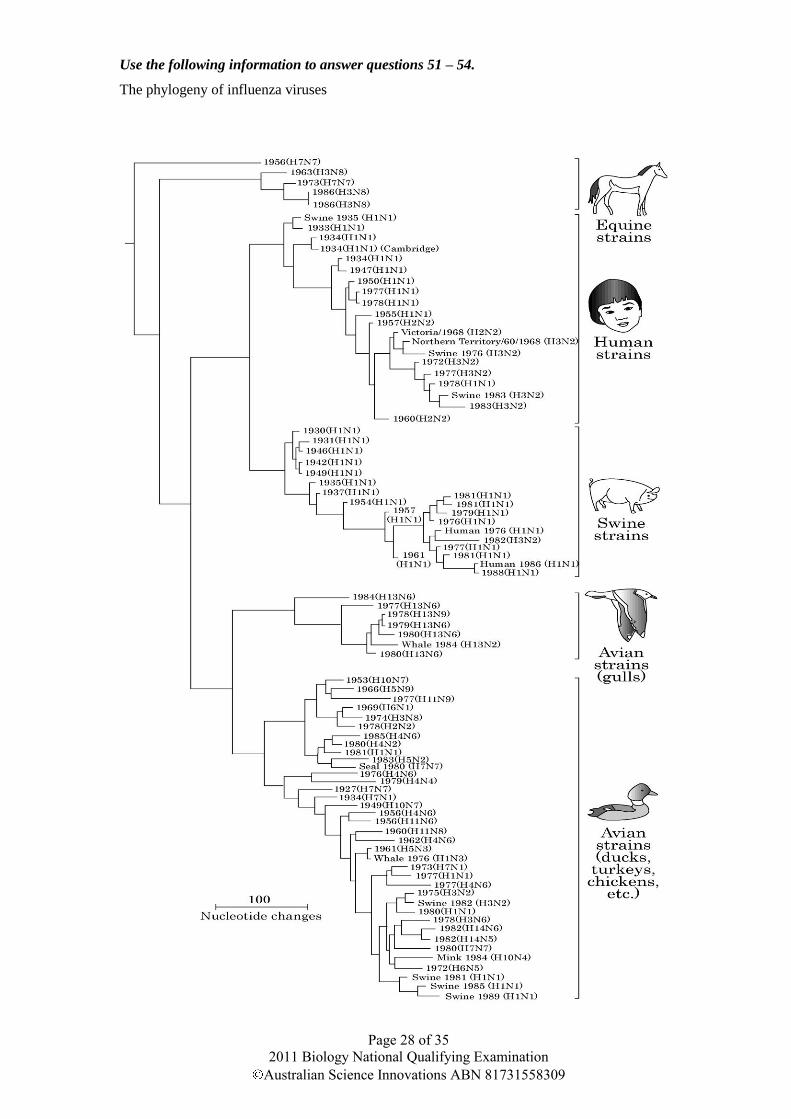
Use the following information to answer questions 51 – 54.
The phylogeny of influenza viruses
Page 29 of 35
2011 Biology National Qualifying Examination
Australian Science Innovations ABN 81731558309
A virus contains DNA or RNA surrounded by a protein coat. The Influenza A virus is responsible
for annual influenza (flu) epidemics and for occasional flu pandemics.
Influenza A is composed of eight RNA strands that code for 11 proteins.
Influenza A strains can be classified based on the combination of two coat proteins,
Hemagglutinin (H1 - H13) and Neuraminidase (N1 - N9).
In this way, various flu types such as H1N1, H3N1, H7N2 etc., can be recognized,
described and their spread monitored across the world in humans and other animals.
The different strains of the virus can be classified by the host animal (for example, avian
or bird flu).
The figure on page 28 represents the phylogeny of flu viruses based on the nucleoprotein
gene of the flu virus genome. For each viral strain, the phylogeny shows the host species
from which it was isolated, the year, and the type of Hemagglutinin and Neuraminidase it
carries.
Indicate whether the following statements are true (T) or false (F) and mark the answer book.
51. The avian flu virus consists of the most diverse types, and some avian flu types also are found
in some mammalian species such as whales and dolphins. Therefore, the avian flu virus
represents the most archaic type of flu virus.
52. The phylogenetic tree suggests that the host shift and genetic recombination of flu virus have
occurred between birds and pigs.
53. The virulence of virus can be changed rapidly by host shifts and mutations. Therefore, vaccine
developments are relatively difficult compared to other common diseases.
54. Swine flu strains are phylogenetically more closely related to the human flu strains than to
other strains.

Page 30 of 35
2011 Biology National Qualifying Examination
Australian Science Innovations ABN 81731558309
Use the following information to answer questions 55 – 58.
While studying the frogs of a certain species in their natural habitat during the mating season, you
observe a chorus of male frogs in which some individuals are calling while others remain silent.
On further observation, you see the silent frogs always sit close to those that are calling, whereas
calling frogs show no preference.
To explain this observation about the frog behaviour determine whether each of the following
statements are true (T) or false (F) and mark the answer book.
55. The individuals who are not calling are staggering their calls with the calling frogs and are
likely to call later in the season after the latter have finished mating.
56. The silent frogs are close genetic relatives of the calling individuals and do not expend
valuable energy in calling as the matings that the latter will receive would provide adequate
indirect fitness to them.
57. The silent frogs have determined that their calls are inadequate in attracting females, as
compared to those of the calling individuals, and lie in wait to sneak matings with the females
that approach the calling males.
58. The silent frogs do not expend energy calling as the female frogs that are attracted to the calls
of the calling males are likely to visually inspect the closely-spaced males and then choose
their mating partners.
Page 31 of 35
2011 Biology National Qualifying Examination
Australian Science Innovations ABN 81731558309
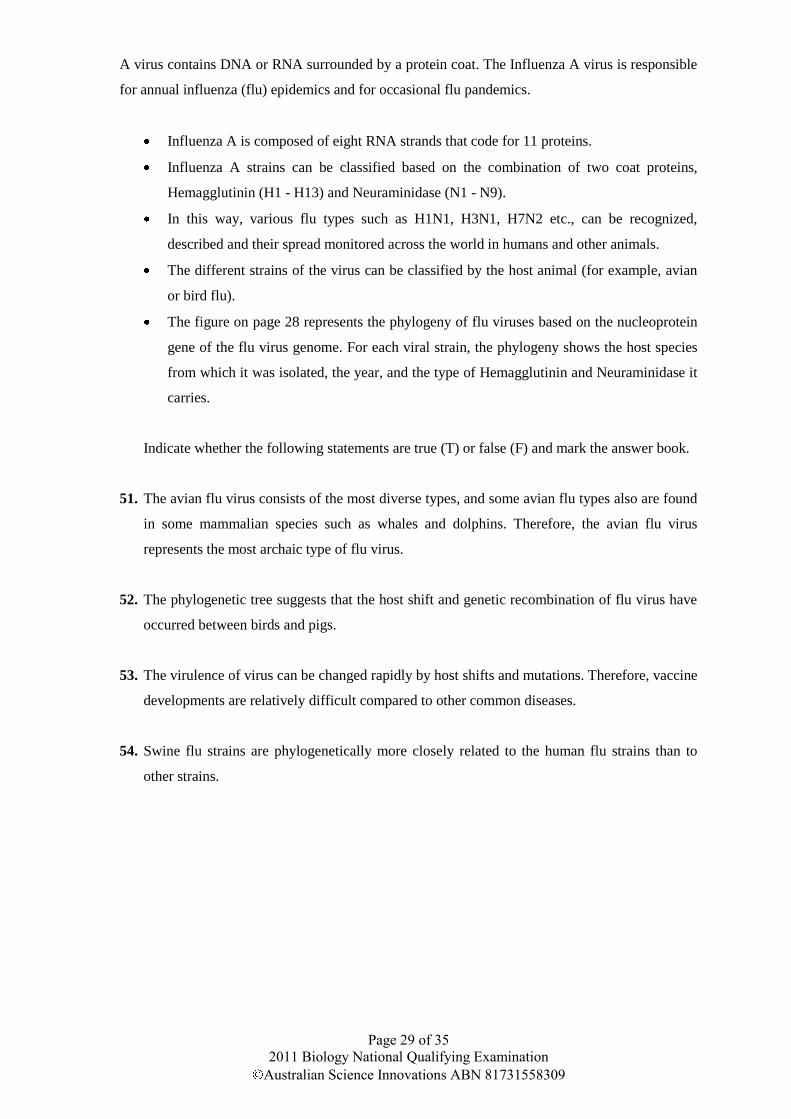
Use the following information to answer questions 59 – 61.
The figure below depicts life-history strategies for three plant species (a-c) along 3 axes: strength
of competition with other organisms, level of disturbance in the habitat, and level of
environmental stress in the habitat.
Species a grows in habitats where competition among species is high but disturbance and
stress are low.
Species b grows in habitats with high environmental stress but with low interspecies
competition.
Species c grows in highly disturbed habitats with low environmental stress.
Determine whether each of the statements below are true (T) or false (F) and mark the answer
book.
59. Characteristics of ‘a-type’ plants are slow growth rate and short-lived leaves.
60. Desert annual plants are ‘b-type’ species. They have rapid growth and produce large amounts
of seeds in a short time after rains.
61. Most plants belonging to ‘c-type’ species would be herbaceous while ‘a-type’ and ‘b-types’
species are likely to be trees or shrubs.

Page 32 of 35
2011 Biology National Qualifying Examination
Australian Science Innovations ABN 81731558309
Use the following information to answer questions 62 – 64.
The following diagram shows the cycle of nitrogen compounds in an ecosystem. The processes A
to G represent conversions of one form of nitrogen into another.
62. Bacteria are involved in many processes (A to G) in the nitrogen cycle. In which of the
processes do bacteria NOT participate? Choose TWO from A to G.
63. Which of the processes may include a symbiotic relationship between a species of plant and a
species of bacterium?
64. Which of the processes do farmers want to inhibit in agricultural land?
N2 in air
NO3- NO2
- NH4+
Nitrogen compounds in plants and animals

Page 33 of 35
2011 Biology National Qualifying Examination
Australian Science Innovations ABN 81731558309
Use the following information to answer question 65.
The following table shows the net primary productivity and biomass without soil organic matter in
five ecosystems.
Ecosystem Net primary productivity
(g/m2/year)
Biomass (kg/m2)
Tropical rainforest 2200 45
I 2000 15
II 1200 30
III 900 4
Boreal forest 800 20
65. Choose from A to F in the table below the most appropriate combination of ecosystems for I,
II and III above.
I II III
A. African dry savanna Tropical swamp & marsh
Temperate deciduous
forest
B. African dry savanna Temperate deciduous forest Tropical swamp & marsh
C. Temperate deciduous forest African dry savanna Tropical swamp & marsh
D. Temperate deciduous forest Tropical swamp & marsh African dry savanna
E. Tropical swamp & marsh African dry savanna
Temperate deciduous
forest
F. Tropical swamp & marsh Temperate deciduous forest African dry savanna
Page 34 of 35
2011 Biology National Qualifying Examination
Australian Science Innovations ABN 81731558309
References
Karlen S.J. and Krubitzer L., The functional and anatomical organization of marsupial neocortex:
evidence for parallel evolution across mammals. Progress in Neurobiology. 82(3), 122-41.
Copyright (2007), with permission from Elsevier.
Springer, M., Burk, A. Kavanagh, J.R., Waddell, V.G., & Stanhope, M.J. (1997) The
interphotoreceptor retinoid binding protein gene in therian mammals: implications for higher level
relationships and evidence for loss of function in the marsupial mole. Proceedings of the National
Academy of Sciences of the United States of America. 94(25),13754-9
Wolfe-Simon, F., Switzer Blum, J., Kulp, T.R., Gordon, G.W., Hoeft, S.E., Pett-Ridge, J.F. Stolz,
J.F., Webb, S.M., Weber, P.K., Davies, P.C.W., Anbar, A. D. & Oremland, R. S., (2010). A
Bacterium that can grow by using Arsenic instead of Phosphorus. Science. in press.
For a brief overview of this story, see also NASA Science News, at:
http://science.nasa.gov/science-news/science-at-nasa/
Figure of the Miller-Urey experiment, freely availably at Wikipedia:
http://upload.wikimedia.org/wikipedia/commons/thumb/5/54/Miller-Urey_experiment-
en.svg/500px-Miller-Urey_experiment-en.svg.png
Questions have been drawn from many sources, adapted, and developed by staff. One of the
questions was adapted from the UMAT website at http://www.nie.edu.au/umatSampleQs.html

Page 35 of 35
2011 Biology National Qualifying Examination
Australian Science Innovations ABN 81731558309
Integrity of Competition
If there is evidence of collusion or other academic dishonesty, students will be
disqualified. Markers’ decisions are final