Biology 177: Principles of Modern Microscopy Lecture 12: Fluorescent labeling, multi-spectral...
68
Biology 177: Principles of Modern Microscopy Lecture 12: Fluorescent labeling, multi-spectral imaging and FRET
-
Upload
daquan-dowling -
Category
Documents
-
view
223 -
download
0
Transcript of Biology 177: Principles of Modern Microscopy Lecture 12: Fluorescent labeling, multi-spectral...

Biology 177: Principles of
Modern MicroscopyLecture 12:
Fluorescent labeling, multi-spectral imaging and FRET
Lecture 12: Fluorescent labeling, multi-sprectral imaging and FRET
• How to characterize the performance of fluorescent probes?
• “Quantitative“ Fluorescence• Fluorescence linearity (non-linearity)
• Dye, microscope, camera• Flat-fielding to linearize• Quantitating the image• Multispectral imaging• FRET

Our discussion of fluorescence has made hidden assumption that dyes have an ideal behavior
How true is this?
Fluorescent Dye
Dipole antenna
Delocalized electrons
Longer dipole, longer l
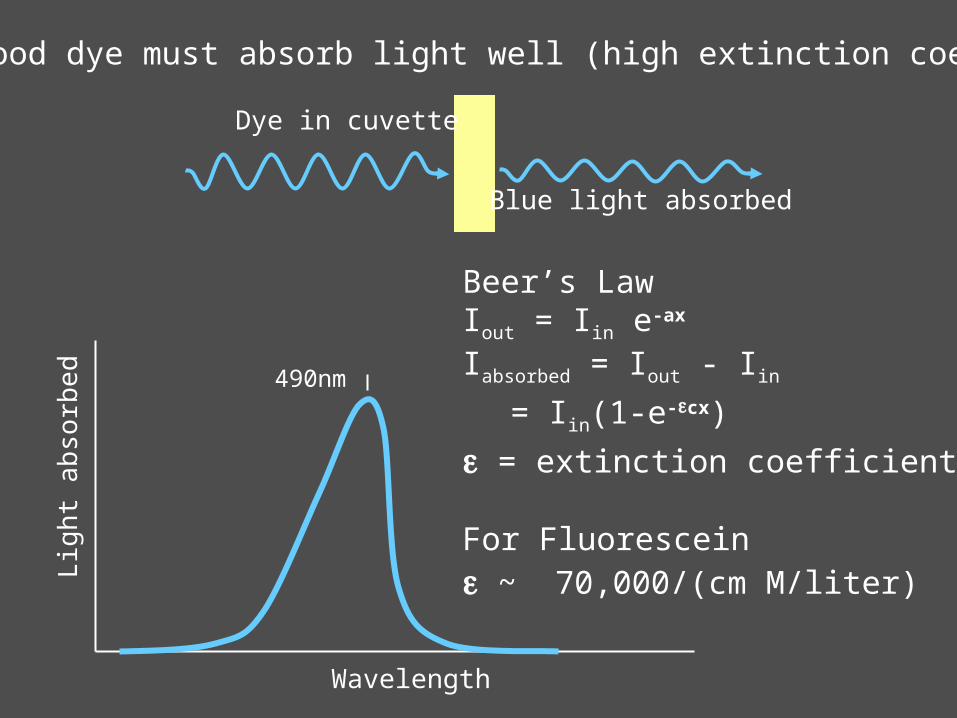
Dye in cuvette
Blue light absorbed
Beer’s LawIout = Iin e-ax
Iabsorbed = Iout - Iin= Iin(1-e-ecx)
e = extinction coefficient
For Fluoresceine ~ 70,000/(cm M/liter)
490nm
Lig
ht
ab
sorb
ed
Wavelength
A good dye must absorb light well (high extinction coef.)

Fluorophore absorption
Beer-Lambert lawIout = Iin exp (- L c)Iabsorbed = Iout - Iin
Iin: incident light intensity (in W.cm-2)L: absorption path length (in cm)c: concentration of the absorber (in M or mol.L-1)
: molar absorption coefficient (in M-1cm-1 or mol-1.L.cm-1)
Fluorescein ~ 70,000 M-1.cm-1
eGFP ~ 55,000 M-1.cm-1
Lig
ht a
bso
rbed
Wavelength
IinBlue light absorbedIout
Green dye in cuvetteL

Fluorophore absorptionOther expressions of the Beer-Lambert law:
Iout = Iin exp (- L c)Iout = Iin exp (- L N)Iout = Iin exp (- µa L)
Iin: incident light intensity in W.cm-2
L: absorption path length in cmc: concentration of the absorber in M or mol.L-1
N: density of the absorber in molecule.cm-3
: molar absorption coefficient in M-1cm-1 or mol-1.L.cm-1
: absorption cross section in cm2 or cm2.molecule-1
µa: absorption (attenuation) coefficient in cm-1
N = NAvogadro . 10-3 c (1L = 103 cm3) = NAvogadro . 10-3 = 6.022 1020
eGFP = 55,000 M-1.cm-1
= 9.13 10-17 cm2.molecule-1
Fluorophore absorption
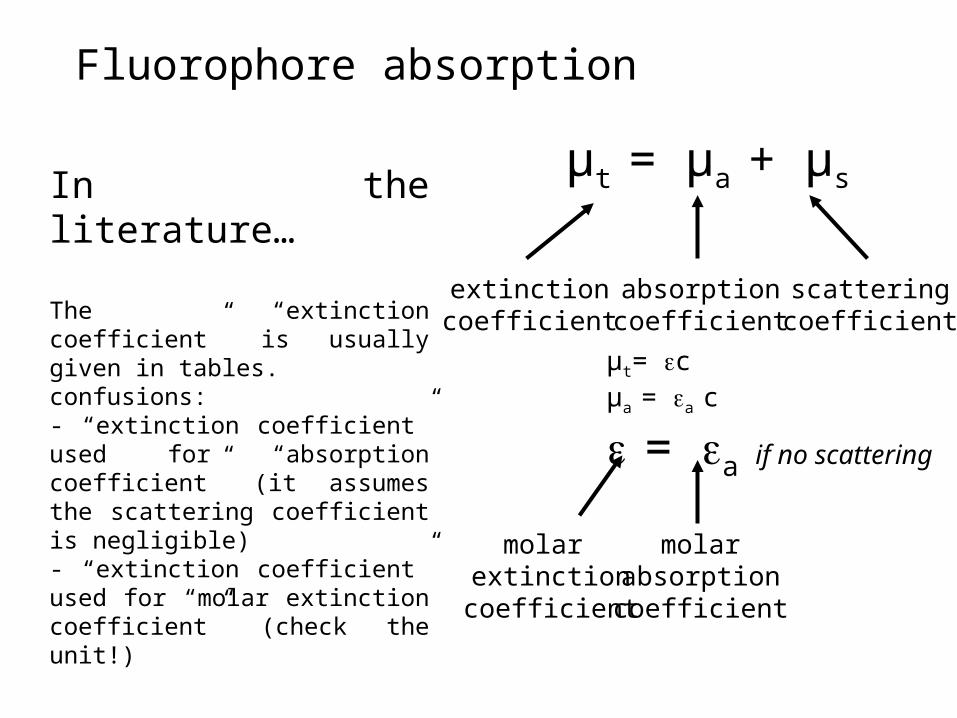
µt = µa + µs
µt= cµa = a c
= a if no scattering
absorptioncoefficient
scatteringcoefficient
extinctioncoefficient
molarabsorptioncoefficient
molar extinctioncoefficient
In the literature…
The “extinction coefficient” is usually given in tables.confusions:- “extinction coefficient” used for “absorption coefficient” (it assumes the scattering coefficient is negligible)- “extinction coefficient” used for “molar extinction coefficient” (check the unit!)
()!The maximum is given in tables, or the excitation wavelength is indicated.
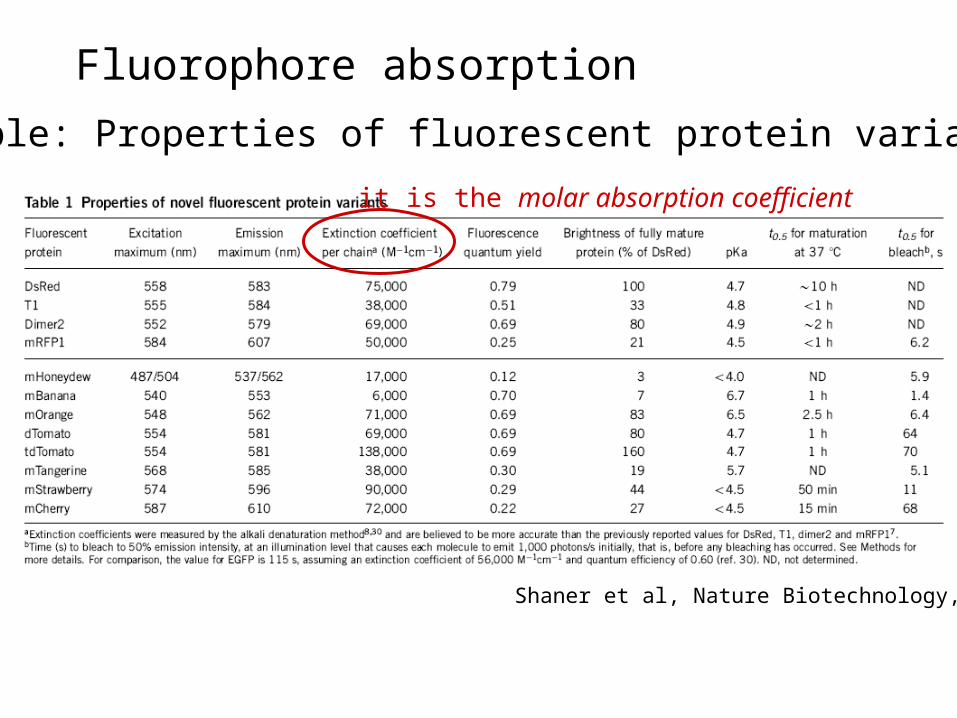
Fluorophore absorption
it is the molar absorption coefficient
Shaner et al, Nature Biotechnology, 2004
Example: Properties of fluorescent protein variants

Fluorophore absorptionL
igh
t ab
sorb
ed
Wavelength
IinBlue light absorbedIout
Green dye in cuvetteL Green light emittedIemitted
490nm
520nm
Stokes Shift
Lig
ht e
mitt
ed
Quantum Yield Q = Iemitted /Iabsorbed
= # photons emitted / # photons absorbed
(Iabsorbed = Iout - Iin)
Fluorescein Q ~ 0.8Rhodamine B Q ~ 0.3 eGPP Q ~ 0.6

Fluorophore brightness = Q
Example: Properties of fluorescent protein variants
DsRed Q ~ 0.79 x 75,000 ~ 59,250 M-1.cm-1 (100%)mRFP1 Q ~ 0.25 x 50,000 ~ 12,500 M-1.cm-1 (21%)eGFP Q ~ 0.6 x 55,000 ~ 33,000 M-1.cm-1 (56%)Fluorescein Q ~ 0.8 x 70,000 ~ 56,000 M-1.cm-1 (95%) (dye!)
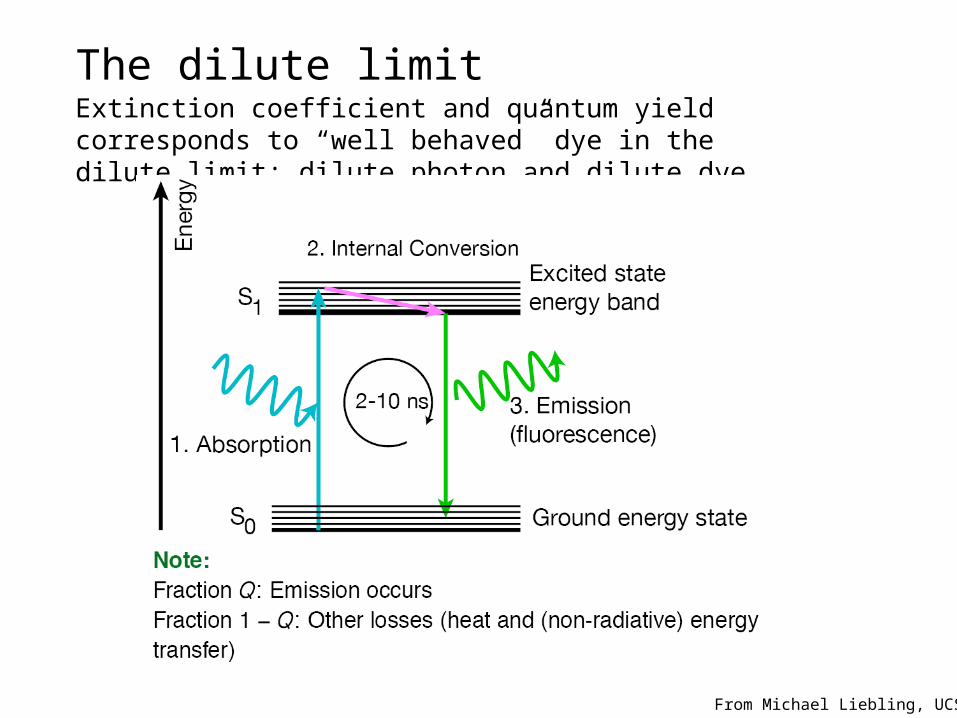
The dilute limitExtinction coefficient and quantum yield corresponds to “well behaved” dye in the dilute limit: dilute photon and dilute dye
From Michael Liebling, UCSB

The dilute limit: dilute photons
As photons hit specimen: dye molecules excited and less dye left unexcited
Dye r
em
ain
ing
to b
e e
xcit
ed
Excitation intensity
Em
issi
on
In
ten
sity
Excitation intensity
Saturation!

Interstate (or Intersystem) crossing (ISC)
From Michael Liebling, UCSB
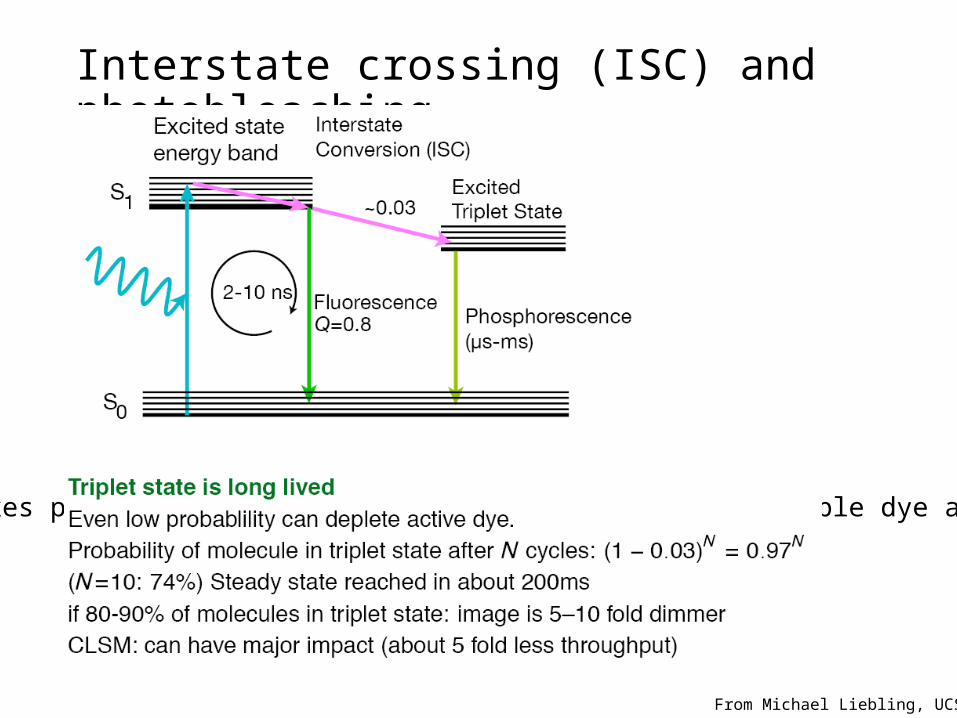
Interstate crossing (ISC) and photobleaching
From Michael Liebling, UCSB
As ISC takes place: less dye molecules available and unexcitable dye accumulates

Cycle of a fluorophore
From Michael Liebling, UCSB

Interstate crossing (ISC) and photobleaching
A good dye is more photostable (less photobleaching)

Interstate crossing (ISC) and photobleaching
after 30 seconds
Bovine pulmonary artery endothelial cells (BPAEC) were labeled with fluorescein phalloidin (left panels, Cat. no. F432), or Alexa Fluor® 488 phalloidin (right panels, Cat. no. A12379), which labels filamentous actin, and mounted in PBS. The cells were placed under constant illumination on the microscope with an FITC filter set using a 60× objective. Images were acquired at one-second intervals for 30 seconds. Under these illumination conditions, fluoresce in photobleached to about 20% of its initial value in 30 seconds; the fluorescence of Alexa Fluor® 488 phalloidin stayed at the initial value under the same illumination conditions.
Fluorescein Alexa 488
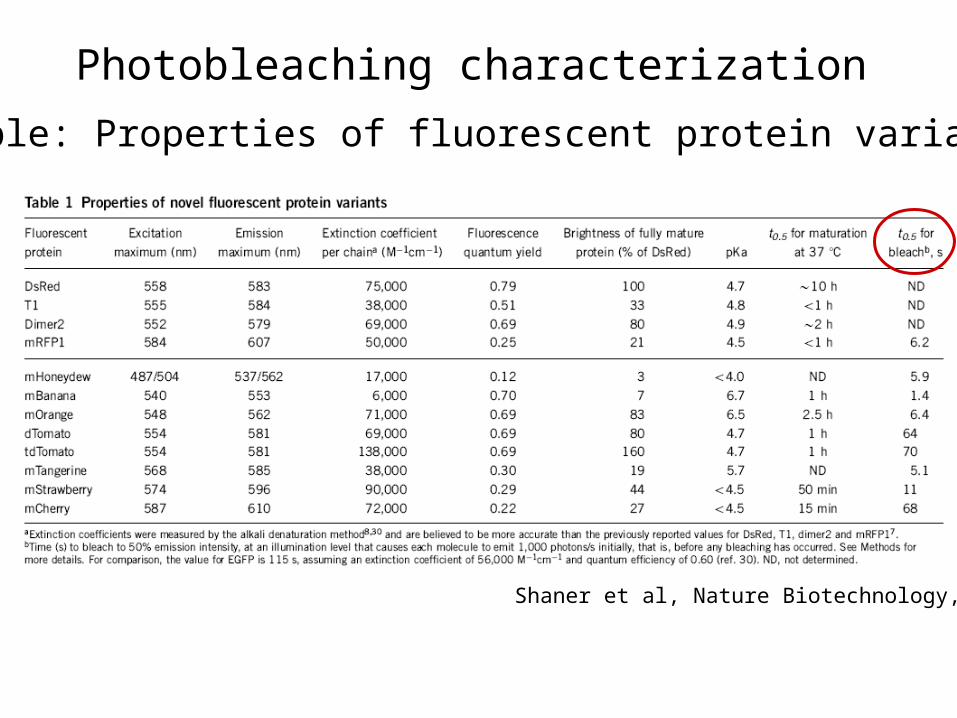
Photobleaching characterization
Shaner et al, Nature Biotechnology, 2004
Example: Properties of fluorescent protein variants

Resonance Energy Transfer (non-radiative)
Transfer of energy from one dye to anotherDepends on: Spectral overlap Distance Alignment

RET is not always between dissimilar dyes
“Self-quenching” of dye
(“hot-potato” the energy until lost)
Depends on: Dye Concentration Geometry Environment
Log [dye]
Log I
~0.1uM

“Self-quenching” of dye
Depends on: Dye Concentration Geometry
Log [dye]
Log I
~0.1uM
Hard for emission from this one
Easier emission from this one
A uniformly dyed structure Instead, looks “hollow”

Fluorescence quantification based on signal intensity
Example:in = level of expression of a fluorescent proteinout = fluorescent signal and grey level of pixel on an image.
input: [fluorophore] Output: pixel grey levels

Example of nonlinearity: Pixel saturation(detector or digital contrast)
Solution(s): use less power!!!, decrease the acquisition time, decrease [fluorophore],…
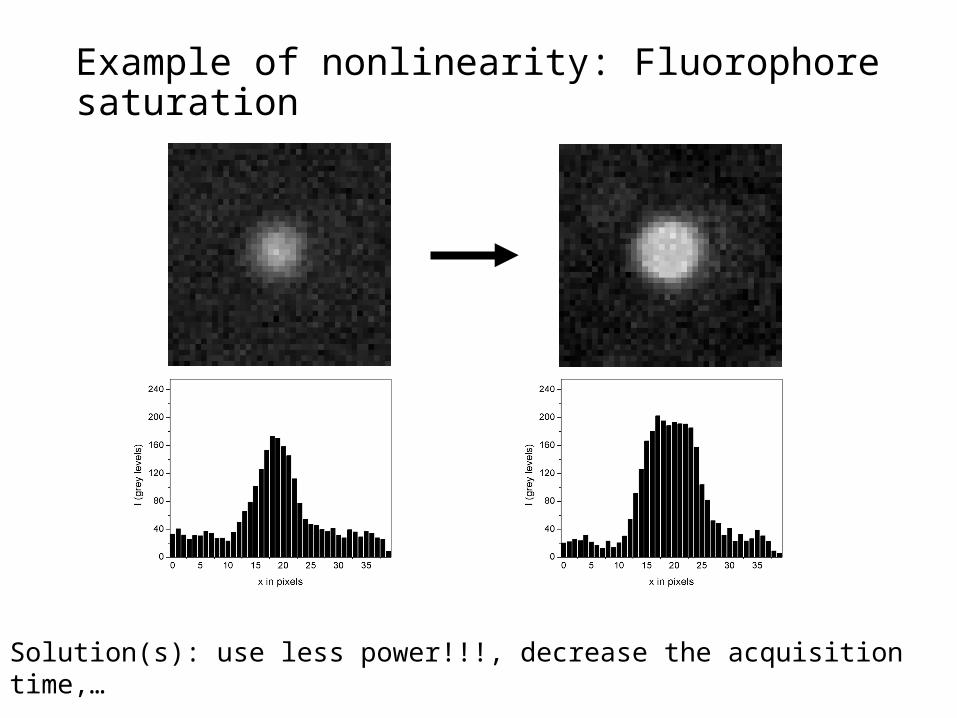
Example of nonlinearity: Fluorophore saturation
Solution(s): use less power!!!, decrease the acquisition time,…

Example of nonlinearity: Noise
Solution(s): optimize the excitation wavelength, increase the acquisition time, use more power, use a stronger fluorophore, increase [fluorophore],…

Example of nonlinearity: Photo-induced fluorescence
Solution(s): use less power!
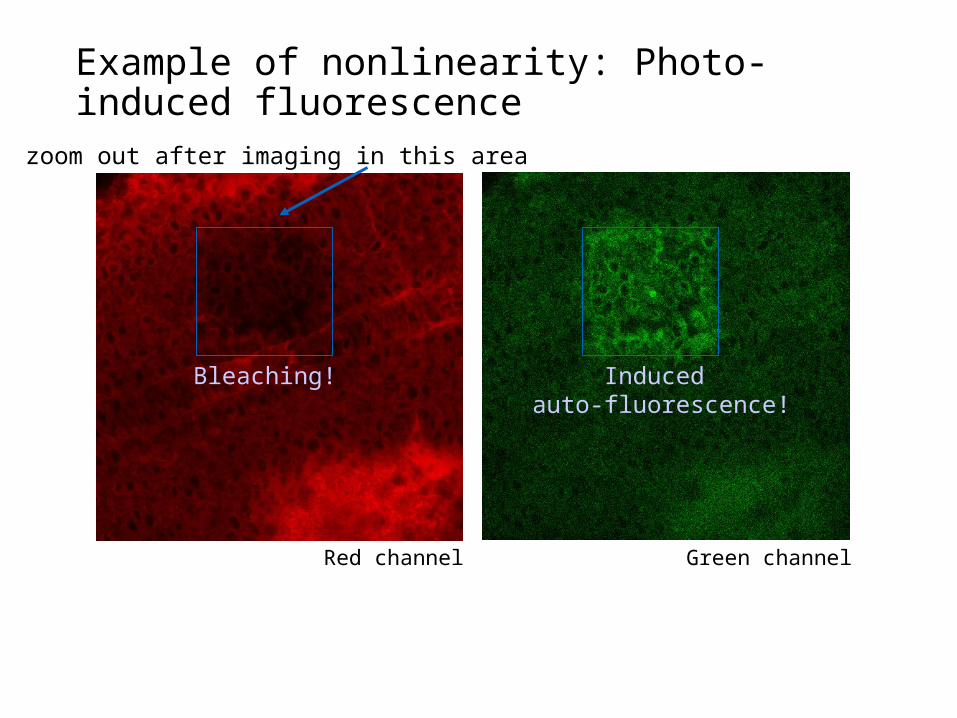
Example of nonlinearity: Photo-induced fluorescence
Red channel
zoom out after imaging in this area
Green channel
Bleaching! Induced auto-fluorescence!

Same object imaged at different tissue depth…
The fluorescence level depends on the depth of imaging and the optical properties of the tissue (variation from one sample to another)…All dyes look redder as you look deeper in tissue
Compare what is comparable: Imaging depth

How to protect yourself from non-linearities?
• You can’t - but you can look for diagnostic defects• Edges to structures• Asymmetries in intensity
• Test: reduce laser; does image reduce proportionately?
• Avoid over-labeling• Avoid over-stimulating
• “When in doubt, reduce intensity of stimulation”
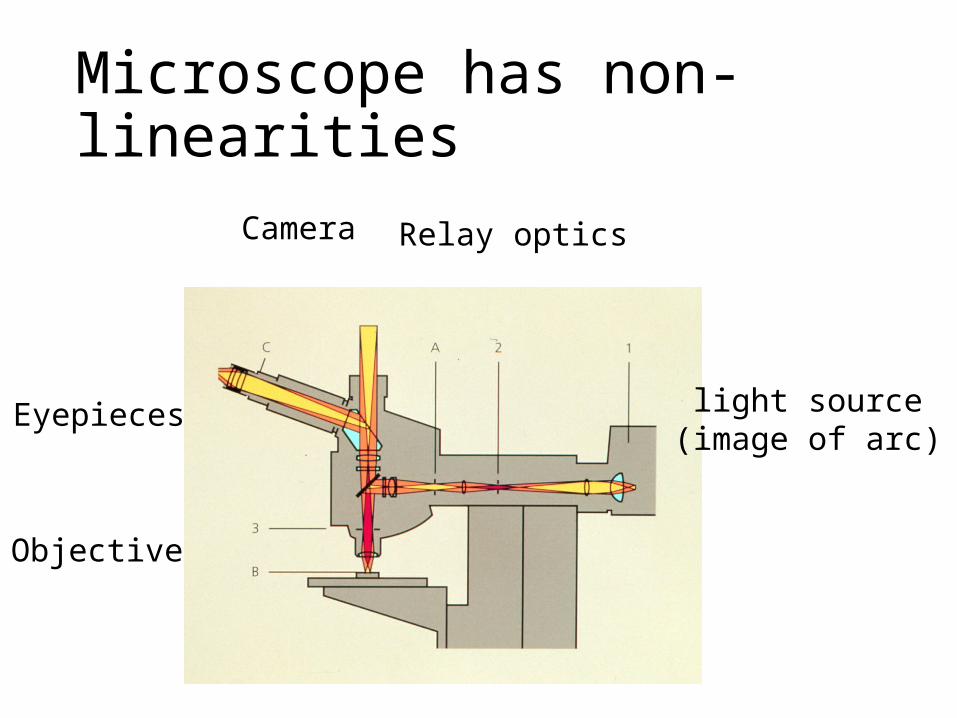
Microscope has non-linearities
light source(image of arc)
Relay optics
Objective
Eyepieces
Camera

Microscope has non-linearities
light source(image of arc)
Relay optics
Objective
Eyepieces
Camera
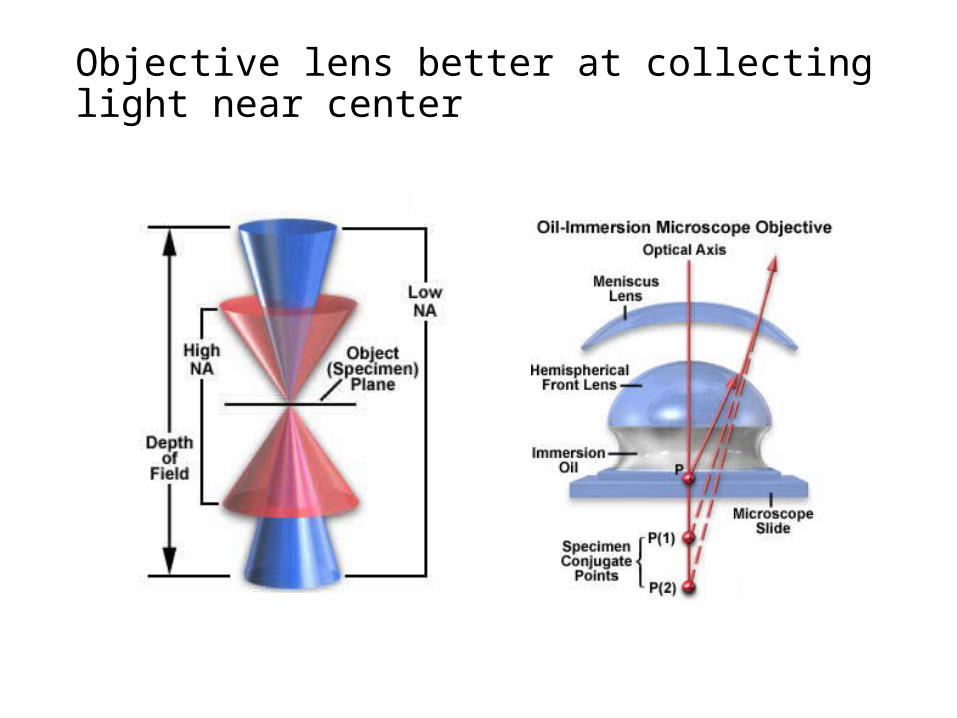
Objective lens better at collecting light near center

Microscope has non-linearities
light source(image of arc)
Relay optics
Objective
Eyepieces
Camera

Good: Single detector
Bad: Easy to saturate dye (less excitation, ISC)
No free lunch from Confocal
Good: Single light source
Bad: Very sensitive to optical aberrations

Optical aberrations
Spherical aberration Lateral chromatic aberration
Focus deeper below coverglassNot corrected for
• spherical aberration• chromatic aberration
DetectorDetector
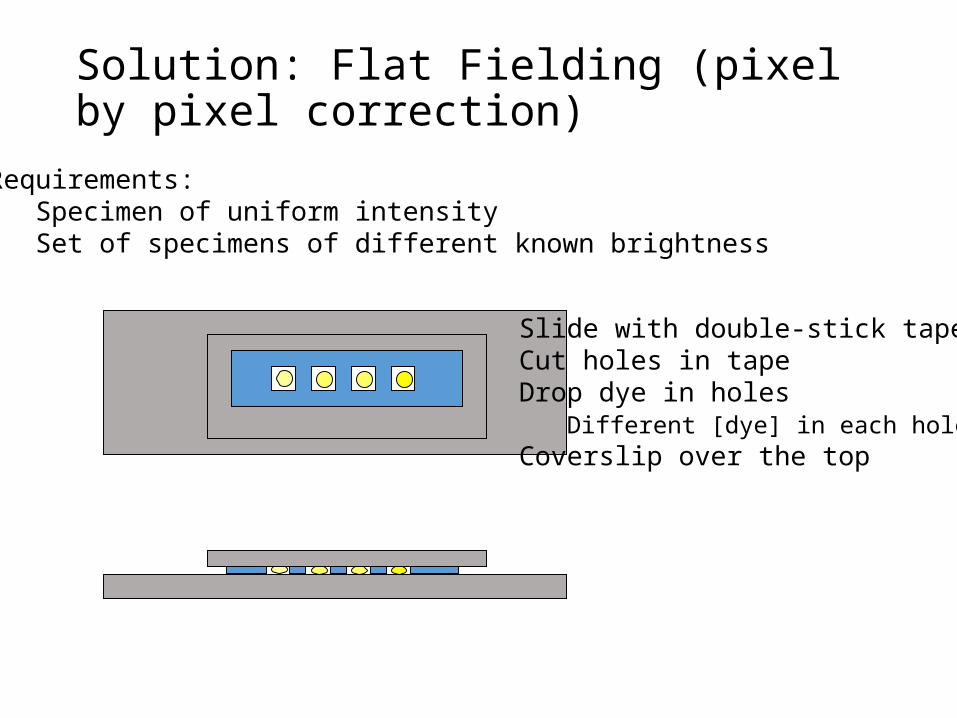
Requirements: Specimen of uniform intensity Set of specimens of different known brightness
Slide with double-stick tapeCut holes in tapeDrop dye in holes Different [dye] in each holeCoverslip over the top
Solution: Flat Fielding (pixel by pixel correction)

Intensity
[dye]
On pixel by pixel basis Plot I vs dye concentration [dye] Calculate slope & intercept
References:Kindler & Kennedy (1996) J Neurosci Methods 68:61-70Stollberg & Fraser (1988) J Cell Biol 107: 1397–1408.
Watch for warning signSublinear -> self-quenching
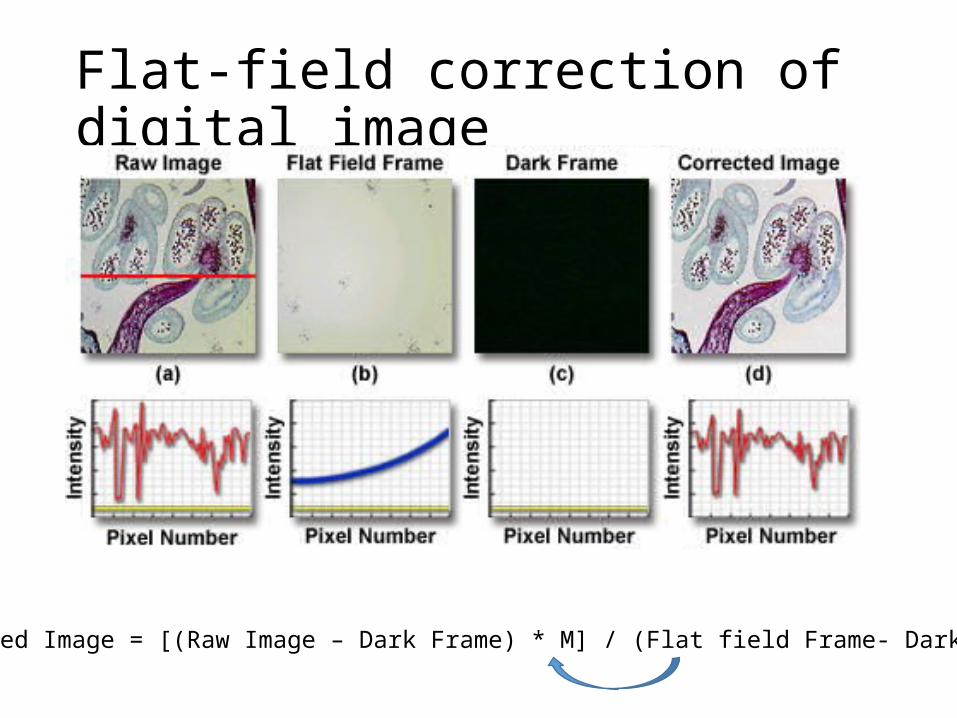
Flat-field correction of digital image
Corrected Image = [(Raw Image – Dark Frame) * M] / (Flat field Frame- Dark Frame)

So how many fluorophores does a given intensity equal?
J Neurosci Methods 105:55-63 (2001)

Single molecule calibration: Beads with Ni-NTA; GFP::His6
0 pM 1 pM
10 pM
J Neurosci Methods 105:55-63 (2001)
Alternative: use viruses with defined numbers of GFP’s
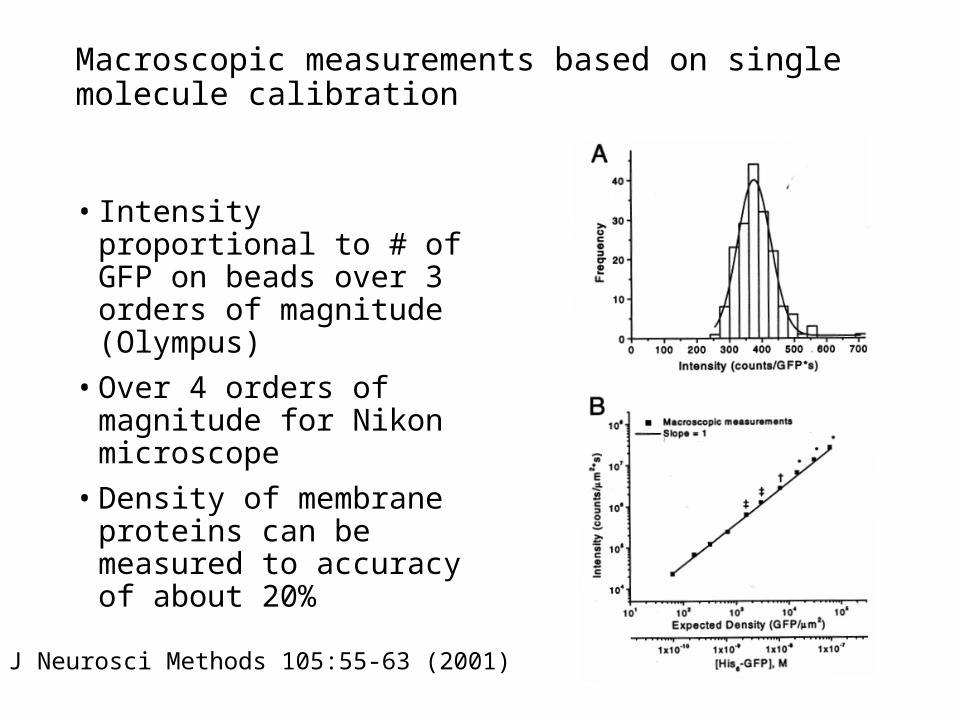
Macroscopic measurements based on single molecule calibration
• Intensity proportional to # of GFP on beads over 3 orders of magnitude (Olympus)
• Over 4 orders of magnitude for Nikon microscope
• Density of membrane proteins can be measured to accuracy of about 20%
J Neurosci Methods 105:55-63 (2001)
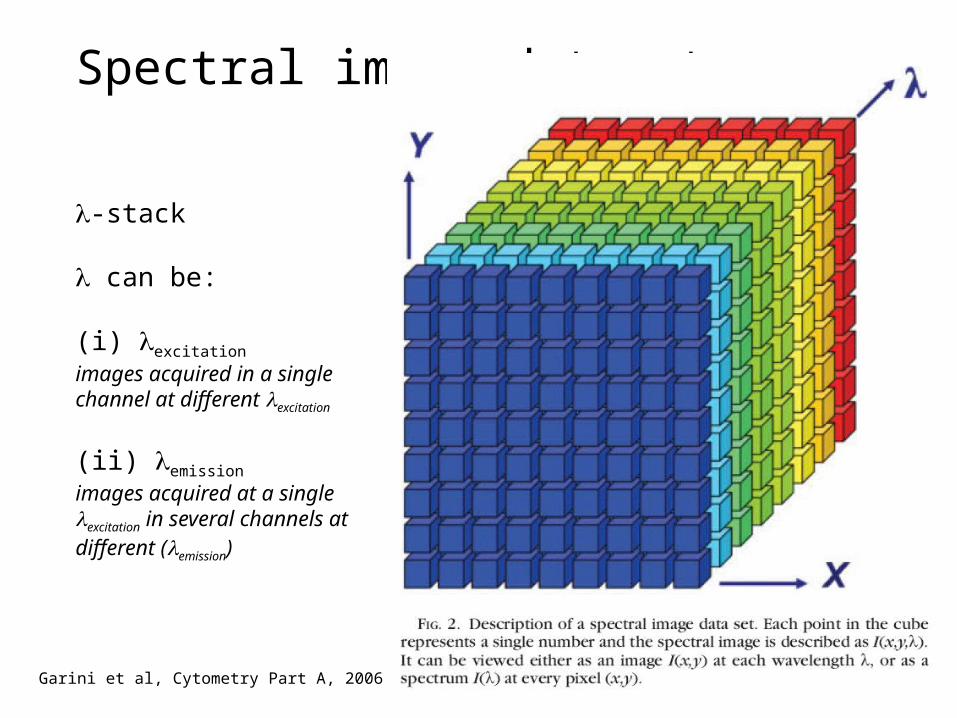
Multispectral ImagingInstead of Z – stacks, collect λ – stacks
Spectral or Lambda Scanning

-stack
can be:
(i) excitation
images acquired in a single channel at different excitation
(ii) emission
images acquired at a single excitation in several channels at different (emission)
Spectral image dataset
Garini et al, Cytometry Part A, 2006
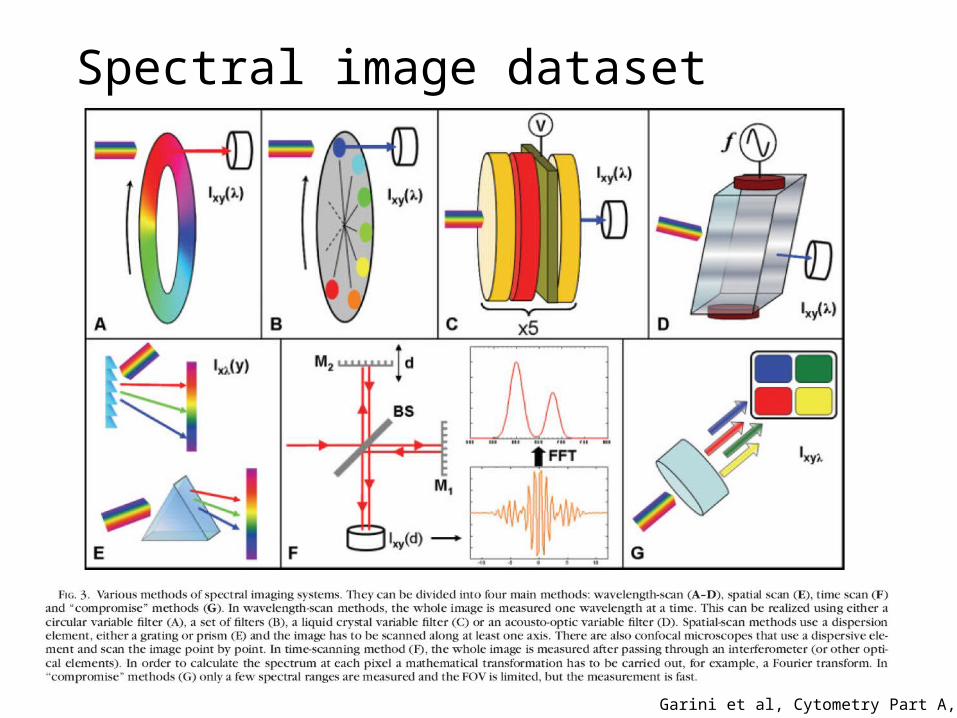
Spectral image dataset
Garini et al, Cytometry Part A, 2006

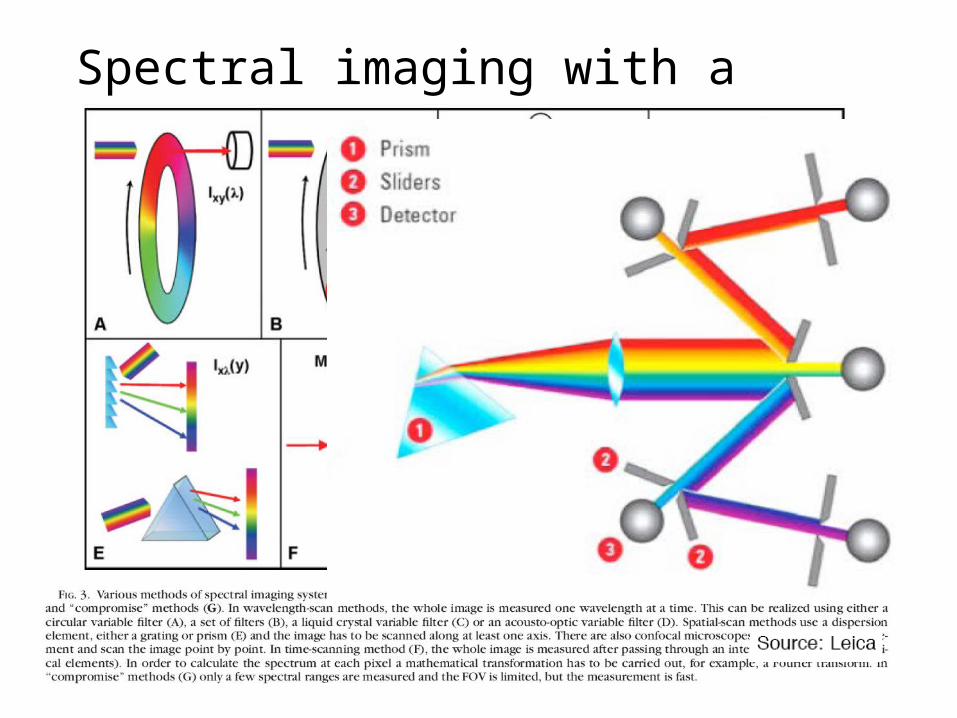
Spectral imaging methods: Spatial-scan
• 3 Different ways used by microscope companies
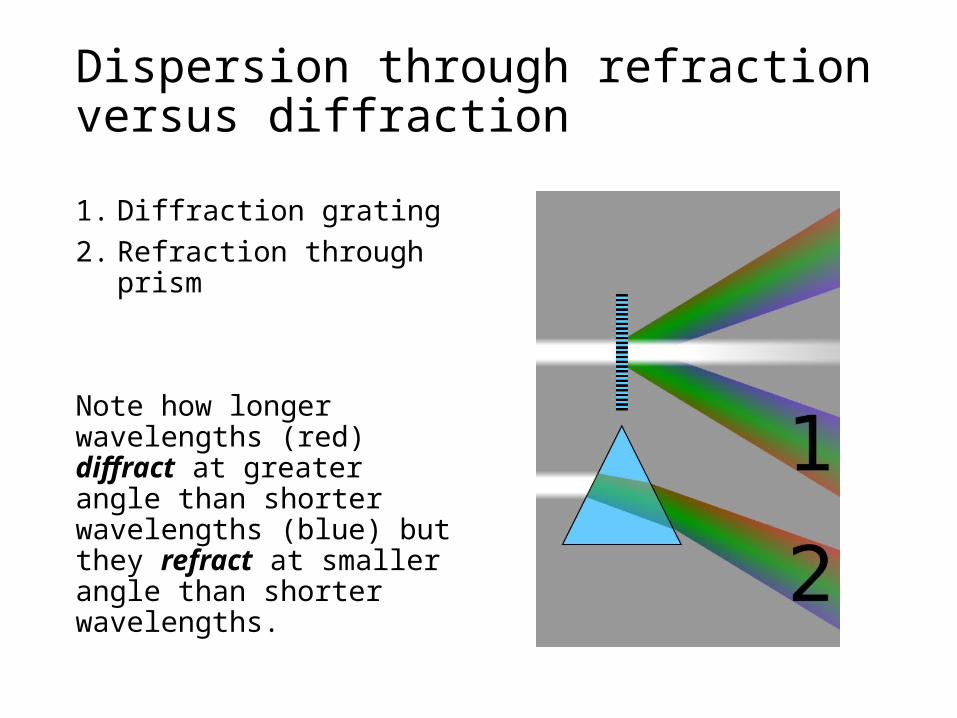
Dispersion through refraction versus diffraction
1. Diffraction grating2. Refraction through prism
Note how longer wavelengths (red) diffract at greater angle than shorter wavelengths (blue) but they refract at smaller angle than shorter wavelengths.

Monochromator: Optical instrument for generating single colors
• Used in optical measuring instruments
• How a monochromator works according to the principle of dispersion
• Most actually disperse through diffraction, not prism
Entrance Slit
Monochromator (Prism Type)
Exit Slit

Spectral imaging with a grating

History of the Zeiss META detector
• Where did the idea of a multichannel detector come from?
History of the Zeiss META detector
• Where did the idea of a multichannel detector come from?
• Collaboration between the Jet Propulsion Laboratory, Scott Fraser’s lab here at Caltech and Zeiss
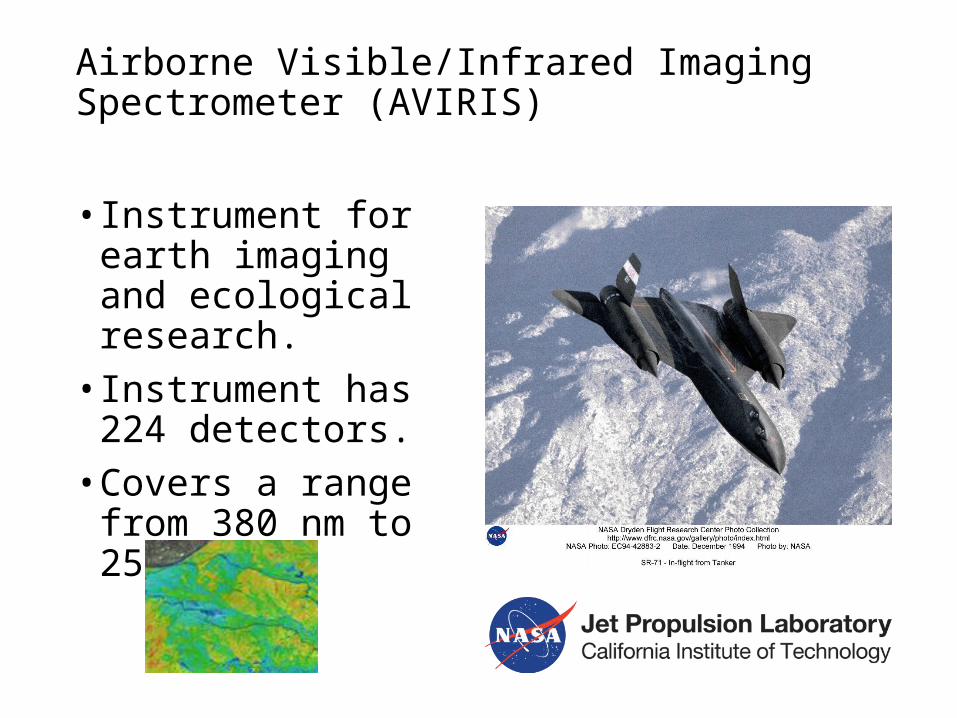
Airborne Visible/Infrared Imaging Spectrometer (AVIRIS)
• Instrument for earth imaging and ecological research.
• Instrument has 224 detectors.
• Covers a range from 380 nm to 2500 nm.

Airborne Visible/Infrared Imaging Spectrometer (AVIRIS)
• Original • Next Generation (AVIRISng)

History of the Zeiss META detector
• Zeiss META had 8* channel detector
• Replaced by 32 channel Quasar detector
Spectral imaging with a prism and mirrors
-stack
can be:
(i) excitation
images acquired in a single channel at different excitation
(ii) emission
images acquired at a single excitation in several channels at different (emission)
Spectral image dataset
Garini et al, Cytometry Part A, 2006
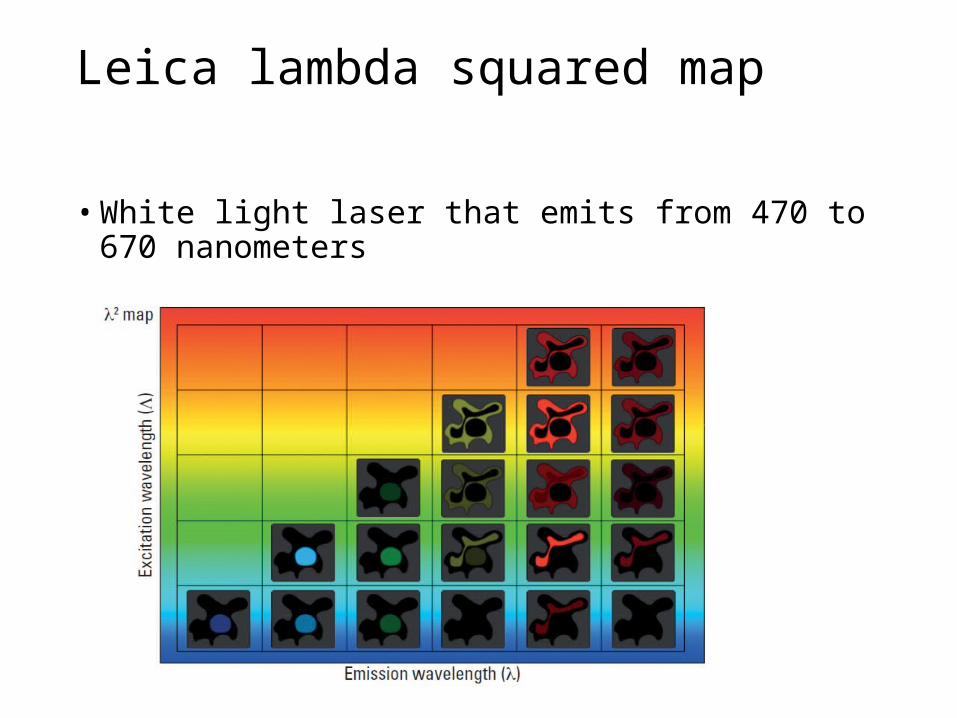
Leica lambda squared map
• White light laser that emits from 470 to 670 nanometers

Choose spectrally well-separated dyes
Source: Zimmermann, T., 2005. Spectral Imaging and Linear Unmixing in Light Microscopy, in: Rietdorf, J. (Ed.), Microscopy Techniques. Springer Berlin Heidelberg, pp. 245-265.
if not possible: use spectral unmixing!

Spectral unmixing: general conceptMulti-channel
DetectorCollect Lambda
Stack Raw Image
Unmixed ImageDerive Emission
Fingerprints
FITC Sytox-green

Linear spectral unmixing: principle
To solve and obtain Ai for each pixel
From Michael Liebling, UCSB

Linear spectral unmixing: principle
From Michael Liebling, UCSB
2 possibilities:

Spectral unmixing
• 8 channel detector (can you guess the instrument used?)
• Using Emission spectra• Example of parallel
acquisition • Reference spectra
important
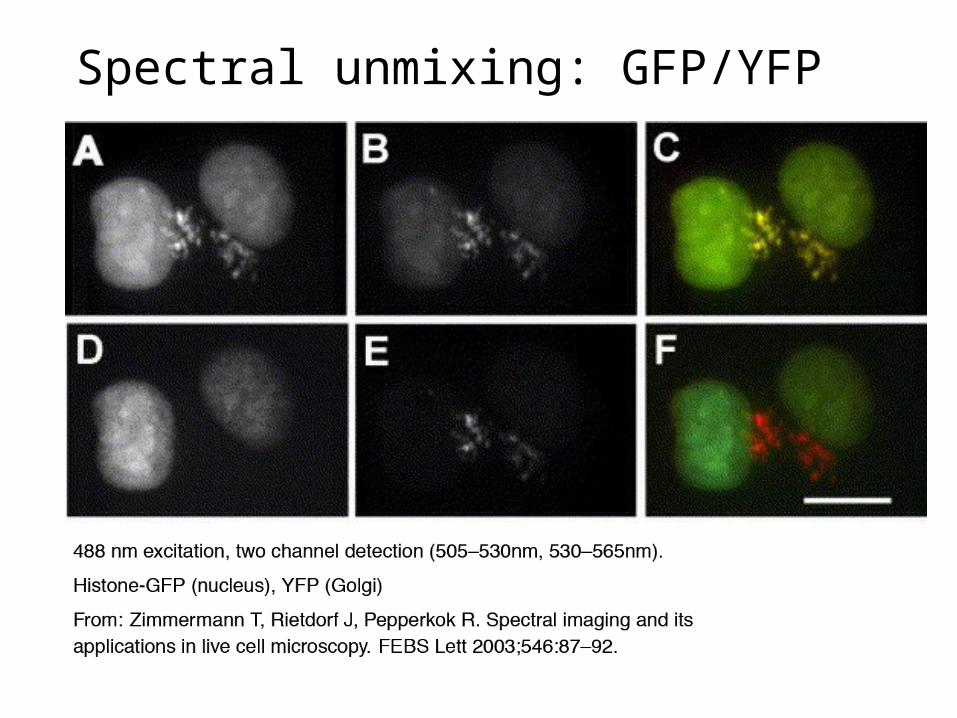
Spectral unmixing: GFP/YFP

Spectral unmixing: Leica lambda stack
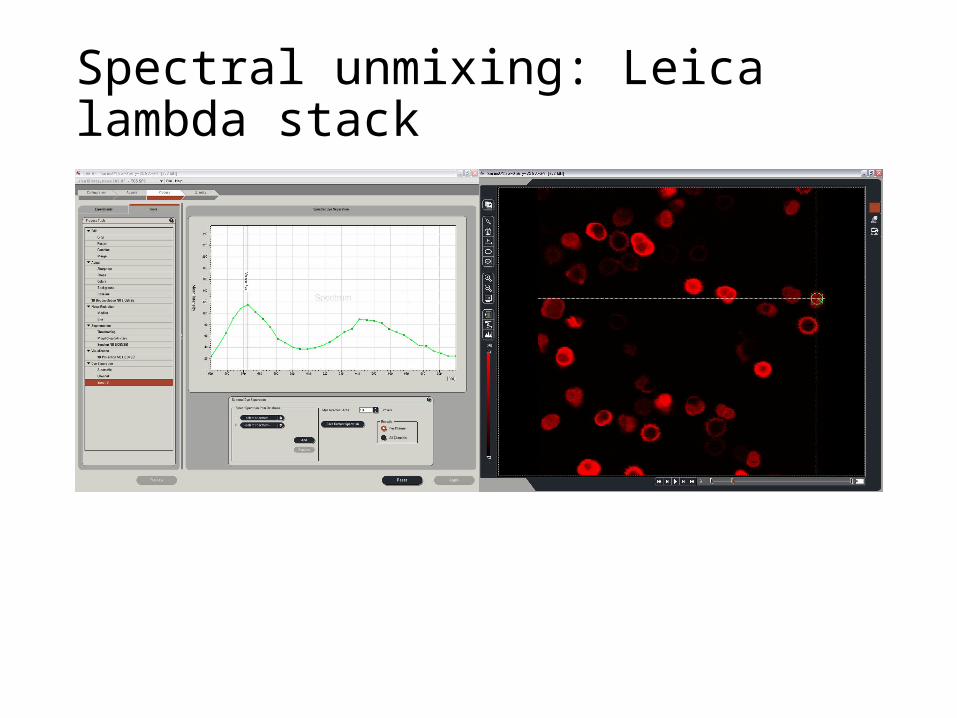
Spectral unmixing: Leica lambda stack

Spectral unmixing: Leica lambda stack

Spectral unmixing of autofluorescence
Red and green arrows indicate regions from which sample spectra were obtained.Blue = computed spectrum
(a) Image obtained at the peak of one of the quantum dots.(b) Unmixed image of the 570-nm quantum dot. (c) Unmixed image of the 620-nm quantum dot. (d) Combined pseudocolor image of (b) (green), (c), and autofluorescence channel (in white).
Mansfield et al, Journal of Biomedical Optics (2005)

Determine the two photon spectra of uncharacterized dye
• In vivo Hair Cell Dye, FM1-43 Spectra
• Separate very similar colored fluorophores• e.g. FITC and Sytox green.
• Could be used to eliminate non-specific background fluorescence that has different emission spectra.
• Different technologies for spectrum detection• Sequentially (Leica SP)• Simultaneously (Zeiss QUASAR)
Spectral or Lambda Scanning