Biologically-inspired data decorrelation for hyper ... · Biologically-inspired data decorrelation...
10
RESEARCH Open Access Biologically-inspired data decorrelation for hyper- spectral imaging Artzai Picon 1* , Ovidiu Ghita 2 , Sergio Rodriguez-Vaamonde 1 , Pedro Ma Iriondo 3 and Paul F Whelan 2 Abstract Hyper-spectral data allows the construction of more robust statistical models to sample the material properties than the standard tri-chromatic color representation. However, because of the large dimensionality and complexity of the hyper-spectral data, the extraction of robust features (image descriptors) is not a trivial issue. Thus, to facilitate efficient feature extraction, decorrelation techniques are commonly applied to reduce the dimensionality of the hyper-spectral data with the aim of generating compact and highly discriminative image descriptors. Current methodologies for data decorrelation such as principal component analysis (PCA), linear discriminant analysis (LDA), wavelet decomposition (WD), or band selection methods require complex and subjective training procedures and in addition the compressed spectral information is not directly related to the physical (spectral) characteristics associated with the analyzed materials. The major objective of this article is to introduce and evaluate a new data decorrelation methodology using an approach that closely emulates the human vision. The proposed data decorrelation scheme has been employed to optimally minimize the amount of redundant information contained in the highly correlated hyper-spectral bands and has been comprehensively evaluated in the context of non-ferrous material classification Keywords: Hyper-spectral data, feature extraction, fuzzy sets, material classification 1. Introduction Hyper-spectral imaging involves the acquisition (see Fig- ure 1) and interpretation of multi-dimensional digital images that are able to sample the spectral properties of the materials associated with the visualized objects [1]. Nowadays, the current range of spectral imaging systems is able to capture multiple bands from ultraviolet to far infrared with good bandwidth resolution. This increased flexibility in the image acquisition process prompted the inclusion of the hyper-spectral imaging systems in the development of a wide variety of computer vision sys- tems, such as video surveillance, food inspection, medi- cal imaging, remote sensing, and material classification [2-4]. The main characteristic of the hyper-spectral images is that each pixel is defined by a multi-dimensional vector whose elements are the spectral (electromagnetic or wavelengths) components that are captured from the light arriving at the spectral sensor. In this regard, the hyper-spectral imaging sensors (or spectrographs) allow the extraction of a richer source of information beyond the visible spectral domain (that is usually captured by a standard color camera), a fact that opens the possibility to analyze not only the tri-chromatic characteristics of the scene materials, but also their chemical composition [1,3,5-7]. One issue that is common for all hyper-spectral appli- cations is associated with the optimal evaluation of the material characteristics in the hyper-spectral domain. To address this issue, several distance metrics that evaluate the dissimilarity among the spectral descriptors extracted from the analyzed materials were proposed in the specialized literature [8,9]. One apparent conclusion that emerged from past investigations indicates that classical approaches that evaluate the distance between unprocessed hyper-spectral features in the multi-dimen- sional Euclidean, space or those based on the measure- ment of the angle between spectrums’ SAM (spectral angle mapper) [9-11] provide information in regard to the similarity between two or more materials, but they are not able to overcome the high correlation associated * Correspondence: [email protected] 1 Information and Interaction Systems Unit, Tecnalia, Zamudio, Bizkaia, Spain Full list of author information is available at the end of the article Picon et al. EURASIP Journal on Advances in Signal Processing 2011, 2011:66 http://asp.eurasipjournals.com/content/2011/1/66 © 2011 Picón et al; licensee Springer. This is an Open Access article distributed under the terms of the Creative Commons Attribution License (http://creativecommons.org/licenses/by/2.0), which permits unrestricted use, distribution, and reproduction in any medium, provided the original work is properly cited.
Transcript of Biologically-inspired data decorrelation for hyper ... · Biologically-inspired data decorrelation...
RESEARCH Open Access
Biologically-inspired data decorrelation for hyper-spectral imagingArtzai Picon1*, Ovidiu Ghita2, Sergio Rodriguez-Vaamonde1, Pedro Ma Iriondo3 and Paul F Whelan2
Abstract
Hyper-spectral data allows the construction of more robust statistical models to sample the material propertiesthan the standard tri-chromatic color representation. However, because of the large dimensionality and complexityof the hyper-spectral data, the extraction of robust features (image descriptors) is not a trivial issue. Thus, tofacilitate efficient feature extraction, decorrelation techniques are commonly applied to reduce the dimensionalityof the hyper-spectral data with the aim of generating compact and highly discriminative image descriptors.Current methodologies for data decorrelation such as principal component analysis (PCA), linear discriminantanalysis (LDA), wavelet decomposition (WD), or band selection methods require complex and subjective trainingprocedures and in addition the compressed spectral information is not directly related to the physical (spectral)characteristics associated with the analyzed materials. The major objective of this article is to introduce andevaluate a new data decorrelation methodology using an approach that closely emulates the human vision. Theproposed data decorrelation scheme has been employed to optimally minimize the amount of redundantinformation contained in the highly correlated hyper-spectral bands and has been comprehensively evaluated inthe context of non-ferrous material classification
Keywords: Hyper-spectral data, feature extraction, fuzzy sets, material classification
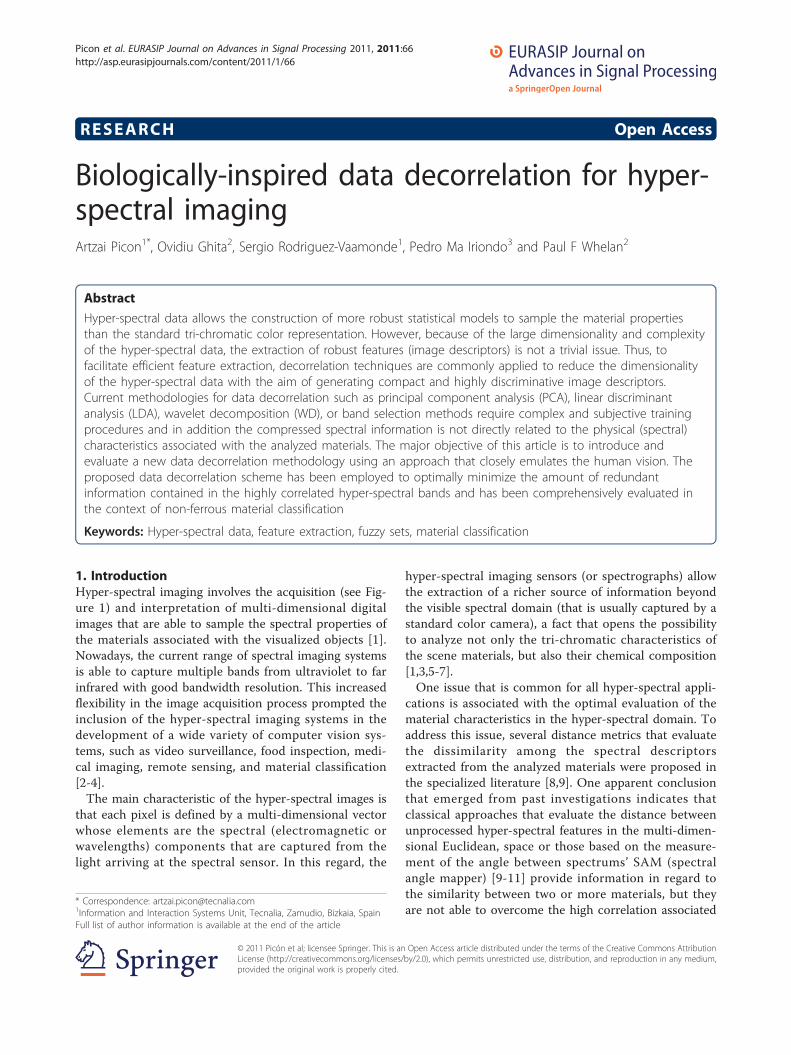
1. IntroductionHyper-spectral imaging involves the acquisition (see Fig-ure 1) and interpretation of multi-dimensional digitalimages that are able to sample the spectral properties ofthe materials associated with the visualized objects [1].Nowadays, the current range of spectral imaging systemsis able to capture multiple bands from ultraviolet to farinfrared with good bandwidth resolution. This increasedflexibility in the image acquisition process prompted theinclusion of the hyper-spectral imaging systems in thedevelopment of a wide variety of computer vision sys-tems, such as video surveillance, food inspection, medi-cal imaging, remote sensing, and material classification[2-4].The main characteristic of the hyper-spectral images is
that each pixel is defined by a multi-dimensional vectorwhose elements are the spectral (electromagnetic orwavelengths) components that are captured from thelight arriving at the spectral sensor. In this regard, the
hyper-spectral imaging sensors (or spectrographs) allowthe extraction of a richer source of information beyondthe visible spectral domain (that is usually captured by astandard color camera), a fact that opens the possibilityto analyze not only the tri-chromatic characteristics ofthe scene materials, but also their chemical composition[1,3,5-7].One issue that is common for all hyper-spectral appli-
cations is associated with the optimal evaluation of thematerial characteristics in the hyper-spectral domain. Toaddress this issue, several distance metrics that evaluatethe dissimilarity among the spectral descriptorsextracted from the analyzed materials were proposed inthe specialized literature [8,9]. One apparent conclusionthat emerged from past investigations indicates thatclassical approaches that evaluate the distance betweenunprocessed hyper-spectral features in the multi-dimen-sional Euclidean, space or those based on the measure-ment of the angle between spectrums’ SAM (spectralangle mapper) [9-11] provide information in regard tothe similarity between two or more materials, but theyare not able to overcome the high correlation associated
* Correspondence: [email protected] and Interaction Systems Unit, Tecnalia, Zamudio, Bizkaia, SpainFull list of author information is available at the end of the article
Picon et al. EURASIP Journal on Advances in Signal Processing 2011, 2011:66http://asp.eurasipjournals.com/content/2011/1/66
© 2011 Picón et al; licensee Springer. This is an Open Access article distributed under the terms of the Creative Commons AttributionLicense (http://creativecommons.org/licenses/by/2.0), which permits unrestricted use, distribution, and reproduction in any medium,provided the original work is properly cited.
with the hyper-spectral descriptors [3]. This observationis in particular valid, as the simplistic analysis of the rawhyper-spectral data is inappropriate for several practicalreasons. The first reason is given by the fact that theanalysis of the unprocessed hyper-spectral data is com-putationally intensive, while the second reason is asso-ciated with the high correlation attained by the closelyspaced spectral bands in the hyper-spectral domain [12].These factors substantially complicate the material clas-sification process as the increased spectral correlationreduces the discriminative power associated with thespectral descriptors that describe the properties of theanalyzed materials. This problem is known as theHughes phenomenon [12,13] and states that the numberof samples required to train a specific classifier increasesexponentially with the increase in the number of spec-tral features [12,13].The intra-class variations for each analyzed material
can be better modeled if the high dimensionality of thehyper-spectral data is reduced before feature extraction.In this sense, to circumvent the problems caused by thelarge feature vectors calculated from raw (unprocessed)hyper-spectral data when used for classification pur-poses, feature reduction (or decorrelation) techniquesare usually applied to avoid the Hughes phenomenon[12-14]. Thus, the hyper-spectral data has been com-monly subjected to standard decorrelation schemes,such as PCA, WD [15-19], uniform band design (UBD)[20] or its dimensionality reduced by applying methodsbased on user-defined band selection (UDBS) [21-23].Nonetheless, these classic decorrelation techniquesreduce the number of features calculated from thehyper-spectral spectrum, but it is useful to note thatthese data transformations often alter the physicalmeaning of the extracted features, and as a result theyare difficult to interpret and analyze. In addition to this,the above-mentioned techniques involve tedious andsubjective training procedures that are applied to sample
the distributions associated with all materials to be ana-lyzed. The requirement of laborious training procedurespose a particular challenge when developing flexibleindustrial applications and this issue is substantially exa-cerbated if new materials are often included in the clas-sification process, a situation when retraining isnecessary.To avoid these problems, more flexible methodologies
that are able to perform hyper-spectral data decorrela-tion have to be devised. These approaches shouldreduce the dimensionality of the hyper-spectral data byselecting the most relevant bands that maximize theclassification rate (or the separation among materials)without reducing the discriminative power of theextracted features [24]. To achieve these goals, branchand bound algorithms [25], machine learning techniquesbased on genetic algorithms [26], and methods based onthe evaluation of the data using a combination of classi-fiers [27] were recently proposed. These methods provedefficient when applied to extract the discriminative fea-tures that characterize the materials included in thedatasets, but similar to classic decorrelation approaches,they entail retraining if the automatic sorting systemrequires the inclusion of new materials in the classifica-tion process. Given these limitations, an optimal decorr-elation technique should comply with the following setof assumptions:
- To reduce as much as possible the dimensionalityof the hyper-spectral data.- To maximize the discriminative power of the dec-orrelated feature vectors.- Should not be dependent on training procedures,so they can be used when new materials areincluded in the classification process.- Data decorrelation should not alter the physicalmeanings of the transformed spectral components.- Data decorrelation should be material independent.
To accommodate these requirements, in this articlewe propose a new data decorrelation scheme using anapproach that is closely related to that employed bythe human visual system (HVS) in the process of con-verting the electromagnetic radiation that is emitted bythe surrounding objects into chromatic information.The main contribution associated with this studyresides in the application of the fuzzy sets theory, asintroduced by Zadeh [28], to maximize the discrimina-tive power associated with the hyper-spectral featurescalculated for each pixel in the image. Other contribu-tions resulting from our study are located in thedetailed evaluation of the proposed data decorrelationtechnique when applied to non-ferrous material classi-fication tasks.
Hyper-spectral camera
Aperture Prism CCDSensor
Conveyor belt moving direction
Figure 1 The principle of the hyper-spectral image acquisitionprocess.
Picon et al. EURASIP Journal on Advances in Signal Processing 2011, 2011:66http://asp.eurasipjournals.com/content/2011/1/66
Page 2 of 10
This article is organized as follows: Section 2 intro-duces the proposed hyper-spectral data decorrelationtechnique, where the main emphasis is placed on theextension of the biologically inspired models whenapplied to the hyper-spectral domain. Section 3 detailsthe experimental results, while concluding remarks areprovided in Section 4.
2. Biologically-inspired hyper-spectral modelingThe HVS has adapted through years of evolution to effi-ciently capture the visual information that helps thehumans in the process of interacting with the surround-ing environment. The human eye is able to capture theelectromagnetic spectrum in the range 400-700 nm,although other animals like fish or insects can acquireinformation from the UV spectrum as well.The photoreceptors present in the human eye consist
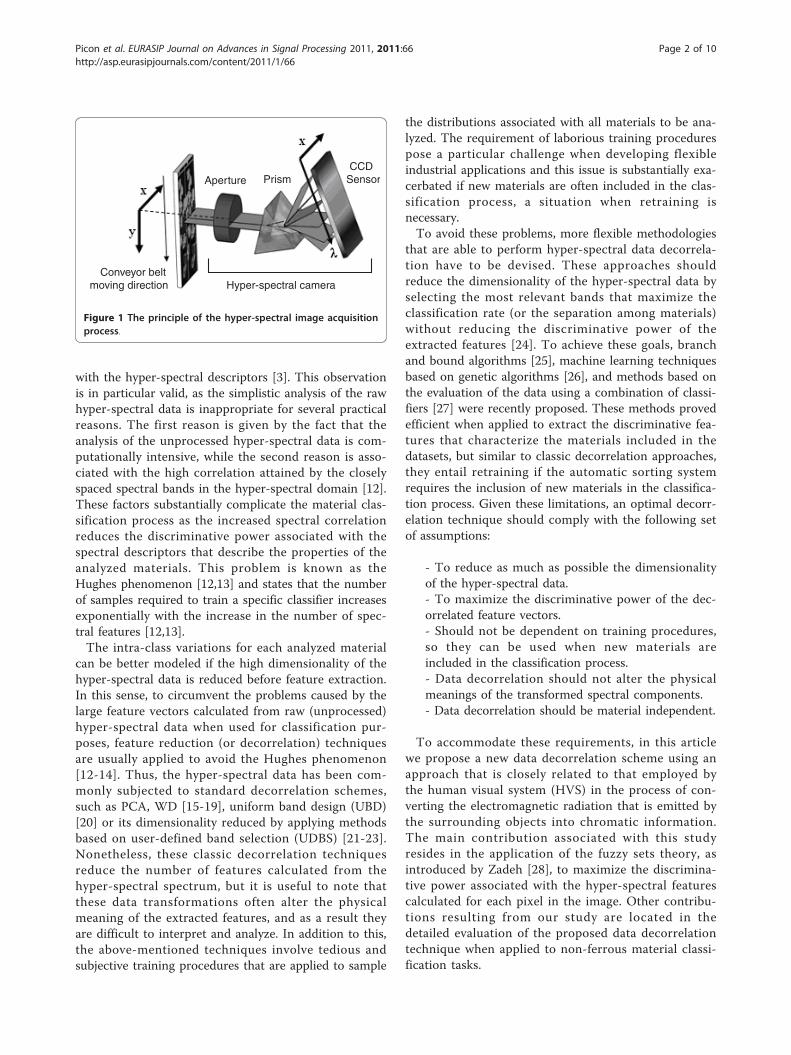
of three different types of spectral-sensitive cells, whereeach cell (retinal cone) is able to convert the electro-magnetic information into chromatic information [29].Each of these visual receptors, as shown in Figure 2,responds strongly to restricted domains of the electro-magnetic spectrum (S = blue, M = green, L = red) andthe first stage of human color information entails a dec-orrelation process that evaluates the response generatedby each type of photoreceptor. As indicated by severalstudies that investigated the HVS with respect to thechromatic perception [29-32], the sensitivity of thehuman eye employs models that are consistent with thefuzzy sets theory (see Figure 2).Following this theory, in this article we propose a new
data decorrelation approach where each defined fuzzyset
would correspond to a “virtual retinal cone” thatresponds strongly at specific wavelengths of the hyper-spectral domain using models that are consistent withthe human chromatic perception. More precisely, theproposed approach can be conceptualized as an hyper-spectral eye, where each fuzzyset emulates the spectralresponse of a distinct type of retinal receptor in arestricted bandwidth of the hyper-spectral domain.The proposed data decorrelation method exploits the
knowledge that the adjacent wavelengths of the spec-trum are more correlated than the more distant wave-lengths. This observation is justified since theelectromagnetic spectra emitted by solid materials showa slow variation with respect to successive wavelengths.As a result of this coherent radiometric model, thespectral information can be better sampled by groups ofcontinuously distributed wavelengths rather than uniquespectral bands, which is the case of the unprocessed(raw) hyper-spectral data. To achieve this, the responsefor each “virtual” (fuzzy) cone is calculated as the sumof the weighted intensity values corresponding to a sub-domain of adjacent wavelengths, and in this process thespectrum is divided into a predefined number of dis-tinct groups to attain the desired spectral selectivity.Nonetheless, the quantization of the spectral responsewill be problematic at the interface between consecutivesub-domains and to avoid the issues that are caused bya crisp division of the spectrum, in this article a methodbased on the spectrum fuzzyfication is proposed. Thisinvolves the separation of the hyper-spectral data into apredefined number of fuzzy groups, where each groupcovers a range of wavelengths and the contribution ofeach wavelength is modeled by fuzzy membership rules.Let L be the N-dimensional spectral vector as defined
in Eq. 1 and M be the number of fuzzysets that coverthe full hyper-spectral domain.
L = {L1, L2, ..., LN}T (1)
To sample the spectral response, a membership func-tion is defined to measure the level of appartenance forany wavelength of the spectrum to its related fuzzysets.For the sake of simplicity, the membership functions arecommonly implemented either as triangular shaped (Eq.2) or Gaussian functions (Eq. 3).
Mfk(λ) =
⎧⎨⎩1 −
∣∣∣∣λ − λCk
D
∣∣∣∣ , λCk − D < λ < λCk + D
0, Otherwise(2)
Mfk(λ) =(
12πσ 2
)12 e
−1
2σ 2(λ−λCk)
2(3)
Figure 2 Sensitivity of the human visual receptors to thedifferent wavelengths of the spectrum. In this diagram, forsimplicity reasons, the sensitivity of the human receptors is modeledby triangular-shaped fuzzysets.
Picon et al. EURASIP Journal on Advances in Signal Processing 2011, 2011:66http://asp.eurasipjournals.com/content/2011/1/66
Page 3 of 10
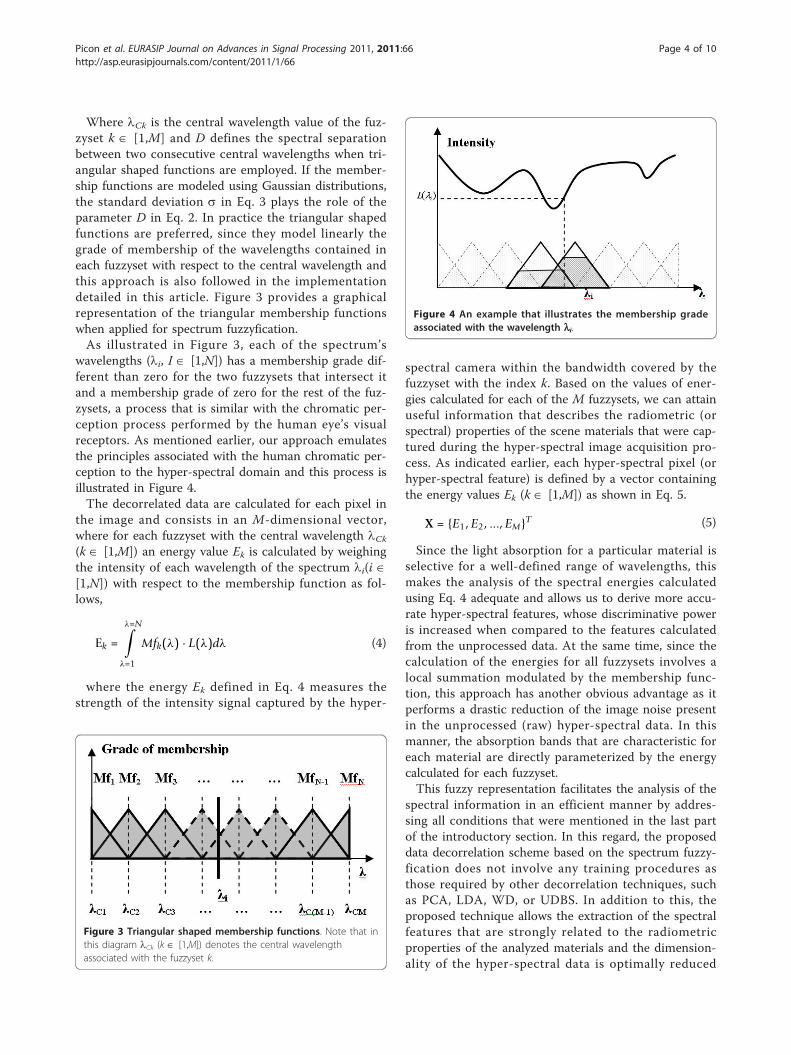
Where lCk is the central wavelength value of the fuz-zyset k Î [1,M] and D defines the spectral separationbetween two consecutive central wavelengths when tri-angular shaped functions are employed. If the member-ship functions are modeled using Gaussian distributions,the standard deviation s in Eq. 3 plays the role of theparameter D in Eq. 2. In practice the triangular shapedfunctions are preferred, since they model linearly thegrade of membership of the wavelengths contained ineach fuzzyset with respect to the central wavelength andthis approach is also followed in the implementationdetailed in this article. Figure 3 provides a graphicalrepresentation of the triangular membership functionswhen applied for spectrum fuzzyfication.As illustrated in Figure 3, each of the spectrum’s
wavelengths (li, I Î [1,N]) has a membership grade dif-ferent than zero for the two fuzzysets that intersect itand a membership grade of zero for the rest of the fuz-zysets, a process that is similar with the chromatic per-ception process performed by the human eye’s visualreceptors. As mentioned earlier, our approach emulatesthe principles associated with the human chromatic per-ception to the hyper-spectral domain and this process isillustrated in Figure 4.The decorrelated data are calculated for each pixel in
the image and consists in an M-dimensional vector,where for each fuzzyset with the central wavelength lCk(k Î [1,M]) an energy value Ek is calculated by weighingthe intensity of each wavelength of the spectrum li(i Î[1,N]) with respect to the membership function as fol-lows,
Ek =
λ=N∫λ=1
Mfk(λ) · L(λ)dλ (4)
where the energy Ek defined in Eq. 4 measures thestrength of the intensity signal captured by the hyper-
spectral camera within the bandwidth covered by thefuzzyset with the index k. Based on the values of ener-gies calculated for each of the M fuzzysets, we can attainuseful information that describes the radiometric (orspectral) properties of the scene materials that were cap-tured during the hyper-spectral image acquisition pro-cess. As indicated earlier, each hyper-spectral pixel (orhyper-spectral feature) is defined by a vector containingthe energy values Ek (k Î [1,M]) as shown in Eq. 5.
X = {E1, E2, ..., EM}T (5)
Since the light absorption for a particular material isselective for a well-defined range of wavelengths, thismakes the analysis of the spectral energies calculatedusing Eq. 4 adequate and allows us to derive more accu-rate hyper-spectral features, whose discriminative poweris increased when compared to the features calculatedfrom the unprocessed data. At the same time, since thecalculation of the energies for all fuzzysets involves alocal summation modulated by the membership func-tion, this approach has another obvious advantage as itperforms a drastic reduction of the image noise presentin the unprocessed (raw) hyper-spectral data. In thismanner, the absorption bands that are characteristic foreach material are directly parameterized by the energycalculated for each fuzzyset.This fuzzy representation facilitates the analysis of the
spectral information in an efficient manner by addres-sing all conditions that were mentioned in the last partof the introductory section. In this regard, the proposeddata decorrelation scheme based on the spectrum fuzzy-fication does not involve any training procedures asthose required by other decorrelation techniques, suchas PCA, LDA, WD, or UDBS. In addition to this, theproposed technique allows the extraction of the spectralfeatures that are strongly related to the radiometricproperties of the analyzed materials and the dimension-ality of the hyper-spectral data is optimally reduced
Figure 3 Triangular shaped membership functions. Note that inthis diagram lCk (k Î [1,M]) denotes the central wavelengthassociated with the fuzzyset k.
Figure 4 An example that illustrates the membership gradeassociated with the wavelength li.
Picon et al. EURASIP Journal on Advances in Signal Processing 2011, 2011:66http://asp.eurasipjournals.com/content/2011/1/66
Page 4 of 10
since the fuzzyfication procedure maximizes the decorr-elation between adjacent spectral bands.
3. Application to non-ferrous materialclassificationAs indicated in the previous section, the proposed datadecorrelation scheme based on spectrum fuzzyficationimplements an efficient dimensionality reduction of theunprocessed hyper-spectral data by sampling the mostdiscriminative characteristics of the spectral bands thatmeasure the radiometric properties of the materialsincluded in the classification process. In order to evalu-ate the efficiency of the proposed technique, in this sec-tion we compare its performance against those attainedby different decorrelation schemes in the context ofnon-ferrous material classification.To evaluate the efficiency of the analyzed decorrela-
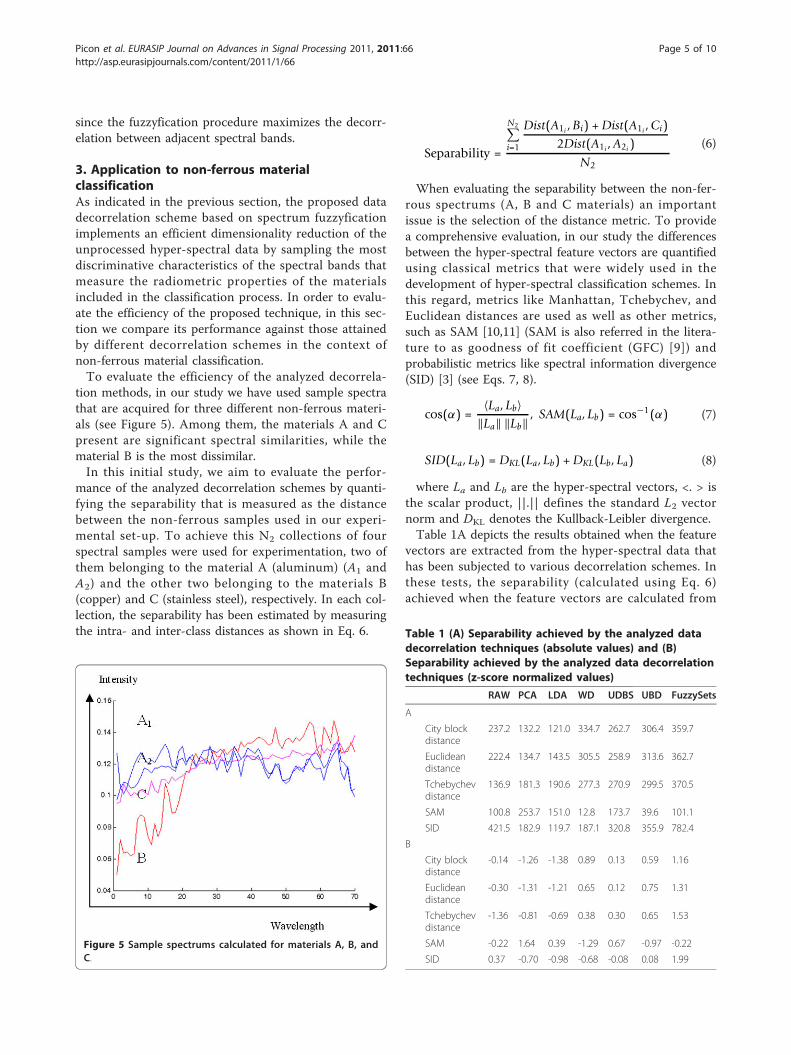
tion methods, in our study we have used sample spectrathat are acquired for three different non-ferrous materi-als (see Figure 5). Among them, the materials A and Cpresent are significant spectral similarities, while thematerial B is the most dissimilar.In this initial study, we aim to evaluate the perfor-
mance of the analyzed decorrelation schemes by quanti-fying the separability that is measured as the distancebetween the non-ferrous samples used in our experi-mental set-up. To achieve this N2 collections of fourspectral samples were used for experimentation, two ofthem belonging to the material A (aluminum) (A1 andA2) and the other two belonging to the materials B(copper) and C (stainless steel), respectively. In each col-lection, the separability has been estimated by measuringthe intra- and inter-class distances as shown in Eq. 6.
Separability =
N2∑i=1
Dist(A1i , Bi) + Dist(A1i , Ci)2Dist(A1i , A2i )
N2
(6)
When evaluating the separability between the non-fer-rous spectrums (A, B and C materials) an importantissue is the selection of the distance metric. To providea comprehensive evaluation, in our study the differencesbetween the hyper-spectral feature vectors are quantifiedusing classical metrics that were widely used in thedevelopment of hyper-spectral classification schemes. Inthis regard, metrics like Manhattan, Tchebychev, andEuclidean distances are used as well as other metrics,such as SAM [10,11] (SAM is also referred in the litera-ture to as goodness of fit coefficient (GFC) [9]) andprobabilistic metrics like spectral information divergence(SID) [3] (see Eqs. 7, 8).
cos(α) =〈La, Lb〉
‖La‖ ‖Lb‖ , SAM(La, Lb) = cos−1(α) (7)
SID(La, Lb) = DKL(La, Lb) + DKL(Lb, La) (8)
where La and Lb are the hyper-spectral vectors, <. > isthe scalar product, ||.|| defines the standard L2 vectornorm and DKL denotes the Kullback-Leibler divergence.Table 1A depicts the results obtained when the feature
vectors are extracted from the hyper-spectral data thathas been subjected to various decorrelation schemes. Inthese tests, the separability (calculated using Eq. 6)achieved when the feature vectors are calculated from
Figure 5 Sample spectrums calculated for materials A, B, andC.
Table 1 (A) Separability achieved by the analyzed datadecorrelation techniques (absolute values) and (B)Separability achieved by the analyzed data decorrelationtechniques (z-score normalized values)
RAW PCA LDA WD UDBS UBD FuzzySets
A
City blockdistance
237.2 132.2 121.0 334.7 262.7 306.4 359.7
Euclideandistance
222.4 134.7 143.5 305.5 258.9 313.6 362.7
Tchebychevdistance
136.9 181.3 190.6 277.3 270.9 299.5 370.5
SAM 100.8 253.7 151.0 12.8 173.7 39.6 101.1
SID 421.5 182.9 119.7 187.1 320.8 355.9 782.4
B
City blockdistance
-0.14 -1.26 -1.38 0.89 0.13 0.59 1.16
Euclideandistance
-0.30 -1.31 -1.21 0.65 0.12 0.75 1.31
Tchebychevdistance
-1.36 -0.81 -0.69 0.38 0.30 0.65 1.53
SAM -0.22 1.64 0.39 -1.29 0.67 -0.97 -0.22
SID 0.37 -0.70 -0.98 -0.68 -0.08 0.08 1.99
Picon et al. EURASIP Journal on Advances in Signal Processing 2011, 2011:66http://asp.eurasipjournals.com/content/2011/1/66
Page 5 of 10
raw (unprocessed) hyper-spectral data is comparedagainst the separability obtained where a range of datadecorrelation methods (such as PCA, LDA, WD [18],UBD [20], UDBS [23], and the proposed fuzzysets-basedmethod) are applied before feature extraction. Since theresults reported for the various distance metrics inTable 1A have different units and limits of variation, toallow a direct comparison they are normalized to acommon scale by using z-scores to attain zero meanand unit variance normalized results (i.e., standard vari-ables). The z-score normalized results are depicted inTable 1B.The experimental results shown in Table 1A, B indi-
cate that the proposed fuzzyset method outperforms theother analyzed techniques for all distance metrics withthe exception of SAM, where the decorrelation schemesbased on PCA, LDA, and UBD achieved better perfor-mance. These results are motivated by the fact that theSAM metric samples the variation in the orientationbetween hyper-spectral vectors and it does not explicitlymeasure the closeness in the hyper-spectral domainbetween the extracted feature vectors. However, it isuseful to mention that the increase in separability is notsufficient to fully characterize the performance of thedecorrelation techniques, but the preliminary resultsshown in Table 1A, B give an indication that the pro-posed technique produced more consistent results whencompared to those achieved by the classic decorrelationschemes. To fully evaluate the performance of the dec-orrelation methodologies analyzed in this investigation,the results shown in Table 1A, B will be complementedwith the results achieved when the data decorrelationalgorithms are evaluated in the context of materialclassification.To attain this objective, we have developed a classifi-
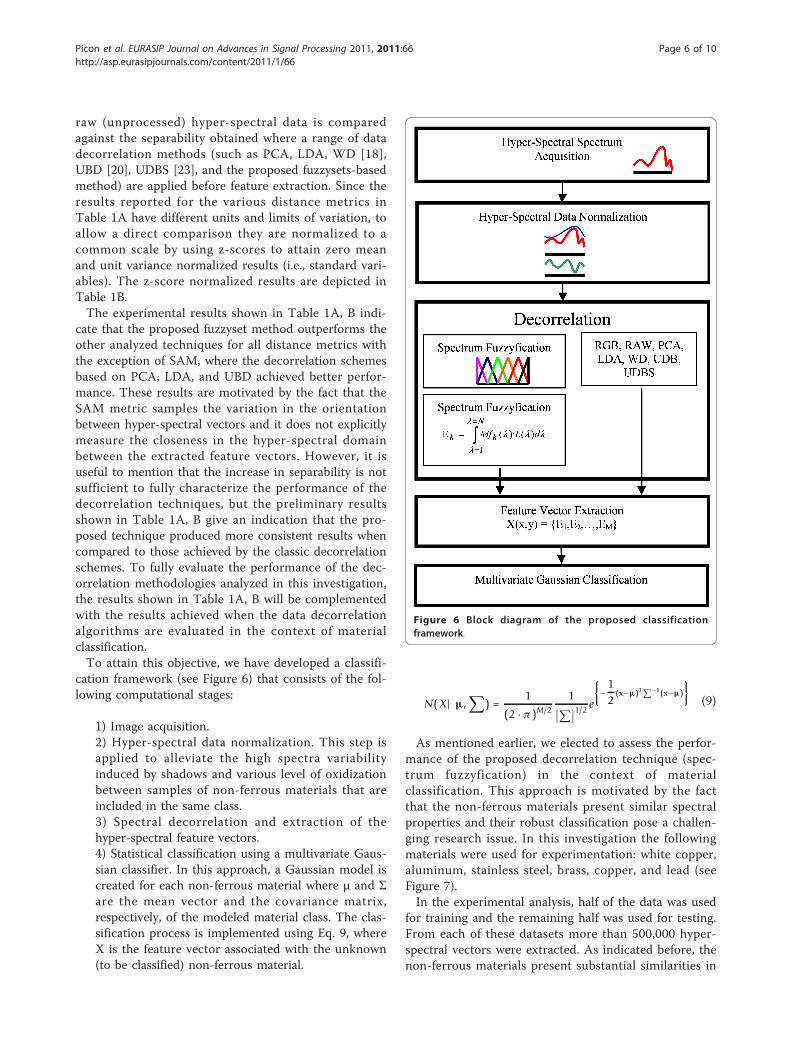
cation framework (see Figure 6) that consists of the fol-lowing computational stages:
1) Image acquisition.2) Hyper-spectral data normalization. This step isapplied to alleviate the high spectra variabilityinduced by shadows and various level of oxidizationbetween samples of non-ferrous materials that areincluded in the same class.3) Spectral decorrelation and extraction of thehyper-spectral feature vectors.4) Statistical classification using a multivariate Gaus-sian classifier. In this approach, a Gaussian model iscreated for each non-ferrous material where μ and Σare the mean vector and the covariance matrix,respectively, of the modeled material class. The clas-sification process is implemented using Eq. 9, whereX is the feature vector associated with the unknown(to be classified) non-ferrous material.
N(X| µ,∑
) =1
(2 · π)M/2
1∣∣∑∣∣1/2e
{−
12
(x−µ)T∑−1(x−µ)
}(9)
As mentioned earlier, we elected to assess the perfor-mance of the proposed decorrelation technique (spec-trum fuzzyfication) in the context of materialclassification. This approach is motivated by the factthat the non-ferrous materials present similar spectralproperties and their robust classification pose a challen-ging research issue. In this investigation the followingmaterials were used for experimentation: white copper,aluminum, stainless steel, brass, copper, and lead (seeFigure 7).In the experimental analysis, half of the data was used
for training and the remaining half was used for testing.From each of these datasets more than 500,000 hyper-spectral vectors were extracted. As indicated before, thenon-ferrous materials present substantial similarities in
Figure 6 Block diagram of the proposed classificationframework.
Picon et al. EURASIP Journal on Advances in Signal Processing 2011, 2011:66http://asp.eurasipjournals.com/content/2011/1/66
Page 6 of 10
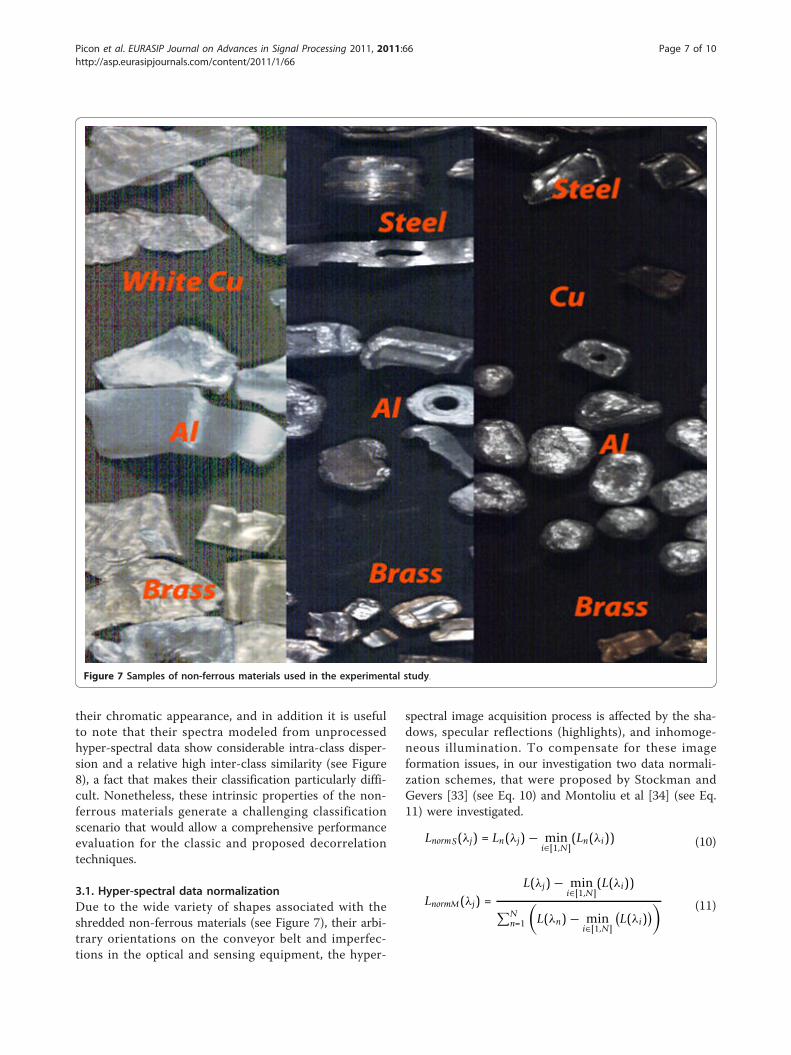
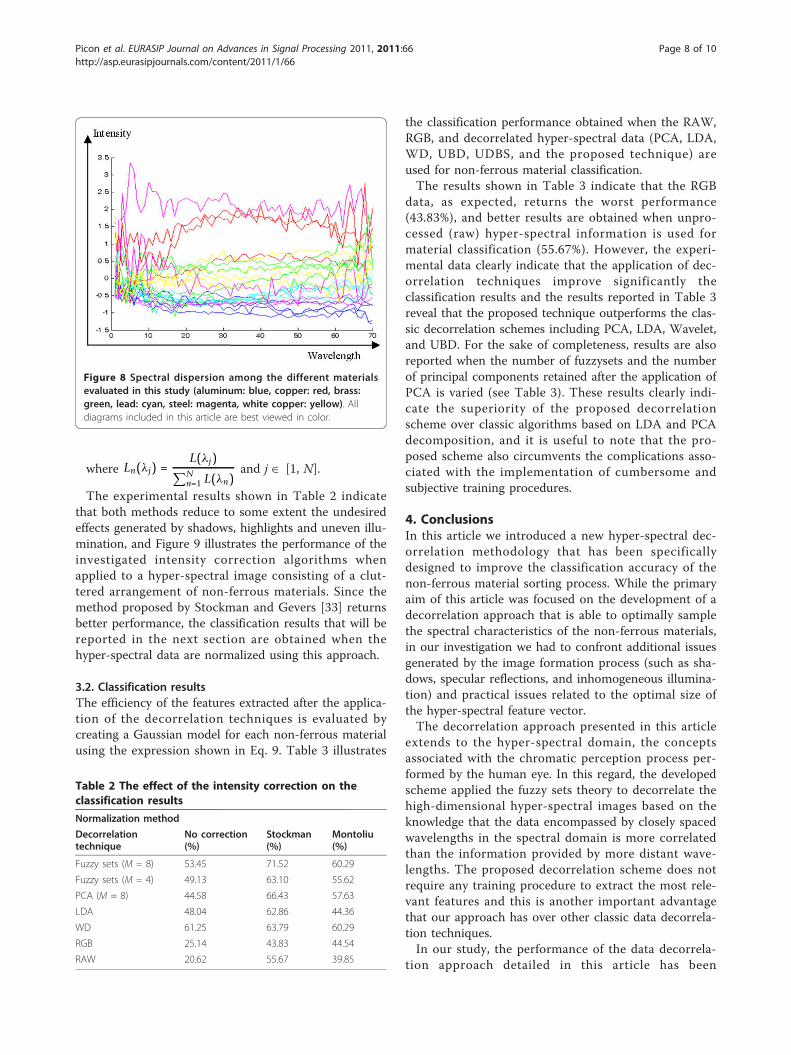
their chromatic appearance, and in addition it is usefulto note that their spectra modeled from unprocessedhyper-spectral data show considerable intra-class disper-sion and a relative high inter-class similarity (see Figure8), a fact that makes their classification particularly diffi-cult. Nonetheless, these intrinsic properties of the non-ferrous materials generate a challenging classificationscenario that would allow a comprehensive performanceevaluation for the classic and proposed decorrelationtechniques.
3.1. Hyper-spectral data normalizationDue to the wide variety of shapes associated with theshredded non-ferrous materials (see Figure 7), their arbi-trary orientations on the conveyor belt and imperfec-tions in the optical and sensing equipment, the hyper-
spectral image acquisition process is affected by the sha-dows, specular reflections (highlights), and inhomoge-neous illumination. To compensate for these imageformation issues, in our investigation two data normali-zation schemes, that were proposed by Stockman andGevers [33] (see Eq. 10) and Montoliu et al [34] (see Eq.11) were investigated.
LnormS(λj) = Ln(λj) − mini∈[1,N]
(Ln(λi)) (10)
LnormM(λj) =L(λj) − min
i∈[1,N](L(λi))
∑Nn=1
(L(λn) − min
i∈[1,N]
(L(λi)
)) (11)
Figure 7 Samples of non-ferrous materials used in the experimental study.
Picon et al. EURASIP Journal on Advances in Signal Processing 2011, 2011:66http://asp.eurasipjournals.com/content/2011/1/66
Page 7 of 10
where Ln(λj) =L(λj)∑N
n=1 L(λn)and j Î [1, N].
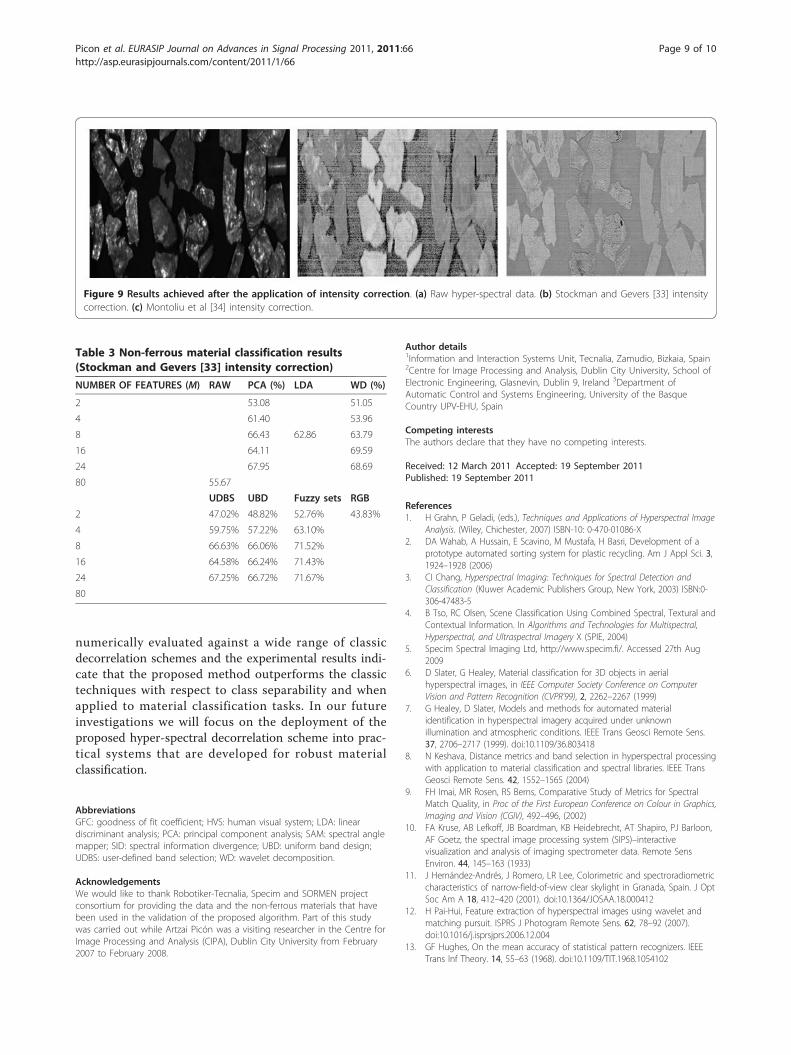
The experimental results shown in Table 2 indicatethat both methods reduce to some extent the undesiredeffects generated by shadows, highlights and uneven illu-mination, and Figure 9 illustrates the performance of theinvestigated intensity correction algorithms whenapplied to a hyper-spectral image consisting of a clut-tered arrangement of non-ferrous materials. Since themethod proposed by Stockman and Gevers [33] returnsbetter performance, the classification results that will bereported in the next section are obtained when thehyper-spectral data are normalized using this approach.
3.2. Classification resultsThe efficiency of the features extracted after the applica-tion of the decorrelation techniques is evaluated bycreating a Gaussian model for each non-ferrous materialusing the expression shown in Eq. 9. Table 3 illustrates
the classification performance obtained when the RAW,RGB, and decorrelated hyper-spectral data (PCA, LDA,WD, UBD, UDBS, and the proposed technique) areused for non-ferrous material classification.The results shown in Table 3 indicate that the RGB
data, as expected, returns the worst performance(43.83%), and better results are obtained when unpro-cessed (raw) hyper-spectral information is used formaterial classification (55.67%). However, the experi-mental data clearly indicate that the application of dec-orrelation techniques improve significantly theclassification results and the results reported in Table 3reveal that the proposed technique outperforms the clas-sic decorrelation schemes including PCA, LDA, Wavelet,and UBD. For the sake of completeness, results are alsoreported when the number of fuzzysets and the numberof principal components retained after the application ofPCA is varied (see Table 3). These results clearly indi-cate the superiority of the proposed decorrelationscheme over classic algorithms based on LDA and PCAdecomposition, and it is useful to note that the pro-posed scheme also circumvents the complications asso-ciated with the implementation of cumbersome andsubjective training procedures.
4. ConclusionsIn this article we introduced a new hyper-spectral dec-orrelation methodology that has been specificallydesigned to improve the classification accuracy of thenon-ferrous material sorting process. While the primaryaim of this article was focused on the development of adecorrelation approach that is able to optimally samplethe spectral characteristics of the non-ferrous materials,in our investigation we had to confront additional issuesgenerated by the image formation process (such as sha-dows, specular reflections, and inhomogeneous illumina-tion) and practical issues related to the optimal size ofthe hyper-spectral feature vector.The decorrelation approach presented in this article
extends to the hyper-spectral domain, the conceptsassociated with the chromatic perception process per-formed by the human eye. In this regard, the developedscheme applied the fuzzy sets theory to decorrelate thehigh-dimensional hyper-spectral images based on theknowledge that the data encompassed by closely spacedwavelengths in the spectral domain is more correlatedthan the information provided by more distant wave-lengths. The proposed decorrelation scheme does notrequire any training procedure to extract the most rele-vant features and this is another important advantagethat our approach has over other classic data decorrela-tion techniques.In our study, the performance of the data decorrela-
tion approach detailed in this article has been
Figure 8 Spectral dispersion among the different materialsevaluated in this study (aluminum: blue, copper: red, brass:green, lead: cyan, steel: magenta, white copper: yellow). Alldiagrams included in this article are best viewed in color.
Table 2 The effect of the intensity correction on theclassification results
Normalization method
Decorrelationtechnique
No correction(%)
Stockman(%)
Montoliu(%)
Fuzzy sets (M = 8) 53.45 71.52 60.29
Fuzzy sets (M = 4) 49.13 63.10 55.62
PCA (M = 8) 44.58 66.43 57.63
LDA 48.04 62.86 44.36
WD 61.25 63.79 60.29
RGB 25.14 43.83 44.54
RAW 20.62 55.67 39.85
Picon et al. EURASIP Journal on Advances in Signal Processing 2011, 2011:66http://asp.eurasipjournals.com/content/2011/1/66
Page 8 of 10
numerically evaluated against a wide range of classicdecorrelation schemes and the experimental results indi-cate that the proposed method outperforms the classictechniques with respect to class separability and whenapplied to material classification tasks. In our futureinvestigations we will focus on the deployment of theproposed hyper-spectral decorrelation scheme into prac-tical systems that are developed for robust materialclassification.
AbbreviationsGFC: goodness of fit coefficient; HVS: human visual system; LDA: lineardiscriminant analysis; PCA: principal component analysis; SAM: spectral anglemapper; SID: spectral information divergence; UBD: uniform band design;UDBS: user-defined band selection; WD: wavelet decomposition.
AcknowledgementsWe would like to thank Robotiker-Tecnalia, Specim and SORMEN projectconsortium for providing the data and the non-ferrous materials that havebeen used in the validation of the proposed algorithm. Part of this studywas carried out while Artzai Picón was a visiting researcher in the Centre forImage Processing and Analysis (CIPA), Dublin City University from February2007 to February 2008.
Author details1Information and Interaction Systems Unit, Tecnalia, Zamudio, Bizkaia, Spain2Centre for Image Processing and Analysis, Dublin City University, School ofElectronic Engineering, Glasnevin, Dublin 9, Ireland 3Department ofAutomatic Control and Systems Engineering, University of the BasqueCountry UPV-EHU, Spain
Competing interestsThe authors declare that they have no competing interests.
Received: 12 March 2011 Accepted: 19 September 2011Published: 19 September 2011
References1. H Grahn, P Geladi, (eds.), Techniques and Applications of Hyperspectral Image
Analysis. (Wiley, Chichester, 2007) ISBN-10: 0-470-01086-X2. DA Wahab, A Hussain, E Scavino, M Mustafa, H Basri, Development of a
prototype automated sorting system for plastic recycling. Am J Appl Sci. 3,1924–1928 (2006)
3. CI Chang, Hyperspectral Imaging: Techniques for Spectral Detection andClassification (Kluwer Academic Publishers Group, New York, 2003) ISBN:0-306-47483-5
4. B Tso, RC Olsen, Scene Classification Using Combined Spectral, Textural andContextual Information. In Algorithms and Technologies for Multispectral,Hyperspectral, and Ultraspectral Imagery X (SPIE, 2004)
5. Specim Spectral Imaging Ltd, http://www.specim.fi/. Accessed 27th Aug2009
6. D Slater, G Healey, Material classification for 3D objects in aerialhyperspectral images, in IEEE Computer Society Conference on ComputerVision and Pattern Recognition (CVPR’99), 2, 2262–2267 (1999)
7. G Healey, D Slater, Models and methods for automated materialidentification in hyperspectral imagery acquired under unknownillumination and atmospheric conditions. IEEE Trans Geosci Remote Sens.37, 2706–2717 (1999). doi:10.1109/36.803418
8. N Keshava, Distance metrics and band selection in hyperspectral processingwith application to material classification and spectral libraries. IEEE TransGeosci Remote Sens. 42, 1552–1565 (2004)
9. FH Imai, MR Rosen, RS Berns, Comparative Study of Metrics for SpectralMatch Quality, in Proc of the First European Conference on Colour in Graphics,Imaging and Vision (CGIV), 492–496, (2002)
10. FA Kruse, AB Lefkoff, JB Boardman, KB Heidebrecht, AT Shapiro, PJ Barloon,AF Goetz, the spectral image processing system (SIPS)–interactivevisualization and analysis of imaging spectrometer data. Remote SensEnviron. 44, 145–163 (1933)
11. J Hernández-Andrés, J Romero, LR Lee, Colorimetric and spectroradiometriccharacteristics of narrow-field-of-view clear skylight in Granada, Spain. J OptSoc Am A 18, 412–420 (2001). doi:10.1364/JOSAA.18.000412
12. H Pai-Hui, Feature extraction of hyperspectral images using wavelet andmatching pursuit. ISPRS J Photogram Remote Sens. 62, 78–92 (2007).doi:10.1016/j.isprsjprs.2006.12.004
13. GF Hughes, On the mean accuracy of statistical pattern recognizers. IEEETrans Inf Theory. 14, 55–63 (1968). doi:10.1109/TIT.1968.1054102
Figure 9 Results achieved after the application of intensity correction. (a) Raw hyper-spectral data. (b) Stockman and Gevers [33] intensitycorrection. (c) Montoliu et al [34] intensity correction.
Table 3 Non-ferrous material classification results(Stockman and Gevers [33] intensity correction)
NUMBER OF FEATURES (M) RAW PCA (%) LDA WD (%)
2 53.08 51.05
4 61.40 53.96
8 66.43 62.86 63.79
16 64.11 69.59
24 67.95 68.69
80 55.67
UDBS UBD Fuzzy sets RGB
2 47.02% 48.82% 52.76% 43.83%
4 59.75% 57.22% 63.10%
8 66.63% 66.06% 71.52%
16 64.58% 66.24% 71.43%
24 67.25% 66.72% 71.67%
80
Picon et al. EURASIP Journal on Advances in Signal Processing 2011, 2011:66http://asp.eurasipjournals.com/content/2011/1/66
Page 9 of 10
14. D Manolakis, D Marden, Dimensionality reduction of hyperspectral imagingdata using local principal component transforms. In Algorithms andTechnologies for Multispectral, Hyperspectral and Ultraspectral Imagery X(SPIE, 2004)
15. BK Feather, SA Fulkerson, JH Jones, RA Reed, M Simmons, D Swann, WETaylor, LS Bernstein, Compression technique for plume hyperspectralimages. Algorithms and Technologies for Multispectral, Hyperspectral andUltraspectral Imagery XI (SPIE, 2005)
16. P Tatzer, M Wolf, T Panner, Industrial application for inline material sortingusing hyperspectral imaging in the NIR range. Real-Time Imaging. SpectrImaging II. 11, 99–107 (2005)
17. KM Rajpoot, NM Rajpoot, Wavelet based segmentation of hyperspectralcolon tissue imagery, in 7th International Multi Topic Conference (INMIC2003) (Islamabad, Pakistan, 2003), pp. 38–43
18. P Kempeneers, S De Backer, W Debruyn, P Coppin, P Scheunders, Genericwavelet-based hyperspectral classification applied to vegetation stressdetection. IEEE Trans Geosci Remote Sens. 43, 610–614 (2005)
19. J Wang, CI Chang, Independent component analysis-based dimensionalityreduction with applications in hyperspectral image analysis. IEEE TransGeosci Remote Sens. 44, 1586–1600 (2006)
20. CH Lee, DA Landgrebe, Decision boundary feature extraction for non-parametic classification. IEEE Trans Syst Man Cybernet. 23, 433–444 (1993).doi:10.1109/21.229456
21. S Perkins, K Edlund, D Esch-Mosher, D Eads, N Harvey, S Brumby, Genie pro:robust image classification using shape, texture and spectral information, inAlgorithms and Technologies for Multispectral, Hyperspectral and UltraspectralImagery XI (SPIE. 2005)
22. H Kwon, SZ Der, NM Nasrabadi, H Moon, Use of hyperspectral imagery formaterial classification in outdoor scenes, in SPIE Proceedings Series,Algorithms, Devices, and Systems for Optical Information Processing III, Denver,USA. 3804, 104–115 (1999)
23. B Guo, RI Damper, SR Gunn, JD Nelson, A fast separability based feature-selection method for high-remotely sensed image classification. PatternRecog. 41, 1653–1662 (2008). doi:10.1016/j.patcog.2007.11.007
24. RN Clark, GA Swayze, Mapping minerals, amorphous materials,environmental materials, vegetation, water, ice and snow, and othermaterials: the USGS tricorder algorithm, in Summaries of the Fifth Annual JPLAirborne Earth Science Workshop, ed. by Green RO (JPL Publication 95-1,1995), pp. 39–40
25. S Nakariyakul, DP Casasent, Adaptive branch and bound algorithm forselecting optimal features. Pattern Recog Lett. 28, 1415–1427 (2007).doi:10.1016/j.patrec.2007.02.015
26. S Yu, S De Backer, P Scheunders, Genetic feature selection combined withcomposite fuzzy nearest neighbor classifiers for hyperspectral satelliteimagery. Pattern Recog Lett. 23, 183–190 (2002). doi:10.1016/S0167-8655(01)00118-0
27. M Bacauskiene, A Verikas, Selecting salient features for classification basedon neural network committees. Pattern Recog Lett. 25, 1879–1891 (2004).doi:10.1016/j.patrec.2004.08.018
28. LA Zadeh, Fuzzy sets. Inf. Control. 8, 338–353 (1965)29. SJ Sangwine, REN Horne, The Colour Image Processing Handbook, (Springer,
New York, 1998). ISBN 041280620730. A Stockman, DI MacLeod, NE Johnson, Spectral sensitivities of the human
cones. J Opt Soc Am A. 10, 2491–2521 (1993). doi:10.1364/JOSAA.10.00249131. A Stockman, LT Sharpe, The spectral sensitivities of the middle and long-
wavelength-sensitive cones derived from measurements in observers ofknown genotype. Vision Res. 40, 1711–1737 (2000). doi:10.1016/S0042-6989(00)00021-3
32. E Garrote, Algorithms for Colour Image Processing Based on NeurologicalModels (PhD Thesis, University of the Basque Country, Spain. 2011)
33. R Montoliu, F Pla, AC Klaren, Illumination intensity, object geometry andhighlights invariance in multispectral imaging. Lecture Notes in ComputerScience, (Heidelberg, Germany). 3522, 36–43 (2005). doi:10.1007/11492429_5
34. H Stockman, T Gevers, Detection and classification of hyper-spectral edges,in Proc of the 10th British Machine Vision Conference (1999), pp. 643–651
doi:10.1186/1687-6180-2011-66Cite this article as: Picon et al.: Biologically-inspired data decorrelationfor hyper-spectral imaging. EURASIP Journal on Advances in SignalProcessing 2011 2011:66.
Submit your manuscript to a journal and benefi t from:
7 Convenient online submission
7 Rigorous peer review
7 Immediate publication on acceptance
7 Open access: articles freely available online
7 High visibility within the fi eld
7 Retaining the copyright to your article
Submit your next manuscript at 7 springeropen.com
Picon et al. EURASIP Journal on Advances in Signal Processing 2011, 2011:66http://asp.eurasipjournals.com/content/2011/1/66
Page 10 of 10
![Decorrelation-based Piecewise Digital Predistortion ... · proposed closed-loop learning algorithm is based on a compu-tationally simple decorrelation-based learning rule [10], which](https://static.fdocuments.net/doc/165x107/60349bfa1bd7bc54b93f6fa4/decorrelation-based-piecewise-digital-predistortion-proposed-closed-loop-learning.jpg)