Biological control of Botrytis spp. by Ulocladium atrum
253
Biological control of Botrytis spp. by Ulocladium atrum through competitive colonisation of necrotic plant tissues Jürgen Köhl
Transcript of Biological control of Botrytis spp. by Ulocladium atrum

Biological control of Botrytis spp. by Ulocladiumatrum through competitive colonisation of necrotic plant tissues
Jürgen Köhl

Biological control of Botrytis spp.by Ulocladium atrum throughcompetitive colonisation ofnecrotic plant tissues
Jürgen Köhl

Wageningen, April 2004© 2004 Wageningen, Plant Research International B.V.All rights reserved. No part of this publication may be reproduced, stored in a retrieval system or
transmitted, in any form or by any means, electronic, mechanical, photocopying, recording or
otherwise, without the prior written permission of Plant Research International B.V.
Plant Research International B.V.
Address : Droevendaalsesteeg 1, Wageningen, The NetherlandsP.O. Box 16, 6700 AA Wageningen, The Netherlands
Tel. : +31 317 47 70 00Fax : +31 317 41 80 94E-mail : [email protected] : http://www.plant.wageningen-ur

Table of contents


Table of contents
PREFACE
SUMMARY
1 INTRODUCTION........................................................................ 1
1.1 Microbial suppression of colonisation of necrotic tissues by
necrotrophic fungal foliar pathogens............................................. 3
1.1.1 Biology of necrotrophic pathogens.............................................................. 31.1.2 Ecological niche characteristics ................................................................... 61.1.3 Antagonists attributes .................................................................................... 71.1.4 Biological control through microbial suppression of pathogen
colonisation of necrotic tissues and subsequent sporulation ................. 141.1.5 Conclusions ................................................................................................... 21
1.2 Selection, characteristics and use of Ulocladium atrum inbiocontrol of Botrytis spp. in necrotic tissues ............................. 22
1.2.1 Role of necrotic tissues in Botrytis epidemics ............................................ 231.2.2 Antagonist screening.................................................................................... 241.2.3 Effect of environmental factors on U. atrum............................................251.2.4 Mode of action of U. atrum .........................................................................271.2.5 Use of U. atrum for disease control in crops............................................. 28
2 MATERIAL AND METHODS................................................... 33
2.1 Materials....................................................................................... 35
2.2 Methods........................................................................................ 36
2.2.1 Role of necrotic tissues in Botrytis epidemics ............................................ 362.2.2 Antagonist screening.................................................................................... 432.2.3 Effect of environmental factors on U. atrum............................................492.2.4 Mode of action of U. atrum .........................................................................622.2.5 Use of U. atrum for disease control in crops............................................. 67
3 RESULTS..................................................................................... 79
3.1 Role of necrotic tissues in Botrytis epidemics............................ 813.1.1 Botrytis leaf spot in onion ............................................................................. 813.1.2 Botrytis grey mould in annual strawberries................................................. 843.1.3 Botrytis grey mould in cyclamen .................................................................. 88

Biological control of Botrytis spp. with Ulocladium atrum
3.2 Antagonist screening.................................................................... 89
3.2.1 Screening on necrotic onion leaves under controlled conditions.......... 893.2.2 Screening on field exposed necrotic lily leaves......................................... 97
3.3 Effect of environmental factors on U. atrum ..............................1053.3.1 Effect of temperature on conidial germination and mycelial
growth of U. atrum in comparison with Gliocladium spp. ......................1053.3.2 Effect of water potential on conidial germination of U. atrum ............1093.3.3 Effect of temperature on antagonism of U. atrum against B. cinerea
and B. aclada on necrotic leaf tissues ........................................................1153.3.4 Effect of water potential on antagonism of U. atrum against B. cinerea
on cyclamen leaves .....................................................................................1183.3.5 Persistence of U. atrum conidia on green leaves and subsequent com-
petitive colonisation of senesced leaves by B. cinerea and U. atrum......119
3.4 Mode of action of U. atrum.........................................................1353.4.1 Fungal interactions: microscopical and ultra-structural studies ...........1353.4.2 Competitive substrate colonisation: experimental studies and
simulation modelling ..................................................................................142
3.5 Use of U. atrum for disease control in crops ..............................1463.5.1 Experiments in strawberries......................................................................1463.5.2 Experiments in onion ................................................................................1513.5.3 Experiments in cyclamen under commercial growing conditions ......1553.5.4 Experiments in Pelargonium ........................................................................1633.5.5 Experiments in pot roses...........................................................................173
4 DISCUSSION .............................................................................177
4.1 Introduction ................................................................................179
4.2 Role of necrotic tissues in Botrytis epidemics............................180
4.3 Antagonist screening...................................................................183
4.4 Effect of environmental factors on U. atrum.................................188
4.4.1 Temperature ................................................................................................1884.4.2 Water potential............................................................................................1914.4.3 Persistence of conidia ................................................................................194

Table of contents
4.5 Mode of action of U. atrum.........................................................198
4.5.1 Fungal interactions: microscopical and ultra-structural studies ...........198
4.5.2 Competitive substrate colonisation: experimental studies andsimulation modelling ..................................................................................200
4.6 Use of U. atrum for disease control in crops ............................. 202
4.6.1 Strawberries .................................................................................................2024.6.2 Onion ...........................................................................................................2034.6.3 Cyclamen......................................................................................................2044.6.4 Pelargonium ....................................................................................................2054.6.5 Pot roses.......................................................................................................2074.6.6 Other crops or diseases .............................................................................208
4.7 Perspectives for development of a biocontrol agent based
on U. atrum ................................................................................ 209
5 LITERATURE CITED ..............................................................213


Preface


Preface
In this book an attempt is made to discuss concept development for biologicalcontrol of necrotrophic fungal foliar pathogens and to summarise results obtainedin research on the selection, characterisation and use of the antagonist Ulocladiumatrum in biocontrol of Botrytis spp. in necrotic plant tissues. This research has beencarried out during the period 1990-2001 at the DLO Research Institute for PlantProtection (IPO-DLO), merged into Plant Research International in 2000, inWageningen, the Netherlands.The main results presented in the book have been published earlier in a series ofpublications in scientific journals or book chapters as listed below. All authors ofpublications contributed significantly to the progress made in the different researchsteps. The book has been presented as thesis of postdoctoral lecturing qualification(Habilitationsschrift) at the faculty of agriculture of the Rheinische Friedrich-Wilhelms-Universität in Bonn, Germany, which has been accepted in December2003.
Substantial funding from different sources allowed the continuation of research onconcept development, antagonist screening and antagonist testing in different crop-ping systems. The main funding sources during the period 1990-2001 were:Dutch Ministry of Agriculture, Nature Management, and Fisheries (1990 - 2001);European Commission (FAIR3 PL96-1898 BIOSPORSUPPRESS (1996 - 2001);Dutch Product Board for Horticulture (Produktschap Tuinbouw) (1996 - 2000);Technology Foundation (STW) for G.J.T. Kessel (1995 - 1999);International Agricultural Centre (IAC) scholarships for J. Köhl (1989 - 1990),P.A.G. Elmer (1996), and T. Sesan (2000);Brazilian Government (CAPES-2959/95-0) for P. Boff (1997 - 2001);Stichting Nederlandse Uien-Federatie (SNUiF) (1989 - 1991).
Besides the authors of publications listed below, the support of many othercolleagues enabled the progress in our work. Our many fruitful discussions on theuse of U. atrum in disease control with the partners of FAIR3 PL96-1898BIOSPORSUPPRESS, H.-W. Dehne, P.C. Nicot, B. Dubos, W. van der Werf,M.H. Jijakli, N. Magan, F.M. Dewey, D. Berg and W.J. Ravensberg, contributedsignificantly to our research. J. de Bree, E. van Remortel, P. Vereijken and S.Burgers analysed data; J. Huizinga, M.R. Holdinga, J. Mekking and M. van denBogert took care of field experiments; and H. Terburg and H.M. Kleinjan-Meijering helped in lay out of this book. Many experiments in greenhouses or inthe field were only possible with the excellent support Applied Plant Research,Research Unit Glasshouse Horticulture, Naaldwijk, and Research Unit Fruit,Zetten, Schoneveld Twello B.V., Twello and Nolina B.V., Woubrugge.

Biological control of Botrytis spp. with Ulocladium atrum
Results of the following publications are presented in the book:
Köhl, J., Krijger, M.C. and Kessel, G.J.T. 1992. Drought tolerance of Botrytissquamosa, B. aclada and potential antagonist. In: Verhoeff, K., Malathrakis,N.E. and Williamson, W. (eds). Recent Advances in Botrytis Research.Pudoc Scientific Publishers, Wageningen. pp 206-210.
Köhl, J., Plas, C.H. van der, Molhoek, W.M.L. and Fokkema, N.J. 1993. Droughttolerance as a major selection criterium for antagonists of Botrytis spp. In:Fokkema, N.J., Köhl, J. and Elad, Y. (eds). Biological Control of Foliar andPostharvest Diseases. IOBC/WPRS Bulletin 16(11). pp 169-172.
Köhl, J. and Fokkema, N.J. 1994. Fungal interactions on living and necrotic leaves.In: Blakeman, J.P. and Williamson B. (eds). Ecology of Plant Pathogens.CABI, Oxon. pp 321-334.
Köhl, J., Molhoek, W.M.L., Plas, C.H. van der and Fokkema, N.J. 1995a. Suppres-sion of sporulation of Botrytis spp. as a valid biocontrol strategy. Eur. J.Plant Pathol. 101: 251-259.
Köhl, J., Molhoek, W.M.L., Plas, C.H. van der and Fokkema, N.J. 1995b. Effect ofUlocladium atrum and other antagonists on sporulation of Botrytis cinerea ondead lily leaves exposed to field conditions. Phytopathology 85: 393-401.
Köhl, J., Plas, C.H. van der, Molhoek, W.M.L. and Fokkema, N.J. 1995c. Effect ofinterrupted leaf wetness periods on suppression of sporulation of Botrytisallii and B. cinerea by antagonists on dead onion leaves. Eur. J. Plant Pathol.101: 627-637.
Köhl, J., Bélanger, R.R. and Fokkema, N.J. 1997. Interaction of four antagonisticfungi with Botrytis aclada in dead onion leaves: A comparative microscopicand ultrastructural study. Phytopathology 87: 634-642.
Köhl, J. and Fokkema, N.J. 1998. Strategies for biological control of necrotrophicfungal foliar pathogens. In: Boland, G.J. and Kuykendall, L.D. (eds). Plant-Microbe Interactions and Biological Control. Marcel Dekker, New York. pp49-88.
Köhl, J., Gerlagh, M., Haas, B.H. de and Krijger, M.C. 1998. Biological control ofBotrytis cinerea in cyclamen with Ulocladium atrum and Gliocladium roseum undercommercial growing conditions. Phytopathology 88: 568-575.
Kessel, G.J.T. 1999. Biological control of Botrytis spp. by Ulocladium atrum: an eco-logical analysis. PhD Thesis Wageningen University, Wageningen, theNetherlands.
Kessel, G.J.T., Haas, B.H. de, Lombaers-van der Plas, C.H., Meijer, E.M.J., Dewey,F.M., Goudriaan, J., Werf, W. van der and Köhl, J. 1999. Quantification ofmycelium of Botrytis spp. and the antagonist Ulocladium atrum in necrotic leaftissue of cyclamen and lily by fluorescence microscopy and image analysis.Phytopathology 89: 868-876.

Preface
Köhl, J. and Gerlagh, M. 1999. Biological control of Botrytis cinerea in roses by theantagonist Ulocladium atrum. Med. Fac. Landbouww. Univ. Gent 64/3b:441-445.
Köhl, J., Lombaers-van der Plas, C.H., Molhoek, W.M.L., Kessel G.J. and Goossen-van der Geijn, H.J. 1999. Competitive ability of the antagonist Ulocladiumatrum and Gliocladium roseum at temperatures favourable for Botrytis spp. devel-opment. BioControl 44: 329-346.
Köhl, J., Gerlagh, M., and Grit, G. 2000. Biocontrol of Botrytis cinerea by Ulocladiumatrum in different production systems of cyclamen. Plant Dis. 84: 569-573.
Boff, P. 2001. Epidemiology and biological control of grey mould in annual straw-berry crops. PhD Thesis Wageningen University, Wageningen, the Nether-lands.
Boff, P., Kastelein, P., Kraker, J. de, Gerlagh, M. and Köhl, J. 2001. Epidemiologyof grey mould in annual waiting-bed production of strawberry. Eur. J. PlantPathol. 107: 615-624.
Gerlagh, M., Amsing, J.J., Molhoek, W.M.L., Bosker-van Zessen, A.I., Lombaers-van der Plas, C.H. and Köhl, J. 2001. The effect of treatment withUlocladium atrum on Botrytis cinerea-attack of geranium (Pelargonium zonale)stock plants and cuttings. Eur. J. Plant Pathol. 107: 377-386.
Kessel, G.J.T., Haas, B.H. de, Lombaers-van der Plas, C.H., Ende, J.E. van der,Pennock-Vos, M.G., Werf, W. van der and Köhl, J. 2001. Comparativeanalysis of the role of substrate specificity in biological control of Botrytiselliptica in lily and B. cinerea in cyclamen with Ulocladioum atrum. Eur. J. PlantPathol. 107: 273-284.
Köhl, J. and Molhoek, W.M.L. 2001. Effect of water potential on conidial germi-nation and antagonism of Ulocladium atrum against Botrytis cinerea. Phytopa-thology 91: 485-491.
Boff, P., Köhl, J., Jansen, M., Horsten, P.J.F.M., Lombaers-van der Plas, C.H. andGerlagh, M. 2002. Biological control of gray mold with Ulocladium atrum inannual strawberry crops. Plant Dis. 86: 220-224.
Köhl, J., Molhoek, W.M.L., Goossen-van de Geijn, H.M. and Lombaers-van derPlas, C.H. 2003. Potential of Ulocladium atrum for biocontrol of onion leafspot through suppression of sporulation of Botrytis spp. BioControl 48: 349-359.

Biological control of Botrytis spp. with Ulocladium atrum

Summary


Summary
Botrytis spp. are causing economically important losses in the production of vegeta-bles, fruit and ornamentals. The world market for chemical control of Botrytis spp.is estimated 200-300 million euro per year. There is an urgent need for other con-trol methods because at future government regulations may restrict fungicide useand organic farming is still lacking efficient tools for Botrytis control. Second, resis-tance of B. cinerea populations against fungicides is a common problem so thatnovel disease control tools are needed for integrated use with fungicides to increasetheir commercial life-span.The objective of our research was to develop a concept for biological control ofBotrytis spp., to select antagonists and to test their use in economically importantcrops. We expected suppression of pathogen sporulation on necrotic plant tissuesto be a valid biocontrol strategy because the periods of interaction during this stageof the life cycle are long and other mechanisms than antibiosis can be exploited.Competitive substrate colonisation under a broad range of microclimatic condi-tions and persistence during long dry periods were identified as the key successfactors for biocontrol agents targeting at saprophytic pathogen development innecrotic tissues. Several research steps were necessary to develop such a biocontrolsystem:(1) Epidemiological knowledge on diseases caused by Botrytis spp. in different
crops was necessary to identify valid target tissues.(2) Suitable antagonists with a high competitive ability during the colonisation of
various necrotic plant tissues had to be selected.(3) Antagonists with superior ecological competence had to be found.(4) Knowledge on the mode of action of selected antagonists was needed to opti-
mise targeting and timing of antagonist applications.(5) The potential of the control strategy and applications of the selected antagonist
had to be studied under field and greenhouse conditions.These subsequent research steps have been carried out successfully. U. atrum (iso-late 385) has been found to be an antagonist suitable for application on necroticabove-ground plant tissues. U. atrum combines a high competitive colonisationability with a superior ecological competence. Main characteristics are the longpersistence of viable conidia on leaf surfaces, the high resistance to interruptions ofleaf wetness, and the strong antgonistic activity over a broad temperature range.Application strategies for U. atrum have been developed and disease control hasbeen achieved in strawberries, onion, cyclamen, pot roses and Pelargonium.In the meantime, other research groups applied U. atrum in grapevine and tomatoresulting in significant reductions of grey mould, and investigated methods formass production of U. atrum.In conclusion, U. atrum 385 fulfils all requirements tested so far for a biologicalcontrol agent so that the development and registration of a biocontrol productbased on U. atrum 385 is feasible. Further steps are now needed towards commer-cial exploitation of the results by developing and marketing a biocontrol agentbased on U. atrum.

Biological control of Botrytis spp. with Ulocladium atrum

1 Introduction

Introduction 3
1.1 Microbial suppression of colonisation of necrotictissues by necrotrophic fungal foliar pathogens
The different stages in the life cycle of pathogens and the vulnerability of each ofthese stages to biocontrol as well as ecological niche characteristics and antagonistsattributes form the basis for the development of biocontrol concepts (Köhl andFokkema, 1998). With this in mind possibilities and prospects for biocontrol ofnecrotrophic leaf pathogens through reduction of colonisation of necrotic tissuesand subsequent sporulation will be discussed. Profound knowledge of the biologyof the pathogen and its epidemiology is a prerequisite for the proper choice of thebiocontrol strategies to be followed.
1.1.1 Biology of necrotrophic pathogens
1.1.1.1 Life cycle of necrotrophic plant pathogens and biocontrolstrategies
Necrotrophic plant pathogens can only obtain nutrients from dead plant tissue.Consequently, for infection and colonisation of healthy leaves, host tissue has to bekilled in advance. The life cycle of necrotrophic pathogens can be separated intothree stages: the pathogenic stage during which healthy plant tissues are invadedand killed; the saprophytic and dissemination stage during which mycelium is de-veloping in the necrotic parts of lesions or in other necrotic plant tissues, oftenresulting in sporulation, and the survival stage during which mycelium, sclerotia orspores are resting in crop debris or soil.In many cases the infection by spores or mycelium of necrotrophic pathogens isdependent on or stimulated by exogenous nutrients such as pollen grains or hon-eydew (Chou and Preece, 1968; Fokkema 1973; Fokkema et al., 1983) and mediatedby cutinolytic and cellwall-degrading enzymes. Immediately after infection or aftera period of latency, the tissue surrounding the infection site is killed by pathogen-produced toxins or enzymes. Subsequently, the pathogen invades the freshly killedtissue utilising its nutrients. Tissue at the margin of the developing lesion is killedby the pathogen so that the lesion grows and the amount of substrate for pathogencolonisation increases. Mycelium within necrotic tissue contributes to the epide-miology of a necrotrophic pathogen in several ways: (1) The mycelium may infectdirectly adhering non-infected tissues so that the disease spreads within the plant orby direct contact to neighbouring plants. An example is the infection of leaf tissuevia pathogen-colonised senesced petals that had fallen onto the leaf (Zhou andReeleder, 1989). (2) Spores as inoculum for secondary spread of the disease in the

4 Biological control of Botrytis spp. with Ulocladium atrum
crop may be produced by the mycelium. (3) Sclerotia, melanised survival structures,may be produced that will form initial inoculum in following crops during laterseasons. (4) Mycelium may survive during climatic conditions not favourable forfungal growth during summer in arid regions or during winter (Yunis and Elad,1989; Rotem, 1990; Raposo et al., 2001). The choice of disease control strategies depends on the sensitivity of the pathogenand the effectivity of the control agent during the different stages of the pathogenslife cycle. Considering biological control it makes sense to distinguish betweenthree strategies: (1) microbial suppression of infection directed at non-germinatedor germinating spores as the initial stage of the pathogenic phase of the life cycle ofthe necrotrophic pathogen; (2) microbial suppression of mycelial colonisation andsurvival of the pathogen during its saprophytic stage in necrotic plant tissues as thesource of initial or secondary inoculum initiating new infection cycles; and (3) mi-crobial degradation of sclerotia as the initial inoculum in following growing sea-sons.Two main aspects have to be considered that both highly determine the choice ofsuitable antagonists aimed at the prevention of infection or at the suppression ofsaprophytic growth: firstly, the time period for possible interactions between an-tagonist and pathogen. Longer time periods of interaction will favour slower bio-logical mechanisms of interaction not based on immediate killing. Secondly, theecological characteristics of the niche in which interactions have to take place, af-fecting the population dynamics of the introduced antagonist.
1.1.1.2 Time period for antagonist-pathogen interactionsPathogen spores landed on an aerial plant surface may stay ungerminated for peri-ods of days if conditions are not favourable for germination. The longer the expo-sure to detrimental factors such as UV radiation or high temperatures, the lowerthe infectivity of the spore was found (Rotem and Aust, 1991; Rotem et al., 1985).Changing nutrient levels on the leaf surface and leaching of nutrients from thespore by bacterial activity may also affect the infectivity of the spore (Brodie andBlakeman, 1976; Blakeman and Brodie, 1976). Probably, the spore becomes moresensitive to antagonistic mechanisms with time. However, the actual time periodsfor interaction between the ungerminated spore of the pathogen and an antagonistmay be short since spore germination as well as antagonist activity is mostly deter-mined by the same favourable microclimatic conditions. Thus, antagonists mayinterfere with the pathogen spore mainly during germination and during the infec-tion process of the pathogen spore. The time needed for germination and infectiondepends on the pathogen and on environmental conditions. For Botrytis cinerea leafwetness of 8 h at 15 °C or 4 h at 21 °C is sufficient for the infection of geraniumflowers (Sirjusingh and Sutton, 1996). First infections of grape berries by B. cinereacan occur after 4 h wetness at temperatures between 12 °C and 30 °C (Broome etal., 1995). For the same pathogen, Nair and Allen (1993) found that at an optimum

Introduction 5
temperature of 24 °C 63% of inoculated grape flowers were infected after 1.3 h. Toprevent infections, antagonists must interfere with the germinating spores ofpathogens during these limited time periods of a few hours before the infectionprocess is completed. After the pathogen has penetrated the host tissue, it has es-caped from further antagonistic activity by plant surface inhabitants unless antago-nists also act via the plant by inducing resistance.The period between infection and induction of necrosis can last hours in the caseof highly infectious pathogens such as Sclerotinia sclerotiorum or weeks if latent peri-ods are part of the disease process as is typical for B. cinerea in soft fruit or grape-vine before ripening. After induction of necrosis, the pathogen rapidly colonisesthe killed tissue. The mycelium present in the lesions over a long period may con-tinue to produce conidia as long as it is alive. Antagonism during substrate coloni-sation and utilisation may not be limited by such short interaction times as foundon the leaf surface, since possible time periods are in the order of days or weeks,and if the pathogen mycelium survives in crop debris even in the order of months.Besides plant tissue killed by the pathogen, also host tissues naturally died duringaging or after abiotic or biotic injuries and necrotic tissues of non-hosts, e.g. weedsafter herbicide applications, are suitable substrates for saprophytic colonisation bynecrotrophic pathogens. Dependent on the crop, such substrates can form an es-sential source of inoculum of the pathogen. Examples are aged petals of beans,rapeseed, geranium or other crops fallen onto leaves where they act as exogenousnutrient source for mycelium and spores of B. cinerea or S. sclerotiorum enabling in-fections of the adjacent green leaf (Sirjusingh et al., 1996; Zhou and Reeleder,1989). In kiwifruit orchards, shoots injured by wind or frost and subsequently sap-rophytically colonised by B. cinerea, produce conidia which serve as inoculum forfruit contamination later in the growing season (Elmer et al., 1993). As in patho-gen-induced lesions, antagonists have long interaction periods of at least days tointerfere with pathogen development. Antagonists may also affect the long-termsurvival of pathogen mycelium in lesions and crop debris during periods unfavour-able for pathogen growth but not for the antagonist.It is interesting that fungicides are mainly designed for interference with the infec-tion process. Their immediate toxic nature makes them suitable for efficient pre-vention of infection during the limited period of time available. Fungicides are ingeneral not targeted at the saprophytic or the survival stage of the pathogen withinnecrotic host tissue and crop debris. An active systemic spread of common fungi-cides in such substrates is impossible and a passive diffusion unlikely as most of thefungicide may be bound to organic compounds of the cell walls and inactivated onthe surface. Furthermore, the uptake of chemicals by the pathogen may be muchslower during resting stages of the fungus as compared to that of infection struc-tures with high metabolic activity.

6 Biological control of Botrytis spp. with Ulocladium atrum
1.1.2 Ecological niche characteristics
Both pathogen and antagonist development in the phyllosphere is determined byseveral abiotic factors such as availability of nutrients, temperature, water availabil-ity, UV radiation and the deposition of agrochemicals. In contrast to the muchmore buffered soil systems, these environmental factors may rapidly change be-tween extremes, e.g. on hot and dry summer days with cool and dewy nights. De-tailed information on the microbial ecology of the phyllosphere can be found in theproceedings of several symposia (Preece and Dickinson, 1971; Dickinson andPreece, 1976; Blakeman, 1981; Fokkema and van den Heuvel, 1986; Andrews andHirano, 1992; Morris et al., 1996).
1.1.2.1 NutrientsOn healthy plant surfaces, important nutrient sources are mainly deposits.Leachates from the host plant may form a nutritional background (Tukey, 1970)but play no important role as long as cell membranes are intact (Schönherr andBaur, 1996). Exogenous nutrient deposits on the leaf may consist of pollen grains,flower remains, insect honeydew and organic and inorganic dust. Pollen grainsdeposited on the leaf surface leaching high amounts of easily degradable nutrientssuch as amino acids and sugars, are an important nutrient source in the phyl-losphere (Fokkema, 1971). The second important source, mainly containing sugars,is insect honeydew (Fokkema et al., 1983; Dik et al., 1991). The amount of nutri-ents available from these sources is not stable. Peaks in pollen deposition dependon the developmental stage of the crop and neighbouring vegetation. Similarly,honeydew secretion is not constant but is affected by e.g. aphid population dy-namics and developmental stage of the host plant.With respect to nutrient amounts and quality, necrotic leaf tissues markedly differfrom healthy leaf surfaces. In necrotic tissues, amino acid and soluble sugar con-tents are low since these substances are relocated during senescence to tissues thatare still green (Baddeley, 1971) or rapidly leached from the tissue. The remainingcell wall components such as cellulose, hemicellulose and lignin are the principalnutrient sources in necrotic tissues. These sources are more continuously flowingas compared to nutrient sources on green leaves. However, utilisation by sapro-phytic micro-organisms may be slower and adapted sets of enzymes are neededsince highly complex polymers have to be degraded.
1.1.2.2 MicroclimateWater availability and temperature in the boundary layer of green leaves (Burrage,1971) and in necrotic leaf tissues determine microbial growth. Rapid fluctuations inwater availability and temperature are characteristic of these niches and are mainfactors limiting the development of microbial populations. Microbial colonisers of

Introduction 7
leaf surfaces or of necrotic leaf tissue must have the capacity to survive during dryperiods (Diem, 1971) and to utilise the limited leaf wetness periods for rapid colo-nisation of the substrate. Therefore, short lag times for mycelial regrowth (Park,1982) or cell multiplication of single cell organisms are a prerequisite for successfulcolonisation.Temperature and water dynamics can be different on green and necrotic leaf tis-sues. When exposed to the sun, the temperature on surfaces of healthy leaves willbe regulated by water transpiration of the plant, but temperature of dry necroticleaf tissue can substantially rise above ambient temperatures, e.g. a temperature of42 °C was measured in necrotic onion leaf tips exposed to the sun while the airtemperature was 31 °C (Köhl and Fokkema, 1994). The affinity of dry necrotic leaftissue to water is low so that wetting of the tissue takes longer compared to greenleaf surfaces. However, leaf wetness periods in necrotic tissue may be longer thanon leaf surfaces since necrotic tissues have a great capacity to retain water. Theability to be active under conditions of low water potential has been pointed out asa major factor determining the ecological competence of saprophytes colonisingnecrotic tissues such as straw laying on soil or incorporated into soil (Magan andLynch, 1986; Pfender et al., 1991). During the initial stage of the drying process ofwetted necrotic tissue, its water potential does not substantially change. After mostof the water is evaporated, small changes of the water content result in a sharpdecrease of the water potential as demonstrated by Köhl et al. (3.2.1.4; 1995c) fordead onion leaves. Different from the more buffered situation in necrotic tissues inor on soil, water potentials between –3 MPa and –7 MPa were found in necroticonion leaf tips under field conditions only for time periods mostly shorter than30 min. during the wetting or drying process of above-ground necrotic tissues(Köhl et al., 1993). The ecological competence of saprophytes colonising suchabove-ground tissues may thus substantially be determined by their ability to with-stand such rapid changes between high water potentials suitable for optimumgrowth and those too low for any microbial growth.UV radiation is another detrimental factor for microbial colonisation of leaf sur-faces. Exposure of spores on leaf surfaces to direct UV radiation reduces theirlongevity (Rotem et al., 1985). Protection against UV radiation during the precolo-nisation stage is often achieved by pigmentation or cell clustering of the spores.After having invaded plant tissue, fungal mycelium is protected from the detri-mental effect of sunlight (Rotem and Aust, 1991).
1.1.3 Antagonists attributes
1.1.3.1 Mechanisms involved in antagonismSeveral mechanisms, operating alone or in concert, are known to be involved inantagonistic interactions in the phyllosphere. Nutrient competition, antibiosis and

8 Biological control of Botrytis spp. with Ulocladium atrum
mycoparasitism are the major mechanisms, not essentially differing from mecha-nisms operating in the soil or rhizosphere. Additional mechanisms such as inducedresistance, production of biosurfactants, interference with pathogen-related en-zymes, and undoubtedly a number of still unknown mechanisms may complete themicrobial arsenal, reviewed by Elad (1996). Particularly mechanistic studies havebenefited from molecular biology by identifying, deleting and supplementing genesresponsible for e.g. antibiotic production.Knowledge of mechanisms involved in biocontrol is important for estimating andpredicting its reliability and selection of better strains. Besides other criteria, thechoice of an antagonist with its characteristic mechanisms depends on the stage ofthe life cycle of the pathogen the antagonist is aimed at. Allowable interaction timesand niche characteristics determine the suitability of certain modes of action duringdifferent developmental stages of the pathogen.
Nutrient competition. Nutrient competition is involved in all situations in whichthe antagonist consumes nutrients which otherwise may be utilised by the patho-gen. The extent to which this reduces infection may vary with the infection strategyof the pathogen involved. In early studies (Fokkema, 1971) on the role of pollen oninfection of rye leaves by Cochliobolus sativus, Septoria nodorum and Puccinia reconditaf.sp. recondita is was found that spore germination and even more the superficialgrowth of mycelium of the two necrotrophic pathogens was highly stimulated bythe presence of pollen, resulting in more penetration sites and an up to tenfoldincrease of necrotic leaf area, whereas infection by the biotrophic rust was not en-hanced. There was a positive correlation between the superficial mycelium densityof C. sativus two to three days after inoculation and the necrotic leaf area. Presenceof phyllosphere yeasts reduced the enhanced mycelium density and the subsequentnecrosis (Fokkema, 1973). Large exogenous nutrient sources such as pollen andaphid honeydew (Fokkema et al., 1983; Dik et al., 1991) can rapidly be removed byphyllosphere yeasts. In the absence of these and similar resources such as flowerremains, micro-organisms may compete for leaf exudates and endogenous sporereserves. Blakeman and Brodie (1976) demonstrated that in the phyllosphere bacte-rial activity similar to soil fungistasis (Lockwood, 1988) inhibits spore germinationof B. cinerea, not only by competition for exogenous nutrients, particularly aminoacids (Brodie and Blakeman, 1975, 1976; Blakeman and Brodie, 1977), but also byutilisation of nutrients leached from ungerminated spores during water uptake.Using 14C-labelled glucose and amino acids and autoradiography Edwards andBlakeman (1984) showed that in the presence of Sporobolomyces sp. or Pseudomonasfluorescens and B. cinerea the nutrients were partitioned in favour of the antagonists.On detached wheat leaves, Sporobolomyces roseus separated from conidia of C. sativusand the leaf by cellophane inhibited spore germination, but this was restored whenthe cellophane with the yeasts had been removed, indicating that yeasts may oper-ate by a constant nutrient stress and that no other mechanisms were involved inthis interaction (Fokkema, 1984). Subsequent to these results it was questioned

Introduction 9
whether microbial nutrient stress could also affect the physiology of the leaf re-sulting in early senescence. Analysis of field observations and direct studies, how-ever, revealed no detrimental effect of phyllosphere yeasts (Frossard et al., 1983).Nutrient stress is only a suitable mechanism of antagonism for pathogens whichare sensitive to it and of which infection thus can be stimulated by nutrient addi-tion (e.g. 1% sucrose + 0.5% yeast extract). Consequently biotrophic pathogens,e.g. rusts and mildews, are not affected by nutrient competition, but necrotrophicpathogens generally are. Colletotrichum spp. may form an interesting group, becauseP. fluorescens increased the number of melanised appressoria of C. acutatum(Blakeman and Parbery, 1977) and C. coccodes, a potential mycoherbicide of vel-vetleaf (Fernando et al., 1994, 1996).On the other hand yeasts reduced infection of maize by C. graminicola by 50% byreducing penetration from the appressoria without any effect on germination,superficial mycelium, and appressoria formation (Williamson and Fokkema, 1985).The outcome of nutrient competition seems very subtle with respect toColletotrichum spp. and may vary with the efficiency to remove the nutrients andprevailing environmental conditions. Competition is mostly studied with respect toC and N sources. The possible involvement of siderophores or artificial iron-chelating agents in suppressing or stimulating leaf pathogens is intriguing(Swinburne, 1981; Fernando et al. 1996) but will not be discussed in detail since theproduction of bacterial siderophores in the phyllosphere has not been clearlydemonstrated.Unfortunately research on nutrient competition can profit less from moleculartechniques than research on other mechanisms in which a single product is in-volved. Consequently nutrient competition is often the last option, investigatedonly when other mechanisms seem not to be involved, but this is not indicative ofits importance.
Antibiotics. Antibiotic-producing micro-organisms were often considered first insearching for biocontrol agents since the selection of micro-organisms with thepotential to produce antibiotics can be realised with little effort in screening on agaror in liquid culture. Inhibition zones can be quantified and antibiotic substancescharacterised. The screening for antibiotic production by candidate antagonists onartificial media is an adequate tool to detect antibiotics as basic structures for newfungicide groups. In fact the phenylpyrrole group of fungicides is obtained frompyrrolnitrin (De Waard et al., 1993), an antibiotic produced by e.g. P. cepacia(Janisiewicz and Roitman, 1988). However, the use of in vitro assays for a firstselection of antagonists among unknown micro-organisms is questionable.Inhibition zones in in vitro interactions seldom predict for field performance of abiocontrol agent. Moreover, these zones may also be caused by stailing productsformed by the pathogen (Fokkema, 1973).Production of antibiotic secondary metabolites is common for many micro-organisms. The effect of antibiotics shows much similarity with the use of fungi-

10 Biological control of Botrytis spp. with Ulocladium atrum
cides. The presence of antibiotics on the leaf surface produced by antagonists mayensure efficient control of pathogens also during the characteristically short timeperiods during the infection process, since disorganisation of cytoplasmic struc-tures of host cells can be observed after short interaction times (Bélanger et al.,1995). Biocontrol agents producing antibiotics are often viewed as in situ producersof chemical control agents (Upper, 1992). However, the amounts of antibioticsproduced by antagonists depend on its population density and on environmentalconditions (Leifert et al., 1995).Several antibiotic-producing bacteria are candidates for use in biological control ofnecrotrophic leaf pathogens. Examples are Bacillus brevis producing gramicidin Swith high in vitro activity against B. cinerea (Edwards and Seddon, 1992) and B.subtilis CL27 producing two antibiotics with high activity against the same pathogen(Leifert et al., 1995). Reports on antibiotic production by yeasts to be exploited inbiocontrol are rare. The yeast-like fungus Aureobasidium pullulans and several yeastsare found to produce a range of antibacterial compounds (McCormack et al., 1994).Several antibiotic-producing hyphal fungi have been used in biocontrol studies.Examples are Epicoccum nigrum producing antibiotic compounds effective against B.cinerea (Hannusch and Boland, 1996a), S. sclerotinia (Hannusch and Boland 1996b;Zhou and Reeleder, 1989; 1991) and Monilinia laxa (Madrigal et al., 1994) andChaetomium globosum, an effective antagonist of Venturia inaequalis (Heye andAndrews, 1983; Boudreau and Andrews, 1987), producing two antifungalsubstances (Di Pietro et al., 1992). The antagonism of a strain of Trichodermaharzianum seems also to be based on antibiotics causing disorganisation of thecytoplasm within 12 h and subsequent cell death of B. cinerea (Bélanger et al., 1995).Antagonistic activity may continue for some time also when environmentalconditions become unfavourable for antagonist growth. This may explain the stableeffect of plant treatments with suspensions of E. nigrum on B. cinerea and S.sclerotiorum on bean leaves under a broad range of temperatures and relativehumidities (Hannusch and Boland, 1996a; b). The presence of antibiotics may alsoexplain the antagonistic activity of C. globosum against B. cinerea under certain fieldconditions independent of the presence of an actively growing population of theantagonist (3.2.2.4; Köhl et al., 1995b).Two factors limit the utilisation of antibiotics. Firstly, antibiotics must continuouslybe present on the surface to protect the leaf from new infections. However, antibi-otics are generally not stable under field conditions for long periods or may bebound on plant surfaces. As a consequence, antagonist populations must continu-ously be present in sufficiently high densities to produce new antibiotics. Bacterialantagonists successfully controlled Phytophthora infestans under controlled environ-mental conditions where high humidities were maintained but not in the field(Jongebloed et al., 1993). This discrepancy between field and controlled environ-mental conditions in the biocontrol of P. infestans suggests that the antibiotics heldresponsible for the effect, decline under field conditions as rapidly as the antago-nistic population. A breakdown by abiotic factors was found for antibiotics pro-

Introduction 11
duced by C. globosum, an antagonist applied against V. inaequalis in apple (Boudreauand Andrews, 1987), explaining why field efficacy of the antagonist was not suffi-cient. Gramicidin S produced by B. brevis, efficiently reducing growth of B. cinerea invitro, was found to be strongly adsorbed to leaf surfaces (Edwards and Seddon,1992). No disease control activity was found by the inactivated adsorbed antibiotic.Secondly, the pathogen may build-up resistance against the antibiotic e.g. Botrytiscinerea, a pathogen frequently found to become resistant against fungicides, alsodeveloped resistance against two antibiotics produced by Bacillus subtilis after ninesubsequent crops of Astilbe had been sprayed with the antagonist (Li and Leifert,1994).
Mycoparasitism. Mycoparasitism is described for many fungus-fungus relation-ships. Enzymes degrading fungal cell walls such as chitinases and beta-glucanasesare commonly produced by hyperparasites (Elad et al., 1982). Parasitism dependson close contact between antagonist and host, on the secretion of enzymes and onthe active growth of the hyperparasite into the host. These processes need time sothat it is unlikely that infection structures of pathogens can be parasitised and killedrapidly enough to prevent penetration of the host plant. When studying thechronological events during the interaction between T. harzianum and B. cinerea atultra-structural level, Bélanger et al. (1995) found evidence for antibiosis early dur-ing interaction within the first 12 h, but clear chitinolytic activity of the antagonistcould not be demonstrated before the tenth day of interaction.Mycoparasitism is often exploited for biological control of biotrophic pathogens(Kranz, 1981), e.g. Verticillium lecanii parasitising on rusts (Spencer, 1980) andAmpelomyces quisqualis or Verticillium lecanii parasitising on powdery mildews ofcucumber or roses (Philipp and Crüger, 1979; Verhaar et al., 1993). Parasitism isthen aimed at pathogen mycelium already established on the host and reducedsporulation of the pathogen limits its dissemination.Mycelial development of necrotrophic pathogens can also be controlled by myco-parasites. The mycoparasite Coniothyrium minitans penetrates into mycelium of S.sclerotiorum that subsequently collapses and becomes necrotic (Whipps and Gerlagh,1992). The production of beta-1,3 glucanases and chitinases enables the mycopara-site to utilise the host cells; mycelium of the mycoparasite proliferates around deadhyphae of the host fungus. Above all, C. minitans is a potent parasite of sclerotia ofS. sclerotiorum reducing the survival of sclerotia in field trials by c. 90% (Gerlagh etal., 1995). Also the antagonist Limonomyces roseipellis has chitinolytic activity and it issuggested that mycoparasitism is one of the mechanisms involved in its antagonismagainst Pyrenophora tritici-repentis in the debris of wheat crops (Pfender, 1988).
Induced resistance. Host resistance induced by phyllosphere micro-organisms asa mechanism of biocontrol has been studied in detail by Schönbeck and Dehne(1986) with respect to powdery and downy mildews and rusts. Cultures filtrateswith bacterial metabolites induced in wheat against powdery mildew responses

12 Biological control of Botrytis spp. with Ulocladium atrum
similar to those associated with partial resistance. Repeated field applications re-duced yield losses caused by Erisyphe graminis (Dehne et al., 1984). Induced resis-tance as a mechanism for biocontrol may have the advantage that, once resistancehas been induced, high population densities of the antagonists may no longer berequired. However, there is only some circumstantial evidence for the involvementof induced resistance in biocontrol of necrotrophic leaf pathogens (Elad et al., 1994a; b). Induction of resistance is currently particularly important as a mechanism ofnewly developed environmentally friendly fungicides (Kessmann et al., 1994). Sinceinduction of resistance requires metabolically active plant cells, this mechanismcannot be exploited in necrotic tissues.
Change of leaf surface wettability. The change of the leaf wettability by surfaceactive bacteria is a common natural phenomenon. Such changes can affect the leafwetness duration, the redistribution of nutrients and micro-organisms and theirattachment to leaves (Bunster et al., 1989). Treatments of Chinese cabbage with asuspension containing B. brevis significantly reduced infections by B. cinerea by 65 to71% in experiments in polythene tunnels (Edwards and Seddon, 1992). It could bedemonstrated that leaf wetness of Chinese cabbage was shorter when sprayed withthe bacterial suspension as compared to the water control treatment. Leaf wetnessafter overhead irrigation was four times shorter for leaves treated with B. brevis(Seddon and Edwards, 1993; Seddon et al., 1997). It was postulated that thischange of water availability limited the germination of B. cinerea conidia. Antago-nists producing biosurfactants reducing leaf wetness periods may be utilised againsta wide range of fungi since germination and subsequent infection of pathogenspores depends on a minimum time period during which free water is available onthe surface.
Interference with enzyme production of pathogen. During the infection proc-ess cutinolytic, pectinolytic and cellulolytic enzymes are produced by pathogens toallow penetration through the cuticula and into host tissues. Zimand et al. (1995)found that the enzymatic activity of pectinolytic enzymes, polygalacturonase, pec-tin-methyl-esterase and pectate-lyase, produced by B. cinerea was less in the presenceof the antagonist Trichoderma harzianum T-39 and that disease of bean leaves wasreduced. They stated that the antagonism of that specific isolate is partly based ondirect or indirect effects on the enzyme production of the pathogen during theinfection process.The enzyme production of pathogens is increased by leachates from pollen grainsas shown for polygalacturonases and cellulases of Helminthosporium sativum byFokkema (1971). Reduced enzyme production may be a result of the absence ofsuch inducing substances on the leaf surface and thus indirectly the effect ofnutrient competition between pathogen and antagonist such as yeasts consumingpollen leachates. In experiments with Colletotrichum graminicola, the infectionfrequency on maize leaves was reduced by 50% in the presence of yeasts

Introduction 13
(Williamson and Fokkema, 1985) but no reduction of spore germination, superficialgrowth and appressorium production of the pathogen before host penetration wasfound as in other yeast-pathogen interactions e.g. with Cochliobolus sativus (Fokkema,1984). Instead, penetration from the appressoria was reduced by 50% and it wassuggested that the nutrient sink produced by yeasts led to a reduced production ofenzymes involved in cell-wall penetration.
1.1.3.2 Ecological competence as selection criterion for antagonistsThe leaf surface environment differs in many aspects from soil as the other habitatin which biological control has been applied. In soil habitats, environmental condi-tions may vary between sites but are relatively stable in time compared to the rapidfluctuations in the phyllosphere. The introduction of soil inhabiting antagonistsinto the above-ground environment may fail because they are not adapted to theharsh microclimatic conditions. Since the successful establishment of antagonistpopulations is a prerequisite for long-lasting control and the control efficacy isgenerally related to population sizes of the antagonist, the ecological competence ofantagonists is a key selection factor for biocontrol agents. Generally, the antagonistshould be equally or preferably be better adapted to adverse environmental factorsthan its target pathogen in order to become a successful biocontrol agent. Validselection criteria to identify antagonists with high ecological competence can bederived from thorough knowledge of the practical cropping situation. Antagonistinoculum must survive during unfavourable conditions, e.g. high temperatures ordryness. Mechanisms to increase survival are the production of slime, protectingcells from drying, or pigmentation, protecting from detrimental effects of UV ra-diation (Dickinson, 1976) as also found for colonisers of stone surfaces (Gutiérrezet al., 1995).Antagonists must reach high growth rates under favourable conditions during leafwetness at moderate temperatures and with sufficient nutrient supply as well asunder marginal conditions e.g. at low temperatures or at low water potentials.Pathogens and their potential antagonists can markedly differ in their activity at lowwater potentials and low temperatures. Pfender et al. (1991) compared the potentialof antagonists to suppress the colonisation of wheat straw by Pyrenophora tritrici-repentis at low water potentials. They found that relatively few antagonists such asAcremonium terricola, Epicoccum nigrum, Myrothecium roridum and Stachybotrys sp. couldcompete with the pathogen at –7 MPa. In experiments aimed at the suppression ofsporulation of Botrytis spp. on necrotic leaf tissues, Gliocladium roseum andTrichoderma viride were highly effective in moist chambers (Köhl et al., 1992). Whenthe water potential of dead leaf tissues was reduced to –6.6 MPa, G. roseum was stilleffective but T. viride failed to control Botrytis sporulation. Köhl and Schlösser(1988) found that isolates of T. viride grew better at low temperatures than those ofother Trichoderma spp., and destroyed sclerotia of B. cinerea even at 5 °C in ex-periments under controlled conditions (Köhl and Schlösser, 1989).

14 Biological control of Botrytis spp. with Ulocladium atrum
Particularly for above-ground applications, antagonists must be adapted to rapidchanges between unfavourable and favourable conditions with short lag-times forregrowth e.g. to profit from short periods of leaf wetness. Zhang and Pfender(1993) investigated the effect of wetness periods on straw-colonising antagonistssuppressing ascocarp formation of P. tritici-repentis. The antagonists Laetisaria arvalisand Limonomyces roseipellis reduced ascocarp formation when wetness periods lasted24 or 48 h but not when wetness periods were shorter.Knowledge about the autecology of candidate antagonists helps to restrict thenumber of isolates that have to be tested under more practical and complex condi-tions. However, their synecology in the natural systems is the criterion that finallywill determine their competitive ability under the practical conditions (Andrews,1990).
1.1.4 Biological control through microbial suppression of patho-
gen colonisation of necrotic tissues and subsequent
sporulation
The exploitation of antagonistic interactions during the saprophytic stage of anecrotrophic pathogen has the advantage of significantly longer interaction timesbetween antagonist and pathogen as compared to interactions during the infectionprocess of fungal spores (Fokkema, 1993). Theoretically, longer interaction timesincrease the chance of successful antagonistic interactions and consequently thereliability of biocontrol. Antagonism in necrotic tissue can be based on nutrientcompetition, mycoparasitism or antibiosis (Heye and Andrews, 1983; Pfender,1988).Antagonists in necrotic tissue may control infection of healthy tissue adjacent tonecrotic tissue and can suppress sporulation of the pathogen. Although with thelatter there is no direct effect on symptom development as with the prevention ofinfection, the long-term effect on disease epidemics is evident. Antagonists reducethe number of spores produced by the pathogen on the necrotic tissue so that theinitial disease pressure or the secondary dissemination of the disease within a cropis limited. This principle of sporulation suppression for biological control has suc-cessfully been applied with biotrophic pathogens, where other principles e.g. nutri-ent competition between antagonist and infecting spore of the pathogen cannot beexploited. Epidemics of Puccinia recondita in wheat can be affected by the rust myco-parasite Eudarluca caricis so that the final disease severity can be reduced by 60 to80% as evaluated by Hau and Kranz (1978) using model-computation. Bacillus sub-tilis reduces spore production and spore viability of Uromyces appendiculatus on leavesof Phaseolus vulgaris and a retardation of rust epidemics by this antagonist is ex-pected (Mizubuti et al., 1995). Powdery mildew of cucumber and roses can be
Introduction 15
controlled by Ampelomyces quisqualis or Sporotrix fugilosa, respectively (Philipp andCrüger, 1979; Bélanger et al., 1994)The impact of reduced inoculum levels of necrotrophic pathogens on diseases canbe demonstrated by results of investigations on the epidemiological impact of de-bris as primary inoculum source and on the relationships between initial or secon-dary inoculum quantities and disease progression.
1.1.4.1 Reduction of inoculum loadDebris as carrier of initial inoculum and relationship between initialinoculum and disease progression. Crop debris containing mycelium, sclerotiaor fruiting bodies of necrotrophic pathogens are the main sources of initialinoculum for epidemics of diseases such as caused by Botrytis cinerea (Braun andSutton, 1987; Nair and Nadtotchei, 1987; López-Herrera et al., 1994; Yunis andElad, 1989), Pyrenophora tritici-repentis (Adee and Pfender, 1989), Cercospora zeae-maydis(De Nazareno et al., 1993), Venturia inaequalis (Heye and Andrews, 1983) orAlternaria macrospora (Rotem, 1990).Eradication of the inoculum surviving in debris by means of antagonist applicationmay retard disease progression. In a field experiment, Rotem (1990) investigatedthe effect of the presence of crop debris as a source of initial inoculum on theepidemic of a disease in cotton caused by A. macrospora. The onset of the epidemicwas four weeks earlier in the presence of crop debris compared to debris-free plots.After eight weeks all plants showed lesions in the presence of debris compared toonly 3% of the plants in debris-free plots. Soil solarisation can be an effectivemeans to eradicate pathogen inoculum, e.g. mycelium and sclerotia of B. cinerea indebris within greenhouses as demonstrated by López-Herrera et al. (1994). Tillagesystems leaving corn residues on the soil surface favour grey leaf spot development,caused by C. zeae-maydis, of the following corn crop (Payne et al., 1987; DeNazareno et al., 1993). In both field studies, the effect of different levels of cornresidues on the soil-surface, due to different tillage systems or created by artificialspread in the experimental plots, respectively, on grey leaf spot epidemics wereinvestigated. Significant increases of grey leaf spot development were found withhigher residue levels and disease severities correlated with residue amounts as initialinoculum sources.However, the sole reduction of initial inoculum of polycyclic disease may not besufficient in all cropping systems. Pathogens such as U. phaseoli in bean, C. arachidi-cola in peanut and B. cinerea in begonia can compensate initial low inoculum dosesby accelerated rates of disease progression (Plaut and Berger, 1981). Furthermore,the progression of epidemics may more depend on environmental conditions thanon the level of initial inoculum as shown for leaf spot diseases in alfalfa (Medicagosativa) caused by Leptosphaerulina trifolii, Phoma medicaginis, Stemphylium botryosum andC. medicaginis (Duthie and Campbell, 1991). Pfender et al. (1993) found that a re-duction of the primary inoculum of P. tritici-repentis formed on wheat straw by 60 to

16 Biological control of Botrytis spp. with Ulocladium atrum
80% was not sufficient to control polycyclic epidemics of tan spot in wheat. Theypostulated that a reduction of more than 90% of initial inoculum is necessary tocontrol tan spot epidemics.In strawberries, B. cinerea produces conidia on overwintering leaves. Such conidiamay infect flowers, causing substantial yield losses. In this monocyclic process,control of sporulation of B. cinerea by early spring applications of fungicides ontooverwintering leaves reduced flower infections later in the season (Jordan andPappas, 1977; Braun and Sutton, 1986). Sclerotinia sclerotiorum produces ascosporesarising from sclerotia as primary inoculum and no secondary dissemination viaconidia occurs. A reduction of the soil infestation with sclerotia can lead to areduced disease incidence in following crops (Gerlagh et al., 1995).
Relationship between secondary inoculum and disease progression. Onceinitiated, disease progression depends on several disease components: infectionfrequency, latent period, lesion size and sporulation capacity. Applications of an-tagonists interfering with the pathogen in lesions may substantially reduce sporeproduction per unit area of lesions. Antagonists may additionally slow down lesionexpansion.Leonard and Mundt (1984) applied a model to estimate the epidemiological effectsof reproduction per generation and latent period of biotrophic leaf pathogens inrelation to breeding of cultivars with increased quantitative polygenic resistance.They found that for pathogens with short latent periods, a reduction of the repro-duction per generation is more effective than to increase the latent period.Sache and de Vallavieille-Pope (1995) analysed the sporulation and infection char-acteristics of a range of airborne plant pathogens. They stated that for necro-trophic leaf pathogens with short latent periods and large sporulation capacity dis-ease control methods decreasing the sporulation capacity would be of great benefit.The validity of the reduction of spore production as a strategy for biological con-trol can be illustrated by epidemiological studies of necrotrophic pathogens. Sup-pression of spore production aimed at a slower build-up of epidemics is utilised inIntegrated Pest Management (IPM) programs and breeding programs. When fungi-cides are applied protectively, infection frequencies may substantially be reduced sothat the pathogen cannot develop sporulating lesions. In IPM programs, withoutcontinuous presence of fungicides on the leaf, the pathogen may successfully infectthe host and complete its cycle resulting in sporulating lesions. In such systems,fungicides should affect the pathogen also during its post-infection development.For peanut late leaf blight (Cercosporidium personatum), Labrinos and Nutter (1993)investigated the effect of chlorothalonil and tebuconazole on the disease compo-nents. They found that tebuconazole reduced sporulation of C. personatum for morethan 95% in lesions of field grown peanuts and stated that this will result in a largenegative effect on disease progress in the field.In breeding programs for durable partial resistance, selection of genotypes is aimedat slower disease progression. When analysing the relationships between disease
Introduction 17
components and disease progression of early leaf spot (C. arachidicola) in severallines of peanuts, Johnson et al. (1986) found that the percentage of lesions withsporulation and the spore production in lesions highly correlate with the rate ofdisease development. A similar high correlation between spore production in le-sions and the rate of disease progression was found in different genotypes of pea-nuts for peanut late leaf spot (C. personatum) (Aquino et al., 1995). Also the slowerdisease development of grey leaf spot in a moderately resistant genotype of corn ascompared to a susceptible genotype was found to be due to a lower number oflesions with sporulation and a lower spore production in lesions of C. zeae-maydis(Ringer and Grybauskas, 1995).
1.1.4.2 Naturally occurring suppression of pathogen development in ne-crotic tissues
Bacteria, yeasts and spores of saprophytic fungi are common in the phyllosphere.Once the leaf is senescing, it becomes available as nutrient source for saprophytes.The different saprophytes present on the substrate, including necrotrophicpathogens during their saprophytic stage, compete during substrate colonisation,where inoculum density and competitive saprophytic ability of the different groupsdetermine the share of the different populations. Hyphal fungi with their ability tospread actively through the substrate by hyphal growth become more dominantcompared to single cell organisms. Typical microbial communities of hyphal fungidevelop with a succession of different species during the senescence anddecomposition of leaves. Primary colonisers are Cladosporium herbarum, C.cladosporioides, Alternaria spp., Aureobasidium pullulans, Epicoccum nigrum and Botrytiscinerea (Hudson and Webster, 1958; Hudson, 1971). Pfender and Wootke (1988)found that Pyrenophora tritici-repentis, Septoria nodorum, Alternaria spp. and Cladosporiumspp. colonised wheat straw as primary invaders, secondarily followed by Arcemoniumstrictum, Diplodia spp. and Fusarium spp. Growth and spreading of necrotrophicpathogens, also being primary invaders of necrotic leaf tissues, is limited by thisnatural phenomenon but its impact on epidemics of diseases is hard to quantify.However, cultural practises making use of naturally occurring saprophytic fungi toreduce necrotrophic pathogens on crop debris demonstrate the importance ofnaturally occurring disease control in necrotic tissues. The airborne saprophyticfungi Penicillium, Aspergillus, Alternaria and Stemphylium can colonise wheat strawbefore its incorporation into soil. Straw colonised by these saprophytes could notbe colonised by the pathogenic Fusarium roseum f.sp. cerealis ‘Culmorum’ after burialinto soil (Cook, 1970). Pseudothecia produced on leaf litter are a main source ofthe primary inoculum of Venturia inaequalis causing apple scab. The leaf litter cannaturally be colonised by common saprophytes. Colonisation by these naturallyoccurring fungi such as Cladosporium, Alternaria and Fusarium can be enhanced byspraying the litter with urea, leading to an accelerated decomposition with a lowerrisk of pseudothecia formation (Burchill and Cook, 1971; Thakur and Sharma,

18 Biological control of Botrytis spp. with Ulocladium atrum
1999; Carisse et al., 2000). Boland and Hunter (1988) found that Alternaria alternataand Cladosporium cladosporioides were frequently colonising blossoms of field-grownbeans. When field-sampled blossoms were inoculated with ascospores of Sclerotiniasclerotiorum and incubated at high humidity, the senescent petals were colonised bythe saprophytes and about 50% of the blossoms failed to develop white mould.These examples also demonstrate the substantial contribution of naturallyoccurring saprophytes to disease control.
1.1.4.3 Suppression of pathogen development in necrotic tissues by in-troduced micro-organisms
Yeasts and bacteria, lacking hyphal growth and being sensitive to dry conditions,are no strong competitors during the colonisation of necrotic tissues and thus arerarely found during the natural succession of such substrates. So far, bacteria andyeasts have not been exploited for biocontrol in necrotic leaf tissues.On the other hand, representatives of hyphal fungi as the dominating group duringthe natural microbial succession in senesced leaf tissues have been selected forapplications to necrotic plant tissues aimed at the suppression of colonisation ofthese tissues by necrotrophic pathogens. Different kinds of necrotic plant tissuescan serve as substrate and thus as inoculum source of necrotrophic pathogens: thenecrotic part of lesions initiated by the pathogen, plant parts naturally senescedsuch as petals or killed by abiotic injuries such as frost, wind or herbicides, andcrop debris. Several antagonistic fungi have been successfully used to controlpathogen development on such different substrates.
Necrotic lesions. Although many necrotrophic pathogens sporulate on lesions,microbial interactions within the lesion have hardly been investigated. Biles andHill (1988) observed a reduction of the sporulation capacity of Cochliobolus sativus by47% when lesions had been sprayed with T. harzianum in experiments conducted at26 °C under continuously moist conditions, the optimum for sporulation of thepathogen. Several saprophytic hyphal fungi, yeasts and a Pseudomonas sp. could re-duce lesion expansion and sporulation of B. cinerea under controlled conditionswhen applied to established lesions on bean leaves (Elad et al., 1994a; b). AlsoSzandala and Backhouse (2001) found that antagonists such as Epicoccum nigrum,Gliocladium roseum and Trichoderma harzianum reduce sporulation of B. cinerea in beanleaf assays when antagonists were applied up to 120 h after infection by the patho-gen. Biocontrol in necrotic lesions requires further research under field conditionsand may have been underestimated so far.
Senescing leaves. Peng and Sutton (1991) selected antagonists that reducedsporulation of B. cinerea on artificially killed leaf discs of strawberry. Amongst 230microbial isolates tested, isolates of A. alternata, Gliocladium roseum, Penicillium sp.,Trichoderma viride, Colletotrichum gloeosporioides, Epicoccum purpurascens and Trichothecium

Introduction 19
roseum suppressed B. cinerea sporulation by almost 100%. In experiments under fieldconditions, G. roseum consistently reduced sporulation incidence and fruit infectionof strawberry. It was found that control of sporulation was best when the antago-nist was applied to green leaves before they senesced (Sutton and Peng, 1993). Theantagonist is able to penetrate the green leaf and to colonise epidermal cells withoutharming host plants such as strawberry, red raspberry and roses (Sutton, 1994; Yuand Sutton, 1999; Morandi et al., 2000; Morandi et al., 2001). Once the leaf is dy-ing, the antagonist progressively colonises the dead leaf and excludes B. cinerea fromthe substrate. However, the antagonist is not able to replace B. cinerea in leaf tissuesthat are already colonised by the pathogen.
Senescing petals. Flower remains adhering to developing fruits can saprophyti-cally be colonised by necrotrophic pathogens. They then act as the exogenous nu-trient source needed by the pathogen to be able to infect healthy tissue. Theapplication of saprophytes to such flower remains can lead to an exclusion of thepathogen from the necrotic tissue and thus to a protection of the adjacent fruit.This principle was already explored in 1957 by Newhook (1957). He sprayed C.herbarum or Penicillium sp. on petals adhering to tomato flowers under greenhouseconditions with increased humidity and inoculated the plants seven days later withB. cinerea. Fruits of plants not treated with saprophytic antagonists showed 31 to42% rot, whereas those treated with antagonists rotted for 0 to 3%.Boland and Inglis (1989) evaluated the saprophytic mycoflora of bean and rapeseedflowers. Alternaria spp. and Cladosporium spp., isolated from 65 to 100% of surface-sterilised flowers were the dominating fungi. The role of these saprophytes in natu-rally occurring reduction of white mould development had been demonstrated byBoland and Hunter (1988). The antagonistic properties of saprophytic fungi wereevaluated in screening experiments using petals inoculated with S. sclerotiorum andthe candidate antagonists. The petals were placed on detached bean leaves andlesion development on the leaves was quantified. Drechslera sp., Epicoccum purpuras-cens, Fusarium graminearum and F. heterosporum were found to be the most effectiveisolates. In similar experiments, Nelson and Powelson (1988) applied T. hamatumand B. cinerea to detached petals of snap beans that were laid on healthy pods. Afterincubation under continuously moist conditions, the antagonist treatment reducedpod rot by 94% compared to the untreated control.Zhou and Reeleder (1989) used E. purpurascens in greenhouse and field experimentswith snap beans. The antagonist colonised all senescent petals sampled fromtreated plants, frequently covering the petal surface completely. E. purpurascens wasable to germinate and to produce mycelium on the surface of both young emergingflowers and senescent flowers (Zhou and Reeleder, 1991). However, no accelera-tion of senescence of young flowers was observed and penetration of the tissuewas only found with senescent petals. Field applications of E. purpurascens led tosignificantly reduced disease incidence and percentage of diseased pots (Zhou andReeleder, 1989).

20 Biological control of Botrytis spp. with Ulocladium atrum
Senesced petals of male and female kiwifruit flowers colonised by saprophyticallygrowing B. cinerea are an important source of conidia of the pathogen contaminat-ing the surface of the developing fruit (Elmer et al., 1993). Saprophytes such as A.alternata, E. nigrum and Ulocladium atrum successfully reduced sporulation of B. cinereaon petals in bioassays under controlled conditions as well as on petals that hadbeen exposed under field conditions (Elmer, Walter and Köhl, unpublished).
Crop residues. Andrews et al. (1983) investigated antagonists interfering with thecolonisation of apple leaf by the imperfect stage of V. inaequalis. Amongst theselected antagonists, two were also tested against the perfect stage of the fungus.When leaves were inoculated with Athelia bombacina or Chaetomium globosum, inautumn and thereafter left on the orchard floor, the production of ascospores onsuch leaves was reduced to 0 or 10% compared to untreated leaves (Heye andAndrews, 1983). Similar results were achieved by Miedtke and Kennel (1990). Theantagonist A. bombacina also induced softening of leaf tissue, indicating anaccelerated decomposition due to a high cellulolytic activity. Carisse et al. (2000)applied Microsphaeropsis sp. to overwintering leaves resulting in significant andconsistent reduction in ascospore production of V. inaequalis. The impact ofreduced ascospore productions on apple scab epidemics still has to bedemonstrated.In conservation tillage systems, antagonist applications are a promising means toprevent the build-up of primary inoculum. Reduction of survival of mycelium ofpathogens in crop residues may be achieved with the same antagonists as used forthe retardation of the dissemination of a disease during the growing season. How-ever, as crop residues often are incorporated into soil or form a layer on the soil,environmental conditions differ from those of above-ground necrotic tissues. Soilfungi such as Trichoderma spp., less adapted to the phyllosphere, may also be suit-able candidate antagonists. Infested crop residues are the source of initial inoculumfor several major diseases of soybean (Glycine max (L.) Merr.) in Brazil. When cropresidues were treated with T. harzianum in an outdoor experiment, the incidence ofthe pathogens Macrophomina phaseolina, Glomerella glycines and Fusarium spp. such as F.graminearum was significantly reduced (Fernandez, 1992). Inoculation of field grownbarley stubble, infested with Drechslera teres, with Myrothecium verrucaria, T. viride andan actinomycete reduced sporulation of the pathogen by more than 70%, whenincubated under continuous high humidity at 18 °C (Mostafa, 1993). Pseudocerco-sporella herpotrichoides, the causal agent of eyespot in cereals, survives in infestedstraw and produces conidia infecting subsequent cereal crops. When straw pre-colonised by the pathogen was inoculated with a Trichoderma sp. in pot experiments,the pathogen produced less conidia and less seedlings of wheat were infected(Clarkson and Lucas, 1993).Pfender and Wootke (1988) analysed the fungal communities of wheat straw, andLimonomyces roseipellis, a secondary invader of infected wheat straw, was found to beantagonistic to Pyrenophora tritici-repentis, reducing ascocarp and ascospore formation

Introduction 21
for 50 to 99% under controlled conditions (Pfender, 1988). The antagonist sup-pressed ascocarp formation of P. tritici-repentis under field conditions by 60 to 80%in three of four field experiments (Pfender et al., 1993). However, these reductionrates obtained for the primary inoculum were not sufficient to achieve diseasecontrol since the polycyclic secondary conidial production was more important forthe progression of the leaf disease caused by P. tritici-repentis.
1.1.5 Conclusions
Until now most research efforts in biological control of necrotrophic foliar patho-gens have been focused on interference with infection and have largely tried toimitate the effect of fungicides by sprayings with micro-organisms. This seems tobe a useful approach in protecting man-made wounds against pathogen invasion,and it is in this area that biocontrol products are entering the market. Apart fromthe possibility of proper timing, the desired protection has only to last until thewound has been healed or dried out. The more general protection of healthy leavesin a field crop, however, requires that a biocontrol agent maintains itself in suffi-ciently high densities on the leaf surface as long as protection is needed. Moreover,the actual time period available for interaction is limited, so that a pathogen mayeasily escape from antagonism by penetrating the leaf. Therefore, it is understand-able that particularly biocontrol aimed at this general leaf protection suffers incon-sistency. In principle this is caused by failure of the antagonistic mechanismsinvolved or by insufficient population densities of the antagonist. Although par-ticularly with respect to soilborne fungi, much research has been devoted tomechanisms of antagonism, it seems that basic knowledge on microbial colonisa-tion is most essential for explaining inconsistency. In spite of the fact that theoreti-cally antagonism based on induced resistance may not require consistently highpopulation densities, there is no example of biocontrol of necrotrophic foliarpathogens not depending on high population densities of the antagonist. Environ-mental factors largely determine these densities. Computer simulation studies haveproven to be a highly valuable tool for explaining and predicting the behaviour ofantagonist populations in the phyllosphere. The ability to predict when a biocontrolagent will not be able to control a pathogen will greatly contribute to its reliability.Biological control aimed at suppression of colonisation and subsequent sporulationseems a strategy superior to microbial reduction of infection because of the longertime periods available for competition in necrotic tissue which will either reducethe sporulation capacity of the pathogen or infection of adjacent healthy tissue.According to Lockwood (1992) microbial competition is based on exploitation,during which resources are depleted by one organism without inhibiting access ofanother organism, or on interference, during which such access is inhibited by thepresence of the first coloniser. Different types of necrotic tissue can be discrimina-ted varying from the necrotic lesion induced by the pathogen to naturally senesced

22 Biological control of Botrytis spp. with Ulocladium atrum
and moribund plant tissue. In general, the first colonisers, pathogen or antagonist,may have an advantage. Since successful competition within a lesion has been re-ported, such advantage may not be conclusive. It is surprising how little is knowabout interactions within lesions that may influence its expansion as well as a partof the pathogens inoculum production.Necrotrophic pathogens may equally well colonise and sporulate upon naturallydied plant tissue but antagonist applications may result in pre-emptive colonisationof this substrate by saprophytes excluding the later arriving pathogen. Several ex-amples have demonstrated the validity of this approach which aims at a retardationof epidemics instead of protection of an individual plant. Biocontrol resulting inreduced sporulation is likely to be consistent, but may not always be sufficient as astand alone treatment. In integrated control the impact of reduced sporulation ondisease might be comparable with the use of tolerant varieties. In further develop-ment of sustainable agriculture and conservation tillage the growing amount ofcrop residue left on the soil surface will considerably increase inoculum productionof necrotrophic pathogens with serious epidemiological consequences. Microbialsanitation merely aiming to imitate the mechanical removal of plant debris mayreduce this problem.A great advantage for eventual commercialisation of a biocontrol agent aimed atcompetition in necrotic tissue may be the until now observed lack of specificity incompetition with other saprophytes or saprophytically growing pathogens. If thisholds true and also applies to dead plant tissue of different origin, then there is anopportunity for a broad spectrum biocontrol agent.
1.2 Selection, characteristics and use of Ulocladiumatrum in biocontrol of Botrytis spp. in necrotictissues
Although fungicides are regularly applied to control Botrytis spp. in many crops,there is a need for other controls because fungicide use may be limited in the futureby government regulations. Second, resistance of B. cinerea populations in green-house and field crops against several fungicides is a common problem (De Waardet al., 1993; Gullino, 1992). Benomyl-resistant strains of B. cinerea were found incyclamen production in the early seventies (Van Dommelen and Bollen, 1973) andthe occurrence of populations resistant to benzimidazoles and dicarboximides(iprodione, procymidone or vinclozolin) has been reported in Greece and France(Lacroix and Gouot, 1981; Pappas, 1982). Third, several fungicides such as ipro-dione and vinclozolin can have negative side effects especially on ornamental plantssuch as cyclamen, reducing the yield or the ornamental value of potted plants(Henseler, 1981). Finally, ornamental plants with visible residues of fungicides onthe leaves cannot be marketed.

Introduction 23
Experimental work was carried out during 1990 and 2001 with the objective toidentify a suitable antagonist for the development of a biocontrol agent againstBotrytis spp. based on the hypothesis that an exploitation of microbial antagonismduring the colonisation of necrotic tissues can result in a reliable biocontrol systemagainst necrotrophic Botrytis spp. To support this hypothesis, the role of necrotictissue in Botrytis epidemics in three crops, onion, strawberry and cyclamen, wasinvestigated. Candidate antagonists were isolated from necrotic leaf tissues andscreened for their antagonistic efficacy. The ecology of the promising antagonisticstrains Ulocladium atrum 385 and of several Gliocladium spp. was studied. Finally, theeffect of applications of U. atrum 385 on epidemics caused by Botrytis spp. was as-sessed in crops of field grown strawberry and onion as well as greenhouse growncyclamen, Pelargonium and pot roses.
1.2.1 Role of necrotic tissues in Botrytis epidemics
Exploiting sporulation suppression of necrotrophic pathogens as a control strategydemands more knowledge of the rate of disease development in the crop comparedto a strategy aiming at prevention of infection. In the latter case, a possible controleffect can also be demonstrated directly on single plants or even a single leaf. Sup-pression of sporulation as a strategy for biological control is only feasible (1) if theprogression of an epidemic depends on the amount of inoculum in the crop, and (2)if the inoculum is produced mainly inside the antagonist-treated crop and air-borneinoculum from outside the crop does not contribute substantially to disease devel-opment.The role of necrotic leaf tissues as a source of conidial inoculum in Botrytis epi-demics was studied in manipulative field experiments in onion as models for apolycyclic epidemic and in annual strawberries as model for a monocyclic epidemic.Exploitation of suppression of colonisation of necrotic tissue by necrotrophicpathogens in order to prevent infection of adjacent healthy tissue is only feasible ifthe pathogen depends on such a bridge to allow establishment of new infections.Manipulative experiments were carried out to study the importance of naturallysenesced leaves in Botrytis epidemics in cyclamen.
1.2.1.1 Botrytis leaf spot in onionThe effectiveness of sporulation suppression as a strategy for biological control ofBotrytis spp. was studied under field conditions (3.1.1; Köhl et al., 1995a). Thepolycyclic epidemic of onion leaf spot, caused by B. cinerea and B. squamosa, waschosen as a model. Suppression of sporulation by antagonists was simulated by theartificial removal of necrotic onion leaf tissue on which Botrytis spp. can sporulate.The effect of removing necrotic tissue on the spore load of Botrytis spp. in the cropand on the development of leaf lesions was followed. In an additional treatment,

24 Biological control of Botrytis spp. with Ulocladium atrum
Gliocladium roseum was applied to test the capacity of this antagonist to suppresssporulation of Botrytis spp. under field conditions.
1.2.1.2 Grey mould in annual strawberryNecrotic tissue in the strawberry canopy has been found to be the major inoculumsource of B. cinerea in perennial strawberry fields (Braun and Sutton, 1987). Therelationships between necrotic tissue present in the crop, flower infection and sub-sequent fruit rot have already been documented in that system (Braun and Sutton,1987; Jordan, 1978). Under Florida conditions, leaf sanitation of strawberry plantsconducted in raised beds reduced Botrytis fruit rot but did not increase marketableyield (Mertely et al., 2000). However, the epidemiology in annual strawberry cropsusing waiting-bed transplants and perennial crops may be different. The effect ofremoval of necrotic leaves on the load of Botrytis conidia in the air, on flower colo-nisation by B. cinerea and fruit rot was quantified in field experiments (3.1.2; Boff etal., 2001).
1.2.1.3 Grey mould in cyclamenExperiments focused on the role of necrotic tissue in the onset of disease for B.cinerea in cyclamen were carried out by Kessel et al. (2001; 3.1.3). The suitability ofnecrotic tissue as a mutual substrate of B. cinerea and U. atrum was confirmed inlaboratory experiments. The availability of necrotic tissue in cyclamen crops wasstudied in greenhouse cyclamen crops. Symptomless senescing tissue was manuallyremoved to prevent colonisation of necrotic tissue by the pathogen. The effect ofthis treatment on leaf rot epidemics caused by B. cinerea was compared with un-treated controls.
1.2.2 Antagonist screening
1.2.2.1 Screening under controlled conditionsThe aim was to select saprophytic antagonists that are able to suppress sporulationof Botrytis spp. on necrotic leaf tissue (3.2.1; Köhl et al., 1995c). B. aclada and B.cinerea, causing onion neck rot and onion leaf spot, respectively, were chosen asmodel pathogens. A bioassay based on dead segments of onion leaves pre-inoculated with B. aclada or B. cinerea was developed. During incubation of antago-nist-treated leaf segments in moist chambers, leaf wetness periods were interruptedby dry periods to simulate field conditions. The adaptation of antagonists to rapidchanges between wet and dry periods in necrotic tissue of above ground plant partsmay be a key factor for field performance of antagonists aimed at suppression ofsporulation of necrotrophic leaf pathogens.
Introduction 25
In the screening under laboratory conditions, 41 fungal isolates belonging to 22species were tested for suppression of sporulation of Botrytis spp. on dead leaftissue. Under continuous wet conditions, Gliocladium catenulatum, Chaetomiumglobosum and Ulocladium atrum inhibited sporulation of Botrytis spp. completelywhereas Aureobasidium pullulans was less efficient. In bioassays with interruptedwetness periods, C. globosum, U. atrum and A. pullulans suppressed sporulation ofBotrytis spp. almost completely, but G. catenulatum was distinctly less effective. Thesefour isolates were tested in a subsequent screening step under field conditions(Köhl et al., 1995b).
1.2.2.2 Screening under field conditionsThe main objective was to compare the ability of the antagonists A. pullulans, C.globosum, G. catenulatum and U. atrum to colonise dead lily leaf tissue and to protectthe substrate from colonisation by naturally occurring airborne inoculum of Botrytisspp. under field conditions (3.2.2; Köhl et al., 1995b). A sequence of nine experi-ments was performed under a variety of natural microclimatic conditions. The per-formance of antagonists was quantified by determining the sporulation potential ofBotrytis spp. after incubation of the necrotic leaves in moist chambers after five tosix days of exposure to field conditions. Determination of germination of spores ofC. globosum and U. atrum and hyphal growth of U. atrum on dead lily leaves underfield conditions provided additional information on the colonisation potential ofthe antagonists. In these experiments, U. atrum consistently reduced sporulation ofB. cinerea by more than 90%. This antagonist was chosen for further studies.
1.2.3 Effect of environmental factors on U. atrum
The success or failure of antagonists after applications in the open field or ingreenhouses mainly depends upon their adaptation to the particular ecologicalniche. The environment of the phyllosphere is characterised by rapid changes ofwater availability and temperatures over a broad range (3.3.1.1; Burrage, 1971). Tocompete successfully with Botrytis spp. during the colonisation of necrotic tissues,the ability of antagonists to survive during dry periods or periods with extremetemperatures as well as to grow during leaf wetness periods at moderate tempera-tures should at least be equal to those of the target organism.Little information is available on the ecology of U. atrum and no information ispublished about the temperature requirements of the fungus. Thorough knowledgeon the ecology of pathogens and their antagonists is a prerequisite for the devel-opment of reliable biocontrol systems. Studies were carried out to quantify theeffect of temperature and water availability on U. atrum as well as on the persistenceof U. atrum conidia after application on leaves. This information on the effect oftemperature and water potential on development of U. atrum and its antagonism

26 Biological control of Botrytis spp. with Ulocladium atrum
against Botrytis spp. will help to better understand the dynamics of antagonistpopulations under field conditions and to develop reliable application strategies.Knowledge on the persistence of conidia on leaf surfaces is needed to optimisetiming of the applications of the antagonist and the intervals between applications.
1.2.3.1 TemperatureThe objective of our study (3.3.1; Köhl et al., 1999) was to determine the tempera-ture requirements of U. atrum in comparison with those of Botrytis spp. In part ofthe studies, the antagonist G. roseum was also included for comparison. The conidialgermination rates on agar and necrotic lily leaves, the mycelial growth rates on agarand the antagonistic potential to suppress sporulation of Botrytis spp. on necroticleaf tissues of onion, cyclamen and hydrangea as depending on temperature werequantified. Results were related to the microclimatic conditions measured in onioncrops in the open field and in cyclamen crops in greenhouses or common duringstorage of plant stocks.
1.2.3.2 Water availabilityLittle information is available in the literature about the fate of germlings of an-tagonistic fungi in the phyllosphere. The objective of the study (3.3.2; Köhl andMolhoek, 2001) was to determine the effect of constant and alternating water po-tentials on (1) conidia of U. atrum during germination and (2) its antagonistic po-tential against Botrytis spp. Experiments were carried out under conditions leadingto equilibration of the water potential in the growth substrate and the surroundingatmosphere. More complex situations in which the water potentials of the substrateand the surrounding atmosphere differ, e.g. when a dry necrotic leaf is exposed to asudden increase of the relative humidity of the surrounding air, were not consid-ered.
1.2.3.3 Conidia persistenceWhen U. atrum conidia are sprayed onto a crop, a large proportion of the antago-nist inoculum is deposited onto healthy green tissues. Since the primary target con-sists of necrotic leaf parts, inoculum of the antagonist may be considered ‘lost’from the system. However, green leaves or parts thereof will potentially becomenecrotic as a result of natural senescence, pathogen infection, or other biotic orabiotic factors such as freezing injury. If viable antagonist inoculum is present ongreen tissues in sufficient quantities just prior to the onset of necrosis then rapidcolonisation by the antagonist of the necrotic tissue may exclude the pathogen orother competitive saprophytes from that substrate. Therefore in a biological con-trol system aimed at colonisation of necrotic tissues the level of viable antagonistinoculum on green leaves may be of significant importance.

Introduction 27
The objective of our study was (1) to investigate the fate of U. atrum inoculumsprayed onto green leaves under greenhouse and field conditions and (2) to deter-mine its ability to colonise freshly induced necrotic leaf tissues after exposure ongreen leaf surfaces. Spore density on the green leaf surface, survival and germina-tion of U. atrum conidia and the superficial growth of germ tubes was followed fora period of three weeks in field experiments and ten weeks in greenhouse experi-ments. Leaf necrosis was artificially induced and colonisation of that substrate byU. atrum, Botrytis spp. and naturally occurring saprophytes was quantified. Studieswere carried out in greenhouse-grown cyclamen crops (3.3.5.1-2; Köhl et al., 1998;Köhl et al., 2000) and field-grown lilies (3.3.5.3; Elmer and Köhl, 1998). In cycla-men, the fate of U. atrum conidia on green leaves and their ability to colonise suchleaves after senescence was investigated in crops that were irrigated by capillarymatting. Experiments on antagonist survival in top-irrigated cyclamen crops com-plete the studies on conidial persistence. It was hypothesised that frequent top-irrigation may adversely affect antagonist efficacy since conidia may be washed offfrom leaf surfaces. Furthermore, germinated conidia may become exhausted duringfrequent wet/dry periods, each possibly not long enough for conidia to germinateand colonise necrotic tissues.
1.2.4 Mode of action of U. atrum
1.2.4.1 Fungal interactions: microscopical and ultra-structural studiesAntagonism of U. atrum against fungal pathogens was first found during thescreening programme described in 3.2.1. Nothing was known about the mecha-nisms involved in the antagonism by U. atrum. A better understanding of themechanisms is essential for the further exploitation of the antagonist in necrotictissues of various crops under different environmental conditions. Population den-sities of the antagonists in the necrotic substrates necessary to achieve sufficientcontrol levels and the timing of antagonist applications may depend on the under-lying mechanisms. Furthermore, necrotic tissues from different crops may have adifferential effect on the expression of such mechanisms.The objective of the microscopic and ultra-structural study (3.4.1; Köhl et al., 1997)was to elucidate the mechanisms involved in the antagonistic interactions betweena Botrytis sp. and U. atrum during the saprophytic colonisation of necrotic planttissues. The antagonistic fungi Aureobasidium pullulans, Chaetomium globosum andGliocladium catenulatum were included in the study for comparison. Parasitism,antibiosis and/or nutrient competition may be components of the antagonisticactivity (Whipps, 1992; Elad, 1996). Whereas in vitro tests can be useful todetermine enzymatic or antibiotic activity of biocontrol agents, they cannotdetermine if and how these mechanisms take place when the organisms areinteracting on their natural substrate. Microscopic and ultra-structural studies were

28 Biological control of Botrytis spp. with Ulocladium atrum
applied to analyse and compare the behaviour of the four antagonists as theydeveloped on dead onion leaves.
1.2.4.2 Competitive substrate colonisation: experimental studies andsimulation modelling
Studies on competitive interactions between fungi often rely on quantification ofsporulation (Biles and Hill, 1988; Elad et al., 1994a, b; Köhl et al., 1995a) or fruitingbodies (Adee et al., 1990; Newton et al., 1998). A disadvantage of such methods isthat they quantify the outcome of competition, spore production, rather than theprocess of resource capture and growth of mycelial biomass. Techniques for visu-alising and quantifying mycelia of B. cinerea and U. atrum, co-occurring in the samesubstrate, have been developed in 1999 (Kessel et al., 1999). This technique wasused to quantify time-courses of mycelial biomass of B. cinerea and U. atrum, grow-ing alone or simultaneously in necrotic cyclamen leaf tissue (3.4.2; Kessel, 1999).‘Head start’ experiments were conducted, in which one of the fungi was inoculatedafter pre-inoculation with the competing fungus. Sporulation of both fungi wasquantified to measure the effect of the time of pre-inoculation. Results of thesehead start experiments are interpreted in the framework of the ecological theory ofreplacement series (de Wit, 1960; Adee et al., 1990; Klepzig and Wilkens, 1997).Key concepts are the relative yield (RY, yield in the mixture divided by the yield inmonoculture) for both competing species, and the relative yield total (RYT, thesum of the relative yield for both species). The behaviour of relative yields in re-sponse to treatments provides evidence for the nature and strength of interactionsbetween species (Braakhekke, 1980). In particular, when the RYT equals 1, the twospecies are purely competing for the same resources. If there is niche differentia-tion, the RYT will be greater than 1, whereas allelopathic effects result in a RYTsmaller than 1.
1.2.5 Use of U. atrum for disease control in crops
1.2.5.1 Annual strawberriesGrey mould of strawberry (Fragaria x ananassa Duch.) incited by B. cinerea can causesevere yield losses in any of the strawberry cropping systems used world-wide(Maas, 1984). In the Netherlands, the majority of strawberry field crops are grownusing the so-called waiting-bed transplant system (Rosati, 1991). This croppingsystem is also adopted in other North west European countries. In such a system,the transplants are produced in waiting-beds from August until December andstored at –2 °C until transplanting in the following spring or summer (Rosati,1991). Advantages of this system are (1) no plant losses during winter, (2) flexibleplanting schedule resulting in harvest periods with higher expected product prices,
Introduction 29
(3) lower risk of build-up of populations of soilborne pathogens because of thereduced cropping period, and (4) better stand quality by selecting transplants thatdeveloped a strong multi-crown during the waiting-bed time.Biological control of strawberry grey mould can be achieved by interfering with theinfection process of the pathogen at the blossom stage and during development offruits (Bhatt and Vaughan, 1963), or after harvest by using yeasts as antagonists(Lima et al., 1997). Another approach consists of suppression of B. cinerea inoculumproduction by Gliocladium roseum (Peng and Sutton, 1991). Using a similar approach,Jordan and Pappas (1977) suggested suppression of inoculum production bychemical means. In perennial systems, control of strawberry grey mould by reduc-ing initial inoculum production on necrotic leaves within the crop is possible, sinceinfection of most strawberry flowers takes place in a single infection cycle by co-nidia produced on necrotic leaves present in the crop during flowering (Sutton,1990). Because this source of inoculum may play a different role in annual croppingsystems, biological control strategies may need to be adjusted accordingly.The objective of our study (3.5.1; Boff et al., 2002) was to evaluate under field con-ditions the effectiveness of U. atrum in reducing strawberry fruit rot caused by B.cinerea in annual strawberry crops with waiting-bed transplants. Attempts weremade to optimise timing, initial applications, spraying frequency and suspensionconcentration.
1.2.5.2 OnionsOnion leaf blight caused by B. squamosa can cause significant yield losses in onionproduction (Sutton et al., 1986). Conidia produced on sclerotia or crop residues caninfect leaves resulting in typical small leaf spots. During leaf maturation or afterheavy infection, leaf spots can expand and whole leaves can die. During the poly-cyclic epidemics, secondary inoculum is produced on dead leaf tips or leaves.Regular fungicide applications for leaf blight prevention are common in onionproduction and several forecasting systems have been developed to optimise fungi-cide use (Vincelli and Lorbeer, 1989; Sutton et al., 1986; de Visser 1996). B. cinereacan also cause leaf spots in onion, usually not resulting in yield losses (Hancock andLorbeer, 1963). As B. squamosa, B. cinerea can sporulate on dead leaf tips or leaves.The objective of our study was to investigate the effect of regular applications of U.atrum on epidemics of onion leaf blight and onion leaf spot under field conditions(3.5.2). Sporulation of Boytytis spp. on dead onion leaf tissue, the aerial spore loadof Botrytis spp. and the number of leaf spots was quantified in U. atrum treated plotsin comparison with water treated control plots and fungicide treated plots.
1.2.5.3 CyclamenBotrytis cinerea causes leaf rot as one of the major diseases in cyclamen (Cyclamenpersicum L.) in the commercial production of potted plants and seeds (Jacob, 1987;

30 Biological control of Botrytis spp. with Ulocladium atrum
Reimherr, 1985). Conidia of the pathogen are produced in necrotic lesions of in-fected plants or on crop residues. From such sources, conidia are spread throughthe air of greenhouses. Growers’ activities in greenhouses result in a substantialincrease in the density of conidia in the air within a greenhouse (Hausbeck andPennypacker, 1991a, b).Since conidia of B. cinerea cannot infect healthy cyclamen leaves (Schlösser, 1978),the pathogen initially colonises senescing leaves or necrotic tissues, and produceslarge numbers of conidia after the plant develops a dense canopy which increasesthe relative humidity within the canopy. Conidial clusters and mycelia of the patho-gen can infect healthy tissues of adjacent petioles. Subsequently, the leaf blade canbe colonised through the infected petiole. The disease can spread through the en-tire plant by attacking petioles. This leads to gaps in the plant canopy reducing theirornamental value or to complete loss of plants.Control of the greenhouse climate is an important means to reduce the risk of dis-ease epidemics in cyclamen (Jacob, 1987). Potted plants are placed on mats andwater is supplied via the mats to avoid wetting above-ground plant parts. However,senescing or dead leaves in contact with the soil surface often are moist enough toallow infection or saprophytic colonisation by B. cinerea. In addition, once leaves arewet the relatively low temperature required by cyclamen for growth slows drying.Removal of dead leaves by hand reduces the risk of B. cinerea infection; howeverthis procedure is labour intensive. Furthermore, healthy leaves can be injured dur-ing handling and the fresh wounds or enhanced formation of senesced leaves canlead to new infections by B. cinerea.A few antagonistic fungi or bacteria have been reported to suppress B. cinerea incyclamen. Bollen (1982) reported that infections by B. cinerea are reduced by natu-rally occurring Penicillium spp. When these antagonists were eliminated by fungi-cides such as benomyl, the damage caused by benomyl-resistant B. cinereapopulations increased after benomyl applications. Iyozumi et al. (1996) controlledB. cinerea on cyclamen petals in the greenhouse by applications of Serratia marcescens.The same bacterium suppressed sporulation of B. cinerea by more than 85% on leafblades placed on the soil near the plant base.The objective of our study (3.5.3.1; Köhl et al., 1998) was to test the fungal antago-nists U. atrum and G. roseum for their ability to suppress B. cinerea in commercially-grown cyclamens. In this study, repeated applications of conidial suspensions of U.atrum controlled the disease as effectively as the growers’ standard fungicide pro-gram. These experiments were carried out in a commercial greenhouse where thepotted plants on tables were sub-irrigated by capillary matting. No top irrigationhad been used. However, cyclamen are produced in a variety of different growingsystems, including those with top-irrigation. The purpose of a subsequent study(3.5.3.2; Köhl et al., 2000) was to investigate the potential of U. atrum for B. cinereacontrol under the broad range of commercial growing conditions used in cyclamenproduction in the Netherlands. It was not intended to compare the effect of differ-ent growing systems or cultivars on B. cinerea development.
Introduction 31
1.2.5.4 Pelargonium
The ornamental crop geranium (Pelargonium zonale (L.) Aiton) is susceptible to at-tack of flowers and senescent leaves by B. cinerea. The crop is reproduced by cut-tings. The season for reproduction in Dutch horticultural practice is in autumn andwinter when daylight is minimal and humidity often high. This combination fa-vours sporulation of B. cinerea on stock plants, leading to contamination of cuttingsand attack and killing of cuttings by grey mould. Some growers in the Netherlandseven choose to interrupt plant reproduction by cuttings during the most unfavour-able month of December.Hausbeck and Pennypacker (1991a, b) have studied the spore load of the air ingreenhouses with geranium in relation to growers’ activities and disease incidence.A combination of heating and covering the pots of stock plants with plasticstrongly reduced sporulation of B. cinerea on necrotic leaves (Hausbeck et al., 1996).Sirjusingh and Tsujita (1996) provided data of specific age-related susceptibility ofleaves which point to the ease of attack of cuttings by B. cinerea.In our study (3.5.4; Gerlagh et al., 2001) it was tried to reduce the inoculum pres-sure of B. cinerea by spraying geranium stock plants with U. atrum. It was supposedthat this may lead to reduced colonisation of necrotic leaves, reduced spore load ofthe air, reduced deposition of B. cinerea conidia on healthy, young leaves of gera-nium, and therefore reduced attack of cuttings by grey mould.
1.2.5.5 Pot rosesIn pot roses, where young cuttings are susceptible to B. cinerea, and where twothorough prunings are performed to provoke denser, ramified plants, grey mouldby B. cinerea can be very troublesome because of the ample availability of woundsand deciduous substratum. Fungicides are routinely applied to control grey mouldin pot roses. Experiments were carried out in a Dutch commercial greenhouse toassess the possibilities of U. atrum to control colonisation of rose tissue by andsporulation of B. cinerea (3.5.5; Köhl and Gerlagh, 1999).

32 Biological control of Botrytis spp. with Ulocladium atrum

2 Materials and Methods

Materials and Methods 35
2.1 Materials
Fungi. Botrytis aclada Fres. (syn B. allii Munn), B. cinerea Pers. ex Pers. and B. ellipticaBerk. Cooke were isolated from an onion seed, a gerbera flower and a diseased lilyplant, respectively. The following fungi (with isolate number) were isolated fromnecrotic leaf tips of onions grown in a field at our institute: Alternaria alternata (Fr.)Keissler (300, 317, 319), A. infectoria Simmons (264, 270), Arthrinium sp. (anamorphstate of Apiospora montagnei Sacc.) (242), A. phaeospermum (Corda) M. B. Ellis (243,244), Aureobasidium pullulans (de Bary) Arnaud (490), Chaetomium globosum Kunze exFr. (256), Cladosporium cladosporioides (Fres.) de Vries (564), C. herbarum (Pers.) Linkex Gray (587, 571, 593), Penicillium brevicompactum Dierckx (221), P. hirsutum Dierkx(211), P. spinulosum Thom (201), Penicillium spp. (023, 025), Sesquicillium candelabrum(Bonord.) W. Gams (249), Ulocladium atrum Preuss (385), U. chartarum (Preuss)Simmons (380), Verticillium nigrescens Pethybr. (250). Gliocladium catenulatum Gil. &Abbott (1814), G. nigrovirens Van Beyma (1815) and G. roseum Bain. (1813) wereisolated from peel of potato tubers. Trichothecium roseum (Pers.) Link ex Gray (706)originated from a necrotic leaf of lily, Cryptococcus luteus (Saito) Skinner (WCS36)from a rye leaf. Trichoderma hamatum (Bon.) Bain aggr. (003, T166), T. harzianumRifai aggr. (T000, 022, T154) and T. viride Pers. ex S.F. Gray aggr. (T004, T048,T122, T141, T218, T226) were isolated from soil or bark (Köhl and Schlösser,1988). G. catenulatum (162) and G. roseum (160, 161), isolated from roots of red clo-ver, were kindly provided by P. Lüth, Prophyta Biologischer PflanzenschutzGmbH, Malchow, Germany. T. harzianum 39, isolated from a cucumber fruit grownin a greenhouse, was kindly provided by Y. Elad, Volcani Center, Bet Dagan, Israel.
Inoculum produced on agar. Fungi were cultured in petri dishes on oatmeal agar(20 g oatmeal, 15 g agar, 1000 ml tap water) except A. pullulans 490 and C. luteusWCS36 which were grown on basal yeast agar (10 g bacteriological peptone, 20 gsucrose, 1 g yeast extract, 20 g agar, 1000 ml tap water). Cultures of all fungi wereincubated at 18 °C in the dark for 10 to 14 days, except those of A. pullulans and C.luteus, which were cultured for three days, and of Alternaria spp. and Ulocladium spp.,which were cultured for 21 to 28 days. To obtain spore suspensions, cultures wereflooded with sterile tap water containing 0.01% Tween 80. After gently rubbingwith a rubber spatula to remove spores from fungal cultures, suspensions werefiltered through sterile nylon gauze with a mesh of 200 µm. Concentrations of co-nidial suspensions were determined with the aid of a haemocytometer and adjustedwith sterile tap water containing 0.01% (v/v) Tween 80.
Inoculum produced on oat. Conidia of U. atrum isolate 385 were produced onoat grains in autoclavable spawnbags (Type 3LS, Sylvan, Horst, the Netherlands).Oat kernels were moistened in tap water in a vessel overnight (300 g of dry oat

36 Biological control of Botrytis spp. with Ulocladium atrum
kernels, 300 ml of tap water), excess water was drained through a sieve and themoistened oat kernels were put in a spawnbag. The open end of the bag was in-serted into a metal ring, the remaining opening was closed with a cotton plug andthe bag was sealed with autoclavable tape. Bags with the oat kernels were auto-claved at 121 °C for 45 min twice at a 24-h interval. The sterilised oats were inocu-lated with 0.5 ml of a conidial suspension of U. atrum (approximately 1 x 10⁵
conidia ml-1) and incubated for 28 days at 20 °C in the dark. Bags were shakenevery two to three days to mix the kernels and to avoid formation of aerial myce-lium. Suspensions of conidia of U. atrum were prepared by transferring the incu-bated oat kernels into nylon gauze bags with 1 x 0.4 mm mesh and agitating thesebags for 5 min in a small washing machine (Nova MW 100, Nova, Maastricht, theNetherlands) in 5 l of chilled tap water (5 °C) with 0.01% of Tween 80. The re-sulting suspension was filtered through nylon gauze with 200 µm mesh to removemycelial fragments and oat kernel debris. Concentrations of the conidia in the sus-pensions were determined with the aid of a haemocytometer and adjusted withchilled tap water containing 0.01% of Tween 80 as required. Suspensions were keptat 5 °C until use.
2.2 Methods
2.2.1 Role of necrotic tissues in Botrytis epidemics
2.2.1.1 Botrytis leaf spot in onionField plots. Onion cv Hyton F1 was sown in rows 0.3 m apart on 27 March 1991in 18 plots of 9 x 12 m, arranged in six blocks of three plots each. Three treatmentswere allocated at random within each block, so as to give a randomised block de-sign in six replications. Plant density, determined on 13 April 1991, was 93 plantsm-2. In order to minimise interplot interference, the plots were separated by 12 mwide strips of sugar beet. Sugar beet was chosen as buffer crop because it does notproduce pollen which could stimulate Botrytis infection and is not sufficiently tall tocast shadow on the plots which would alter the microclimate in the onions.
Inoculum source. Sclerotia of B. squamosa, the primary inoculum in epidemics ofonion leaf blight (Ellerbrock and Lorbeer, 1977), were produced on sterile onionleaves placed on water agar. Sclerotia were separated from the leaf tissue usingforceps and 2.4 sclerotia m-2 were spread on 23 April 1991 by hand over the plotsin order to obtain a homogeneous distribution of primary inoculum of B. squamosaat the beginning of the season.

Materials and Methods 37
Treatments. The effect of the suppression of sporulation of Botrytis spp. by an-tagonists was simulated by artificial removal of necrotic leaf tissue. For this pur-pose, all onion leaves with important necrotic area (necrotic for more than 50% oftheir length) were cut off using scissors and removed from the plots at weekly in-tervals from 5 June until 9 August 1991. Removing necrotic leaf tips also fromyoung leaves (necrotic for less than 50% of their length) might have led to infec-tions and physiological stress of onion plants. Since the amount of necrotic tissueincreased drastically at the end of July, the removal of necrotic leaf tissue couldonly be continued in two arbitrarily chosen blocks. A second treatment consistedof the application of the fungal antagonist Gliocladium roseum Bain IPO-1813 thathad been isolated from the surface of a potato tuber. In bioassays based on inter-actions on dead onion leaf segments under humid conditions, G. roseum 1813showed strong antagonism against B. aclada and suppressed sporulation of thispathogen completely (3.2.1; Fokkema et al., 1992). The antagonist was sprayed asconidial suspension at weekly intervals from 5 June until 14 August 1991 at a vol-ume of 60 ml m-2. Conidia were produced on autoclaved moist wheat grains in 250-ml conical flasks (30 g dry weight of grains per flask) during 14 days at 18 °C. Sus-pensions were prepared by adding tap water with 0.01% Tween 80 to the cultures.The suspension was shaken, filtered through a double layer of cheesecloth and theconidial concentration was adjusted to approximately 1 x 10⁶ conidia ml-1. Notreatments were carried out in the control plots.
Quantification of necrotic leaf tissue. In all treatments, ten randomly chosenplants (each with 4 to 6 leaves) per plot were sampled at weekly intervals from 11June until 20 August. The length of green and necrotic leaf parts was measured toestimate the efficacy of the removal of necrotic tissue and to determine the effectof the treatment with G. roseum on leaf dieback caused by B. squamosa. Since necro-sis of leaf tissue is a continuous process during the interval between sampling dates,and since removal of necrotic tissue with more than 50% necrotic leaf length tookplace at different dates after sampling, the percentage necrotic area which had beenremoved could only roughly be estimated at about 60%.
Spore load. Spore samplers (Rotorods, Sampling Technologies, Los Altos Hills,CA, USA) were used to trap airborne spores (Edmonds, 1972; Aylor, 1993). Thesewere positioned at a height of 0.3 m in the centre of each plot of the two blockswhere necrotic leaf tissue was removed during the whole duration of the experi-ment. Thus, spores were trapped simultaneously in all treatments in two replica-tions. Additional sampling was carried out to compare density of airborne sporeswithin and outside the plots. For this, Rotorods were placed 0.3 m above the centreof a control plot, within the buffer crop between a control plot and a plot treatedwith G. roseum and within the buffer crop at a distance of 18 m from onion plots.Between 1 and 21 August 1991, spores were trapped on five days. Three, three,four, two, and three sampling runs, each of 15 min, were carried out on 1, 10, 12,

38 Biological control of Botrytis spp. with Ulocladium atrum
16, and 21 August 1991, respectively. All runs were done between 11:00 hours and15:00 hours. Peaks of spore release could be expected at this time of the day coin-ciding with a decrease in humidity within the crop (Sutton et al., 1978). Conidiawere counted on a length of 22 mm of each of the two rods of a Rotorod per sam-pling run. The numbers of Botrytis conidia shorter than 15 µm and those longerthan 15 µm were recorded separately in order to distinguish between conidia of B.cinerea and B. squamosa. According to Ellis (1971) and our own measurements ofconidial sizes of several isolates of B. cinerea and B. squamosa grown on sterile onionleaves, conidia of B. cinerea usually are 8 to 14 µm long and those of B. squamosausually are 15 to 21 µm long. The concentration of conidia m-3 air was calculatedfrom the conidial counts, the rotation speed and the sampling duration, accordingto a formula provided by the manufacturer. Under the prevailing sampling condi-tions, one hundred conidia counted per sampling run on the two rods togetherrepresent 147 conidia m-3 air.
Disease development. Lesions were counted on the green parts of all leaves ofthe plants except those of which the necrotic leaf part exceeded 50% of the leaflength and which had been removed as part of the experiment. The surface of thegreen leaves was measured with a Delta-T Area Measurement System (Delta-TDevices LTD., Burwell, Cambridge, UK) and the number of lesions cm-2 was cal-culated.
Microclimate. Air temperature, relative humidity and leaf wetness duration weremeasured in the onion crop at 0.35 m height at 60-minute intervals using a Delta-Tlogger (Delta-T Devices LTD., Burwell, Cambridge, UK) connected with a Valvo-sensor (Philips, Eindhoven, the Netherlands) and a leaf wetness sensor (LW 100,Bottemanne, Amsterdam, the Netherlands).
Statistics. The statistical package Genstat 5 was used for data analysis (NumericalAlgorithm Group, Inc., Oxford, UK). The number of conidia trapped during allsampling runs were pooled per day and analysed for conidia of B. cinerea and B.squamosa separately. After analysis of variance of log-transformed data, differencesbetween treatments were established with LSD tests.Progressive increase in number of lesions cm-2 leaf was modelled for each plotseparately. The exponential growth model y = exp (a + bt), with y = density of le-sions, t = time, a = log (initial density) and b = relative growth rate (RGR), provedto be adequate. Values of a and b for each plot were subjected to analysis of vari-ance.
2.2.1.2 Botrytis grey mould in annual strawberryField plots. Data were collected in the untreated plots of five field experiments onthe control of grey mould of strawberry cv Elsanta (presented as experiments 2, 3,

Materials and Methods 39
5, and 6 in 3.5.1; Boff et al., 2002), located on a sandy soil near Wageningen, theNetherlands, with transplanting dates of 10 April 1997 (experiment 2); 27 June1997 (experiment 3); 06 May 1998 (experiment 5), and 19 June 1998 (experiment6). There were 5 and 4 untreated replicate plots in 1997 and 1998, respectively,which were randomised with the other treatment plots within blocks. Experiment 8consisted of a single untreated plot planted at 16 April 1999. All plots consisted of78 plants in an area of 4.5 m x 4.3 m, surrounded by at least 10 m grass buffer toreduce inter-plot interference. Cold-stored dormant transplants, kept at –2 °C untilthe day before planting, were transplanted in double rows with three plants permeter row length. Spacing of rows between double rows was 1 m and within dou-ble rows 0.5 m. Sprinkler irrigation (1997) and a mist irrigation system (1998 and1999) were used to ensure water supply for plant development in dry periods fromtransplanting until beginning of flowering. From beginning of flowering until thefirst harvest, strawberry plots were irrigated every second night (5 min per 90 min,a total of 40 min per night) to stimulate epidemic development of B. cinerea.
Primary inoculum on transplants. Primary inoculum of B. cinerea was assessed onthe lots of transplants used in experiments 3 and 4. In both experiments, a total of50 stolons, senescent and dead leaflets were taken from the cold-stored dormanttransplants. The sampled plant parts were washed thoroughly with tap water andput separately into plastic trays (50 cm length x 30 cm width x 7 cm height) withwet filter paper at the bottom and closed with a plastic bag. After 14 days incuba-tion at 18 °C in the dark, the incidence of B. cinerea was assessed and the area withpathogen sporulation was estimated for each leaflet or stolon unit, using a stereo-microscope with ocular micrometer at 10 x magnification.
Strawberry phenology and necrotic leaf area. The phenology of the strawberrycrops was determined by periodical non-destructive measurements from trans-planting until harvest, on four (1997) or five (1998) plants per plot, arbitrarily se-lected and labelled. In the single untreated plot in 1999, ten plants were monitored.The numbers of flowers and fruits per plant were counted on five to eight occa-sions during each experiment. The area of necrotic leaf tissue was estimated bymeasuring the length and width of each necrotic leaf part with a millimetre scaleruler and calculating the area as a rectangle. Averages of necrotic leaf area andnumber of flowers per plant per replicate plot were considered in further dataanalysis.
Conidial load in the air. The load of B. cinerea conidia in the air was monitoredusing Rotorod samplers. Rotorods were positioned at 0.3 m height in the centre ofan untreated plot and 25, 50 and 50 m outside the strawberry plot in the grassbuffer in the years 1997, 1998 and 1999, respectively. Spore samples were collectedon 2, 5, 3 and 6 different dates in the experiments 3, 5, 6, and 8, respectively. Twoto four runs per sampling date with 15 min duration per run were carried out be-
40 Biological control of Botrytis spp. with Ulocladium atrum
tween 8:00 and 13:30 h, the most likely period for spore release of B. cinerea (Jarvis,1980). In experiments 5 and 6, the spore load was also assessed in a plot in whichall senescent and necrotic leaflets had been removed twice per week from trans-planting until first harvest (sanitation plot). The spores of one rod per run werestained with cotton blue (2 ml lactic acid + 4 ml glycerol + 1.5 ml cotton blue at1% + 2 ml demineralised water) and conidia of B. cinerea were counted on the22 mm upper part of a rod using a microscope at 200 x magnification, and thenumber of conidia of B. cinerea per cubic meter of air was calculated (SamplingTechnologies, 1989).
Colonisation of necrotic leaves. Samples of 10 to 40 half or whole necrotic leaf-lets were harvested per plot and incubated under moist conditions to assess thepotential sporulation of B. cinerea as an estimate of the colonisation of the substrateby the pathogen. In each sample, not more than one leaflet per plant and not morethan 5% of the total necrotic leaf area was removed per plot. This limit was consid-ered to be the maximum that could be removed without significantly disturbing theavailability of substrate for B. cinerea in the field. Six samples of necrotic leafletswere collected per plot in experiment 2 (13 May, 22 May, 30 May, 6 June, 20 Juneand 9 July, 1997), four samples in experiment 3 (22 July, 29 July, 5 August and 14August, 1997), three in experiment 5 (7 May, 8 June and 16 June, 1998) and three inexperiment 6 (20 June, 21 July and 4 August, 1998). No assessment of sporulationon necrotic leaves was done in experiment 8. The leaflets harvested from each plotwere put into a plastic tray (50 cm length x 30 cm width x 7 cm height) with wetfilter paper at the bottom and closed with a plastic bag and incubated for 14 days at18 °C in the dark. The percentage area with sporulation of B. cinerea was estimatedfor each leaflet, using a stereomicroscope at 10 x magnification. The area colonisedby B. cinerea per plant was estimated from the total necrotic area per plant and theproportion of area sporulating after incubation. In the correlation analyses inter-polated values of the leaf area were used when the assessment dates were not ex-actly the same as the dates on which other variables were assessed.
Flower colonisation. Samples of 20 to 30 flowers per plot were arbitrarily col-lected, each from different plants, on two (exp. 2, 3 and 8) or three (exp. 5 and 6)sampling dates. Only flowers already opened for three to four days with brownanthers and with petals still attached were included in the sample. The flowers wereput into plastic boxes (22 cm length x 14 cm width x 5 cm height) with wet filterpaper at the bottom and incubated at 18 °C for 14 days in the dark. All flowerparts, except peduncles, were examined for the presence of sporulation of B. cinereawith a stereomicroscope, at 10 to 100 x magnification. Flowers were consideredcolonised by B. cinerea when at least one conidiophore with conidia was present onany of the flower parts. The incidence of B. cinerea sporulation on flowers was cal-culated per sampling date per plot.

Materials and Methods 41
In addition to the incidence of B. cinerea on flowers, the petal area colonised by B.cinerea was estimated from separate samples in the experiments 5, 6 and 8. Senes-cent petals (20 to 25) were arbitrarily collected per sampling date per plot, eachpetal from a different plant. The number of sampling dates was 3 (11 June, 20 Juneand 2 July, 1998), 4 (21 July, 2 August, 5 August and 11 August, 1998) and 5 (24May, 27 May, 28 May, 31 May and 4 June, 1999) for the experiments 5, 6 and 8,respectively. No sampling of petals was done in the experiments 2 and 3. The pet-als were placed on water agar (15 g agar, 1000 ml tap water) in sterile plastic petridishes (14 cm diameter) and incubated for 14 days at 18 °C in the dark. The per-centage area with B. cinerea sporulation was estimated for each petal using a stereo-microscope, at 20 x magnification.
Fruit rot. Grey mould was determined at harvest by counting the number of dis-eased fruits with B. cinerea symptoms (field fruit rot) and the total number of fruitsharvested per plot at each harvesting date. All ripe healthy fruit and all fruit with B.cinerea symptoms were picked twice per week. Healthy fruits were always pickedseparately from diseased fruits to avoid contamination during harvesting. For post-harvest evaluations diseased fruits with non-specific symptoms were placed inmoist chambers for 72 hours at 18 °C in the dark to allow further development ofsymptoms. Post-harvest fruit rot was assessed using a sub-sample of ripe symp-tomless fruit, consisting of twenty arbitrarily selected fruits per plot. Fruits of eachreplicate were put into a plastic tray (50 cm length x 30 cm width x 7 cm height)with wet filter paper on the bottom. Each tray was closed within a plastic bag andincubated at 4 °C during five days in the dark and subsequently for three days at18 °C. After incubation, rotten fruits with B. cinerea sporulation on any part of thefruit were counted as post-harvest grey mould.
Microclimatic conditions. Relative humidity and temperature were monitoredwith an electronic sensor (Pow 8-35 VDG, Rotronic AG, Bassersdorf, Switzerland)positioned at 30 cm height within a strawberry plot inside the experimental area.Precipitation was measured by a rain gauge (Casella, London, UK). Wetness ofnecrotic leaves was measured in the canopy at 5 cm height, with leaf wetness sen-sors (Köhl et al., 1995b). Data were recorded each half hour by a data-logger(Delta-T Devices Ltd, Cambridge, UK).
Statistics. Correlation analysis among epidemiological and weather variables wasconducted by computing Spearman’s coefficient of correlation (rs) (Snedecor andCochran, 1989). This correlation coefficient was also computed between the ob-served incidence of B. cinerea on flowers and the predicted spore production of B.cinerea per strawberry plant in the field over a 5-day period before sampling of flow-ers. Spore production per leaf area was predicted with a descriptive model as afunction of observed wetness duration and average temperature during wetnessover the 5-day period. The model equation used was log(Y) = –7.03 + 2.22

42 Biological control of Botrytis spp. with Ulocladium atrum
[3.02 + (0.0026 log (W) T 3 ) + (–0.00011 log (W) T 4 )], where Y is the number ofB. cinerea conidia per cm2 of leaf tissue, W is the duration of leaf wetness in days,and T is the average temperature during the wetness period (equation 7 of Sosa-Alvarez et al, 1995). The spore production of B. cinerea per strawberry plant wascalculated as the product of predicted spore production per leaf area and the ob-served necrotic leaf area with potential sporulation per plant. Correlation analysiswas also done between observed levels of grey mould in subsequent harvests dur-ing a season and predicted values calculated with a descriptive model with observedtemperature and wetness duration during the flowering period as inputs. Themodel equation used was ln(Y/(1–Y)) = –3.526 + 0.0228 WT – 0.1940 W – 1.7 x 10⁻⁵ WT3, where Y is the proportion of strawberry fruit infected by B. cinerea,W is the duration of leaf wetness in hours, and T is the average temperature duringthe wetness periods (equation 5 of Bulger et al, 1987).For each experiment separately, mean spore loads of B. cinerea in the air monitoredat different locations were compared with the paired t-test to detect significantdifferences. In addition, a confidence interval was calculated for the proportion ofdays with a higher average spore load of B. cinerea inside the untreated plots thanoutside the strawberry plots.
2.2.1.3 Botrytis leaf rot in cyclamenTwo greenhouse experiments were carried out to study the effect of removal ofnecrotic tissue on Botrytis epidemics in cyclamen crops. In experiment 1, also theoccurrence of tissue types was monitored. In additional treatments, the effect ofapplications of U. atrum was assessed.Plants of cyclamen cv Super Serie, not previously treated with pesticides, were ob-tained from a commercial grower 154 (experiment 1) and 70 days (experiment 2)after sowing. Grey mould severity assessed immediately after arrival revealed anaverage of 0.1 and 0 leaves per plant with sporulating B. cinerea in 1 and 2, respec-tively. Plants were placed on tables with capillary matting at a spacing just wideenough to avoid contact between the leaves. Greenhouse temperature varied withinthe 15 to 25 °C range set as minimum and maximum temperature. Relative humid-ity mostly varied between 80 to 90%. No pesticides were used.Experimental treatments were: (1) spraying the plants with tap water containing0.01% Tween 80 every four weeks; (2) an untreated control; (3) a treatment inwhich senescing, symptomless, plant parts were removed at three to four day inter-vals; and (4) spraying with a conidial suspension of U. atrum (1x10⁶ conidia ml-1)every four weeks. Necrotic plant parts and plant parts with sporulating B. cinereawere left on the plant. Experiment 1 included a fifth treatment in which the plantswere sprayed with a conidial suspension of U. atrum (1x10⁶ conidia ml-1) once, coin-ciding with the first application to other spray treatments. Spray treatments wereapplied 155, 183 and 211 days after sowing in experiment 1 and 140, 168, 196 and224 days after sowing in experiment 2. All plants were sprayed individually on and
Materials and Methods 43
inside the canopy to reach shielded surfaces such as older leaves, petioles and tu-bers. This technique is generally used to apply fungicides in commercial cyclamencrops.In experiment 2, B. cinerea was introduced by placing six sporulating cultures (threeto four weeks old) in petri plates (9 cm in diameter) in each of the greenhousecompartments (± 80 m3) when the plants were 166 days old. Three cultures wereplaced underneath each of the two tables at even spaces. The lids of the petri plateswere removed for 48 h to allow aerial dispersal of the conidia.Experiments were designed as randomised block experiments with five and fourtreatments respectively, each treatment replicated four times. Two greenhousecompartments were used, each containing two blocks. Each replicate (plot) con-tained 25 plants arranged in five rows of five plants. Plots were placed by 50 to60 cm apart.The presence of healthy (green), senescing (yellow but turgid) and necrotic (yellow-brown lacking turgor) leaf blades and petioles was monitored at two-week intervalsin the untreated plots in experiment 1. Grey mould severity was assessed at two-week intervals as the number of leaves per plant with sporulation of B. cinerea. Thelast assessment in experiment 1 took place three weeks after the previous assess-ment.Disease severity per plot was calculated as the average number of leaves per plantsporulating with B. cinerea. Log-linear regression models, with replicate and treat-ment as classifying variables, were fitted to the data for disease severity. The mod-els assume that the variance of the data is proportional to Poisson variance. Modelswere fitted to the data using the method of quasi likelihood (MacCullagh andNelder, 1989). Overall effects of replicate and treatment were assessed using F-testsfor the ratio of the mean deviance for the particular effect and the mean residualdeviance. In case F-tests were significant (P < 0.05), treatment means on the log-scale were separated using t-tests (P = 0.05). The area under the disease severityprogress curve (AUDPC) was calculated as the area under the curve of diseaseseverity (Y-axis) against time (X-axis) and analysed using analysis of variance(ANOVA).
2.2.2 Antagonist screening
2.2.2.1 Screening on necrotic onion leaves under controlled conditionsLeaf segments. Symptomless green leaves were removed from 12-week old field-grown plants of onion cv Hyton, dried for several days at 60 °C and stored in pa-per bags at room temperature in the dark. Dry leaves were cut into segments each2-cm long, sealed in plastic bags and sterilised by gamma radiation of 4 Mrad.

44 Biological control of Botrytis spp. with Ulocladium atrum
Conidial suspensions. All fungi were cultured in petri dishes and suspensionswere prepared as described above (2.1). Concentrations of conidial suspensionswere adjusted with sterile tap water containing 0.01% Tween 80 to 1 x 10⁶ sporesml-1 for antagonists, 1x10⁴ or 1x10⁵ conidia ml-1 for B. aclada and 1 x 10³, 1 x 10⁴ or1 x 105 conidia ml-1 for B. cinerea.
Bioassay. Onion leaf segments for use in bioassays were washed thoroughly withtap water to remove soluble nutrients. Approximately 100 segments were washedthree times in 350-ml aliquots of sterile tap water contained in sterile 500 ml-conical flasks which were shaken at 150 strokes min-1 for 30 min. The segmentswere subsequently blotted dry with sterile filter paper. Four leaf segments wereplaced in each of a series of moist chambers. Each chamber consisted of a sterileplastic petri dish (90 mm diameter) containing two sterile filter papers (80 mm di-ameter) and 1 ml sterile tap water. Experiments were carried out in a completelyrandomised design with five replications (petri dish) for treatments with antagonistsand five or ten replications for the control.Conidial suspensions of B. aclada or B. cinerea were sprayed on the leaf segments inthe moist chambers and the segments were incubated at 18 °C for 24 h (B. aclada)or 8 h (B. cinerea). Immediately after the incubation periods, spore suspensions ofantagonists, or water plus surfactant, were sprayed on the segments. The pathogensand antagonists were applied with sterile atomisers at approximately 5 µl cm-2 leafsegment. Thereafter, leaves were further incubated at 18 °C in the dark in continu-ous wetness periods or in wetness periods that were interrupted 16, 40, or 64 hafter the antagonists were applied. To interrupt wetness periods, leaf segments wereplaced on two layers of sterile dry filter paper in open petri dishes in laminar flowcabinets for 9 h. Temperatures in the cabinets were approximately 20 °C and rela-tive humidity ranged between 30 and 40% RH. After the dry period, the filter paperin each petri dish was wetted with 2 ml sterile tap water, and the dishes were closedand kept at 18 °C in the dark. After a total incubation period of eight days, the leafarea covered with conidiophores of B. aclada or B. cinerea was estimated usingclasses from zero to five, that represented, respectively, 0%, 1-5%, >5-25%, >25-50%, >50-75%, and >75-100% of the leaf surface covered with conidiophores ofthe pathogens. From the number of leaf segments of each class (n0-5) a sporulationindex (SI) ranging from zero to hundred was calculated for each replication (petridish) consisting of four leaf segments (SI = (0 x n0 + 5 x n1 + 25 x n2 + 50 x n3 +75 x n4 + 100 x n5 ) / 4).In total, 41 fungal isolates were tested in bioassays with B. aclada under continu-ously wet conditions. Fourteen isolates that had shown strong antagonism in thesescreening experiments were tested in bioassays (experiments 1 to 5) with an inter-rupted wetness period. In experiment 5, the effect of antagonists on sporulation ofB. aclada was also quantified by counting conidia of B. aclada produced on deadonion leaves. The antagonists A. alternata 317 and 319, A. pullulans 490, C. globosum

Materials and Methods 45
256, G. catenulatum 162, G. roseum 1813, and U. atrum 385 were also tested in bioas-says on dead leaf segments of onion that were pre-inoculated with B. cinerea.
Number of conidia produced in bioassays. Conidial production of B. aclada onthe four leaf segments of each of three arbitrarily chosen replications of eachtreatment was determined in experiment 5. Leaf surface area was measured usingan interactive digitiser (Minimop, Kontron, Oberkochen, Germany). Leaves werehomogenised in 5 ml of tap water using a planetary micro mill (Pulverisette 7,Fritsch GmbH Laborgerätebau, Idar-Oberstein, Germany) and water was added toobtain 10 ml suspension. The number of conidia of B. aclada in four 6.4 µl aliquotsof each of the suspensions was counted with the aid of a haemocytometer and thenumber of conidia of B. aclada recovered cm-2 leaf surface was estimated. The de-tection limit for conidia was approximately 5200 conidia cm-2 leaf surface as calcu-lated from the average leaf surface of the four leaf segments per replication (petridish) that had been homogenised, and the volume of the suspension that had beenexamined.
Drying process of onion leaves during bioassays. The water content of leafsegments was monitored in one of the bioassays with interrupted leaf wetness.Four leaf segments, similarly treated as leaves of the water treatment of bioassays,were placed in ten replications on dry filter paper in the laminar flow cabinet. Thesegments were weighed at 60-min intervals for 14 h, and after the leaf segmentswere dried at 105 °C for 6 h, the water content of the leaf segments was estimated.The relationship between water content and water potential of dead onion leaveswas determined in an additional experiment. Necrotic leaves of field-grown onionswere cut into 1-cm segments and dried at 105 °C for 24 h. Sterile glass tubes werefilled with 500 mg dried leaf segments. Sterile tap water was added to adjust thewater content of the tissue in the individual glass tubes to values ranging from 0.0to 3.5 g water g-1 dry segments. Values of water content increased in steps of 0.25 gwater g-1 dry segments in the range between 0.0 and 2.0 g water g-1 dry segments,and in steps of 0.5 g in the range of 2.0 to 3.5 g water g-1 dry segments. For eachindividual value, four replications were prepared. Glass tubes were sealed, shakenthoroughly and stored at 20 °C in the dark for 12 days to allow equilibration ofwater potential of leaf segments within a tube. Thereafter, water potentials of onesubsample per tube were measured with a Decagon thermocouple psychrometer(Decagon Devices Inc., Pullman, WA, USA).
Statistics. Data on sporulation index (SI) and log-transformed data on number ofconidia were analysed separately for each experiment by analysis of variance(ANOVA) followed by LSD tests. Treatments causing complete suppression ofsporulation (no variance among replications) were excluded from the analysis.

46 Biological control of Botrytis spp. with Ulocladium atrum
2.2.2.2 Screening on field-exposed necrotic lily leavesLily leaves. Asiatic hybrid lilies (Lilium L.) cv Mont Blanc were grown in potsduring spring in the greenhouse at 20 °C with 16 h light per day. Flowerbuds wereremoved as usual in bulb production and to prevent pollen deposition on leaveswhich is known to enhance infection by B. cinerea (Chou and Preece, 1968). Noinfections by Botrytis spp. or other diseases occurred on the leaves. Leaves, ap-proximately 8 cm long, from three-month old plants were cut from the stems, driedat 60 °C for 48 h and stored at room temperature in sealed plastic bags. Beforeleaves were used for the experiments, they were placed in tap water for 30 min toallow water absorption. Subsequently, they were washed thoroughly three times for30 min in water to remove soluble nutrients using 1000-ml bottles with approxi-mately 100 leaves in 500 ml of tap water on a flask shaker (150 strokes min-1).Washed leaves were placed on dry filter paper to remove most of the water.
Leaf holders. Holders were made of iron wire coated with plastic. Fifteen washedleaves per holder were vertically suspended with clear adhesive tape at a distance ofapproximately 1 cm between the leaves. The upper leaf ends, covered by the tapefor approximately 1 cm, were discarded later during sampling. Possible effects ofthe tape used to suspend the leaves on spore germination or mycelial growth offungi involved in our study were checked on agar plates. The tape did not affectfungal development. Holders with lily leaves were placed in a sugar beet field oneday before antagonist or fungicide application to allow equilibration of their watercontent to field conditions before antagonists reached the leaves. The upper end ofthe leaves was at 30 cm height above ground. Leaves had no contact with leaves ofsurrounding plants.
Experimental field design. Leaf holders were placed in a sugar beet field, eachholder in one microplot of 0.3 x 0.3 m from which sugar beets had been removed.The distance between microplots was 5 m in each direction. Each experiment wascarried out according to a randomised block design with seven treatments assignedto plots within blocks. The seven treatments were spraying spore suspensions ofeach of the four antagonists or a mixture of two of the antagonists, the fungicideDaconil M (250 g a.i. chlorothalonil kg-1, 500 g a.i. maneb kg-1; Schering AG, Berlin,Germany) or water as control. All experiments were performed between 26 Mayand 28 July 1993. The first four experiments had two replications (blocks) and thelast five experiments had four replications.Sugar beet was chosen as buffer crop because of the dense but low growth (ap-proximately 0.5 m height) comparable to that of a lily crop. Botrytis spp. cause noleaf diseases in sugar beet, no pollen is produced that could stimulate Botrytis spp. aswell as naturally occurring and applied antagonists (Fokkema, 1971). Weeds wereefficiently controlled by pre- and post-emergence herbicides and mechanically laterin the growing season. Sporulation of B. cinerea occurred occasionally on dead sugarbeet leaves and a few dead weeds during the growing season.

Materials and Methods 47
Monitoring of microclimate. Air temperature and relative humidity of the airwere measured with an electronic sensor (airprobe YA-100-hygromer, RontronicAG, Bassersdorf, Switzerland) with an accuracy of < ± 1% in the range between 80and 100% RH at 25 °C. This sensor was positioned at 35 cm height in the samesugar beet field, approximately 10 m away from the lily leaf holders. Three leafwetness sensors were used to monitor leaf wetness of dead lily leaves fixed at leafholders in an additional microplot. Electronic sensors had been developed at ourinstitute for recording leaf wetness of necrotic leaf tissue based on measuring thecapacity between two pins inserted into the substrate (Köhl et al., 1995c). All datawere recorded at 30-min intervals and stored in a data-logger (Delta-T Logger,Delta-T Devices Ltd, Burwell, Cambridge, United Kingdom). No data on leaf wet-ness are available for the first experiment. Rainfall per hour and rainfall durationwere recorded with a rain gauge at the meteorological station of the Department ofMeteorology of Wageningen Agricultural University at a distance of 500 m fromthe experimental field.
Treatments. C. globosum and G. catenulatum were grown in petri dishes on oatmealagar (2.1). U. atrum was grown for 28 days on sterilised oat grains in 250-ml Erlen-meyer flasks containing 30 g of oats (dry weight) saturated with water. A. pullulanswas grown on basal yeast agar. Suspensions applied to the field contained 2 x 10⁶
blastospores of A. pullulans, ascospores of C. globosum or conidia of the other an-tagonists per millilitre of tap water containing 0.01% of Tween 80. When applied inmixture, spore suspensions of C. globosum and U. atrum were mixed just beforespraying so that the final concentration of each antagonist was 1 x 10⁶ spores ml-1.Suspensions were kept in ice water before spraying. Control plots were sprayedwith tap water containing 0.01% of Tween 80 or with the fungicide Daconil Mapplied in a dose of 4 mg ml-1 as recommended for Botrytis control in lily bulb pro-duction. All applications were carried out in the late afternoon with a propane-operated field plot sprayer (AZO, Ede, the Netherlands) with a pressure of 250kPa. The application rate was 50 ml of suspension m-2, equivalent to 500 l ha-1.
Sampling. Two leaves per holder in the first four experiments (in total four leavesper treatment) and one leaf per holder in the last five experiments (in total fourleaves per treatment) were sampled 18 h after spraying to determine spore germi-nation of C. globosum and U. atrum. After sampling, fungal growth was stopped byexposing leaves to formalin vapour for 30 min. Five leaves per holder (in total 10leaves in experiments 1 to 4 and 20 leaves in experiments 5 to 9) were sampledafter five days (experiments 3, 4, 6, 8, and 9) or six days (experiments 1, 2, 5, and 7)to determine the sporulation potential of Botrytis spp. The remaining leaves weresampled on the same day and stored at –20 °C to measure mycelial growth of an-tagonists later (see below).

48 Biological control of Botrytis spp. with Ulocladium atrum
Spore germination. Eighteen hours after application of antagonists, the germina-tion rates of spores of C. globosum and U. atrum, sprayed alone or in combination,were determined on four leaves per treatment. Spores of these antagonists are easyto distinguish from most of the spores of other fungi naturally deposited on theleaf surface. Fungi were stained with cotton blue in lactic acid (2 ml lactic acid, 4 mlglycerine, 3.5 ml distilled water, 15 mg cotton blue) and examined under a micro-scope with 200 x magnification. Fifty spores were randomly selected per leaf. Theywere considered as germinated when germ tube lengths were at least half the di-ameter of a conidium of U. atrum or equal to the diameter of an ascospore of C.globosum.The number of spores of C. globosum and U. atrum cm-2 leaf surface was determinedin all experiments 18 h and five days (experiments 3, 4, 6, 8, and 9) or six days (ex-periments 1, 2, 5, and 7) after spraying. The number of spores within a grid of0.25 mm2 at 10 randomly chosen parts of each of four leaves was counted using amicroscope at 200 x magnification. In all experiments leaves from the controltreatment were examined in the same way to monitor a possible background in thefield of naturally occurring spores of C. globosum, U. atrum or other fungi not distin-guishable from those of the two antagonists. On average, less than 20 of suchspores cm-2 were found in the control treatment compared to an average of ap-proximately 1000 spores cm-2 leaf surface on treated leaves.
Mycelial growth of U. atrum. The mycelial development of U. atrum on dead lilyleaves was determined after a field exposure period of five days (experiment 3, 4, 6,8, and 9) or six days (experiment 1, 2, 5, and 7) on four leaves per treatment. Fungiwere stained with cotton blue in lactic acid. The percentage germination of 50 ran-domly chosen conidia was determined as described above. From 20 randomly cho-sen germinated conidia, the number of germ tubes and the number of hyphal tipswere counted. From the same conidia, the total mycelial length produced per co-nidium was measured using an interactive digitiser (Minimop, Kontron,Oberkochen, Germany).
Sporulation potential of Botrytis spp. Five leaves per holder sampled five or sixdays after field treatments were placed into moist chambers (210 x 160 x 50 mmpolycarbonate chambers with two layers of sterile wet filter paper, enclosed inpolyethylene bags). Leaves were incubated at 18 °C for eight days in the dark.Thereafter, the percentage leaf area covered with conidiophores of Botrytis spp. wasvisually estimated in classes (viz. 0, 1, 5, 10, 20, ... 80, 90, 95, 99, 100% coverage ofleaf area) using a stereo-microscope with 10 to 40 x magnification. The leaf areacovered with conidiophores of the two dominating groups of saprophytes,Cladosporium-like fungi and Alternaria-like fungi (including Ulocladium andStemphylium), was also recorded.

Materials and Methods 49
Statistics. Percentage data from the nine experiments were subjected to a variancestabilising angular transformation, and simultaneously analysed by analysis of vari-ance. As an obvious consequence of the experimental design used, possible differ-ences between microclimatic conditions could not be inferred. However,interaction of climatic conditions with treatments, being a main interest of thisinvestigation, could be judged from the differences between plots within blocks.The leaf area covered with conidiophores was analysed separately for each fungalgroup. LSD values were calculated for comparing means of different treatmentswithin the same experiment.
2.2.3 Effect of environmental factors on U. atrum
2.2.3.1 Effect of temperature on conidial germination and mycelialgrowth of U. atrum in comparison with Gliocladium spp.
Air temperature during leaf wetness periods under field conditions. From 5July to 29 August 1994, air temperature and leaf wetness of dead leaves of onionand lily were measured in experimental field plots at Wageningen. Air temperaturewas measured with an electronic sensor (airprobe YA-100-hygrometer, RontronicAG, Bassersdorf, Switzerland) in the onion crop at a height of 35 cm. Leaf wetnessperiods for dead leaves positioned within the canopy of the onion or the lily cropwere measured with electronic sensors developed at our institute (Köhl et al.,1995b). Data were recorded at 30-min intervals and stored in a data-logger (Delta-TLogger, Delta-T Devices Ltd., Burwell, Cambridge). The same equipment was usedin commercial greenhouses in a cyclamen crop in an experiment lasting fromAugust to December 1997.
Conidial germination. U. atrum was cultured in petri dishes (90 mm) containing15 ml oatmeal agar. G. roseum 1813 was grown on malt extract agar (1 g malt ex-tract, 15 g agar, 1000 ml tap water). Conidial suspensions were prepared as de-scribed above (2.1). Flasks containing the conidial suspensions were kept in ice-water and suspensions were used within 1 h.Conidial germination over time at different temperatures was determined in petridishes (50 mm diameter) containing 6 ml agar. For experiments with U. atrum wateragar (15 g agar, 1000 ml tap water) was used. Since G. roseum did not germinate onwater agar, 1 g malt extract l-1 was added to the agar as an exogenous nutrientsource. The petri dishes were placed in incubators at different temperatures 24 hbefore use. The temperatures were: 3, 6, 9, 12, 15, 18, 21, 24, 27, 30, 33, and 36 °C.Thirty two petri dishes per temperature were sprayed with conidial suspensionsusing sterile atomisers in a laminar flow cabinet, resulting in a conidial density onthe agar surface of approximately 5.6 x 10² conidia cm-2. Petri dishes were immedi-ately returned to the appropriate incubator, so that it can be assumed that the tem-

50 Biological control of Botrytis spp. with Ulocladium atrum
perature of the agar was at the corresponding temperature from the beginning ofthe experiment. Two conidial suspensions of each fungus were prepared for eachexperiment and the second suspension was prepared approximately 12 h after thefirst one. Petri dishes for incubation at the same temperature were inoculated onthe same day in the morning or 12 h later to avoid late night sampling during thecourse of the experiment.The total incubation period of the conidia depended on fungus and temperatureand was based on results of preliminary experiments. This was 42 h or 4 h 45 minfor U. atrum and 144 h or 24 h for G. roseum for incubation temperatures of 3 °Cand 24 °C, respectively. The incubation period was divided into 16 equal time in-tervals and after each time interval, two arbitrarily chosen petri dishes were sam-pled. Fungal growth in the sampled dishes was stopped immediately by addingthree droplets of household ammonia water (4.8% (w/w) NH4OH) onto a filterpaper (40 mm) placed into the lid of the petri dish and closing it again. Plates werestored at 4 °C until they were assessed.To study the germination of U. atrum conidia on necrotic lily leaves, symptomlessgreen lily leaves were cut from the greenhouse-grown plants and dried at 60 °C for48 h. The dead leaves were then gamma-irradiated (4 MRad). Before use in experi-ments, leaves were rehydrated in sterile flasks containing sterile tap water. The sur-faces of leaves were blotted dry using sterile filter paper and leaves were placed insterile petri dishes (55 mm) containing two filter papers (50 mm) moistened with0.75 ml sterile tap water. Experiments were carried out at 3, 6, 12, 18, 24, 27, 30,and 33 °C and leaf samples were taken during the course of the experiments asdescribed above for experiments with conidia incubated on agar. All experimentswere carried out twice.To assess conidial density and germination on agar or lily leaves, several droplets ofcotton blue in lactic acid were added onto the agar or the leaf surface. Conidialgermination was quantified using a microscope (200 x magnification) by examining50 arbitrarily chosen, non-clustered conidia per petri dish or leaf. Conidia wereconsidered germinated when the germ tube was at least as long as the shortest di-ameter of the conidium. The mean of the germination percentage for two petridishes or leaves per sampling time was used for data analysis.
Mycelial growth. Mycelial growth rates at 3, 6, 9, 12, 15, 18, 21, 24, 27, 30, 33, and36 °C were determined for U. atrum, B. aclada 006, B. cinerea 700 and B. elliptica 702,and six isolates of Gliocladium spp. in petri dishes (90 mm) containing 15 ml maltextract agar (1 g malt extract, 15 g agar, 1000 ml tap water). The agar plates wereinoculated in the centre of the dish with an agar disc (5 mm) obtained from theedge of 4- to 10-day old colonies growing on the same medium for each species at18 °C in the dark. The average of two perpendicular colony diameters was recordedon the day after a new colony had visibly developed on the inoculated agar andagain shortly before the growing colony covered the entire plate. The maximumcolony diameter measured was 80 mm. For temperatures resulting in slow fungal

Materials and Methods 51
development, the last measurement was carried out 26 days after inoculation. Theaverage daily radial growth rate was calculated as half of the diameter differencesbetween the last and the first measurement divided by the number of days betweenthese two measurements. For each fungal isolate, the experiment was carried outtwice and data presented are the mean radial growth rates of the two experiments.
Statistics. The cumulative percentage of germinated conidia over time, was de-scribed for each temperature separately by the logistic model: y = C/(1 + exp(–B(t – M)) for t ≥ 0, in which C = maximum germination percentage, B = ger-mination rate parameter, M = time after which 50% of the conidia are germinated,and t = time in hours. From the fitted regression curve for each of the tempera-tures, the time needed to reach given germination percentages (e.g. 10%, 20%,50%, 80%, 90%) can be estimated.Logan curves were fitted to data on mycelial growth at different temperatures.These curves are typically used to describe temperature controlled biological proc-esses. Logan curves have the following general form:
Y = a * (exp(b * X – d)) – exp(b * (e – d) – (e – X)/c))
The response variable Y increases exponentially with temperature X from the valuea at the lower threshold temperature d to an optimum temperature with a relativeincrease of b after which Y declines sharply until the upper lethal temperature e isreached (Logan et al., 1976).
2.2.3.2 Effect of water potential on conidial germination of U. atrum
Conidial suspensions. U. atrum was cultured in petri dishes (90 mm) containing25 ml of oatmeal agar for 28 days at 18°C in the dark. Conidial suspensions wereprepared as described above (2.1). Flasks containing the conidial suspensions werekept in ice-water and suspensions were used within 1 h.
Conidial germination at different constant and alternating water potentials.Glass slides were covered with a thin layer of water agar (15 g agar, 1000 ml tapwater) as described by Fokkema (1984) and dried in a sterile laminar flow cabinet.Slides were sprayed with a conidial suspension of U. atrum (5 x 10⁵ conidia ml-1;approximately 800 conidia cm-2) and left to dry in the sterile flow cabinet for30 min. Subsequently, each agar slide was transferred to a moist chamber, consist-ing of a petri dish (90 mm) containing 15 ml of demineralised water or mixtures ofdemineralised water and glycerol (Dallyn and Fox, 1980) to obtain, at equilibrium,water potentials in the agar layer of –0.28, –1, –3, –5, –7, –10, or –14 MPa, corre-sponding to a relative humidity of 99.8, 99.3, 97.9, 96.4, 95.0, 92.9 and 90.0%.Glycerol-water solutions were freshly prepared for each experiment. A lid of asmaller petri dish (60 mm) had been fixed in the centre of the petri dish to support

52 Biological control of Botrytis spp. with Ulocladium atrum
the agar slide so that there was no contact between the water-glycerol mixture andthe agar layer. Immediately after transfer of the agar slides to the moist chambers,these were sealed with parafilm and incubated at 18 °C ± 0.5 °C in the dark. Afterthe incubation period, fungal growth in the sampled dishes was stopped immedi-ately by adding 1 ml of household ammonia (4.8% NH4OH) onto a filter paper (40mm) placed into the small petri dish and closing the petri dish again. Agar slideswere stored at 5 °C until microscopic examination.Experiments were carried out with constant or alternating water potentials. In theexperiment with incubation at constant water potentials agar slides were incubatedin petri dishes containing water-glycerol mixtures as described above. Incubationperiods were, based on results of preliminary experiments, 4, 6, 8, 12, 16, 24, 36,48, and 72 h for each water potential, except at –0.28 MPa where the longest incu-bation period was 24 h, and at –10 and –14 MPa, where incubation periods were24, 48, and 72 h. For each incubation period at each water potential, three arbitrar-ily chosen agar slides were sampled. The experiment was repeated.For experiments with alternating water potentials, agar slides were inoculated andincubated in petri dishes containing water-glycerol mixtures, as described above.Water potentials of the agar layer were changed by rapidly transferring agar slidesto petri dishes containing the appropriate glycerol-water mixtures. Conidia on agarslides were incubated under conditions of high water availability at –1 MPa(equivalent to 99.3% RH) which were interrupted by one period of low water avail-ability at –10 MPa (equivalent to 92.3% RH). Agar slides were incubated first inpetri dishes at –1 MPa for 0, 2, 4, 6, or 8 h and subsequently at –10 MPa for 24, 22,20, 18, or 16 h, respectively. Thereafter, agar slides were transferred again to petridishes containing glycerol-water mixtures at –1 MPa. In a similar experiment, agarslides were incubated at –42 MPa (equivalent to 70% RH) during periods of lowwater availability. Three arbitrarily chosen agar slides were sampled for each treat-ment (duration of incubation before period of low water availability started) after atotal incubation time at high water availability (–1 MPa) of 0, 2, 4, 6, 8, 10, 12, 24 or32 h. Additionally, three agar slides of each treatment were always sampled imme-diately after incubation periods at low water availability. The experiment was re-peated for both water potential levels during periods at low water availability.In another experiment, conidia on agar slides were incubated at high water avail-ability (–1 MPa) interrupted by two or three periods of low water availability(–42 MPa). The incubation period at –1 MPa lasted 6 h, followed by a period of18 h at –42 MPa. These cycles were repeated two or three times and were thenfollowed by continuous incubation at –1 MPa. Conidia incubated continuouslyunder moist conditions served as control. For each of the three treatments, threesets of agar slides were incubated, each prepared with a suspension of U. atrumconidia obtained from a separate petri dish. Such sets of petri dishes were allocatedto three blocks within the incubator. Agar slides prepared for the different sam-pling times were arranged randomly within each block. One agar slide per block foreach for the treatments was sampled after 0, 2, 4, 6, 8, 10, 12, and 24 h of incuba-

Materials and Methods 53
tion at –1 MPa. The next samples were taken after 72 h for the control treatment,after 36 and 84 h for the treatment with two dry periods and after 30, 42 and 90 hfor the treatment with three dry periods. Additionally, three agar slides of eachtreatment were always sampled immediately after incubation periods at low wateravailability. The experiment was repeated.Germination was assessed from 100 arbitrarily chosen conidia per slide stainedwith cotton blue in lactic acid using a microscope. Conidia with germ tubes longerthan half of the minimum diameter of a conidium were considered to have germi-nated. For several treatments the number of germ tubes of fifty arbitrarily chosenconidia was counted and the length of each germ tube was measured using an in-teractive digitiser (Minimop, Kontron, Oberkochen, Germany). When more thanone germ tube was present the longest was defined as the first and the next longestas the second germ tube.
Statistics. The data on conidial germination over time were analysed by fitting theGompertz curve, an asymmetric logistic curve: Y = C * exp[–exp(–B * (X – M)],where Y = germination percentage, X = total incubation period in hours at con-stant water potentials for experiments with continuous incubation at different wa-ter potentials or moist condition (–1MPa) for experiments with varying waterpotentials and C, B and M the parameters to be estimated. In the curve, C = upperasymptote (maximum germinated percentage), B = rate of increase in percentage ofgerminated conidia (slope parameter) and M = point of inflection (time needed toachieve 37% of the maximum germination percentage). Since continuous incuba-tion at –10 and –14 MPa did not result in germination, these data were excludedfrom the analyses. During the fitting process, the lower asymptotes were forced tozero as the minimum level of germination percentage. Using the estimates of theparameters in the curve, the expected germination percentage can be calculated.Curves were fitted to the data for the repeated experiments with constant waterpotentials, with one interruption of the incubation under moist conditions(–1 MPa) by a dry period (–10 or –42 MPa) and with multiple interruptions of themoist period. A separate curve was fitted for each treatment of each block (if rele-vant) in each experiment. The parameters of the fitted Gompertz curves were thenanalysed using the original structure of the experimental units (Mead, 1988). Due tothe different experimental designs, experiments with continuous incubation undermoist conditions or with one interruption of the incubation under moist conditions(–1 MPa) were analysed differently from experiments with multiple interruptions ofmoist periods. Since the different constant water potentials and the duration of theinitial dry period have quantitative treatment levels, the curve parameters C, B andM were analysed using linear regression. The experiments with multiple interrup-tions of the moist period resulted in a total of 18 curves. The treatment effect onthe curve parameters C, B and M was tested in an analysis of variance, taking theblocks and different experiments into account. Significant F- tests (P < 0.05) were

54 Biological control of Botrytis spp. with Ulocladium atrum
followed by LSD tests ( = 0.05) for testing pairwise differences between treatmentmeans.
2.2.3.3 Effect of temperature on antagonism of U. atrum againstB. cinerea and B. aclada
Effects of temperature on control of sporulation of B. cinerea and B. aclada by an-tagonists in dead host tissues were investigated. The effect of U. atrum on sporula-tion of B. cinerea and B. aclada at different temperatures (6 to 24 °C) was tested ondead onion leaf segments. The effects of U. atrum and G. roseum on the sporulationof B. cinerea were compared at the same range of temperatures on dead leaf seg-ments of cyclamen. Additionally, U. atrum was tested at 18, 3 and 1 °C on necroticleaves of hydrangea inoculated with B. cinerea. Each experiment was carried outtwice. Symptomless green leaves of field-grown onions cv Hyton and of cyclamen(bulk sample of several cultivars) were dried at 60 °C for several days. Dry leaveswere cut into segments 2 cm long for onions and 9 mm discs for cyclamen, sealedin plastic bags and sterilised by gamma-irradiation (4 Mrad). Naturally senescedleaves of hydrangea were dried, cut into segments of 2 x 2 cm and gamma-irradiated. Leaf segments for use in bioassays were washed thoroughly with steriletap water to remove soluble nutrients. For this purpose, approximately 100 leafsegments were washed three times in 350 ml sterile water in sterile 500-ml conicalflasks which were shaken using a flask shaker at 150 strokes min-1. Leaf segmentswere then blotted dry with sterile filter paper and placed in a sterile petri dish (90mm). Petri dishes contained four leaf segments on two sterile filter papers (80 mm)moistened with 1 ml sterile tap water. Separate experiments were carried out forleaf segments of onion, cyclamen and hydrangea with five replicate petri dishes pertreatment per temperature. Conidial suspensions of B. aclada (1 x 10⁵ conidia ml-1),B. cinerea (1 x 10³, 1 x 10⁴ or 1 x 10⁵ conidia ml-1), U. atrum (1 x 10⁶ conidia ml-1) andG. roseum 1813 (1 x 10⁶ conidia ml-1), all cultured on oatmeal agar, were prepared asdescribed above. Leaf segments were sprayed with the conidial suspensions using asterile atomiser in a laminar flow cabinet with a rate of approximately 5 µl cm-2 leafsurface. All leaf segments were first sprayed with conidia of B. aclada or B. cinereaand incubated at 18 °C in the dark for 24 h and 8 h, respectively. After this initialincubation, leaf segments were then sprayed with conidial suspensions of the an-tagonists or sterile tap water containing 0.01% Tween 80 as the control treatment.For experiments with onion and cyclamen leaves, the petri dishes were subse-quently placed at 6, 9, 12, 15, 18, 21, and 24 °C in the dark. For the experimentwith hydrangea leaves, the petri dishes were subsequently placed at 1, 3 and 18 °Cin the dark. Petri dishes of each temperature were completely randomised withinone incubator.In experiments with onion leaves, the sporulation of Botrytis spp. was assessed 8,12, 21 and 34 days after the antagonist was applied. The coverage of leaf area withconidiophores was estimated using classes from 0 to 5 and a sporulation index (SI)

Materials and Methods 55
ranging from zero to hundred was calculated (2.2.2.1; Köhl et al., 1995c). SI's in-creased in time during the first days of an experiment but then, depending on theincubation temperature, remained constant after 12 to 34 days. For data analysis,SI's were used from the assessment after which no further increase of sporulationwas observed. In experiments with cyclamen leaves, B. cinerea sporulation was as-sessed as described above for all temperatures 19 days after antagonists were ap-plied. Since B. cinerea produced sclerotia besides conidia on the leaf surfaces, thenumber of sclerotia was also counted in these experiments after 19 days. In theexperiments with hydrangea leaves, sporulation of B. cinerea was assessed 21 daysafter inoculation for leaves incubated at 18 °C and 56 days after inoculation forleaves incubated at 1 or 3 °C.In one experiment, the number of B. cinerea conidia produced on cyclamen leafsegments was determined at day 19. The four leaf discs from each of the five repli-cates were bulked for each treatment and each temperature. Leaf discs were trans-ferred into 100-ml flasks containing 15 ml tap water with 0.05% Tween 80 and20% (v/v) ethanol. After shaking with a flask shaker at 200 strokes min-1 for10 min, the concentration of the resulting suspension of B. cinerea conidia wascounted with the aid of a haemocytometer. From the mean of four subsamples persample, the number of conidia produced cm-1 cyclamen leaf was calculated.
Statistics. The Sporulation Index (SI) for B. aclada or B. cinerea from bioassays ononion or cyclamen leaves were angular transformed prior to analysis by ANOVAusing a split plot model. The experiment, temperature, antagonist treatment andBotrytis species or concentration as well as the interactions between temperature,antagonist treatment and Botrytis species or concentration were used as explanatoryvariables. The 2- and 3-factor interaction between experiment and treatment fac-tors were also taken into account in the ANOVA model. The 2-factor interactionbetween experiment and temperature was used as the main plot residuals for test-ing temperature effects. The 4-factor interaction between experiment, temperature,antagonist treatment and Botrytis species was used as split plot residual for testingthe remaining effects. Angular-transformed SI data for the B. cinerea bioassay onhydrangea leaves were analysed by ANOVA. Due to inbalance in the design theREML-directive of Genstat 5 was used. In the ANOVA the main effect of experi-ment and the effect of treatment with U. atrum, temperature and concentration,including their interactions, were tested for significance. A conditional LSD test( = 0.05) on the angular scale was used for testing pairwise differences betweentreatment means. For presentation the means on the angular scale were backtrans-formed to the original scale.
2.2.3.4 Effect of water potential on antagonism of U. atrum againstB. cinerea
Symptomless green leaves were removed from cyclamen plants (approximately 30weeks old), placed on dry filter paper and were allowed to senesce for six weeks at

56 Biological control of Botrytis spp. with Ulocladium atrum
ambient temperature and 50 to 70% RH. Leaves were rehydrated, cut into pieces ofapproximately 4 x 4 mm which were dried between dry filter paper in a plant pressto obtain flattened leaf pieces. One hundred dry leaf pieces were weighed, sealed inplastic bags and gamma-irradiated (4 Mrad). Fourteen days before the beginning ofexperiments, sterile water was added to the plastic bag with the leaf pieces, bagswere sealed again and stored for one week to allow equilibration of leaf piece watercontent. To obtain water potentials of approximately –1 MPa, –3 MPa and–7 MPa, 1.5 ml, 0.5 ml or 0.25 ml of sterile tap water per g dry weight of leaf pieceswere added, respectively, according to the relationship between water content andwater potential available for dead onion leaves (3.2.1.4; Köhl et al., 1995c).Moist chambers were prepared consisting of sterile plastic petri dishes (140 mm)containing 75 ml water agar with KCl added to obtain a water potential of the agarof –1 MPa, –3 MPa and –7 MPa (Campbell and Gardner, 1971). A sterile glass slide(76 mm x 26 mm) was placed on the agar, and separated from the agar by a sterileplastic grid to avoid diffusion of KCl onto the slide surface. After incubation forseven days at 20 °C in wetted plastic bags, leaf pieces were transferred into moistchambers with the corresponding water potential. Ten leaf pieces were placed onthe glass slide in each moist chamber, sealed with parafilm and stored for sevendays at 18 °C to allow equilibration of the water potentials and obtain a preciselycontrolled water potential in the leaves (Köhl et al., 1992).On another set of sterile glass slides, conidial suspensions of B. cinerea (1 x 10⁵ and1 x 106 conidia ml-1) or U. atrum (1x 10⁶ conidia ml-1) were sprayed at a rate of ap-proximately 1 µl cm-2 and were subsequently allowed to dry in a sterile laminar flowcabinet. The five treatments consisted of spraying each of the three conidial sus-pensions alone and spraying the conidial suspension of the antagonist followed byspraying conidial suspensions of B. cinerea at the two different concentrations. Inthis case, the second spray was carried out after the first suspensions had beenallowed to dry on the slide. The ten leaf pieces per moist chamber at the differentwater potentials were transferred rapidly, using sterile forceps, onto glass slidescontaining dried conidia of the different fungi. To ensure a relatively stable waterpotential in the leaf pieces during this operation, this was carried out in a glass box(30 cm x 30 cm x 48 cm) with wet filter paper fixed to the walls. Slides with leafpieces were immediately placed back into the moist chambers and the moist cham-bers were sealed with parafilm. Leaf pieces were then incubated at 18 °C ± 0.5 °Cin the dark. Each of the five fungal treatments was carried out for each of the threewater potentials on three glass slides in separate moist chambers (replicates). Afterincubation at 18 °C in the dark for 14 and 28 days, fungal sporulation on the leafpieces was assessed using sporulation classes, and a sporulation index (0 to 100)was calculated (3.2.1; Köhl et al., 1995c). The experiment was repeated.
Statistics. Angular-transformed data of the repeated experiment on antagonism ofU. atrum towards B. cinerea at different water potentials were combined and analysed

Materials and Methods 57
by ANOVA followed by LSD tests ( = 0.05) for testing pairwise differences be-tween treatment means.
2.2.3.5 Survival of U. atrum conidia on green leaves and competitivecolonisation of senesced leaves by B. cinerea and U. atrum
Experiments with greenhouse-grown cyclamenTreatments. Fifty 20-week old potted cyclamen plants (cv Super Serie) with ap-proximately 15 leaves per plant were grown in a greenhouse at 20 ± 3 °C and65 ± 20% RH. Petioles of fully developed leaves were labelled with coloured, plas-tic coated iron rings. Pots were placed on tables on capillary mats. Water was sup-plied via the mat so that leaves were not wetted. In a second experiment, water wasapplied by top irrigation using a sprinkler. Plants were irrigated with approximately1 l m-2 at an interval of two to three days. Experimental plots consisted of fiveplants, each sprayed with a conidial suspension of U. atrum with 1 x 10⁶ conidia ml-1
(2.1) or tap water containing 0.01% Tween 80. The separate experiments with thetwo different irrigation regimes were arranged in a randomised complete blockdesign, with each treatment replicated five times and each experiment repeatedonce.
Conidal density and germination. Two (first experiment without top irrigation)or three labelled leaves (other experiments) per sampling date per replicate werearbitrarily selected from the five plants of each replicate. Sampling dates were 0, 2,4, 7, 10, 14, 21, 28, 42, 56 and 70 days after spraying. Sampled leaves were healthyand without symptoms of B. cinerea during the experiment, but B. cinerea developedon senesced leaves of the plants. At each sampling date, one of the sampled leaveswas cut longitudinally into two pieces. On one half, the density of conidia and thepercentage of germinated conidia of U. atrum were determined. The other half wasincubated at 24 °C for 8 h in the dark in a moist chamber consisting of petri dishes(55 mm) with two moistened filter papers (50 mm) on the bottom and one in thelid to estimate the percentage of conidia of U. atrum which lost their ability to ger-minate.Conidial density on the upper leaf surface was determined using a microscope at amagnification of 10 x 10. Each half leaf was divided into ten equally sized sectionsand the conidial density was determined in the centre of each section by countingthe number of conidia lying within a grid representing 1 mm2. The average numberof U. atrum conidia cm-2 of leaf surface was calculated for each leaf. To determinegermination of conidia of U. atrum on the leaf surface directly after sampling orafter additional incubation in a moist chamber, a droplet of 0.01% of CalcofluorWhite (Fluorescent Brightener 28, F-6259 Sigma; 0.01% w/v in 1 M Tris HClbuffer, pH 8) was added to the leaf surface and the surface was inspected at a mag-nification of 10 x 10 under a fluorescence microscope (Axioscope with filter 05,Zeiss, Oberkochen, Germany) using a blue/violet (395 to 440 nm) light source. Per

58 Biological control of Botrytis spp. with Ulocladium atrum
half leaf, 100 arbitrarily chosen, non-clustered conidia were assessed. Conidia werecounted as germinated when germ tube length was at least half of the shortest axisof the ellipsoidal conidium.
Competitive substrate colonisation. In experiments without top irrigation, theremaining one (experiment 1) or two (experiment 2) leaves per replicate wereplaced in an open petri dish (55 mm) on two dry filter papers (50 mm) for 21 days(experiment 1) or 28 to 42 days (experiment 2). Petri dishes were arranged inblocks as described above for plants. After the detached leaves in the petri disheshad senesced (characterised by the loss of turgor and a yellow or brown colour)during a period of three, four or six weeks in the experimental greenhouse, 0.75 mlof tap water were added to each petri dish and the closed dishes were transferred toan incubator. Leaves were incubated at 18 °C in the dark. After 14 days, the cover-age of the upper surface of the leaves with conidiophores of B. cinerea, U. atrum andother fungi was estimated in classes ranging between 0 and 1 (i.e. 0, 0.01, 0.05, 0.1,0.2, ... 0.8, 0.9, 0.95, 0.99, 1) using a stereomicroscope with 10-40 x magnification(2.2.2.2; Köhl et al., 1995b). In the first experiment, in many cases leaves were notsenescent at the assessment date and no fungi developed. Data from such leaveswere excluded from the analysis. Data from three sampling dates, based on at leastone leaf per replicate, were further analysed. In the second experiment without topirrigation, detached leaves were left in the greenhouse for 28 days. Thereafter, se-nesced leaves were incubated in a moist chamber. Leaves without symptoms ofsenescence were left in the greenhouse for another 14 days. At assessment dates, 14days after incubation in a moist chamber, all leaves were necrotic.In experiments with top irrigation, two leaves per replicate at each of the samplingdates were placed in open petri dishes on two dry filter papers. Petri dishes werearranged in blocks in the greenhouse as described for plants above but were notirrigated. Forty-two days after sampling, when all these leaves had senesced,0.75 ml of sterile tap water was added to the filter paper in each petri dish and theclosed petri dishes were transferred to an incubator. Leaves were incubated for 14days in the dark at 18 °C. Thereafter, the coverage of the leaf area with conidiopho-res of B. cinerea was estimated as described above.
Statistics. Analysis of variance (ANOVA) was employed on log-transformedcounts of U. atrum conidia cm-2 and on arcsine transformed data on sporulation ofB. cinerea. Significant F-tests (P < 0.05) were followed by two sided LSD tests( = 0.05) for testing pairwise differences between treatment means.
Experiments with field-grown liliesField plots and treatments. Bulbs of the Asiatic hybrid lily (Lilium cv MontBlanc) were planted on 18 April 1995 in 5 m x 1 m plots with each plot separatedby 8 m buffers of sugar beet. The herbicide chloridazon (Pyramin, 650 g a.i. kg-1,BASF, Germany) was applied on 19 April and thereafter no further pesticide appli-
Materials and Methods 59
cations were made. Prior to anthesis, all flower stems in each plot were removed on5 July by hand as normal commercial practise in bulb production. Ten microplots,each consisting of at least nine individual plants of equal height and growth stage,were selected within each of the two separate 5 m x 1 m plots.The U. atrum suspension was applied on 24 July (experiment 1) to five replicatemicroplots in the same 5 m x 1 m plot using a propane-powered backpack sprayer(AZO, Ede, the Netherlands) with a single nozzle with a pressure of 250 kPa. Tapwater plus 0.01% Tween 80 was applied to five replicate control microplots alsolocated in the same plot. The experiment was set up as a 2 * 3 * 4 factorial split plotdesign with treatment factors that were: U. atrum application (plus and minus), can-opy level (top, middle, bottom) and time of inducing necrosis after U. atrum appli-cation (0, 7, 14 and 21 days) with five replications (microplots). The experimentwas repeated in a separate 5 m x 1 m plot on 31 July (experiment 2). All treatmentswere sprayed in the evening and a metal frame (50 cm x 30 cm x 30 cm) sur-rounded by polythene plastic was carefully placed around each microplot at thetime of application to minimise drift from one microplot to another.
Microclimate measurements. Temperature and relative humidity (RH) of the airwere measured with an electronic sensor (airprobe YA-1OO-hygromer, RontronicAG, Bassersdorf, Switzerland) positioned at a height of 35 cm in an onion fieldapproximately 50 m away from the treated plots. Rainfall was recorded with a raingauge placed in the same field. Three leaf wetness sensors (Köhl et al., 1995b) wereused to monitor leaf wetness of necrotic lily leaves in the lily canopy in an addi-tional microplot. All data were recorded at 30-min intervals and stored in a data-logger (Delta-T Logger, Delta-T Devices Ltd. Burwell, Cambridge, UK).
Survival of U. atrum conidia on green lily leaves. One hour, 7, 14 and 21 daysafter U. atrum application, one green leaf was randomly selected per replicate fromeach of the top, middle and bottom level of a single plant, located approximately 25cm, 15 cm and 5 cm respectively from the soil. Each leaf was placed into a steril-ised plastic vial and samples were immediately returned to the laboratory. Sampledleaves were then cut in two along the axis of the main vein with the aid of a scalpel.In order to determine the density (number of conidia cm-2 leaf surface) and per-centage of U. atrum conidia which had germinated on the leaf surface in the field(field germination), one half of the leaf was placed into an ammonia fumigationchamber to terminate all microbial growth. The fumigation chambers consisted ofsterile plastic petri dishes (90 mm diameter) to which five drops of household am-monia (4.8% NH4OH in water) were added to a single layer of filter paper (What-man, 50 mm diameter) attached to the lid of the chamber. To determine thepercentage of viable U. atrum conidia on the leaf surface (germination potential),the other half of the leaf was placed into a high humidity chamber. The chambersconsisted of sterile plastic petri dishes (90 mm diameter) containing two sterilefilter papers (Whatman, 80 mm diameter), moistened with 1 ml sterile tap water.

60 Biological control of Botrytis spp. with Ulocladium atrum
Growth was terminated after 18 h incubation at 18 °C in the dark by the additionof ammonia as described above. All leaf samples were stored at –18 °C until meas-urement.Half leaf sections were recut to 1 to 2 cm and placed onto glass microscope slides.To each preparate, 100 µl of the fluorochrome Calcofluor White was added to theleaf surface and then examined with a Zeiss Axioskop Fluorescence Microscope(see above). After staining with Calcofluor, little or no background autofluores-cence from plant cells was observed and spore morphology was used to distinguishU. atrum conidia from other saprophytic species. The number of conidia in an ocu-lar eyepiece grid (representing 0.25 mm2 of leaf surface) was counted and the aver-age number of conidia per grid calculated from 10 grids. The first observation wasalways started at an arbitrarily chosen position on the leaf and the other observa-tions were selected at regular intervals along a diagonal transect across each prepa-rate and the results expressed as the number of conidia cm-2 of leaf surface.Field germination (%) and germination potential (%) were determined by countingall conidia that had germinated in several fields of view, representing 0.64 mm2 ofleaf surface. The first observation was always started at an arbitrarily chosen posi-tion on the leaf and the other observations were selected at regular intervals along atransect across the surface of each preparate. Clusters of conidia were avoided anda minimum of 50 conidia in total were counted. Germination was assumed to haveoccurred when the germ tube length was greater than half the diameter of the co-nidium.
Fungal colonisation of artificially induced necrotic lily leaves. In order todetermine the ability of surviving U. atrum inoculum on green leaf surfaces to suc-cessfully colonise necrotic tissues, a method was developed which induced localisednecrosis on tagged green leaves in the field. Zero, 7, 14 and 21 days after U. atrumapplication, necrosis was artificially induced locally on tagged leaves, selected atrandom approximately 25 cm, 15 cm and 5 cm from the soil surface, representingthe top, middle and bottom levels, respectively. There were four lily plants perreplicate and five replicates per treatment. Induction of necrosis was achieved usinga desiccant herbicide Gramoxone (200 g l-1 paraquat dichloride, Zeneca Agro-chemicals, UK). Paraquat has been used in several phytopathology studies as a toolto aid the identification of fungi in host tissues (Bannon, 1978; Cerkauskas andSinclair, 1980). However, paraquat is known to affect some fungal species morethan others (Wilkinson and Lucas, 1969) and spore germination may be adverselyaffected at concentrations as low as 32 µg ml-1 paraquat (Michailides and Spotts,1991). Our preliminary studies indicated that 10 mg l-1 paraquat (plus 0.1% Tween80) was sufficient to induce localised necrosis on healthy green lily leaves but didnot affect spore germination (%) or germ tube growth of an isolate of B. cinerea, B.elliptica, Alternaria spp., Epicoccum purpurascens, Ulocladium spp. or U. atrum (Elmer andKöhl, unpublished).
Materials and Methods 61
To induce necrosis on healthy green lily leaves in the field, a small piece (1.5 cm2)of household moisture absorbent cloth was fixed firmly to the underside of taggedleaves and kept in place with the aid of a paper clip. Six hundred µl of paraquatsuspension (10 mg l-1 plus 0.1% Tween 80) was then carefully pipetted between thecloth and the underside of the leaf. Paraquat treatment was always made after sun-set to avoid the absorbent cloth drying too rapidly and the cloth and paper clipwere removed 48 h after paraquat application. The first symptoms of tissue necro-sis were observed at that stage and complete necrosis of the entire leaf occurredfive to seven days after paraquat treatment.Fourteen days after each application of paraquat (applied on day 0, day 7, day 14and day 21), one paraquat-treated necrotic leaf was removed from each of the top,middle and bottom zones of four plants per replicate with flame sterilised forceps.The four leaves per canopy level per replicate were placed into the same sterile highhumidity chambers. The chambers consisted of sterile plastic petri dishes (110 mmdiameter) with two layers of filter paper (Whatman, 100 mm diameter) moistenedwith 3 ml sterile tap water. The humidity chambers were sealed with parafilm andincubated at 18 °C in the dark for two days. The parafilm was then removed andthe necrotic leaves incubated for a further seven days. All samples were then sealedin plastic bags and stored at –18 °C.The area of necrotic tissue covered with sporulating U. atrum and other commonlyoccurring saprophytes was measured with the aid of a stereo microscope. A 25mm2 square was prepared from a clear acetate sheet and placed at random onto thenecrotic leaf surface. The area of sporulation in each 25 mm2 square by U. atrum,Alternaria spp., Cladosporium spp., Epicoccum spp., Stemphylium spp., and Botrytis spp.was then measured for four squares per leaf. Results were expressed as percentagecoverage of the surface of necrotic tissue.
Statistics. For the U. atrum treated microplots, an analysis of variance (ANOVA)was performed on the observed density counts of conidia after logarithmic trans-formation using a split-plot model with canopy level, time after U. atrum applicationand their interaction as explanatory variables and random effects for variation be-tween plots, canopy levels within plots and time within canopy levels within plots.The data for percentages of germinated conidia and the percentages of leaf areacolonised by U. atrum were angular transformed prior to ANOVA using the samesplit-plot model. Orthogonal polynomials were used to partition the sum of squaresfor time as well as for the interaction between time and canopy level into theamount that may be explained by a linear relationship of the response with time,the extra amount that may be explained if the relationship was quadratic and theamount represented by deviations from a quadratic polynomial. For the varioustime intervals separate ANOVA's were performed to percentages of leaf area colo-nised by Alternaria spp. and Cladosporium spp., respectively, after angular transfor-mation using a split-plot model with treatment, canopy level and their interaction asexplanatory variables and random effects for variation between plots and variation

62 Biological control of Botrytis spp. with Ulocladium atrum
between canopy levels within plots. F-tests for the variance ratios were used toassess treatment effects and pairwise differences between treatment means wereassessed using t-tests.
2.2.4 Mode of action of U. atrum
2.2.4.1 Fungal interactions: microscopical and ultrastructural studiesOnion leaves. Symptomless green leaves were removed from 12-week old field-grown plants of onion cv Hyton, dried for several days at 60 °C and stored in pa-per bags at room temperature in the dark (2.2.2.1; Köhl et al., 1995c). Dried leaveswere cut into 2-cm segments, sealed in plastic bags and sterilised by gamma radia-tion of 4 Mrad.
Bioassay on dead leaves. Onion leaf segments for use in bioassays were washedthoroughly with tap water to remove soluble nutrients and subsequently blotted drywith sterile filter paper (2.2.2.1; Köhl et al., 1995c). Six leaf segments were placed ineach of a series of moist chambers. Each chamber consisted of a sterile plastic petridish (90-mm diameter) containing two sterile filter papers (80-mm diameter) and1 ml sterile tap water. The experiment was carried out in a completely randomiseddesign with five replications (petri dish) with ten treatments. The treatments were:each of the four antagonists applied alone or in combination with B. aclada and B.aclada applied alone. In another control treatment, no fungi were applied to the leafsegments. Conidial suspensions of B. aclada or water plus surfactant were sprayedonto the leaf segments in the moist chambers and the segments were incubated at18 °C for 24 h. Immediately after the incubation periods, spore suspensions ofantagonists, or water plus surfactant, were sprayed onto the segments. Thereafter,leaves were further incubated at 18 °C in the dark.For light and electron microscopy observations, samples were taken six days afterapplication of the antagonists, since preliminary work had established this timeperiod to be optimal. Leaf pieces (2 x 2 mm) were cut from the central part of tworandomly selected leaf segments of each replication of each treatment and werefixed and stored in glutaraldehyde (3%, v/v) in 0.1 M sodium cacodylate at pH 7.2.Samples from the same treatments were bulked.Eight days after antagonists had been applied, the leaf area covered with conidio-phores of B. aclada was estimated using classes from zero to five and a sporulationindex (SI) ranging from zero to 100 was calculated for each replication (petri dish)consisting of four leaf segments (2.2.2.1; Köhl et al., 1995c).
Assay on agar. Petri dishes containing 15 ml of malt extract agar (10 g malt ex-tract, 15 g agar, 1000 ml tap water) were inoculated in four replicates with 5-mmagar discs with mycelium of B. aclada or U. atrum that had been obtained from the
Materials and Methods 63
margins of young colonies of the fungi grown on the same medium. Petri disheswere inoculated with one agar disc, with two discs of the same fungus or with twodiscs with different fungi. The distance between two discs was 50 mm. Plates wereincubated at 18 °C for seven days. After seven days, agar with mycelium was cov-ered with a 1-mm layer of agarose (3%) (van Balen, personal communication).Small pieces of agarose-covered agar with mycelium were cut from the margins ofcolonies. From plates with two colonies, samples were taken at the margins of bothcolonies where they had first contact. Samples were fixed and stored in glutaralde-hyde (3%, v/v) in 0.1 M sodium cacodylate at pH 7.2.
Light and electron microscopy. Both leaf and agar samples were post-fixed in1% osmium tetroxide in 0.1 M sodium cacodylate buffer at 4 °C for 1 h, beforebeing dehydrated in an ethanol series and embedded in Epon 812. Sections (0.7µm) of leaf tissues were cut and mounted on glass slides prior to being stained withtoluidine blue (0.96 mg/ml water) or methylene blue (10 mg/ml water) and exam-ined by light microscopy. Ultrathin sections (0.1 µm) of leaf and agar samples werestained for transmission electron microscopy (TEM) with uranyl acetate and leadcitrate prior to being examined, using a JEOL 1200 EX electron microscope at anaccelerating voltage of 80 kV. For each treatment of bulked samples, a minimum ofthree samples were cut into serial sections and examined under both light micros-copy and TEM. Unless otherwise stated, reported observations were representativeof all samples.
2.2.4.2 Competitive substrate colonisation: experimental studies andsimulation modelling
Plant material. Thirty-week old cyclamen plants cv Super Serie were obtainedfrom a commercial grower. The plants were placed on tables with capillary mattingin a greenhouse at 18 °C. Relative humidity of the air (RH) varied between 80%and 90%. Daylight was supplemented to a total of 10 h of light per day using artifi-cial lighting. Leaves and flowers were removed and the plants were allowed to de-velop new pesticide- and pollen-free leaves. Pollen is known to enhance infectionby B. cinerea (Chou and Preece, 1968). No pesticides were used and flower budswere removed. Three batches of fully grown symptomless leaves were picked inDecember, February and April. Leaves were placed on dry filter paper at ambienttemperature and about 60% RH and allowed to senesce. After two weeks, whenthe leaves were completely dry, they were cut in half, the midvein was removed.The leaf segments were sealed in plastic bags, sterilised by gamma-irradiation(4 Mrad) and stored at room temperature in the dark until use.
Head start experiments. Sterile necrotic cyclamen leaf segments were re-hydratedovernight in sterile tap water at 4 °C. Excess water was removed by blotting theleaves on sterile filter paper. Four leaf segments were placed in each of 150 petri

64 Biological control of Botrytis spp. with Ulocladium atrum
dishes (90 mm in diameter), adaxial side facing up, on top of a sterile plastic gridabove two sterile filter papers (80 mm in diameter) moistened with 1.5 ml of steriletap water. Leaves in the petri dishes were spray-inoculated with conidial suspen-sions of B. cinerea or U. atrum containing 1 x 10⁶ conidia ml-1 using atomisers(Desaga, Heidelberg, Germany). Inoculation resulted in average conidial densitiesof 45 conidia mm-2 leaf for B. cinerea and U. atrum as determined by direct micro-scopical observation.Mixed cultures were initiated by spraying the leaves with conidial suspensions of B.cinerea and U. atrum. B. cinerea was applied 24, 12 and 0 h ahead of U. atrum and 12,24, 30, 36, 42, 48 and 72 h after U. atrum had been applied. Monocultures served ascontrol treatments. They were initiated using the application intervals used for themixed cultures but replacing either B. cinerea or U. atrum by an application of steriletap water containing 0.01% Tween 80 resulting in U. atrum monocultures and B.cinerea monocultures, respectively. For each application interval of the fungi inmixed culture, the corresponding single inoculant treatment was used to assess theeffect of the challenger fungus. Five replicate petri dishes were included for eachapplication interval and culture type. Petri dishes were incubated at 18 ºC in thedark for two weeks after the first spray in a completely randomised design. Theexperiment was repeated once.Sporulation of B. cinerea and U. atrum was quantified two weeks after the first spraytreatment. The fraction of the leaf area covered with conidiophores (0, 10, 20,...,100%) and the relative intensity of the sporulation (0, 10, 20,..., 100%) of B. cinereaand U. atrum was recorded per leaf using a dissecting microscope at 100 x magnifi-cation. Multiplication of the two parameters and scaling of the result yields theSporulating Leaf Area Corrected for Intensity (SPLACI, 3.5.4; Köhl et al., 1998), anestimate for the number of conidia produced per leaf ranging from 0 to 100%.SPLACI values were averaged for the four leaves per petri dish.Data analysis was done analogous to de Wit’s analysis of replacement series.Sporulation was considered the ecologically relevant yield of the fungi. Based onaverage SPLACI values per petri dish, the relative yields (RY, yield in mixed culturedivided by the yield of the corresponding monoculture) of B. cinerea (RYbc) and U.atrum (RYua) as well as their sum, the relative yield total (RYT = RYbc + RYua), werecalculated and plotted against the application interval on the x-axis. If inter- andintraspecific competition are equal in intensity, the RY of each species is directlyproportional to its biomass proportion in the starting mixture. The sum of therelative yield for both species gives the relative yield total (RYT). The shape of theRYT line is indicative of the type of interaction between both competing species. Ahorizontal RYT line remaining at 1.0 for all input proportions indicates equal inter-and intraspecific competition. A RYT line that is concave or convex, respectively,indicates stronger and weaker interspecific than intraspecific competition.
Dynamics of mycelial colonisation and sporulation. Sterile necrotic cyclamenleaf segments, prepared as described before, were placed on top of a sterile plastic

Materials and Methods 65
grid, adaxial side facing up, above two sterile filter papers (40 mm in diameter)moistened with 0.5 ml of sterile tap water in a sterile plastic petri dish (55 mm indiameter, one leaf per dish). Leaves were spray-inoculated with conidial suspen-sions (1 x 10⁶ conidia ml-1) of B. cinerea, U. atrum or both fungi, using an atomiser(Desaga, Heidelberg, Germany). Inoculation resulted in average conidial densitiesof 25 conidia mm-2 for U. atrum and B. cinerea as determined by direct microscopicobservation. Following inoculation, petri dishes were incubated in the dark at 18 °Cor 24 °C in a completely randomised design.Leaf samples were processed and sectioned on a cryostat as described by Kessel etal. (1999). Mycelium of B. cinerea in the tissue sections was labelled specifically usingthe IgM monoclonal antibody (MAb) Bc-KH4 (Bossi and Dewey, 1992) and visu-alised in a secondary step using a µ-specific goat anti-mouse antibody conjugated toFITC (Cat No 1020 - 02, Southern Biotechnology Associates, Birmingham, Al.,USA). Mycelium of U. atrum in the sections was labelled specifically using themonoclonal antibody (MAb) Ua-PC3 (obtained from F.M. Dewey, Oxford Univer-sity, Oxford, UK) and visualised in a secondary step using a -specific goat anti-ratantibody conjugated to TRITC (Cat No 3030 - 03, Southern Biotechnology Associ-ates, Birmingham, Al., USA). Ua-PC3 is a rat IgG MAb raised against the surfacewashings of U. atrum mycelium. Ua-PC3 recognises an antigen located in the cellwall of U. atrum and does not attach to B. cinerea mycelium (Karpovich and Dewey,2001).Mycelial colonisation was quantified by measuring the relative surface area of thelabelled mycelium in the section using image analysis. The measured relative surfacearea of the mycelium was mathematically converted into the relative volume of themycelium in the section (Kessel et al., 1999).
Dynamic simulation model. To test whether resource competition can explainthe phenomena observed in the experiments, a mathematical model was con-structed. In the model, growth of mycelial biomass is determined by the density of'parent' biomass, and by the density of resources. Two types of resources weredistinguished: (1) general resources available to both species during intra- and inter-specific competition, and (2) species-specific resources available to one of bothspecies during intraspecific competition (optional). The state variables in the modelare U, B, R, RU, and RB. These represent, respectively, the biomass density of U.atrum, the biomass density of B. cinerea, and the density of resources that are acces-sible to both fungi (R), only accessible to U. atrum ( RU), or only accessible to B.cinerea ( RB). All these state variables are scaled and have unit dimensions on a scalefrom 0 to 1, such that U = 1 if the single species carrying capacity for U. atrum isreached (assuming RU to be 0). Likewise, for B. cinerea, B = 1 if the single speciescarrying capacity for B. cinerea is reached. The state variables for resource densityare scaled such that R = 1 in a non-colonised leaf, whereas R = 0 in a leaf fromwhich all general resources have been depleted. The variables RU, and RB are intro-
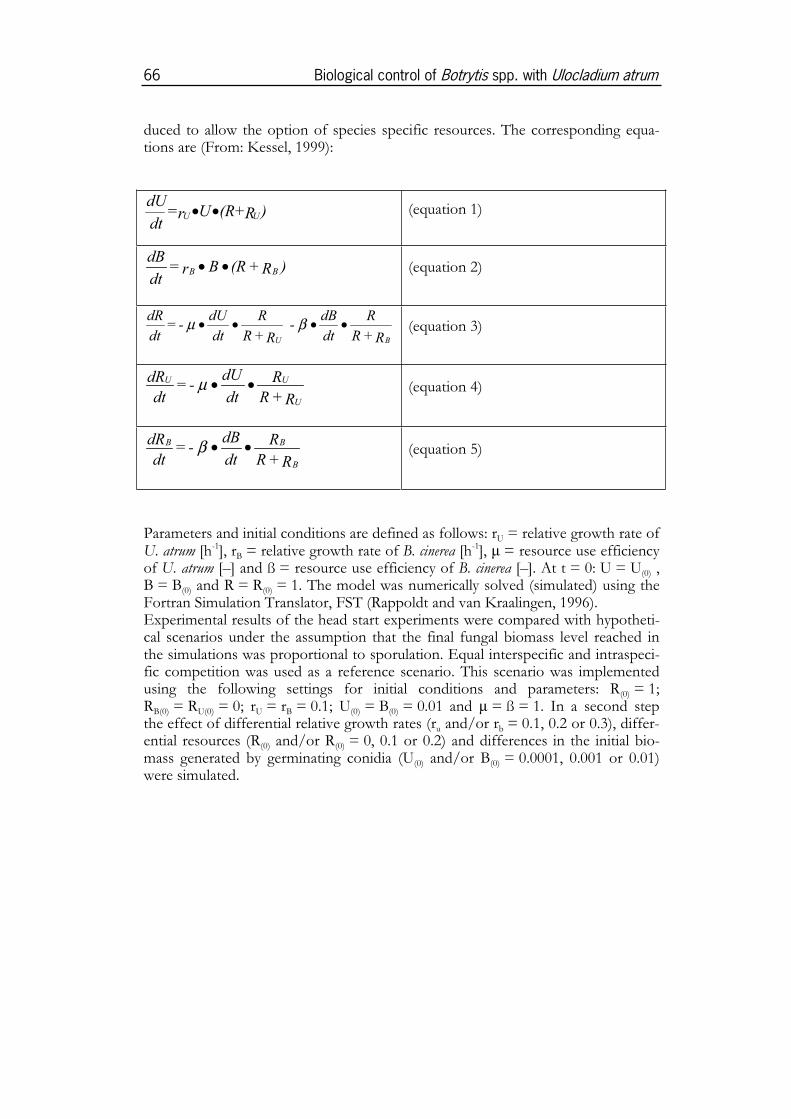
66 Biological control of Botrytis spp. with Ulocladium atrum
duced to allow the option of species specific resources. The corresponding equa-tions are (From: Kessel, 1999):
)R+(RUr=dt
dUUU •• (equation 1)
)R+(RBr=dt
dBBB •• (equation 2)
R+R
R
dt
dB-
R+R
R
dt
dU-=
dt
dR
BU
•••• βµ (equation 3)
R+R
R
dt
dU-=
dt
dR
U
UU ••µ (equation 4)
R+R
R
dt
dB-=
dt
dR
B
BB ••β (equation 5)
Parameters and initial conditions are defined as follows: rU = relative growth rate ofU. atrum [h-1], rB = relative growth rate of B. cinerea [h-1], µ = resource use efficiencyof U. atrum [–] and ß = resource use efficiency of B. cinerea [–]. At t = 0: U = U(0) ,B = B(0) and R = R(0) = 1. The model was numerically solved (simulated) using theFortran Simulation Translator, FST (Rappoldt and van Kraalingen, 1996).Experimental results of the head start experiments were compared with hypotheti-cal scenarios under the assumption that the final fungal biomass level reached inthe simulations was proportional to sporulation. Equal interspecific and intraspeci-fic competition was used as a reference scenario. This scenario was implementedusing the following settings for initial conditions and parameters: R(0) = 1;RB(0) = RU(0) = 0; rU = rB = 0.1; U(0) = B(0) = 0.01 and µ = ß = 1. In a second stepthe effect of differential relative growth rates (ru and/or rb = 0.1, 0.2 or 0.3), differ-ential resources (R(0) and/or R(0) = 0, 0.1 or 0.2) and differences in the initial bio-mass generated by germinating conidia (U(0) and/or B(0) = 0.0001, 0.001 or 0.01)were simulated.
Materials and Methods 67
2.2.5 Use of U. atrum for disease control in crops
2.2.5.1 Experiments in annual strawberriesExperimental plot layout. Seven field experiments were conducted with annualstrawberry (cv Elsanta) crops, using waiting-bed transplants cold-stored at –2 °Cuntil the day before planting. All experiments were carried out in a randomisedcomplete block design with four to six replications. Each plot in experiments 1 and4 consisted of four single rows of ten plants per row, with three plants per meter ofrow length and 0.8 m between rows. Plots were established inside a field of redcabbage serving as buffer crop with a distance of 10 m between plots. Each plot inexperiments 2, 3, 5, 6, and 7 consisted of 78 plants in three twin rows of 2 x 13plants per twin row. The distance between twin rows was 1 m, and 0.5 m withintwin rows with three plants per meter of row length. The plots were establishedwithin a grass field, separated by 10 m of grass buffer.
Treatments. The control treatment was an unsprayed plot except in experiment 1,where water-containing Tween 80 at 0.01% was applied weekly from transplantinguntil fruits began to turn red. U. atrum was applied at a concentration of 2 x 10⁶
conidia ml-1, except for experiment 7, in which the concentration was 0.5 x 10⁶
conidia ml-1. Application of U. atrum began at transplanting (U. atrum transplanting)or at opening of the first flower (U. atrum flowering) and ended when the first fruitsturned red. The frequency in application of U. atrum varied from weekly to twiceweekly, depending on the experiment. Comparative fungicide programmes startedat first open flower and continued until first fruits turned red, with applicationfrequencies varying among experiments. Materials used included iprodione (RovralWP, Rohm and Haas, France), tolylfluanide (Euparen M, Bayer, the Netherlands),pyrazophos (Curamil, AgrEvo, the Netherlands), thiram (TMTD, Satec, Germany),and pyrimethanil (Scala, AgrEvo, the Netherlands). Crop sanitation treatmentswere carried out in experiments 5 and 6, and consisted of removal of all senescingleaflets from the strawberry plants twice per week, starting immediately after trans-planting until first fruits turned red.For experiments 1 and 4, conducted at Breda, U. atrum and fungicides were appliedwith a knapsack sprayer using a hollow-cone nozzle and air-pressure at 200 kPa at arate of 500 l ha-1. For experiments 2, 3, 5, 6, and 7, conducted at Wageningen, U.atrum and fungicides were applied with a propane-gas-driven knapsack sprayer at250 kPa at a rate of 750 l ha-1.
Crop management and cultural practices. In all experiments, interval overheadirrigation was applied during periods of hot, dry weather in order to promote de-velopment of B. cinerea. Weeding was done mechanically. The soil was covered withstraw from beginning of flowering. No insecticides, herbicides, or other fungicideswere applied except for experiment 1 in which deltametrin was applied three times

68 Biological control of Botrytis spp. with Ulocladium atrum
for thrips control and experiment 4 in which transplants were treated with a fungi-cide (fosetyl-Al plus benomyl) at the time of planting.
Incidence of B. cinerea on flowers. In experiments 2, 3, 5, and 6, samples of 20to 30 flowers, each flower from a different arbitrarily chosen plant, were collectedper plot at each of two or three sampling dates. In experiment 7, 50 petals, eachpetal from a different arbitrarily chosen plant, were collected per plot instead ofwhole flowers. The flowers were processed and assessed as described in 2.2.1.2.
Harvest and post-harvest disease assessments. Fruits were picked twice perweek. Ripe symptomless fruits were harvested first and kept separate from har-vested diseased fruits. Fruits with symptoms were also picked when still in thewhite stage. Healthy and diseased fruits per plot were weighed and counted.
Fruit rot. In experiments 2, 3, 5, 6, and 7, the ripe and white diseased fruits wereassessed for characteristic symptoms caused by B. cinerea, Colletotrichum acutatum orZythia fragariae. In experiments 1 and 4, symptoms were classified as those of B.cinerea and other diseases without further differentiation. Fruits with non-specificsymptoms were placed without contacting each other into a plastic tray (50 cmlength x 30 cm width x 7 cm height) with wet paper on the bottom. The tray wassealed in a plastic bag, incubated at 20 °C for two days in the dark before symp-toms were reassessed. Fruits with characteristic symptoms were then added to thecorresponding disease category, and fruits with non-specific symptoms were classi-fied as ‘other diseases’.Post-harvest fruit rot on a sub-sample of symptomless fruits was assessed for ex-periments 1, 2, 3, 5, and 6. Twenty arbitrarily chosen fruits per plot were placed in aplastic tray (50 cm length x 30 cm width x 7 cm height) with wet paper on thebottom without contact among fruits, sealed in a plastic bag and stored at 4 °Cduring five days in the dark followed by three days incubation at 20 °C. Fruits werethen assessed for grey mould incidence.
Statistics. The statistical analysis was performed by analysis of variance (ANOVA),followed by LSD tests. Values of grey mould incidence on harvested fruit werearcsine transformed prior to analysis of variance.
2.2.5.2 Experiments in onionField plots. Two field experiments with onion were conducted. Onion cv HytonF1 was sown beginning of April 1995 and 1996, respectively, in 15 plots of 9 x 9 min rows 0.3 m apart. In order to minimise interplot interference, plots were sepa-rated by strips of sugar beet of at least 12 m (3.1.1; Köhl et al., 1995a). Plots werearranged in five blocks with plots of three different treatments randomised withinblocks.

Materials and Methods 69
Treatments. Three treatments were carried out at weekly intervals starting 26 June1995 and 24 June 1996, respectively, until the end of August (two weeks beforeharvest); (1) water containing 0.01% Tween 80; (2) conidial suspensions of U. atrum(2 x 10⁶ conidia ml-1); and (3) Ronilan (with 2 kg ha-1 a.i. vinclozolin). All sprayswere applied at 500 l ha-1.
Colonisation of necrotic leaves exposed in onion plots. Leaf supports eachwith ten 10-cm long leaf segments of artificially killed onion leaves were preparedas described in 2.2.2.2. Leaf supports were positioned in the centre of each onionplot during the field experiment in 1995 with leaves in a vertical position approxi-mately 20 cm above the soil. Per plot, one leaf support was placed before sprayapplications and one support 60 min after spraying. After seven days, five leavesper holder were sampled and incubated in moist chambers. Sporulation on theleaves of Alternaria spp., Cladosporium spp., Botrytis spp. and U. atrum was assessedafter ten days incubation at 18 °C (as described in 2.2.2.2 for lily leaves). In total,this operation was repeated weekly ten times during the course of the field experi-ment.
Colonisation of naturally senesced leaves. During the field experiment in 1995,necrotic parts of onion leaves were sampled randomly on 9 and 18 August (ap-proximately 25 per plot with a total length of 350 cm). Necrotic leaf tissues wereplaced in moist chambers (45 x 28 x 5 cm polycarbonate chambers with two layersof sterile wet filter paper, enclosed in polyethylene bags). Sporulation of Botrytisspp. was assessed as described above directly after sampling and after incubation at18 °C for 10 days. In 1996, such samples were obtained at 7, 14 and 21 August andprocessed in the same way.
Aerial spore load. Rotorod spore samplers were used on 19 and 22 August 1996to quantify the amount of conidia of Botrytis spp. in the air above and outside onionplots. One Rotorod device was fixed at a height of 0.3 m in the centre of each plotof the first four blocks of the experiment. Additionally, four Rotorods were placedapproximately 12 m away from onion plots in sugar beet to quantify thebackground load of Botrytis spp. conidia. Thus, in total 16 Rotorod devices wereused simultaneously. At each day, three 15-min runs were carried out between10:00 and 13:00 when rapid changes in relative humidity of the air were expected tofavour spore release of Botrytis spp. (Jarvis, 1980; Lorbeer, 1966). Trapped conidiaof Botrytis spp. were counted on one rod per run separately for conidia < 15 µm,most probably belonging to B. cinerea, and > 15 µm, most probably belonging to B.squamosa. The concentration of conidia m-3 of air was calculated according to theformula provided by the manufacturer.
Leaf spots. In both experiments, ten randomly chosen plants per plot were sam-pled weekly from the end of June until harvest. Lesions were counted on all green

70 Biological control of Botrytis spp. with Ulocladium atrum
leaf parts and the surface of green leaf parts was measured with a Delta-T Areameasurement System (Delta-T Devices LTD., Burwell, Cambridge, UK). Thenumber of lesions cm-2 of green leaf surface was calculated per plot.
Statistics. Data on spore load m-3 of air and log10-transformed numbers of leafspots cm-2 of green leaf surface were analysed separately per assessment date byANOVA followed by LSD tests ( = 0.05).
2.2.5.3 Experiments in cyclamen under commercial growing conditionsDevelopment of a biocontrol system with U. atrum and G. roseumPlants. Cyclamen plants (C. persicum) cv Super Serie from four lines with differentflower colour (wine red, lilac, pink, white with red heart) were used in all experi-ments. This cultivar has a characteristically compact growth resulting in a verydense canopy. Plants were seeded in trays with soil plugs and transferred into indi-vidual 8-cm pots containing a commercial potting soil (‘Lentse’ special cyclamenmixture, Lent, the Netherlands) about ten weeks after sowing (three-leaf stage). Forabout six weeks the plants were held on trays. Subsequently, they were placed ontables with mats at wider spacing and spacing was increased further after about sixweeks on the tables in order to avoid touching of leaves of different plants. Flow-ering plants were considered marketable about 30 weeks after sowing when theyhave 50 to 55 leaves. In the first experiment, treatments were initiated with 19-week old plants three weeks after the plants were placed on the tables. In the sec-ond experiment, treatments were initiated with 16-week old plants still on the trays.
Growing conditions. Experiments were conducted in a 3000 m2 commercialgreenhouse at Twello, the Netherlands, in which cyclamen and several other orna-mental crops were produced. Minimum temperatures were set at 14 °C during theday and 16 °C during the night. Relative humidity was set at 80%. On warm orrainy days, temperature or relative humidity may exceed the set values due to insuf-ficient capacity of climate control by ventilation and screening.
Treatments. In the first experiment four treatments were arranged in a random-ised complete block design with each treatment replicated four times. Two blockswere located on each of two opposite tables. In the second experiment, all blockswere located on the same table. There were no buffers between treatments. In thefirst experiment, each replicate started with 63 plants placed in nine rows each withseven plants of which the central 25 plants were assessed for disease development.In the second experiment, five treatments were arranged in a randomised completeblock design with each treatment replicated four times. Each replication consistedof 24 plants in four rows each with six plants. Plants were numbered to allow dis-ease assessments in time for each individual plant. In both experiments, plants

Materials and Methods 71
within each block belonged to the same lines with the same flower colour butflower colours between blocks differed.Treatments consisted of spraying the cyclamen plants with tap water containing0.01% of Tween 80; the fungicide programme as applied by the grower in hiscommercial growing system (described below); conidial suspension of G. roseum;and conidial suspension of U. atrum. In the second experiment, the fifth treatmentconsisted of spraying conidial suspensions of U. atrum with increased time intervalsbetween applications.In the first experiment, the water control and the conidial suspensions were appliedfive times when plants were 133, 153, 174, 189, and 205 days old. The fungicideprogramme consisted of five applications of three different fungicides sprayed inthe alternation: Euparen M (1 g l-1; tolylfluanid at 500 g a.i. kg-1); Sporgon (1 g l-1;prochloraz-manganese at 450 g a.i. l-1); Euparen M; Sporgon; and Rovral Aquaflo(2 ml l-1; iprodione at 500 g a.i. l-1) when plants were 112, 133, 153, 174, and 200days old. Vertimec (0.5 ml l-1; abamectin at 18 g a.i. l-1) was sprayed three timesduring the experiment for thrips and mite control when plants were approximately120, 160, and 200 days old.In the second experiment, the water control and the conidial suspensions wereapplied nine times when plants were 109, 130, 151, 166, 179, 193, 207, 221, and 236days old. In the fifth treatment, U. atrum was applied only five times on plants thatwere 109, 151, 179, 207, 236 days old. During the second experiment, the fungicideprogramme consisted of five applications of four different fungicides sprayed inthe alternation: Daconil (1 ml l-1; chlorothalonil at 500 g a.i. l-1); Euparen M; Spor-gon; Rovral Aquaflo; and Rovral Aquaflo when plants were 84, 106, 130, 160, and225 days old. Control of thrips, mites and Lepidoptera larvae was achieved by ap-plying Vertimec (abamectin), Aseptacarex (0.7 ml l-1; pyridaben at 157 g l-1), Mesu-rol (1 ml l-1 methiocarb at 500 g l-1), Vydate (3 ml l-1; oxamyl at 100 g l-1 ) and LuxanPermethrin (0.4 ml l-1; permethrin at 250 g l-1) in alternation at intervals of ap-proximately 40 days.Because commercial crops were growing in the greenhouse, heavily infested plantswere removed from the experiments to lower the inoculum density when plantswere 205 (experiment 1) and 336 days old (experiment 2), respectively.
Application technique. Water and conidial suspensions were applied with a pro-pane-operated sprayer (AZO, Ede, the Netherlands) at 250 kPa. Fungicides wereapplied with a motor operated sprayer (EP55, Empas, Veenendaal, the Nether-lands) at 400 kPa. During spraying, a polystyrene shield was placed around eachtreatment to prevent drift to neighbouring plants. Each plant was sprayed individu-ally until run-off. At the beginning of the experiments, plant canopies were open sothat all leaf surfaces, petioles and the tuber could easily be reached. Later, whenplant canopies became dense, plants were sprayed on the canopy but the spraynozzle also was put inside the canopy of each individual plant so as to reach plantsurfaces shielded under the dense canopy such as surfaces of older leaves, petioles

72 Biological control of Botrytis spp. with Ulocladium atrum
and the tuber. Treatment of individual plants is the standard method of fungicideapplications.
Assessments. In both experiments, disease was assessed on each day that the an-tagonists were applied, and a final assessment was made two weeks after the lastantagonist application when plants were 219 (experiment 1) and 248 (experiment 2)days old, respectively.The following parameters were assessed non-destructively in the greenhouse foreach plant at each assessment date. The proportion of the area (ranging from > 0to 1 at intervals of 0.1) covered with conidiophores of the pathogen was estimatedseparately for each leaf blade and petiole with sporulation of B. cinerea. Becauseareas with conidiophores of B. cinerea varied from sparse to complete (maximaldensity) coverage, the intensity of sporulation of B. cinerea also was estimated foreach single area with sporulating B. cinerea, using a relative scale from > 0 to 1(sparse sporulation to complete coverage with conidiophores) at intervals of 0.1.The area of leaf blades and the length of petioles were not recorded.The following parameters were calculated from the data obtained: the percentageof plants with symptoms of B. cinerea (disease incidence), the number of petiolesper plant with symptoms of B. cinerea (disease severity), the estimated equivalentnumber of leaf blades with B. cinerea sporulation (spore producing leaf area, SPLA),the estimated equivalent number of leaf blades with B. cinerea sporulation correctedfor sporulation intensity (spore producing leaf area corrected for intensity,SPLACI), the estimated equivalent number of petioles with B. cinerea sporulation(spore producing petiole area, SPPA), and the estimated equivalent number ofpetioles with B. cinerea sporulation corrected for sporulation intensity (spore pro-ducing petiole area corrected for intensity, SPPACI). Because the size of assessedleaves was not measured, areas with sporulation of B. cinerea were not expressed intheir absolute size but SPLA and SPLACI represent the equivalent number of leafblade surfaces per plant fully covered with sporulation. The formula used for cal-culation were:
where:i = number of plant, i = 1 … nmi = number of diseased leaves of plant ipij = proportion of jth leaf blade of plant i covered by conidiophores of B. cinereawij = weight (o < wij 1) for intensity of sporulation of B. cinerea on the ijth leaf
blade
n
pw
SPLACI
n
i
m
j
ijij
i
��= == 1 1
)2(n
p
SPLA
n
i
m
j
ij
i
��= == 1 1
)1(

Materials and Methods 73
Data on B. cinerea sporulation on petioles were produced in the same way. For sta-tistical analysis, the mean values of the assessed parameters for the 25 plants perplot (experiment 1) or the 24 plants per plot (experiment 2) were used.
Biocontrol with U. atrum in different cropping systemsPlants. Cyclamen were seeded in trays with soil plugs, and transferred at an age ofapproximately ten weeks into individual pots containing commercial potting soil.Plants were 77 to 168 days old at the beginning of the experiments. At that stage,the oldest leaves were beginning to senesce and plants were almost free fromsymptoms of B. cinerea. Only plants in greenhouse 3 had exceptionally high num-bers of necrotic leaves (approximately 0.5 per plant) and symptoms of B. cinereawere found on approximately 25% of the plants.
Growing conditions. Ten experiments were carried out in six different commer-cial greenhouses located in western and central Netherlands. In all greenhouses theminimum day temperature was set at approximately 14 °C and the minimum nighttemperature at approximately 16 °C as usual in the Dutch cyclamen productionsystem.The growing systems in the different greenhouses differed considerably in the ar-rangement of plants, irrigation system, heating system and the type of material usedfor pots. In all greenhouses plants were irrigated two to three times per week.During the experiments, the spacing of the plants was increased to avoid touchingof leaves of different plants except for plants in greenhouse 6 where the spacingwas not increased during the last 50 days of the experiments. Under these condi-tions, leaves of neighbouring plants touched each other and formed a dense canopylayer. Plants with the first flowers open were considered marketable except forplants in greenhouse 3 where first flowers were removed and plants were left in thegreenhouse for an additional 30 days.
Treatments. In most experiments, five treatments were arranged in a randomisedcomplete block design, with each treatment replicated four times. Each replicationof a treatment consisted of 24 plants arranged in three or four rows. Betweentreatments, one untreated row of plants served as a buffer. The treatments con-sisted of spraying the plants with: (1) tap water containing 0.01% Tween 80, (2) thefungicide programme as applied by the grower in his commercial growing system,(3) inoculation with conidial suspensions of U. atrum twice (at the beginning of theexperiment and approximately 28 days later), (4) inoculation with conidial suspen-sions of U. atrum at intervals of approximately 28 days from the beginning of theexperiment until approximately 28 days before plants were marketable, and (5)untreated plants which served as controls. No fungicide treatments were made ingreenhouses 1 and 4 and in one of the two experiments in greenhouse 5. In thesecases, data of untreated plants that had been planned for fungicide treatments arenot presented. In the experiment in greenhouse 1, the two different spraying

74 Biological control of Botrytis spp. with Ulocladium atrum
strategies of the antagonist did not differ since the plants were marketable withineight weeks after the beginning of the experiment. In this case, data of the U. atrumapplication at four-week intervals are not presented.Fungicides applied by different growers were Euparen M (1 g l-1, tolylfluanid at500 g a.i. kg-1); Daconil M (1 g l-1, chlorothalonil at 250 g a.i. kg-1 and maneb at500 g a.i. kg-1); Rovral (1 ml l-1, iprodione at 500 g a.i. l-1) or Sumico (1 g l-1, carben-dazim at 250 g a.i. kg-1 and diethofencarb at 250 g a.i. kg-1). In greenhouse 6 threeexperiments were carried out each with a different cultivar. Plants were 126 daysold at the beginning of the experiment and were marketable with 254 days. U. atrumwas applied at a plant age of 126 and 150 days or of 126, 150, 177, 206 and 233days. Tween 80-water was applied at a plant age of 126, 150, 177, 206 and 233 days.Chlorothalonil and mancozeb (as Daconil M with 1 g l-1) was applied at a plant ageof 143 and 168 days, iprodion (as Rovral with 1 g l-1) at a plant age of 190 and 240days.
Application technique. Water and antagonist suspensions were applied with apropane-operated sprayer (AZO, Ede, the Netherlands) at 250 kPa. Fungicideswere applied with motor-operated sprayers by the different growers. Duringspraying, frames with polyethylene were placed around each treatment to preventdrift to neighbouring plants. The canopy of the individual plants was sprayed untilrun-off. Later, when the canopy of plants became very dense, the spray nozzle wasalso placed inside the canopy to reach all surfaces of leaves, petioles and the tuberwith the suspension. Growers also use this technique for fungicide applications.
Assessments. In each experiment, disease was assessed on days when U. atrum wasapplied and a final assessment was made approximately 28 days after the last treat-ment, when plants were marketable. The numbers of leaves or flower petioles withsporulation of B. cinerea were recorded for each plant. From these data the percent-age of plants with disease symptoms of B. cinerea (disease incidence, DI) and thenumber of diseased leaves and flower petioles per plant (disease severity, DS) wascalculated.
Statistics. Linear logistic regression was employed to explain the percentage ofdiseased plants (DI) in response to the classifying variable: replicate and treatment.Log-linear regression models with the same classifying variables were fitted to thedata on the number of diseased leaves and flower petioles per plant (DS). Overalleffects of replicate and treatment were assessed using F-tests for the ratio of themean deviance for the particular effect and the mean residual deviance. In case F-tests were significant (P < 0.05), treatment means on the logit or log-scale wereseparated by two sided t-tests (P < 0.05), corresponding to LSD tests for normallydistributed data. Area under disease progress curves (AUDPC) for DI and DS wereanalysed by ANOVA.

Materials and Methods 75
2.2.5.4 Experiments in Pelargonium
Stock plants of Pelargonium zonale cv Springtime Irene were grown in a greenhouseat the Research Station for Floriculture and Glasshouse Vegetables (PBG), theNetherlands. In autumn, when they reached the size required for reproduction, agroup of 35 to 40 potted stock plants was placed in each of twelve individualgreenhouse compartments with temperature set at 18 °C. Light was supplementedwhenever natural illumination was too low (< 150 W m-2). Relative humidity variedbetween 55 and 95%. Treatments varied between compartments and consisted offortnightly spraying with (1) water with 0.01% Tween 80 (control), (2) Euparen M(a.i. 50% tolylfluanide), and (3) U. atrum (conidial suspension of 1 x 10⁶ conidia ml-1
in water with 0.01% Tween 80). Each of the two experiments lasted for about 14weeks. The treatments were randomised within four blocks, each consisting ofthree individual greenhouse compartments. Stock plants were sprayed until run-off.Every second week, the day after spray treatments, about two cuttings per stockplant were harvested. According to horticultural practice they were left on thegreenhouse bench for 24 hrs and subsequently planted in trays with soil. In a firstexperiment, autumn/winter 1996/1997, half of the cuttings from plants in eachcompartment were left in a tray in that compartment. A tray with the other half wasput in one big compartment at 18/16 °C (day/night) together with cuttings origi-nating from the other compartments. In the second experiment in 1997/1998, allcuttings were collected together in one greenhouse compartment.
Assessments. The stock plants were visually assessed every second week for num-bers of necrotic leaves and presence of sporulation of B. cinerea on leaves. This wasmade a semi-quantitative assessment (B. cinerea severity on necrotic leaves) by esti-mating the equivalent number of leaves (blades and petioles) with B. cinerea sporu-lation corrected for sporulation intensity (spore producing leaf area corrected forintensity; SPLACI; see 2.2.5.3; Köhl et al., 1998). Cuttings were visually assessedfor presence of B. cinerea and killing by this pathogen at two, four and six weeksafter planting.
Aerial spore load. Spore samplers according to Kerssies (1990) were placed ineach compartment, four plates in a vertical position at 20 cm above the crop (firstexperiment) or six in a horizontal position at crop level (second experiment). Thismethod of spore sampling is based on capturing B. cinerea on petri dishes with aselective medium. The medium, as defined by Kerssies (1990), was composed of(in g l–1 distilled water): NaNO3, 1.0; K2HPO4, 1.2; MgSO4
.7H2O, 0.2; KCl, 0.15;glucose, 20.0 and agar 25.0. After sterilisation the selective chemical substanceswere added (g l-1): quintozene, 0.011; maneb, 0.01; chloramphenicol, 0.05; CuSO4,2.2; fenarimol 0.1 (ml l-1); tannic acid, 5.0. The pH was adjusted to pH 4.5 with 5.0M NaOH. Fortnightly, sets of plates were left open for periods of 24 h. After incu-bation of the dishes in the dark at 20 °C for two weeks B. cinerea can be distin-guished as dark colonies, whereas only few other fungi succeed to grow. Numbers

76 Biological control of Botrytis spp. with Ulocladium atrum
of B. cinerea colonies per petri dish were counted and means per compartment usedfor analysis.
Quantification of spore production by B. cinerea. Sporulation of B. cinerea wasquantified by sampling five random stock plants per compartment every monthjust before spraying. Five young green leaves were collected per plant, which couldbe expected not to have been in contact with the last U. atrum or fungicide spray.The five sampled leaves were put in 250-ml erlenmeyer flasks and washed in150 ml 0.05% Tween 80 by shaking for 10 min on a flask shaker (Stuart ScientificSF1, Britain) at high speed (150 strokes min-1). The liquid contents of five flasksfrom one compartment were combined and passed through a cellulose nitrate filterwith 5 µm pore size. The conidia of B. cinerea were counted on the filter under themicroscope (200 x) after staining with diluted cotton blue. All the necrotic leaves ofthe same five plants were carefully collected in a bottle with 20% alcohol and0.01% Tween 80 in water, about 15 ml per five leaves, trying to prevent detach-ment of fungal spores during collection as much as possible. The bottles with liquidand necrotic leaves were shaken for 10 min. The number of conidia in the liquidwere assessed by counting with a haemocytometer. In the first experiment, theliquid was filtered through a paper filter, and the weight of dead tissue determinedafter drying of the filter plus debris to allow calculation of spore number per gramdry weight of necrotic leaves. In the second experiment, the surface area of ne-crotic and green leaves was estimated by transforming scored leaf diameter to sur-face by means of a grading line based on the measurement of diameter and surfaceof 90 leaves as measured by means of an electronic surface measuring device(Delta-T device, Cambridge, Britain). The numbers of conidia were calculated persurface area by means of the surface measured as described. The sampled plantswere put back between the others to minimise the effect of sampling on the micro-climate, but they were excluded from further use for cuttings or assessments.
Statistics. Data were analysed by ANOVA. Time series of observations, mostlyfortnightly, were considered as sub-plots. However, when too many zero valueswere scored, the week was excluded from the analysis. To stabilise variance figureswere log-transformed except for the data on spore load in the air which were ana-lysed after square root transformation, and percentage data which were analysedafter angular transformation. Back-transformed data were represented in the fig-ures. Whenever treatment * week interactions were significant, significant differ-ences between treatments at a given date are based on LSD values ( = 0.05) andindicated by different letters following the week number in the figures. Whentreatment effect was significant, but the interaction treatment * week was not, theaverage for the weeks considered was added to the graphs.

Materials and Methods 77
2.2.5.5 Experiments in pot rosesTwo experiments were conducted with pot roses cv Moonlight. Pot roses are pro-duced from cuttings at high temperature in well-illuminated greenhouses. Cuttingsroot in damp greenhouses at 25 °C within ten days. Subsequently they are trans-ferred to less humid conditions. First pruning takes place at the age of three weeks,and is followed by fungicide application to control grey mould. Mildew is con-trolled by vaporising sulphur during 4 h per day. The second pruning is three weeksafter the first, and is followed by a fungicide treatment if conditions are favourablefor grey mould, e.g. during short days in winter. Twelve-week old plants are readyfor sale, with some flowers open.
Treatments. The first pruning of the first experiment took place on 15 December1997, the second on 6 January 1998. Treatments were on 16 December and 8 Janu-ary. Assessment dates were 6 January before pruning and 12 February. Each treat-ment consisted of 28 pots with four cuttings each and in four replicates. Thetreatments were: (1) control, non-treated; (2) control, sprayed with water plus0.01% Tween 80; (3) U. atrum sprayed to run-off with 1 x 10⁶ conidia ml-1 in waterplus 0.01% Tween 80; (4) carbendazim sprayed at a concentration of 1 ml (50%a.i.) l-1 on day 1 after the first pruning only.The second experiment was carried out with the same cultivar and the same num-bers of pots per treatment as the first. The treatments were: (1) control, water plus0.01% Tween 80; (2) U. atrum sprayed to run-off with 1 x 10⁶ conidia ml-1 in waterplus 0.01% Tween 80; (3) Teldor (fenhexamide) at 1 g (50% a.i.) l-1; (4) Teldor at10% of recommended dose (= 0.1 g l-1); (5) Teldor at 0.1 g l-1 in mixture with U.atrum 106 conidia ml-1. Treatments were performed on 11 November 1998, oneweek after the first pruning and 24 November, one day after pruning. Assessmentswere made on 19 November and 5 January 1999, and they were conducted as indi-cated above.
Assessments. The first assessment consisted of counting the number of foci of B.cinerea per pot. The pathogen was sporulating on leaf residues on the soil of the potas well as on senescing leaves still attached to the stem of the plant. At the secondassessment a layer of dead leaves covered the soil of the pots. The percentage ofthe leaf residue area covered with sporulating B. cinerea and the intensity of sporula-tion (scale 0 to 10) were assessed. The product of these values was divided by 10 togive a sporulation index (0 to 100). The number of cuttings killed by B. cinerea wascounted. Data were analysed by analysis of variance followed by an LSD test forcomparison of means.

78 Biological control of Botrytis spp. with Ulocladium atrum

3 Results

Results 81
3.1 Role of necrotic tissues in Botrytis epidemics
3.1.1 Botrytis leaf spot in onion
Incidence of Botrytis spp. After introducing sclerotia of B. squamosa into the fieldon 23 April 1991, weather was dry for two weeks. No sporulation of B. squamosawas found on the introduced sclerotia and many of the sclerotia were attacked bycollembola (e.g. Sminthurus spp.). After 21 days, no sclerotia could be recovered.Thus, it can be assumed that most infections of Botrytis spp. during the field ex-periment were caused by naturally occurring inoculum. The appearance of lesionscaused by B. cinerea or B. squamosa is rather similar and does not allow a conclusionon the pathogen involved. A majority of conidia of Botrytis spp. found on dead leaftips during the growing season or collected with Rotorods at all trapping periodswas smaller than 15 µm, most probably belonging to B. cinerea. Overall, only 12.7%of the trapped conidia were larger than 15 µm and conformed to the size of thoseof B. squamosa. B. cinerea was isolated from a large number of lesions of onionleaves, sampled regularly during the field experiment, whereas B. squamosa wasnever isolated.The sugar beet buffer crop was inspected visually at regular intervals for sporula-tion of Botrytis spp. Leaves of sugar beets remained healthy during the experiment,only a small amount of necrotic leaf tissue was found in the sugar beet crop.Sporulation of Botrytis spp. was never observed.
Spore load. From the beginning of August 1991 onwards, sporulation of Botrytisspp. was abundant on necrotic leaf tips after periods with persistent dew. In ex-perimental plots where approximately 60% of the necrotic tissue had been re-moved (Fig. 1), the spore load of conidia of Botrytis spp. was generally lower than inthe control (Fig. 2). Concentrations of airborne spores of B. cinerea in the controlplots and the plots where necrotic tissue had been removed differed significantly(P < 0.05) on 12 and on 16 August 1991. On these dates the average concentrationof B. cinerea conidia above plots from which necrotic tissue was removed was 50%less than that above the control plots. Treatments with G. roseum did not signifi-cantly affect the spore load of B. cinerea.The spore load above the buffer crop, between the plots, at a distance of 6 m fromthe nearest onions, was on average 55% of the spore load above the onion crop. Ata distance of 18 m from the onions, the spore load was 40% of the spore loadabove the onion crop.
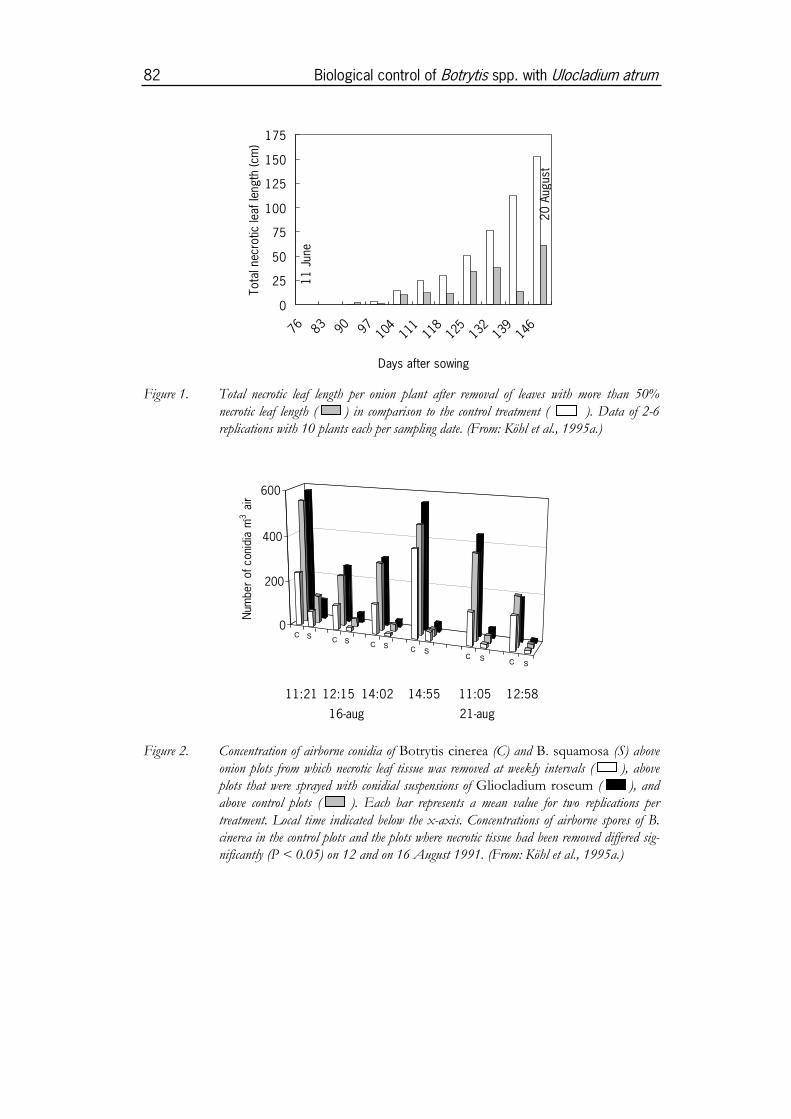
82 Biological control of Botrytis spp. with Ulocladium atrum
0
25
50
75
100
125
150
175
76 83 90 97 104
111
118
125
132
139
146
Days after sowing
Tota
l nec
rotic
leaf
leng
th (c
m)
11 J
une
20 A
u gus
t
Figure 1. Total necrotic leaf length per onion plant after removal of leaves with more than 50%necrotic leaf length ( ) in comparison to the control treatment ( ). Data of 2-6replications with 10 plants each per sampling date. (From: Köhl et al., 1995a.)
C SC S
C SC S
C SC S
0
200
400
600
Num
ber
of c
onid
ia m
-3 a
ir
11:21 12:15 14:02 14:55 11:05 12:58
16-aug 21-aug
Figure 2. Concentration of airborne conidia of Botrytis cinerea (C) and B. squamosa (S) aboveonion plots from which necrotic leaf tissue was removed at weekly intervals ( ), aboveplots that were sprayed with conidial suspensions of Gliocladium roseum ( ), andabove control plots ( ). Each bar represents a mean value for two replications pertreatment. Local time indicated below the x-axis. Concentrations of airborne spores of B.cinerea in the control plots and the plots where necrotic tissue had been removed differed sig-nificantly (P < 0.05) on 12 and on 16 August 1991. (From: Köhl et al., 1995a.)

Results 83
Leaf lesions. A few Botrytis lesions were observed in the first two weeks of June1991 but no differences were found among the treatments. Until the middle of July1991, the weather was dry and warm without dew formation during nights andepidemics of Botrytis did not progress. Thereafter, rainy weather and dew formationduring nights favoured the development of onion leaf spot and the number oflesions increased exponentially (Fig. 3). The initial densities did not differ signifi-cantly among treatments, but the relative growth rate (RGR) for the plots wherenecrotic leaf tissue had been removed was significantly smaller (P < 0.05) than forthe control and antagonist treatment. Since block differences were not significant,the block effect was pooled with the residual effects. At the last sampling date on20 August 1991, the number of lesions cm-2 of green leaves was 1.1 in the control,1.1 in the antagonist treatment and 0.6 in the plots where necrotic leaf tissue hadbeen removed. Treatment with G. roseum had no effect on the amount of necroticleaf tissue.
0
0.3
0.6
0.9
1.2
100 110 120 130 140 150
Days after sowing
Num
ber
of le
sion
s cm
-2
9 Ju
ly
20 A
ugus
t
Figure 3. Number of leaf lesions caused by Botrytis spp. on green onion leaves in plots from whichnecrotic leaf tissue was removed at weekly intervals ( ), in plots sprayed with Glio-cladium roseum ( ), and in control plots ( ). Means of 2-6 replicationswith 10 plants each per sampling date; curves were fitted with exponential growth modely = exp (a + b * t). Relative growth rate (parameter b) for plots from which dead leaf tis-sue was removed was significantly different (P < 0.05) from plots treated with G. roseumand control plots. (From: Köhl et al., 1995a.)

84 Biological control of Botrytis spp. with Ulocladium atrum
3.1.2 Botrytis grey mould in annual strawberries
Conidial load in the air during flowering. The average number of conidia m-3 ofair was always below 25 (Table 1). In only one of the 39 runs the concentration ofconidia was higher than 100 m-3 air. A higher spore load of B. cinerea inside the un-treated strawberry plots as compared to outside the plots was found on 10 of 16days, a proportion of 0.63. This proportion is not significantly different from theexpected value of 0.50, given its large 95% confidence interval (0.35, 0.85). Differ-ences between spore loads inside and outside the strawberry plots were generallyless than 10 conidia m-3 of air. No significant differences between spore loads in-side untreated plots, inside sanitation plots, and outside the strawberry plots werefound in any of the experiments. Daily average and daily peak values of the sporeload in the air inside untreated plots as estimated from Rotorod samples, were notcorrelated with the potential spore production of B. cinerea on necrotic leaves, cal-culated with equation 7 of Sosa-Alvarez et al. (1995) as explained in the Materialsand Methods section (2.2.1.2).
Substrate availability and inoculum production of B. cinerea. The incidenceof B. cinerea on cold-stored transplants was 26.7% (experiment 5) and 52.6%
Table 1. Estimated air load of conidia of Botrytis cinerea as determined by Rotorod samplingduring flowering in plots with annual strawberries at Wageningen, the Netherlands. (From:Boff et al., 2001.)
Number of spores m-3 of air per run yExperiment x
Control z Outside z Sanitation z
3 (1997)
5 (1998)
6 (1998)
7 (1999)
19.5
8.8
23.8
6.3
10.4
7.0
4.7
10.2
-
8.3
7.4
-
x Rotorod sampling was not conducted in experiment 1.y Means of 5, 12, 10, and 12 runs, in experiments 3, 5, 6, and 7, respectively; paired t-tests on
log-transformed numbers of spores per run did not show significant differences (P > 0.05) inmean air load of conidia between the different sampling locations for any experiment.
z Control = inside untreated strawberry plots; Outside = outside strawberry plots, Rotorods werelocated 25 m (1997) or 50 m (1998, 1999) from strawberry plots; Sanitation = inside straw-berry plots where all dead leaves were removed.

Results 85
(experiment 6) on dead leaves, and 29% (experiment 5) and 32.2% (experiment 6)on stolons. The incidence of B. cinerea on senescent leaves was 30.3% (experiment5) and 75% (experiment 6). The area with potential sporulation of B. cinerea on deadleaves was 3.5% and 15.6% for experiments 5 and 6, respectively.The dynamics of necrotic strawberry leaf tissue showed similarity among experi-ments 2, 3 and 8 and among experiments 5 and 6. In experiments 2, 3 (1997) and 8(1999) the amount of necrotic leaf tissue increased steadily after transplanting butwas below 25 cm² per plant until the beginning of flowering, then increased furtherduring flowering. This trend was not observed in experiments 5 and 6 (1998) inwhich more necrotic leaf tissue was found during the first three to four weeks aftertransplanting, whereas the presence of necrotic tissue was lower at flowering. Thenecrotic leaf area with potential sporulation of B. cinerea followed the same dynam-ics as the total area of necrotic leaf tissue in experiments 3 and 4 but not in experi-ments 2 and 6. The largest area with potential sporulation of B. cinerea per plant(15.5 cm²) was found in experiment 5, 14 days after transplanting. In relation tostrawberry phenology, the area with potential sporulation of B. cinerea reached itsmaximum when the first flower appeared in experiments 2 and 5, at the middle offlowering in experiment 3, and at transplanting time in experiment 6. Among thedates of flower sampling, the total necrotic leaf area per plant varied from 16.5 to137.9 cm², and the leaf area per plant with potential sporulation of B. cinerea rangedfrom 0.7 to 15.4 cm² (interpolated values, Table 2).
Flower colonisation. The incidence of B. cinerea on flowers varied in the five ex-periments from 5.1% (experiment 2, sample 1, 1997) to 96% (experiment 3, sample2, 1998) (Table 2). The incidence of B. cinerea on flowers increased during the sea-son in all experiments except in experiment 6. No significant correlation was foundbetween the incidence of B. cinerea on flowers and the total area of necrotic leaftissue (rs = 0.04, df = 10, P > 0.05), the area of necrotic leaf tissue with potentialsporulation of B. cinerea (rs = 0.43, df = 8, P > 0.05), or the percentage area withpotential sporulation of B. cinerea on necrotic tissue (rs = 0.45, df = 8, P > 0.05), atthe time of sampling of flowers. The sum of precipitation (rain + irrigation) over aperiod of five days before sampling of flowers was highly variable among samplingdates, ranging from 4.5 to 127.5 mm (Table 2). However, the incidence of B. cinereaon flowers was not positively correlated with this or other climatic variables, suchas cumulative precipitation (rs = –0.57 to –0.08, df = 10) or daily leaf wetness dura-tion (rs = –0.58 to –0.85, df = 10), during 2, 3, 4, 5, 7, 10, or 14 days before sam-pling of flowers. There was no positive correlation between the predicted levels ofspore production of B. cinerea on necrotic leaves and the incidence of B. cinerea onflowers, calculated either over seven days (rs = –0.50, df = 8) or five days (rs =–0.72, df = 8) before sampling of flowers (Table 2).

86 Biological control of Botrytis spp. with Ulocladium atrum
Table 2. Incidence of flower colonisation by Botrytis cinerea, cumulative precipitation over the fivedays preceding sampling of flowers, total area of necrotic leaf tissue, area of necrotic leaf tis-sue with potential sporulation at the date of flower sampling and predicted number of co-nidia z on necrotic tissue per plant calculated over a period of five days before sampling offlowers of untreated strawberry plots, at Wageningen, the Netherlands. (From: Boff et al.,2001.)
Exp
erim
ent
Sam
plin
g dat
e
Inci
den
ce o
f B
otry
tis
on
flo
wer
s (%
)
Cum
ula
tive
pre
cip
itat
ion
,–
5 to
0 d
ays
(mm
)
To
tal n
ecro
tic
leaf
tiss
ue
per
pla
nt
(cm
2 )
Nec
roti
c le
af t
issu
e p
erp
lan
t w
ith
po
ten
tial
spo
rula
tio
n (
cm2 )
Pre
dic
ted
num
ber
of
con
idia
of
B. c
iner
ea p
erp
lan
tz
22
33
555
666
88
11 Jun 199717 Jun 1997
29 Jul 19974 Aug 1997
8 Jun 199815 Jun 1998
2 Jul 1998
21 Jul 19985 Aug 1998
11 Aug 1998
6 Jun 19999 Jun 1999
5.114.9
76.296.0
63.770.081.3
83.775.060.1
60.265.2
89.592.0
11.08.0
127.540.592.0
4.546.5
109.0
35.524.5
86.3108.0
123.6137.9
49.230.126.1
48.016.519.2
88.097.1
1.91.7
4.114.5
16.58.74.9
3.70.80.7
--
25792629
16211
4192231
23656
2490
88131
--
z Calculated with equation 7 of Sosa-Alvarez et al. (1995.)
Grey mould. Fruit rot at harvest ranged from 1.4% (experiment 3) up to 11.3%(experiment 6), and post-harvest grey mould ranged from 2.1 to 32.6% (Table 3,average values per experiment). Post-harvest fruit rot was typically greater thanfruit rot at harvest and no correlation was found between these two variables(rs = 0.0, P > 0.05). Fruit rot at harvest was significantly correlated with daily aver-age precipitation during the harvest period (rs = 0.9, P < 0.05), but post-harvestfruit rot was not (rs = 0.1, P > 0.05). The incidence of B. cinerea on flowers wasbetter correlated with post-harvest grey mould (rs = 0.6, P > 0.05) than with greymould at harvest (rs = –0.1, P > 0.05), but neither of the correlations were signifi-

Results 87
cant. The area with sporulation of B. cinerea on petals, assessed in three experi-ments, was significantly correlated with post-harvest fruit rot (rs = 1.0, P < 0.05),but not with fruit rot at harvest (Table 3). A significant correlation between thepercentage of fruit rot observed in subsequent harvests in the field and the level offruit rot predicted with the model of Bulger et al. (1987) was found in one experi-ment (experiment 3, rs = 0.71, P < 0.05), but never for post-harvest fruit rot.In experiments 5 and 6, treatments were carried out in separate plots in which ne-crotic tissues were removed season-long regularly twice per week (see 3.5.1). In nocase, this sanitation resulted in a reduction of the incidence of grey mould at har-vest or after subsequent incubation.
Table 3. Grey mould at harvest (HaRot), post-harvest grey mould (PoRot), % area with potentialsporulation of Botrytis cinerea on necrotic leaves (LPS), Botrytis incidence on flowers(FBI), % area with potential sporulation of B. cinerea on petals (Petal), average dailyprecipitation during flowering and average daily precipitation during harvesting of straw-berry untreated plots of five experiments at Wageningen, the Netherlands. (From: Boff etal., 2001.)
Average dailyprecipitation (mm) at
Experi-ment
HaRot(%) v
PoRot(%) v
LPS(%) w
FBI(%) x
Petal(%) y
Flowering z Harvest z
2 (1997)
3 (1997)
5 (1998)
6 (1998)
8 (1999)
9.5
1.4
10.1
11.3
11.2
13.1
26.9
10.4
32.6
2.1
9.4
5.6
22.4
9.5
-
9.9
86.1
71.7
72.9
62.7
-
-
20.3
29.4
5.8
9.6
2.0
14.6
9.9
12.5
5.5
3.0
6.2
11.3
5.6
v Average of 10 (exp. 2), 5 (exp. 3), 10 (exp. 5), 8 (exp. 5), and 5 (exp. 8) samples.w Average of 6 (exp. 2), 4 (exp. 3), 3 (exp. 5), and 3 (exp. 6) samples.x Average of 2 (exp. 2), 2 (exp. 3), 3 (exp. 5), 3 (exp. 6), and 2 (exp. 8) samples.y Average of 3 (exp. 5), 4 (exp. 6), and 5 (exp. 8) samples.z Period of flowering was 14 May to 23 June, 16 July to 5 August, 31 May to 9 July, 8 July to 13
August, and 16 May to 17 June and period of harvesting was 16 June to 17 July, 11 August to 25August, 2 July to 3 August, 13 August to 7 September, and 18 June to 12 July in experiments 2, 3, 5,6, and 8, respectively.

88 Biological control of Botrytis spp. with Ulocladium atrum
3.1.3 Botrytis grey mould in cyclamen
Numbers of green leaves per plant increased linearly from 31 to 52 during experi-ment 1. Senescing and necrotic petioles and leaf laminae first appeared about 157days after sowing (Table 4). Sporulation of B. cinerea was typically first found onleaves dead due to senescence.At the last assessment dates, 1.7 and 2.7 leaves per plant showed symptoms of B.cinerea in the untreated control of experiment 1 and 2, respectively. Regular removalof senescing, symptomless leaves significantly reduced disease severity to 0.2 and0.5 leaves per plant showing symptoms of B. cinerea, respectively. U. atrum applica-tions carried out in an additional treatment reduced AUDPC values but less effec-tively than removal of senescing leaves (Table 5). When B. cinerea was present in thecrop from the start of experiment 1, reduction of the AUDPC values by U. atrumwas marginal.
Table 4. Total number of leaves and senescing and necrotic leaf parts in untreated plots of cyclamengreenhouse experiment 1. In brackets the number of plant parts with sporulating Botrytiscinerea. Means in the table are based on counts in four replicate plots containing 25plants each. (From: Kessel et al., 2001.)
Senescing plant parts z Necrotic plant parts zPlant age(days)
Leaves perplant
Laminae Petioles Laminae Petioles
157 30.7 0.6 (0.0) 0.1 (0.0) 0.5 (0.1) 0.4 (0.2)171 39.3 1.0 (0.0) 0.5 (0.1) 2.2 (1.1) 1.1 (0.6)183 44.1 1.1 (0.0) 0.6 (0.0) 2.5 (1.1) 1.4 (0.5)197 45.4 1.0 (0.0) 0.6 (0.1) 3.0 (1.2) 1.9 (0.7)213 51.6 0.8 (0.0) 0.2 (0.1) 3.4 (1.8) 2.3 (1.7)
z Per plant.
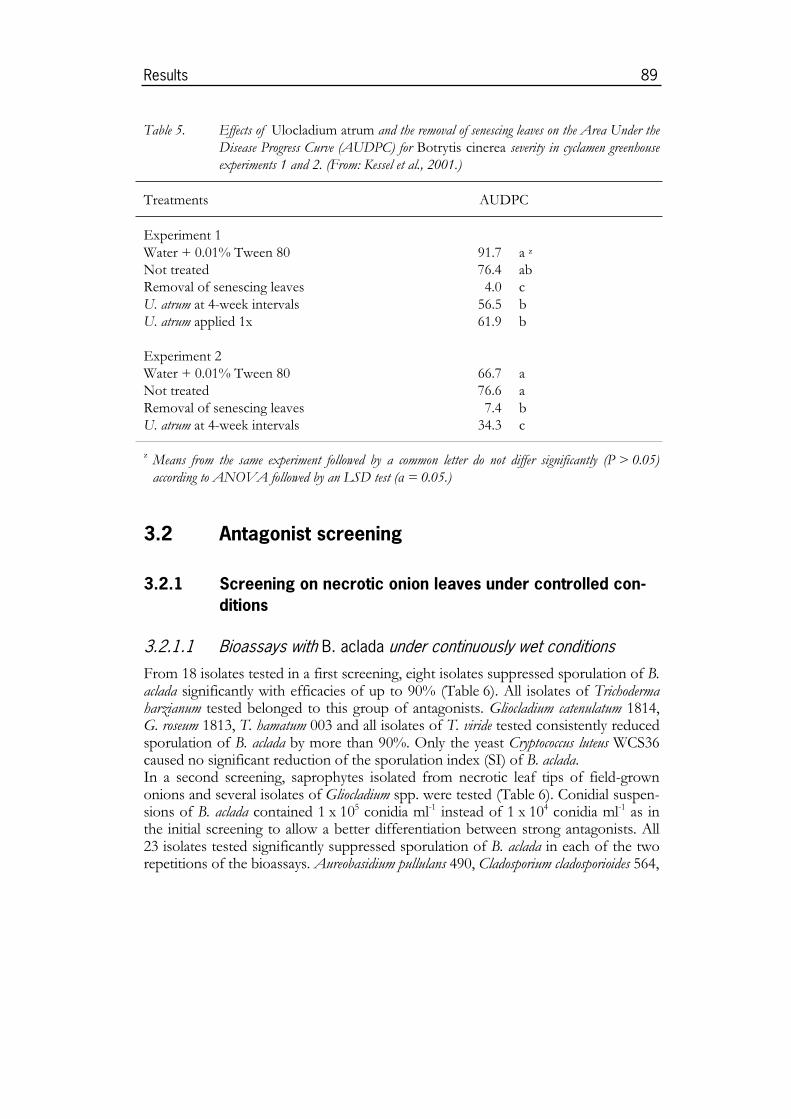
Results 89
Table 5. Effects of Ulocladium atrum and the removal of senescing leaves on the Area Under theDisease Progress Curve (AUDPC) for Botrytis cinerea severity in cyclamen greenhouseexperiments 1 and 2. (From: Kessel et al., 2001.)
Treatments AUDPC
Experiment 1Water + 0.01% Tween 80 91.7 a z
Not treated 76.4 abRemoval of senescing leaves 4.0 cU. atrum at 4-week intervals 56.5 bU. atrum applied 1x 61.9 b
Experiment 2Water + 0.01% Tween 80 66.7 aNot treated 76.6 aRemoval of senescing leaves 7.4 bU. atrum at 4-week intervals 34.3 c
z Means from the same experiment followed by a common letter do not differ significantly (P > 0.05)according to ANOVA followed by an LSD test ( = 0.05.)
3.2 Antagonist screening
3.2.1 Screening on necrotic onion leaves under controlled con-
ditions
3.2.1.1 Bioassays with B. aclada under continuously wet conditionsFrom 18 isolates tested in a first screening, eight isolates suppressed sporulation of B.aclada significantly with efficacies of up to 90% (Table 6). All isolates of Trichodermaharzianum tested belonged to this group of antagonists. Gliocladium catenulatum 1814,G. roseum 1813, T. hamatum 003 and all isolates of T. viride tested consistently reducedsporulation of B. aclada by more than 90%. Only the yeast Cryptococcus luteus WCS36caused no significant reduction of the sporulation index (SI) of B. aclada.In a second screening, saprophytes isolated from necrotic leaf tips of field-grownonions and several isolates of Gliocladium spp. were tested (Table 6). Conidial suspen-sions of B. aclada contained 1 x 10⁵ conidia ml-1 instead of 1 x 10⁴ conidia ml-1 as inthe initial screening to allow a better differentiation between strong antagonists. All23 isolates tested significantly suppressed sporulation of B. aclada in each of the tworepetitions of the bioassays. Aureobasidium pullulans 490, Cladosporium cladosporioides 564,

90 Biological control of Botrytis spp. with Ulocladium atrum
Table 6. Comparative suppression of sporulation of Botrytis aclada by antagonists on dead seg-ments of onion leaves in bioassays under continuously moist conditions. (From: Köhl et al.,1995c.)
Reduction ofsporulationindex w
First screening x Second screening y
Not signifi-cant z
Cryptococcus luteus WCS36
< 90% z Gliocladium nigrovirens 1815Trichoderma hamatum T166T. harzianum 39, T000, 022, T154Penicillium sp. 023, 025
Aureobasidium pullulans 490Cladosporium cladosporioides 564C. herbarum 593P. hirsutum 211P. spinulosum 201Trichothecium roseum 706Verticillium nigrescens 250
> 90% z G. catenulatum 1814G. roseum 1813T. hamatum 003T. viride T004, T048, T122, T141,T218, T226
Alternaria infectoria 264, 270A. alternata 317Arthrinium sp. 242A. phaeospermum 243, 244Chaetomium globosum 256C. herbarum 571, 587G. catenulatum 162G. roseum 1813, 160, 161P. brevicompactum 221Sesquicillium candelabrum 249Ulocladium atrum 385
w Antagonists were sprayed with 106 spores ml-1 24 h after application of B. aclada. Leaves were incu-bated for eight days at 18 °C. Sporulation of B. aclada was scored using classes 0-5, representing, re-spectively, 0%, 1-5%, >5-25%, >25-50%, >50-75%, and >75-100% of the leaf area covered withconidiophores of B. aclada and a sporulation index (SI) was calculated (SI = (0 x n0
+ 5 x n1 + 25 x n2 + 50 x n3 + 75 x n4 + 100 x n5 ) / 4).x B. aclada sprayed with 104 conidia ml-1.y B. aclada sprayed with 105 conidia ml-1.z Compared to control treatment by LSD test ( = 0.05).

Results 91
G. roseum 248, Penicillium hirsutum 211, P. spinulosum 201, Trichothecium roseum 706 andVerticillium nigrescens 250 showed reduced SI's for up to 90%. Isolates of Alternariaspp., Arthrinium spp., Chaetomium globosum, C. herbarum, P. brevicompactum, Sesquicilliumcandelabrum and Ulocladium atrum consistently suppressed sporulation of B. aclada bymore than 90%. Strongest antagonism was expressed by four out of five isolates ofGliocladium spp., which gave a complete inhibition of B. aclada. Additionally, severalisolates were tested in single bioassays (data not presented). Four isolates of Alternariaalternata and one of each of G. roseum, U. chartarum and U. consortiale (Thüm.) Simmonssuppressed sporulation of B. aclada by more than 90%, whereas one isolate of C.herbarum and two of U. chartarum caused reductions of less than 90%.
3.2.1.2 Bioassays with B. aclada with an interrupted leaf wetness periodIn the five experiments, interruption of the leaf wetness period had no consistenteffect on SI of B. aclada of water control treatments where only B. aclada had beenapplied (Table 7 and 8). When the leaf wetness period had been interrupted repeat-edly, SI was lower compared to incubation under continuously moist conditions inexperiment 1 and 2, but not in experiment 3 and 4.Dry periods interrupting humid conditions had a differential effect on antagonists.A. alternata 300, 317 and 319, C. globosum 256, U. atrum 385 and U. chartarum 380suppressed sporulation of B. aclada almost completely under continuously wet con-ditions and when wetness periods were interrupted 16, 40, or 64 h after applicationof antagonists. These antagonists were still highly suppressive when wetness peri-ods were interrupted on up to three consecutive days. A. pullulans 490 showed highefficacies against B. aclada when leaf wetness periods had been interrupted. In con-trast, A. pullulans 490 did not consistently suppress sporulation of B. aclada by morethan 90% on leaves that were incubated under continuously wet conditions. Theseresults were consistent with results obtained with this antagonist in preliminarybioassays (Table 6).On the other hand, G. roseum 1813, G. catenulatum 162 and S. candelabrum 249, allhighly efficient under continuously wet conditions, were distinctly less efficientwhen leaf wetness periods were interrupted 16 h after the antagonists were applied.Under these conditions, G. roseum 1813, G. roseum 162, T. harzianum 39 and S. can-delabrum 249 reduced the SI of B. aclada by 48%, 51%, 72% and 36% (mean valuesof two repeated experiments), respectively, compared to the SI value of the controltreatment that was sprayed with B. aclada only and subjected to a dry period after 16h. Interruption of wetness after 40 h reduced efficacy of the antagonists less thanan interruption after 16 h. When wetness was interrupted after 64 h, both isolatesof Gliocladium spp. completely suppressed sporulation of B. aclada, as under con-tinuously wet conditions, but the efficacy of S. candelabrum 249 was reduced. Ar-thrinium sp. 242 and A. phaeospermum 243 also showed sensitivity to an interruptedleaf wetness period. The effect of an interrupted leaf wetness period on C.

92 Biological control of Botrytis spp. with Ulocladium atrum
Table 7. Effect of antagonists on sporulation of Botrytis aclada on dead segments of onion leavesafter interruption of leaf wetness. (From: Köhl et al., 1995c.)
Treatment y Sporulation index (SI) z for B. acladaTime of wetness interruption (h after antagonist applied)
0 16 40 64 16 and40
16, 40,and 60
Experiment 1Water 91 78 79 78 59 45A. alternata 319 0 0 0 0 0 0Arthrinium sp. 242 0 4 0 0 1 7C. globosum 256 0 0 0 0 0 0G. roseum 1813 0 42 12 0 45 30
Experiment 2Water 79 58 69 89 37 45A. pullulans 490 8 1 2 1 1 1G. catenulatum 162 0 30 18 0 31 27S. candelabrum 249 0 50 34 19 29 43U. chartarum 380 0 0 1 0 0 0
Experiment 3Water 44 59 54 33 48 56A. phaeospermum 243 5 15 3 1 20 20G. roseum 1813 0 42 15 2 33 33T. harzianum 39 0 22 7 1 31 24U. atrum 385 0 0 0 0 0 0
Experiment 4Water 37 47 56 45 43 50A. alternata 300 0 0 0 0 0 0A. alternata 317 0 0 0 0 0 0C. herbarum 571 0 0 0 2 0 0G. roseum 1813 0 24 11 0 10 21
y B. aclada had been sprayed with 1 x 10⁵ conidia ml-1 24 h before antagonists were sprayed with1 x 106 spores ml-1. Leaves were incubated for eight days at 18 °C.
z See Table 6. LSD ( = 0.05) for experiment 1 to 4 were 16.4, 14.5, 11.5 and 9.8, respectively.Treatments without sporulation of B. aclada have been excluded from analysis of variance.
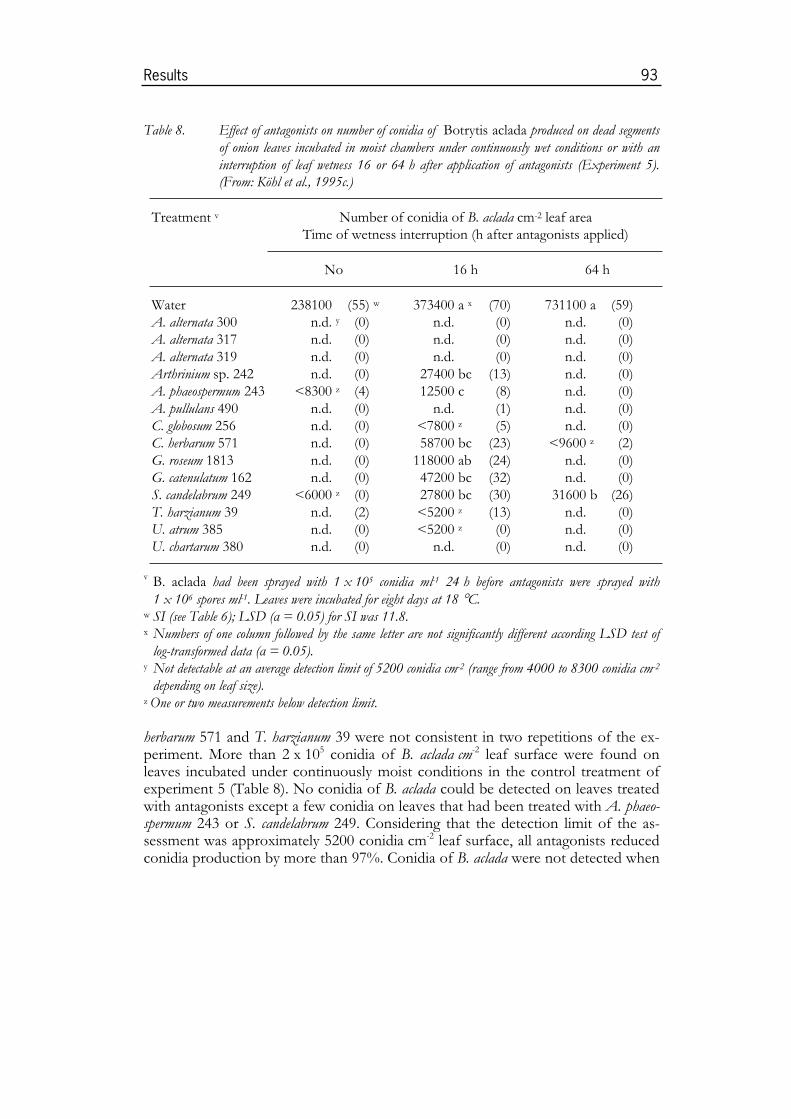
Results 93
Table 8. Effect of antagonists on number of conidia of Botrytis aclada produced on dead segmentsof onion leaves incubated in moist chambers under continuously wet conditions or with aninterruption of leaf wetness 16 or 64 h after application of antagonists (Experiment 5).(From: Köhl et al., 1995c.)
Treatment v Number of conidia of B. aclada cm-2 leaf areaTime of wetness interruption (h after antagonists applied)
No 16 h 64 h
Water 238100 (55) w 373400 a x (70) 731100 a (59)A. alternata 300 n.d. y (0) n.d. (0) n.d. (0)A. alternata 317 n.d. (0) n.d. (0) n.d. (0)A. alternata 319 n.d. (0) n.d. (0) n.d. (0)Arthrinium sp. 242 n.d. (0) 27400 bc (13) n.d. (0)A. phaeospermum 243 <8300 z (4) 12500 c (8) n.d. (0)A. pullulans 490 n.d. (0) n.d. (1) n.d. (0)C. globosum 256 n.d. (0) <7800 z (5) n.d. (0)C. herbarum 571 n.d. (0) 58700 bc (23) <9600 z (2)G. roseum 1813 n.d. (0) 118000 ab (24) n.d. (0)G. catenulatum 162 n.d. (0) 47200 bc (32) n.d. (0)S. candelabrum 249 <6000 z (0) 27800 bc (30) 31600 b (26)T. harzianum 39 n.d. (2) <5200 z (13) n.d. (0)U. atrum 385 n.d. (0) <5200 z (0) n.d. (0)U. chartarum 380 n.d. (0) n.d. (0) n.d. (0)
v B. aclada had been sprayed with 1 x 10⁵ conidia ml-1 24 h before antagonists were sprayed with
1 x 10⁶ spores ml-1. Leaves were incubated for eight days at 18 °C.w SI (see Table 6); LSD ( = 0.05) for SI was 11.8.x Numbers of one column followed by the same letter are not significantly different according LSD test of
log-transformed data ( = 0.05).y Not detectable at an average detection limit of 5200 conidia cm-2 (range from 4000 to 8300 conidia cm-2
depending on leaf size).z One or two measurements below detection limit.
herbarum 571 and T. harzianum 39 were not consistent in two repetitions of the ex-periment. More than 2 x 10⁵ conidia of B. aclada cm-2 leaf surface were found onleaves incubated under continuously moist conditions in the control treatment ofexperiment 5 (Table 8). No conidia of B. aclada could be detected on leaves treatedwith antagonists except a few conidia on leaves that had been treated with A. phaeo-spermum 243 or S. candelabrum 249. Considering that the detection limit of the as-sessment was approximately 5200 conidia cm-2 leaf surface, all antagonists reducedconidia production by more than 97%. Conidia of B. aclada were not detected when

94 Biological control of Botrytis spp. with Ulocladium atrum
leaf wetness periods were interrupted 16 h after A. alternata 300, 317 and 319, A.pullulans 490 and U. chartarum 380 were applied. Thus, considering the detectionlimit, each of these antagonists reduced the number of conidia by more than 98%.After treatments with C. globosum 256, T. harzianum 39 and U. atrum 385 only a fewconidia of B. aclada were found in one or two replications. On leaves treated withArthrinium sp. 242, A. phaeospermum 243, C. herbarum 571, G. catenulatum 162 or S.candelabrum 249 between 1.2 x 10⁴ and 6 x 10⁴ conidia of B. aclada were producedcm-2 leaf surface. These antagonists significantly reduced conidial production by 84to 97%. Only G. roseum 1813 did not reduce conidial production significantly.When the wetness period was interrupted 64 h after antagonists were applied, co-nidia production was reduced for more than 99%, so that no conidia could be de-tected, by all antagonists except C. herbarum 571, where a few conidia could befound, and S. candelabrum 249, where 3 x 10⁴ conidia cm-2 leaf surface were countedcompared to 7 x 10⁵ conidia cm-2 leaf surface in the control treatment.A close correlation was found between the log-transformed numbers of conidia ofB. aclada produced on dead onion leaves (5200 conidia cm-2 leaf surface as the aver-age detection limit were considered when no conidia were found) and SI’s calcu-lated from the estimated leaf area covered with conidiophores of B. aclada (Fig. 4).
3
4
5
6
7
0 20 40 60 80 100
Sporulation Index (SI)
Log 1
0-num
ber
of c
onid
ia c
m-2
Figure 4. Relationship between sporulation indexes (SI’s) estimated for leaf area of dead onion leafsegments covered with conidiophores of Botrytis aclada (y) and numbers of conidia of B.aclada produced on dead onion leaf segments (x). Number of conidia cm-2 was log-transformed and a density of 5200 conidia cm-2 was considered as the detection limit whenno conidia were recovered (y = 3.730 + 0.028 x; r = 0.915; P < 0.001). (From: Köhlet al., 1995c.)

Results 95
3.2.1.3 Bioassays with B. cinerea with interrupted leaf wetness periodsWhen conidial suspensions of B. cinerea (1 x 10⁵ conidia ml-1) were sprayed to theleaf segments 24 h before the antagonists A. alternata 317 and 319, A. pullulans 490,C. globosum 256, G. catenulatum 162, G. roseum 1813, and U. atrum 385 were applied asin bioassays with B. aclada, SI values were higher than 90 on leaves not treated withantagonists. Antagonists did not reduce SI values significantly (data not shown).When B. cinerea was applied eight hours before the antagonist, antagonists werehighly efficient if B. cinerea had been sprayed with 1 x 10³ conidia ml-1 (Table 9). TheSI value was 63 for leaves not treated with antagonists, but was one or lower forleaves treated with antagonists. When B. cinerea was applied at 1 x 10⁴ conidia ml-1,the SI value was 64 for leaves not treated with antagonists. The antagonists reducedSI values to 5 or lower. At the highest concentration of B. cinerea, 1 x 10⁵ conidiaml-1, C. globosum 256 suppressed sporulation of B. cinerea completely; A. alternata 319and U. atrum 385 reduced sporulation from a SI of 85 in the water treatment to 12and 15, respectively. Treatments with A. alternata 317, G. catenulatum 162 and G.roseum 1813 were only moderately efficient, resulting in SI's between 32 and 53, andA. pullulans 490 showed no antagonistic activity. When wetness was interruptedafter 16 h, both isolates of Gliocladium spp. showed only moderate or no antago-nism at all concentration levels of B. cinerea. C. globosum 256 was also highly
Table 9. Effect of antagonists on sporulation of Botrytis cinerea on dead segments of onion leavesafter interruption of leaf wetness. (From: Köhl et al., 1995c.)
Treatment Sporulation index (SI) for B. cinerea x
Leaf wetness period not inter-rupted
Leaf wetness period interrupted y
103 z 104 105 103 104 105
Water 63 64 85 55 61 53A. alternata 317 0 2 32 0 1 26A. alternata 319 0 1 12 1 3 16A. pullulans 490 0 5 86 0 8 58C. globosum 256 0 0 0 3 14 48G. catenulatum 162 0 4 42 18 64 57G. roseum 016 1 5 53 28 43 42U. atrum 385 0 1 15 0 0 1
x After incubation of leaves for eight days at 18 °C. SI see Table 6. LSD ( = 0.05) for SI was 16.6.y 16 h after application of antagonists.z Concentration of conidial suspension of B. cinerea (conidia ml-1) sprayed 8 h before antagonists were
sprayed with 1 x 10⁶ spores ml-1.
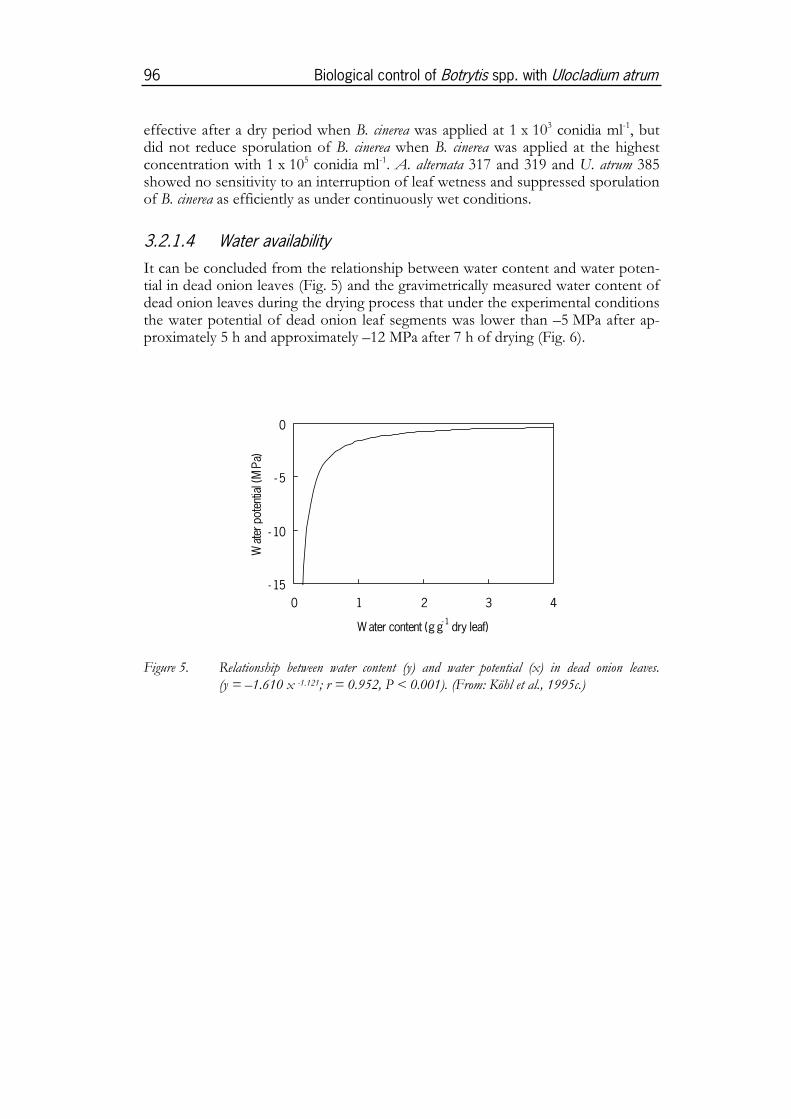
96 Biological control of Botrytis spp. with Ulocladium atrum
effective after a dry period when B. cinerea was applied at 1 x 10³ conidia ml-1, butdid not reduce sporulation of B. cinerea when B. cinerea was applied at the highestconcentration with 1 x 10⁵ conidia ml-1. A. alternata 317 and 319 and U. atrum 385showed no sensitivity to an interruption of leaf wetness and suppressed sporulationof B. cinerea as efficiently as under continuously wet conditions.
3.2.1.4 Water availabilityIt can be concluded from the relationship between water content and water poten-tial in dead onion leaves (Fig. 5) and the gravimetrically measured water content ofdead onion leaves during the drying process that under the experimental conditionsthe water potential of dead onion leaf segments was lower than –5 MPa after ap-proximately 5 h and approximately –12 MPa after 7 h of drying (Fig. 6).
- 15
- 10
- 5
0
0 1 2 3 4
W ater content (g g-1 dry leaf)
Wat
er p
oten
tial (
MPa
)
Figure 5. Relationship between water content (y) and water potential (x) in dead onion leaves.(y = –1.610 x -1.121; r = 0.952, P < 0.001). (From: Köhl et al., 1995c.)
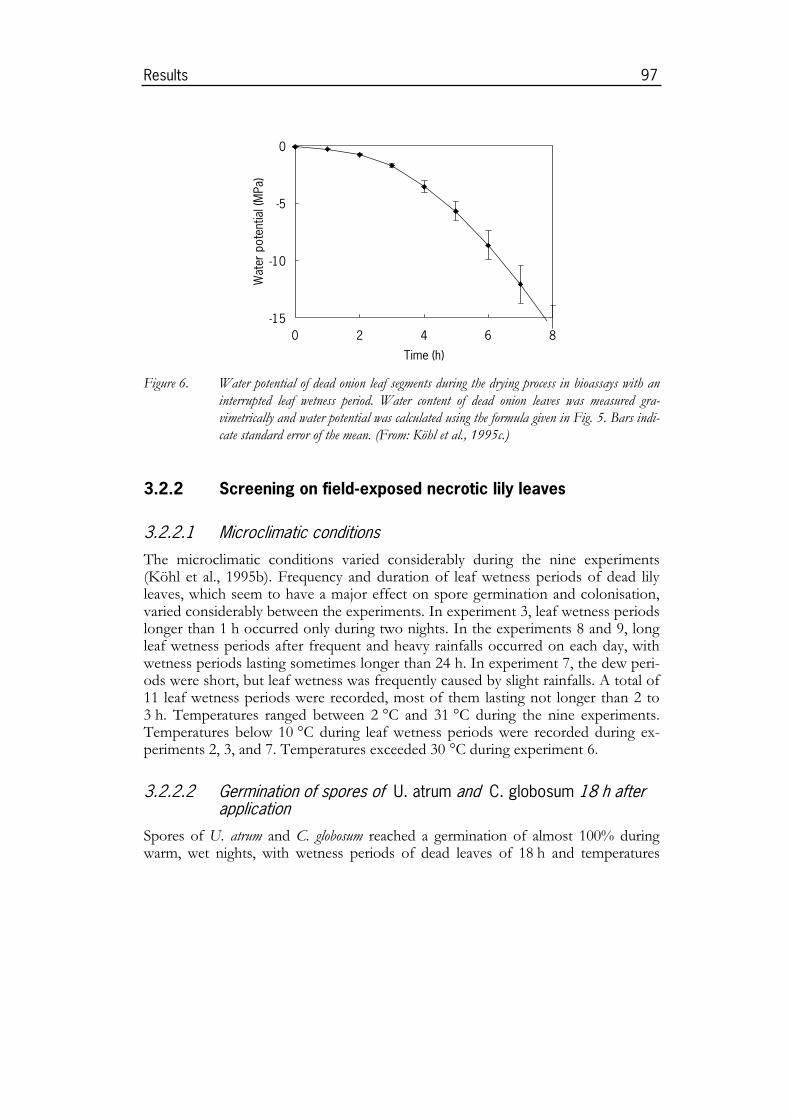
Results 97
-15
-10
-5
0
0 2 4 6 8
Time (h)
Wat
er p
oten
tial (
MPa
)
Figure 6. Water potential of dead onion leaf segments during the drying process in bioassays with aninterrupted leaf wetness period. Water content of dead onion leaves was measured gra-vimetrically and water potential was calculated using the formula given in Fig. 5. Bars indi-cate standard error of the mean. (From: Köhl et al., 1995c.)
3.2.2 Screening on field-exposed necrotic lily leaves
3.2.2.1 Microclimatic conditionsThe microclimatic conditions varied considerably during the nine experiments(Köhl et al., 1995b). Frequency and duration of leaf wetness periods of dead lilyleaves, which seem to have a major effect on spore germination and colonisation,varied considerably between the experiments. In experiment 3, leaf wetness periodslonger than 1 h occurred only during two nights. In the experiments 8 and 9, longleaf wetness periods after frequent and heavy rainfalls occurred on each day, withwetness periods lasting sometimes longer than 24 h. In experiment 7, the dew peri-ods were short, but leaf wetness was frequently caused by slight rainfalls. A total of11 leaf wetness periods were recorded, most of them lasting not longer than 2 to3 h. Temperatures ranged between 2 °C and 31 °C during the nine experiments.Temperatures below 10 °C during leaf wetness periods were recorded during ex-periments 2, 3, and 7. Temperatures exceeded 30 °C during experiment 6.
3.2.2.2 Germination of spores of U. atrum and C. globosum 18 h afterapplication
Spores of U. atrum and C. globosum reached a germination of almost 100% duringwarm, wet nights, with wetness periods of dead leaves of 18 h and temperatures

98 Biological control of Botrytis spp. with Ulocladium atrum
above 10 °C in experiments 2 and 8 (Table 10). Low temperatures during the leafwetness periods in experiments 5 and 7 seemed to hamper spore germination of bothantagonists. Germination of both antagonists was low in experiment 6, although thewetness period lasted 8.5 h and temperatures were moderate. The germination ofspores of U. atrum was consistently higher compared to those of C. globosum. Theaverage germination of U. atrum (61%) was significantly higher compared to sporesof C. globosum (32%; P < 0.001; dates with no germination of one or both antagonistswere excluded from ANOVA). No germination of U. atrum occurred in experiment 3when leaves again dried rapidly after field application of antagonists, and leaves weredry during the following night. Standard deviations for percentage germination onsingle leaves were high unless conditions for germination were optimal as in experi-ments 2 and 8. As germination strongly depends on microclimatic conditions, thehigh variance between leaves probably reflects different wetness periods of singleleaves even within an experimental plot.
3.2.2.3 Substrate colonisation by U. atrum and C. globosum
After five days (experiments 3, 4, 6, 8, and 9) or six days (experiments 1, 2, 5, and7) exposure to field conditions, on the average approximately 800 conidia of U.atrum cm-2 leaf surface could be recovered. More than 50% of the conidia of U.atrum recovered on dead lily leaves germinated in all experiments, except in experi-ment 3 (Table 11). With increasing germination, the number of germ tubesproduced per germinated conidium increased from 1.4 (experiment 3) to 2.6 (ex-periment 9). In all experiments, except in experiments 1, 3 and 7, germ tubes hadbranched so that up to 4.6 hyphal tips (experiment 8) were produced per germi-nated conidium. The overall average of mycelial length produced per germinatedconidium was 108 µm. In general, mycelial growth appeared to depend on the totalduration of leaf wetness, e.g. mycelium length per germinated conidium was 19 µmin experiment 3 with 24.5 h of total leaf wetness duration, and 239 µm in experi-ment 9 with 73.0 h of total leaf wetness duration. However, only 28 µm per germi-nated conidium was produced during 51.5 h of total leaf wetness duration inexperiment 7, when frequent but short leaf wetness periods had occurred.Recovery of ascospores of C. globosum after five to six days was distinctly lower thanfor U. atrum. On average, less than 200 ascospores cm-2 leaf surface were foundexcept in experiment 7, in which approximately 1000 ascospores cm-2 leaf surfacewere recovered. Spores had not germinated in experiments 1, 3, and 7 which wassimilar to the observations after 18 h. Germination less than 10% was found inexperiment 5, 6, and 9 (as after 18 h) but also in experiments 2, 4, and 8 wheregermination rates of 20 to 87% were found after 18 h. On average, 1.2 germ tubesper germinated ascospore with a length of approximately 60 µm had been formed.Branching of germ tubes did not occur.
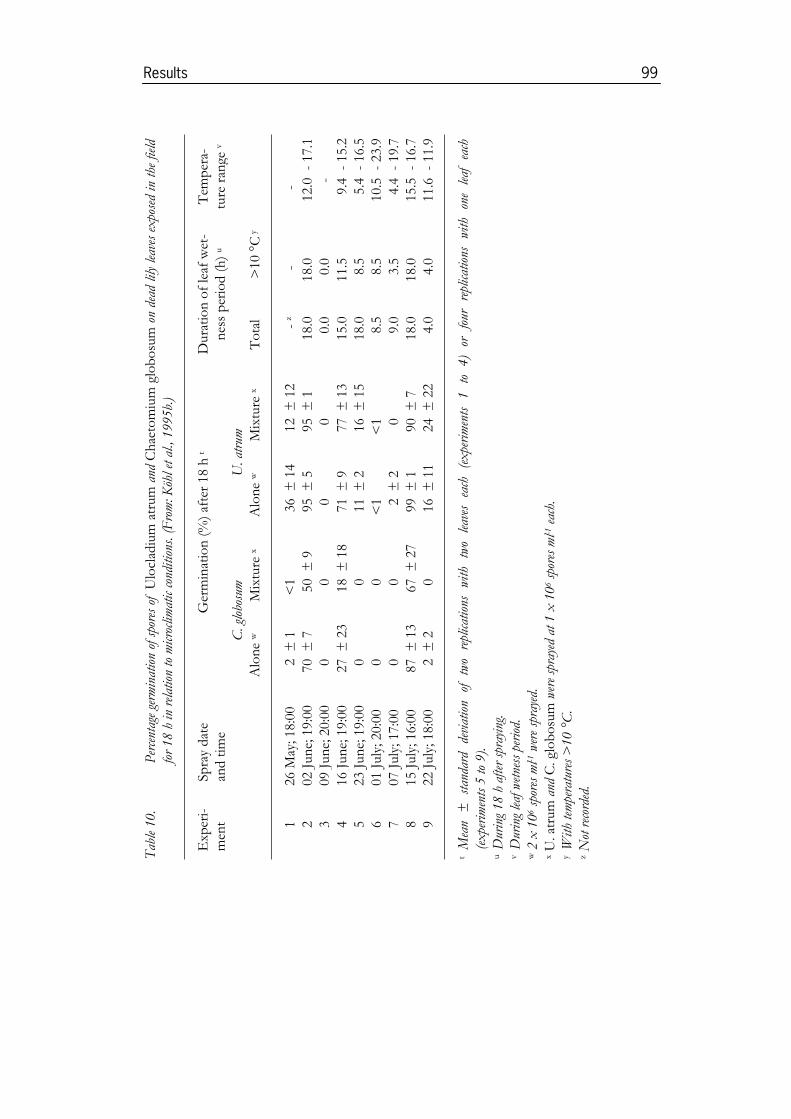
Tab
le 1
0.
Per
cent
age
germ
inat
ion
of s
pore
s of
U
locl
adiu
m a
trum
and
Ch
aeto
miu
m g
lob
osu
m o
n de
ad lily
lea
ves
expo
sed
in t
he fie
ldfo
r 18
h in
rela
tion
to m
icro
clim
atic c
ondi
tion
s. (
Fro
m: K
öhl e
t al
., 19
95b.
)
Exp
eri-
men
tSp
ray
dat
ean
d t
ime
Ger
min
atio
n (
%)
afte
r 18
h t
Dura
tio
n o
f le
af w
et-
nes
s p
erio
d (
h)
u
Tem
per
a-tu
re r
ange
v
C. g
lobo
sum
U. a
trum
Alo
ne
wM
ixtu
re x
Alo
ne
wM
ixtu
re x
To
tal
>10
°C
y
126
May
; 18:
002
± 1
<1
36±
14
12±
12
- z
--
202
Jun
e; 1
9:00
70±
750
± 9
95±
595
± 1
18.0
18.0
12.0
- 17
.13
09 J
un
e; 2
0:00
00
00
0.0
0.0
-4
16 J
un
e; 1
9:00
27±
23
18±
18
71±
977
± 1
315
.011
.59.
4-
15.2
523
Jun
e; 1
9:00
00
11±
216
± 1
518
.08.
55.
4-
16.5
601
July
; 20:
000
0<
1<
18.
58.
510
.5-
23.9
707
July
; 17:
000
02
± 2
09.
03.
54.
4-
19.7
815
July
; 16:
0087
± 1
367
± 2
799
± 1
90±
718
.018
.015
.5-
16.7
922
July
; 18:
002
± 2
016
± 1
124
± 2
24.
04.
011
.6-
11.9
tM
ean
±
stan
dard
de
viat
ion
of
two
repl
icat
ions
w
ith
two
leav
es
each
(e
xpe
rim
ents
1
to
4)
or
four
re
plicat
ions
w
ith
one
leaf
ea
ch(e
xpe
rim
ents
5 to
9).
uD
urin
g 18
h a
fter
spra
ying
.v
Dur
ing
leaf
wet
ness
per
iod.
w2
x 1
06 s
pore
s m
l-1 w
ere
spra
yed.
xU
. atr
um
and
C. g
lob
osu
m w
ere
spra
yed
at 1
x 1
06 s
pore
s m
l-1 e
ach.
yW
ith
tem
pera
ture
s >
10 °
C.
z N
ot r
ecor
ded.
Results 99

100 Biological control of Botrytis spp. with Ulocladium atrum
Table 11. Germination and germ tube growth of conidia of Ulocladium atrum after five days(experiments 3, 4, 6, 8, and 9) or six days (experiments 1, 2, 5, and 7) on dead lilyleaves exposed to field conditions w. (From: Köhl et al., 1995b.)
Experiment Germination (%) x No. of germtubes y, z
No. of hyphaltips y, z
Total myceliallength (µm) y, z
1 64 ± 12 1.7 ± 0.1 1.8 ± 0.2 30 ± 52 93 ± 1 2.0 ± 0.2 2.3 ± 0.2 82 ± 183 20 ± 8 1.4 ± 0.2 1.4 ± 0.2 19 ± 34 83 ± 12 2.5 ± 0.2 2.9 ± 0.4 85 ± 205 63 ± 24 1.8 ± 0.3 2.2 ± 0.4 79 ± 196 97 ± 2 2.3 ± 0.4 3.1 ± 0.4 157 ± 327 64 ± 4 1.7 ± 0.1 1.7 ± 0.1 28 ± 48 84 ± 7 2.2 ± 0.1 4.6 ± 1.8 224 ± 1349 89 ± 7 2.6 ± 0.4 3.9 ± 0.9 239 ± 85
w Conidia of U. atrum were sprayed at 2 x 10⁶ conidia ml-1.x Mean ± standard deviation of two replications with two leaves each (experiments 1 to 4) or four replica-
tions with one leaf each (experiments 5 to 9). Fifty spores were examined on each leaf.y Per germinated conidium.z Mean ± standard deviation of two replications with two leaves each (experiments 1 to 4) or four replica-
tions with one leaf each (experiments 5 to 9). Twenty spores were examined on each leaf.
3.2.2.4 Sporulation potential of Botrytis spp.In all cases in which Botrytis was found sporulating on dead lily leaves after field ex-posure, B. cinerea was identified. B. elliptica, which was heavily sporulating on lily cvMont Blanc in an experimental field approximately 50 m away, or B. squamosa, whichmay have been produced on onions in a field experiment approximately 10 m awayfrom our experiments, were never found on dead lily leaves fixed on leaf holders.Sporulating conidiophores of B. cinerea (sporulation potential) in the water controltreatment covered between 5 and 30% of the leaf area in the nine experiments (Ta-ble 12). This may be explained by the differential effect of varying microclimaticconditions on colonisation and the naturally occurring inoculum load of B. cinerea.U. atrum consistently reduced the sporulation potential of B. cinerea. The reduction ofsporulation of B. cinerea by U. atrum was statistically significant compared to the con-trol treatment in eight out of nine experiments (P < 0.05), which were carried outunder markedly different microclimatic conditions and with probably varying inocu-lum pressure of the pathogen. Even at the highest level of sporulation of B. cinerea inexperiment 4, U. atrum caused a 90% reduction in sporulation potential of the patho-gen. C. globosum significantly reduced sporulation potential of B. cinerea in three ex-periments. The mixture of C. globosum and U. atrum, both antagonists applied in half

Results 101
the concentration of that when sprayed alone, reduced sporulation potential of B.cinerea (statistically significant in five out of nine experiments), except in experiment3. However, effects were mostly less marked compared to those of U. atrum whensprayed alone. G. catenulatum reduced Botrytis sporulation only in experiment 4. A.pullulans never reduced sporulation of Botrytis. Daconil M showed no fungicidal activ-ity against B. cinerea on necrotic tissue of lily leaves.
3.2.2.5 Sporulation potential of Cladosporium-like and Alternaria-likefungi
Cladosporium-like and Alternaria-like fungi were the dominating saprophytic fungisporulating on the leaves (Table 12). U. atrum caused a statistically significant re-duction of the leaf area covered with Cladosporium-like fungi (P < 0.05) compared tothe control treatment in five experiments. No effect of U. atrum was found in thelast two experiments when Cladosporium-like fungi covered less than 10% of the leafsurface. C. globosum gave varying results. In two experiments Cladosporium-like fungiwere significantly (P < 0.05) reduced; in six experiments no effect on Cladosporium-like fungi was found, and in one experiment Cladosporium-like fungi were evenstimulated significantly (P < 0.05) by C. globosum. C. globosum and U. atrum sprayedin mixture affected sporulation of Cladosporium-like fungi in five experiments. G.catenulatum and A. pullulans had no effect on the occurrence of Cladosporium-likefungi, except in experiment 5 in which A. pullulans stimulated Cladosporium-likefungi. Daconil M significantly (P < 0.05) reduced the occurrence of Cladosporium-like fungi in three experiments but not the sporulation of B. cinerea.Treatments with U. atrum, sprayed alone or in mixture with C. globosum, significantly(P < 0.05) increased the occurrence of Alternaria-like fungi (including Ulocladiumand Stemphylium) in all nine experiments. Up to 97% of the surface of dead lilyleaves was covered by conidiophores of this fungal group. Alternaria-like fungi onleaves sprayed with U. atrum had the same colour and conidial characteristics as theapplied isolate of U. atrum, unlike leaves not treated with this antagonist. Treat-ments with the other antagonists or the fungicides did not affect sporulation ofAlternaria-like fungi.

102 Biological control of Botrytis spp. with Ulocladium atrum
Table 12. Effect of antagonists and Daconil M (chlorothalonil and maneb) on sporulation ofBotrytis cinerea, Cladosporium-like fungi and Alternaria-like fungi (includingUlocladium and Stemphylium) on dead lily leaves. Dead lily leaves were exposed tofield conditions for five (experiments 3, 4, 6, 8, and 9) or six days (experiments 1, 2, 5,and 7) and subsequently incubated in a moist chamber at 18 °C for eight days. (From:Köhl et al., 1995b.)
Treatment x Percentage leaf area covered with conidiophores y
B. cinerea Cladosporium-like Alternaria-like
Experiment 1Water 15 a z 49 ab 23 bDaconil M 16 a 45 ab 32 bA. pullulans 25 a 62 a 26 bC. globosum 5 bc 42 ab 32 bG. catenulatum 14 ab 39 ab 22 bU. atrum 2 c 31 b 91 aC. globosum / U. atrum inmixture
6 bc 34 b 75 a
Experiment 2Water 24 b 19 bc 12 bDaconil M 31 ab 29 ab 22 bA. pullulans 32 ab 22 bc 18 bC. globosum 31 ab 48 a 25 bG. catenulatum 45 a 10 c 9 bU. atrum 1 c 0 d 82 aC. globosum / U. atrum inmixture
2 c 0 d 80 a
Experiment 3Water 19 a 52 a 20 cDaconil M 13 a 53 a 36 bcA. pullulans 14 a 50 a 32 bcC. globosum 15 a 5 b 19 cG. catenulatum 17 a 49 a 29 bcU. atrum 1 b 7 b 49 abC. globosum / U. atrum inmixture
17 a 33 a 59 a
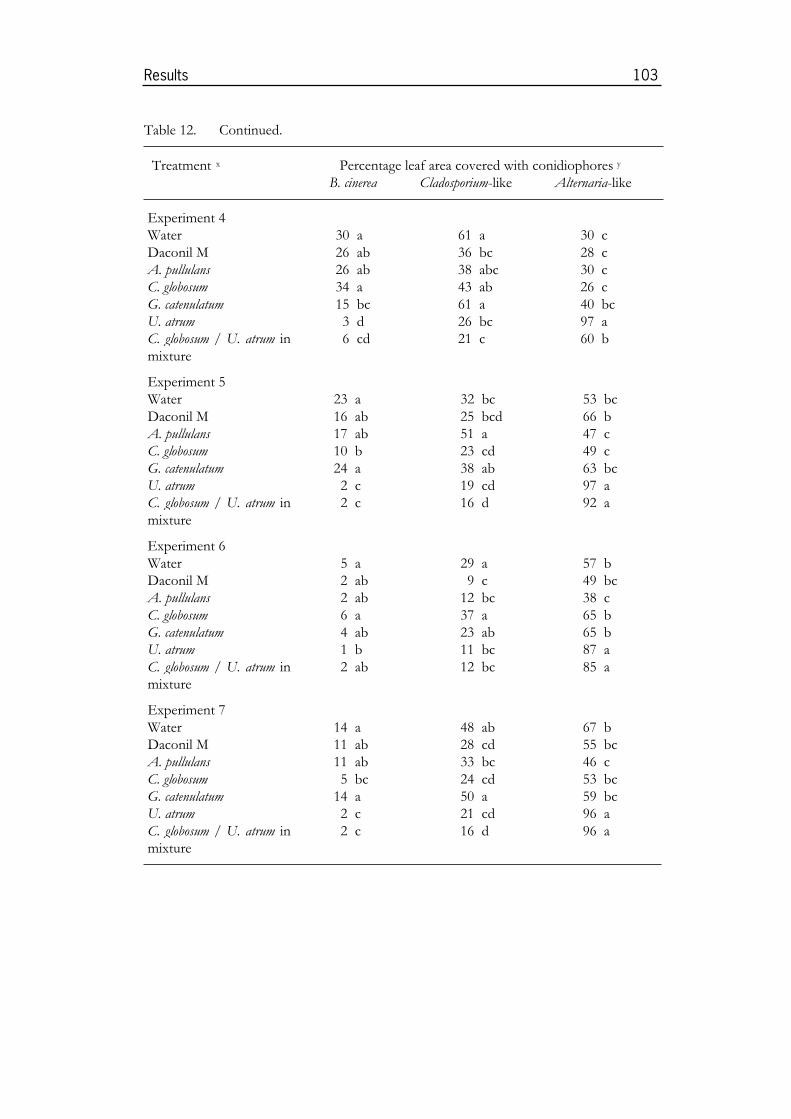
Results 103
Table 12. Continued.
Treatment x Percentage leaf area covered with conidiophores y
B. cinerea Cladosporium-like Alternaria-like
Experiment 4Water 30 a 61 a 30 cDaconil M 26 ab 36 bc 28 cA. pullulans 26 ab 38 abc 30 cC. globosum 34 a 43 ab 26 cG. catenulatum 15 bc 61 a 40 bcU. atrum 3 d 26 bc 97 aC. globosum / U. atrum inmixture
6 cd 21 c 60 b
Experiment 5Water 23 a 32 bc 53 bcDaconil M 16 ab 25 bcd 66 bA. pullulans 17 ab 51 a 47 cC. globosum 10 b 23 cd 49 cG. catenulatum 24 a 38 ab 63 bcU. atrum 2 c 19 cd 97 aC. globosum / U. atrum inmixture
2 c 16 d 92 a
Experiment 6Water 5 a 29 a 57 bDaconil M 2 ab 9 c 49 bcA. pullulans 2 ab 12 bc 38 cC. globosum 6 a 37 a 65 bG. catenulatum 4 ab 23 ab 65 bU. atrum 1 b 11 bc 87 aC. globosum / U. atrum inmixture
2 ab 12 bc 85 a
Experiment 7Water 14 a 48 ab 67 bDaconil M 11 ab 28 cd 55 bcA. pullulans 11 ab 33 bc 46 cC. globosum 5 bc 24 cd 53 bcG. catenulatum 14 a 50 a 59 bcU. atrum 2 c 21 cd 96 aC. globosum / U. atrum inmixture
2 c 16 d 96 a

104 Biological control of Botrytis spp. with Ulocladium atrum
Table 12. Continued.
Treatment x Percentage leaf area covered with conidiophores y
B. cinerea Cladosporium-like Alternaria-like
Experiment 8Water 6 ab 6 a 31 bDaconil M 5 ab 11 a 29 bA. pullulans 1 bc 9 a 19 bC. globosum 7 a 6 a 24 bG. catenulatum 6 a 7 a 30 bU. atrum 1 c 5 a 51 aC. globosum / U. atrum inmixture
3 abc 11 a 50 a
Experiment 9Water 5 ab 7 a 24 bcDaconil M 3 ab 3 a 23 bcA. pullulans 3 ab 7 a 13 cC. globosum 4 ab 5 a 25 bcG. catenulatum 5 a 5 a 29 bU. atrum 1 b 5 a 49 aC. globosum / U. atrum inmixture
3 ab 5 a 47 a
x 2 x 106 spores ml-1 were sprayed. When sprayed in mixture, C. globosum and U. atrum weresprayed at 1 x 10⁶ spores ml-1.
y Mean of two replications (experiments 1 to 4) or four replications (experiments 5 to 9) with five leaveseach. Total percentage of leaf area can be more than 100 when fungal colonies overlapped.
z For each experiment, numbers within a column with a common letter did not differ significantly (LSDtest, = 0.05).
3.2.2.6 Fungal sporulation on dead lily leaves under field conditionsAdditional leaf holders were placed in microplots on 22 June and were sprayedweekly from 23 June onwards with the antagonists or the fungicide. On 16 July,after 24 days exposure to field conditions, almost no conidiophores of B. cinereawere found. Two groups of saprophytes dominated on such leaves (Table 13).Cladosporium-like fungi covered approximately 31 to 46% of the surfaces of leavesof the control or treated with A. pullulans, C. globosum, or G. catenulatum. On leavestreated with Daconil M or U. atrum, significantly less sporulation of Cladosporiumspp. was found with 14 and 13%, respectively. On the other hand, the leaf areacovered with conidiophores of Alternaria-like fungi, including Ulocladium and Stem-phylium, increased from 10% in leaves not treated with U. atrum to above 40% when

Results 105
U. atrum had been sprayed on leaves. Alternaria-like fungi on leaves sprayed with U.atrum had the same colour and the same conidial characteristics as the applied iso-late of U. atrum, unlike leaves not treated with this antagonist.
Table 13. Effect of antagonists and Daconil M (chlorothalonil and maneb) on the percentage area of
dead lily leaves covered with conidiophores of Botrytis cinerea, Alternaria- and Clado-sporium-like saprophytes after 24 days field exposure x. (From: Köhl et al., 1995b.)
Treatment Percentage leaf area covered with conidiophores ofB. cinerea Cladosporium-
likeAlternaria-like y
Water 0 31 ab z 10 bDaconil M 0 14 c 7 bAureobasidium pullulans 0 37 ab 7 bChaetomium globosum 0 41 a 10 bGliocladium catenulatum 0 46 a 11 bUlocladium atrum 0 13 c 44 aC. globosum / U. atrum in mixture 0 24 bc 48 a
x Leaves were treated in four replications with five leaves each with antagonists or fungicide at day 1, 9,
15, and 23 of field exposure.y Including Ulocladium and Stemphylium.z Numbers within a column with a common letter do not differ significantly (LSD test, = 0.05).
3.3 Effect of environmental factors on U. atrum
3.3.1 Effect of temperature on conidial germination and myce-
lial growth of U. atrum in comparison with Gliocladium spp.
3.3.1.1 Air temperature in onion, lily, and cyclamen crops during leafwetness periods
From 5 July to 29 August 1994, 50 wetness events in dead leaves were recorded inboth the onion and the lily crops. The mean duration of leaf wetness periods was4.9 h in onion and 9.7 h in lily. The total sum of hours with leaf wetness during theexperiment was 246 in onion and 484 in lily. Dead leaves were wet for 18% and36% of the total duration of the experiment in the onion and lily canopies,

106 Biological control of Botrytis spp. with Ulocladium atrum
0 5 10 15 20 25 300
25
50
75
100
Sum
of h
dur
ing
LWP
Temperature (°C)
Figure 7. Air temperatures during leaf wetness periods (LWP) of dead leaves in an onion canopy( ) and lily canopy ( ) recorded from 5 July to 29 August 1994 in an experi-mental field at Wageningen, NL. (From: Köhl et al., 1999.)
respectively. Air temperatures ranged between 7.7 and 23.0 °C with a mean of14.8 °C during leaf wetness periods in the onion canopy and between 4.3 and23.8 °C with a mean of 14.5 °C during leaf wetness periods in the lily canopy(Fig. 7). In cyclamen, no leaf wetness periods were recorded but the relative hu-midity (RH) was > 90% for 19% of the total duration of the experiment. Duringsuch periods with > 90% RH, the air temperature within the canopy ranged be-tween 15.8 and 18.5 °C with a mean of 16.8 °C.
3.3.1.2 Conidial germinationThe percentage of conidial germination was greater than 95% for U. atrum duringexperiments on both agar and lily leaves and for G. roseum during the first experi-ment on agar; in the second experiment, only 60% of G. roseum conidia germinated.For the various temperatures, the increase of conidial germination over time wasadequately described by the logistic model. The model accounted for 99.0 and99.3% for the experiments with U. atrum on agar and 98.2% for the experiments onlily leaves. For G. roseum the values were 99.3 and 95.0% for the two experimentson agar. The optimum temperature was between 27 and 33 °C for both fungi in allexperiments (Fig. 8).The speed of germination of U. atrum conidia was the same on water agar and onlily leaves for all temperatures except for one experiment at 3 °C, in which germi-nation on agar was slower. This was most likely due to insufficient temperaturecontrol in the incubator during the experiment.

Results 107
0
24
48
72
96
120
144
0 6 12 18 24 30 36
Temperature (°C)
Tim
e (h
)
Figure 8. Effect of temperature on the time needed for conidia of Ulocladium atrum on water agar( ) and on dead lily leaves ( × ) or of Gliocladium roseum on malt agar( ) to reach a germination percentage of 50%. (From: Köhl et al., 1999.)
On agar and lily leaves, conidia of U. atrum needed 2.6 h at optimum temperatureto reach a germination percentage of 50%. Conidia of G. roseum on agar (first ex-periment) needed 10.0 h to reach this germination percentage. The differences intime needed for conidial germination for the two fungi were larger at low tem-peratures. At 6 °C, 50% of the U. atrum conidia germinated on agar within 18.1 hand on lily leaves within 19.8 h (means of two experiments). The estimated time forG. roseum was 85 h (first experiment).
3.3.1.3 Mycelial growthThe parameters of the fitted Logan-curves show that B. aclada, B. cinerea and B.elliptica had their optimum for mycelial growth at 23.4, 24.6 and 23.8 °C, respec-tively (Fig. 9). The estimated maximum temperature was 30.0 °C for B. cinerea andB. aclada and 32.0 °C for B. elliptica. Mycelial growth of U. atrum was at its optimumat 27.9 °C. The estimated maximum temperature was 35.7 °C. G. roseum 1813 hadits optimum mycelial growth at 28.3 °C and an estimated maximum at 36.0 °C.Results obtained with four other Gliocladium spp. were similar.
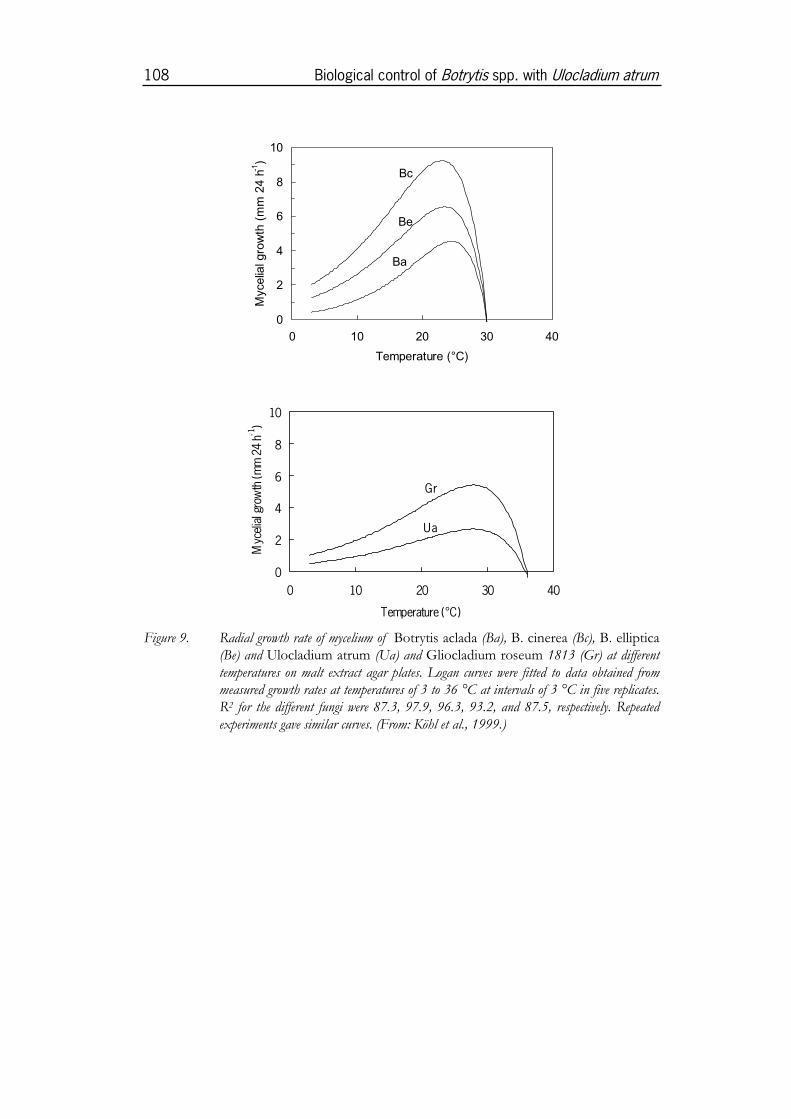
108 Biological control of Botrytis spp. with Ulocladium atrum
0
2
4
6
8
10
0 10 20 30 40
Temperature (°C)
Mycelia
l gro
wth
(m
m 2
4 h
-1)
Ba
Bc
Be
0
2
4
6
8
10
0 10 20 30 40
Temperature (°C)
Myc
elial
grow
th (m
m 2
4 h-1
)
Gr
Ua
Figure 9. Radial growth rate of mycelium of Botrytis aclada (Ba), B. cinerea (Bc), B. elliptica(Be) and Ulocladium atrum (Ua) and Gliocladium roseum 1813 (Gr) at differenttemperatures on malt extract agar plates. Logan curves were fitted to data obtained frommeasured growth rates at temperatures of 3 to 36 °C at intervals of 3 °C in five replicates.R2 for the different fungi were 87.3, 97.9, 96.3, 93.2, and 87.5, respectively. Repeatedexperiments gave similar curves. (From: Köhl et al., 1999.)

Results 109
3.3.2 Effect of water potential on conidial germinationof U. atrum
3.3.2.1 Conidial germination at constant water potentialsConidial germination of U. atrum was observed between –0.28 and –7 MPa(Fig. 10), but no germination was observed within 72 h at –10 and –14 MPa. Gom-pertz curves fitted to the data had values for an adjusted R2 (given as proportion)ranging between 0.76 and 0.98. The initial germination process was slower withdecreasing water potential. The point of inflection M, estimating the time neededto reach 37% of the maximum germination percentage, significantly (P < 0.001)increased with decreasing water potential (Table 14). Conidia needed 6.6 h at–0.28 MPa to reach this point but 24 h at –7 MPa. The speed of germination, asrepresented by the slope parameter B, was affected and significantly (P = 0.003)decreased with decreasing water potential. The estimated maximum germinationpercentage (upper asymptote C) was high for conidia incubated at –0.28 with 91%but significantly (P < 0.001) decreased with decreasing water potential. At –7 MPa,less than half of the maximum germination percentages were found as compared to–0.28 MPa.
0
25
50
75
100
0 24 48 72
Incubation period (h)
Estim
ated
ger
min
atio
n (%
)
-3 MPa
-0.28 MPa -1 MPa
-5 MPa
-7 MPa
Figure 10. Estimated germination percentage of conidia of Ulocladium atrum on water agar slidesat different water potentials (MPa). Gompertz curves were fitted to data obtained from re-peated experiments. For parameter estimates see Table 14. Adjusted R2’s for the differenttreatments ranged between 0.76 and 0.98. (From: Köhl and Molhoek, 2001.)
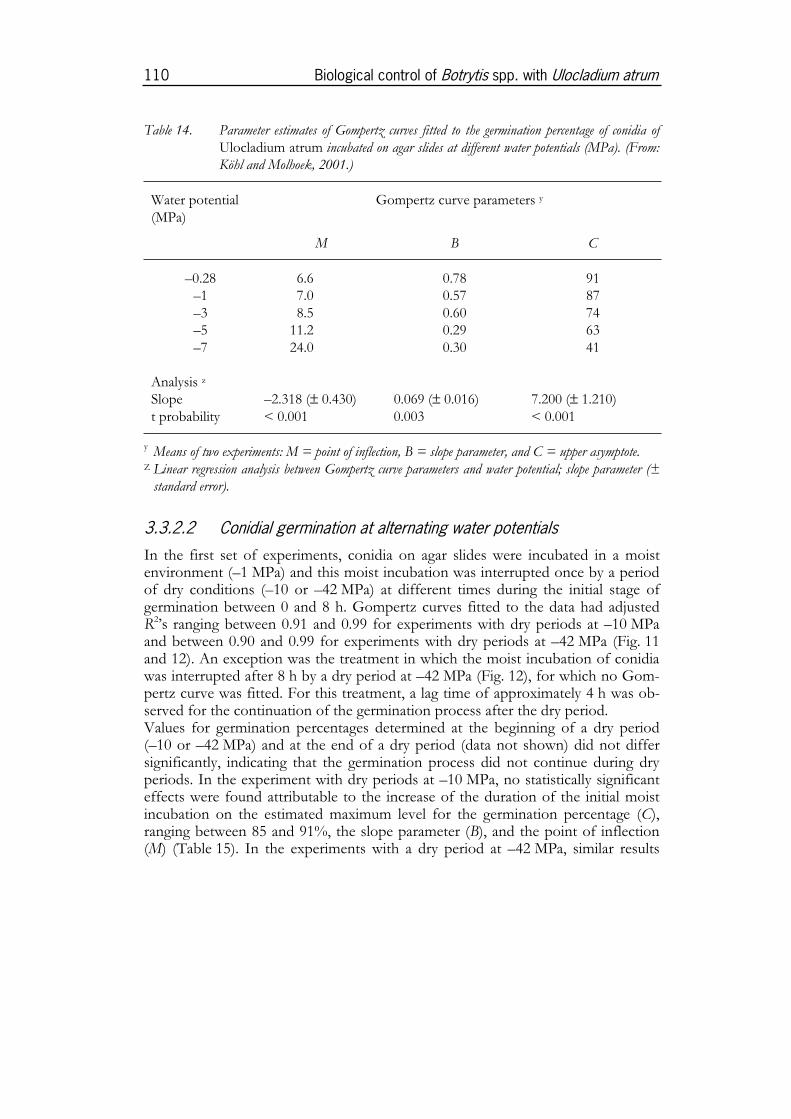
110 Biological control of Botrytis spp. with Ulocladium atrum
Table 14. Parameter estimates of Gompertz curves fitted to the germination percentage of conidia ofUlocladium atrum incubated on agar slides at different water potentials (MPa). (From:Köhl and Molhoek, 2001.)
Water potential(MPa)
Gompertz curve parameters y
M B C
–0.28 6.6 0.78 91–1 7.0 0.57 87–3 8.5 0.60 74–5 11.2 0.29 63–7 24.0 0.30 41
Analysis z
Slope –2.318 (± 0.430) 0.069 (± 0.016) 7.200 (± 1.210)t probability < 0.001 0.003 < 0.001
y Means of two experiments: M = point of inflection, B = slope parameter, and C = upper asymptote.Z Linear regression analysis between Gompertz curve parameters and water potential; slope parameter (±
standard error).
3.3.2.2 Conidial germination at alternating water potentialsIn the first set of experiments, conidia on agar slides were incubated in a moistenvironment (–1 MPa) and this moist incubation was interrupted once by a periodof dry conditions (–10 or –42 MPa) at different times during the initial stage ofgermination between 0 and 8 h. Gompertz curves fitted to the data had adjustedR2’s ranging between 0.91 and 0.99 for experiments with dry periods at –10 MPaand between 0.90 and 0.99 for experiments with dry periods at –42 MPa (Fig. 11and 12). An exception was the treatment in which the moist incubation of conidiawas interrupted after 8 h by a dry period at –42 MPa (Fig. 12), for which no Gom-pertz curve was fitted. For this treatment, a lag time of approximately 4 h was ob-served for the continuation of the germination process after the dry period.Values for germination percentages determined at the beginning of a dry period(–10 or –42 MPa) and at the end of a dry period (data not shown) did not differsignificantly, indicating that the germination process did not continue during dryperiods. In the experiment with dry periods at –10 MPa, no statistically significanteffects were found attributable to the increase of the duration of the initial moistincubation on the estimated maximum level for the germination percentage (C),ranging between 85 and 91%, the slope parameter (B), and the point of inflection(M) (Table 15). In the experiments with a dry period at –42 MPa, similar results

Results 111
0
25
50
75
100
0 6 12 18 24
Total period of moist incubation (h)
Estim
ated
ger
min
atio
n (%
)
Figure 11. Estimated germination percentage of conidia of Ulocladium atrum incubated on agarslides under moist conditions (–1 MPa) interrupted by a dry period at –10 MPa duringthe initial stage of germination. Initial period of moist incubation was 0 ( ), 2 ( ),4 ( ), 6 ( ), or 8 h ( ). Sum of hours of initial moist period and dry period was 24h. Gompertz curves were fitted to data obtained from repeated experiments. For parameterssee Table 15. Adjusted R2’s for the different treatments ranged between 0.91 and 0.99.(From: Köhl and Molhoek, 2001.)
were obtained for parameter C, which ranged between 88 and 91% (Table 16).Values of the point of inflection (M) significantly (P < 0.001) increased and theslope parameter (B) significantly (P = 0.021) decreased with increasing duration ofinitial moist incubation. In the treatment with continuously moist conditions, co-nidia needed 8.1 h to reach 37% of the estimated maximum germination percent-age. With a dry period, these periods were 1.3 to 4.3 h longer.For the control treatment without interruption of moist incubation and the treat-ment with a dry period (–42 MPa) after 8 h of incubation under moist conditions,the number of germ tubes and their length was determined after 8 h and after themaximum germination percentage had been reached after 24 h for conidia incu-bated without interruption of the moist period and after 32 h for conidia incubatedwith one interruption of the moist period. The average number of germ tubes pergerminated conidium was 1.1 after 8 h and increased to 1.5 after 24 h when conidiawere incubated under continuously moist conditions. When a dry period startedafter 8 h of incubation under moist conditions, the number of germ tubes was 1.3.After a total of 32 h of moist incubation, 1.3 germ tubes were observed per germi-nated conidium. The majority of germ tubes were shorter than 50 µm after an in-cubation period of 8 h for both treatments. When conidia of both treatments hadbeen incubated for 24 h or 32 h under moist conditions, the majority of the
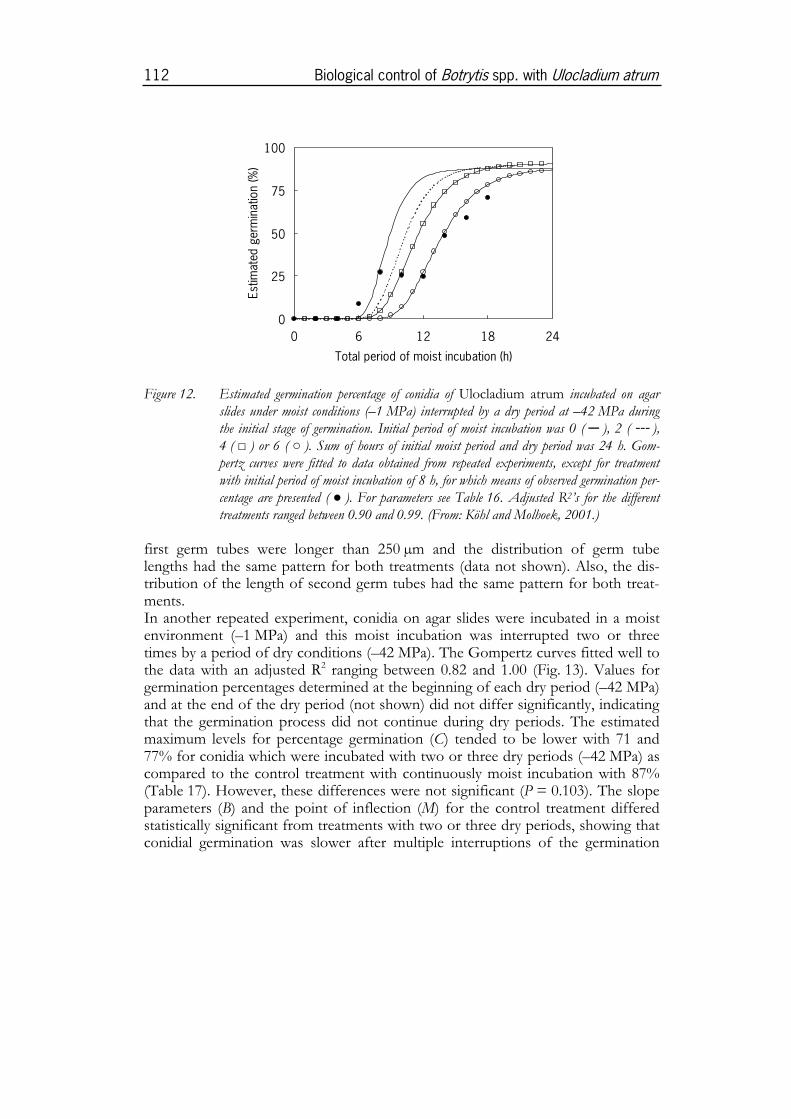
112 Biological control of Botrytis spp. with Ulocladium atrum
0
25
50
75
100
0 6 12 18 24
Total period of moist incubation (h)
Estim
ated
ger
min
atio
n (%
)
Figure 12. Estimated germination percentage of conidia of Ulocladium atrum incubated on agarslides under moist conditions (–1 MPa) interrupted by a dry period at –42 MPa duringthe initial stage of germination. Initial period of moist incubation was 0 ( ), 2 ( ),4 ( ) or 6 ( ). Sum of hours of initial moist period and dry period was 24 h. Gom-pertz curves were fitted to data obtained from repeated experiments, except for treatmentwith initial period of moist incubation of 8 h, for which means of observed germination per-centage are presented ( ). For parameters see Table 16. Adjusted R2’s for the differenttreatments ranged between 0.90 and 0.99. (From: Köhl and Molhoek, 2001.)
first germ tubes were longer than 250 µm and the distribution of germ tubelengths had the same pattern for both treatments (data not shown). Also, the dis-tribution of the length of second germ tubes had the same pattern for both treat-ments.In another repeated experiment, conidia on agar slides were incubated in a moistenvironment (–1 MPa) and this moist incubation was interrupted two or threetimes by a period of dry conditions (–42 MPa). The Gompertz curves fitted well tothe data with an adjusted R2 ranging between 0.82 and 1.00 (Fig. 13). Values forgermination percentages determined at the beginning of each dry period (–42 MPa)and at the end of the dry period (not shown) did not differ significantly, indicatingthat the germination process did not continue during dry periods. The estimatedmaximum levels for percentage germination (C) tended to be lower with 71 and77% for conidia which were incubated with two or three dry periods (–42 MPa) ascompared to the control treatment with continuously moist incubation with 87%(Table 17). However, these differences were not significant (P = 0.103). The slopeparameters (B) and the point of inflection (M) for the control treatment differedstatistically significant from treatments with two or three dry periods, showing thatconidial germination was slower after multiple interruptions of the germination

Results 113
Table 15. Parameter estimates of Gompertz curves fitted to the germination percentage of conidia ofUlocladium atrum incubated on agar slides under moist conditions (–1 MPa) inter-rupted by a dry period at –10 MPa during the initial stage of germination. (From: Köhland Molhoek, 2001.)
Duration (h) x Gompertz curves parameters y
M B C
0 5.3 0.56 912 6.9 1.06 854 7.6 0.85 876 7.2 0.33 908 6.5 0.79 87
Analysis z
Slope 0.225 (±0.125) -0.013 (±0.058) -0.114 (±0.474)t probability 0.111 0.834 0.816
x Duration of initial moist period; sum of initial moist period plus dry period was 24 h.y Means of two experiments; M = point of inflection, B = slope parameter, and C = upper asymptote.Z Linear regression analysis between Gompertz curve parameters and duration of initial moist incubation;
slope parameter (± standard error).
process. It can be calculated from the fitted curves that a germination percentageof 37% was reached under continuously moist incubation after 8.7 h. When moistconditions were interrupted two or three times, 16.2 and 21.1 h of moist incubationwere needed, respectively. The germination process was thus retarded by approxi-mately 4 h per interruption of the moist period.In this experiment, germinated conidia had 1.6 germ tubes when maximum germi-nation was reached after 24 h for conidia incubated under continuously moist con-ditions. For conidia incubated with three moist-dry cycles, the number of germtubes and germ tube length was assessed immediately after the last cycle (after atotal of 18 h of moist incubation) and after a total of 42 h of moist incubation.Germinated conidia had 1.2 and 1.4 germ tubes after 18 h and 42 h of total moistincubation. The germ tube length for germinated conidia after a total of 18 h ofmoist incubation was below 50 µm for the majority of the conidia. After a total of42 h of moist incubation, germ tubes length was > 250 µm for the majority of theconidia.

114 Biological control of Botrytis spp. with Ulocladium atrum
Table 16. Parameter estimates of Gompertz curves fitted to the germination percentage of conidia ofUlocladium atrum incubated on agar slides under moist conditions (–1 MPa) inter-rupted by a dry period at –42 MPa during the initial stage of germination. (From: Köhland Molhoek, 2001.)
Duration (h) x Gompertz curve parameters y
M B C
0 8.1 0.71 882 9.4 0.54 904 10.4 0.44 916 12.4 0.38 88
Analysis z
Slope 0.702 (± 0.105) –0.054 (± 0.017) 0.129 (± 0.451)t probability < 0.001 0.021 0.785
x Duration of initial moist period; sum of initial moist period plus dry period was 24 h.y Means of two experiments: M = point of inflection, B = slope parameter, and C = upper asymptote.z Linear regression analysis between Gompertz curve parameters and duration of initial moist incubation;
slope parameter (± standard error).
Table 17. Parameter estimates of Gompertz curves fitted to the germination percentage of conidia ofUlocladium atrum incubated on agar slides under moist conditions (–1 MPa) inter-rupted by two or three dry periods (–42 MPa) during the initial stage of germination.(From: Köhl and Molhoek, 2001.)
Interruption y Gompertz curve parameters z
M B C
0 dry periods 7.7 0.61 872 dry periods 12.7 0.30 713 dry periods 14.6 0.13 77LSD ( = 0.05) 2.6 0.24 15Fprob. < 0.001 0.004 0.103
y Interruption of initial moist incubation. During each moist-dry cycle, conidia were incubated for 8 h at
–1 MPa followed by 18 h at –42 MPa.z Means of two experiments: M = point of inflection, B = slope parameter, and C = upper asymptote.

Results 115
0
25
50
75
100
0 12 24 36 48
Total period of moist incubation (h)
Estim
ated
ger
min
atio
n (%
) no dry period
2 dry periods
3 dry periods
Figure 13. Estimated germination percentage of conidia of Ulocladium atrum continuously incu-bated on agar slides under moist conditions (–1 MPa) or incubated with two or three moist-dry cycles (6 h at –1 MPa and 18 h at –42 MPa) at the beginning of the experiment fol-lowed by continuously moist incubation. Gompertz curves were fitted to data obtained fromrepeated experiments. For parameter estimates see Table 17. Adjusted R2’s for the differenttreatments ranged between 0.82 and 1.00 for the different treatments. (From: Köhl andMolhoek, 2001.)
3.3.3 Effect of temperature on antagonism of U. atrum against
B. cinerea and B. aclada on necrotic leaf tissues
3.3.3.1 Antagonism of U. atrum on dead onion leavesThe effect of U. atrum on the sporulation of B. aclada and B. cinerea on dead onionleaf segments was quantified after incubation at temperatures between 6 and 24 °C.There was a highly significant (P < 0.001) interaction between experiment, treat-ment and Botrytis species. No evidence (P > 0.05) was found for effects for tem-perature or interaction with temperature. The sporulation indices (SI) for Botrytisspp. sporulation were high, e.g. 74 for B. aclada in the water control treatment(mean for all temperatures) in the first experiment (Table 18). SI’s were low in thesecond experiment, e.g. 37 for B. aclada in the water control treatment (mean for alltemperatures). U. atrum reduced the SI for B. aclada, compared to the water controlby 86% and 99% in experiments 1 and 2, respectively. Sporulation of B. cinerea wasreduced by U. atrum in both experiments by 99% when B. cinerea was applied at1 x 103 conidia ml-1 and by 96% and 99% when B. cinerea was applied at 1 x 10⁴
conidia ml-1 (averages for all temperatures). T-tests for pairwise differences be-
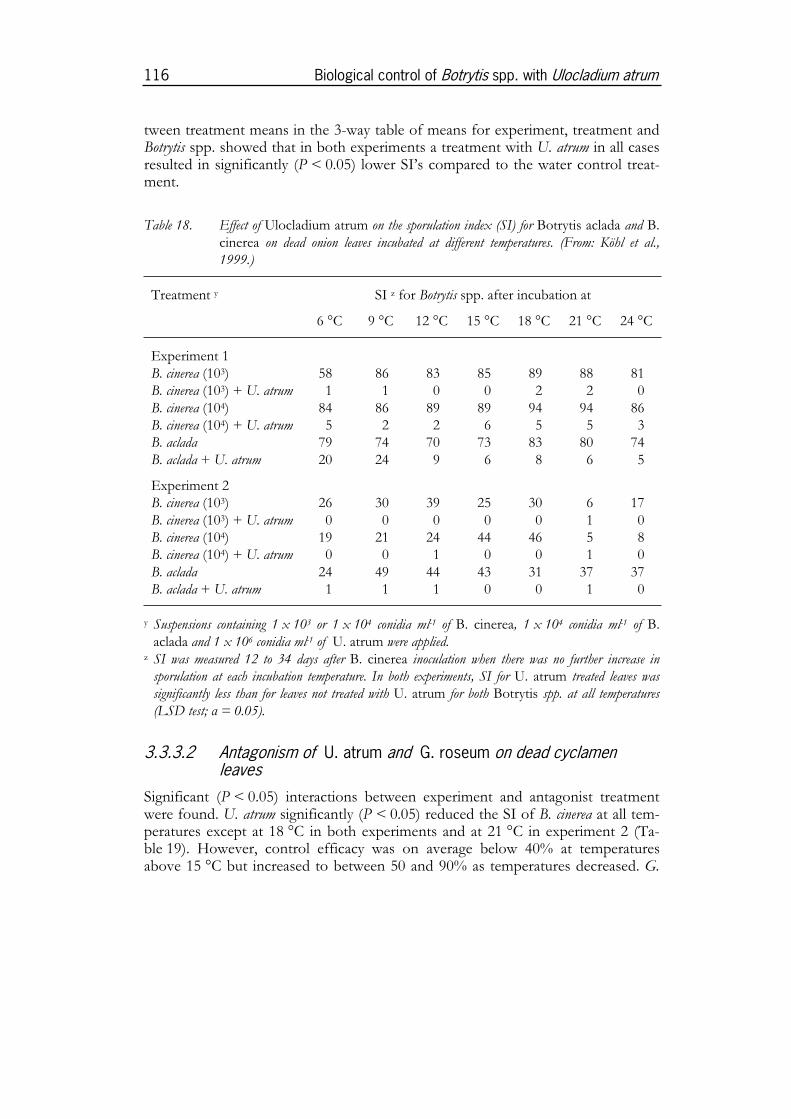
116 Biological control of Botrytis spp. with Ulocladium atrum
tween treatment means in the 3-way table of means for experiment, treatment andBotrytis spp. showed that in both experiments a treatment with U. atrum in all casesresulted in significantly (P < 0.05) lower SI’s compared to the water control treat-ment.
Table 18. Effect of Ulocladium atrum on the sporulation index (SI) for Botrytis aclada and B.cinerea on dead onion leaves incubated at different temperatures. (From: Köhl et al.,1999.)
Treatment y SI z for Botrytis spp. after incubation at
6 °C 9 °C 12 °C 15 °C 18 °C 21 °C 24 °C
Experiment 1B. cinerea (103) 58 86 83 85 89 88 81B. cinerea (103) + U. atrum 1 1 0 0 2 2 0B. cinerea (104) 84 86 89 89 94 94 86B. cinerea (104) + U. atrum 5 2 2 6 5 5 3B. aclada 79 74 70 73 83 80 74B. aclada + U. atrum 20 24 9 6 8 6 5
Experiment 2B. cinerea (103) 26 30 39 25 30 6 17B. cinerea (103) + U. atrum 0 0 0 0 0 1 0B. cinerea (104) 19 21 24 44 46 5 8B. cinerea (104) + U. atrum 0 0 1 0 0 1 0B. aclada 24 49 44 43 31 37 37B. aclada + U. atrum 1 1 1 0 0 1 0
y Suspensions containing 1 x 10³ or 1 x 10⁴ conidia ml-1 of B. cinerea, 1 x 10⁴ conidia ml-1 of B.aclada and 1 x 10⁶ conidia ml-1 of U. atrum were applied.
z SI was measured 12 to 34 days after B. cinerea inoculation when there was no further increase insporulation at each incubation temperature. In both experiments, SI for U. atrum treated leaves wassignificantly less than for leaves not treated with U. atrum for both Botrytis spp. at all temperatures(LSD test; = 0.05).
3.3.3.2 Antagonism of U. atrum and G. roseum on dead cyclamenleaves
Significant (P < 0.05) interactions between experiment and antagonist treatmentwere found. U. atrum significantly (P < 0.05) reduced the SI of B. cinerea at all tem-peratures except at 18 °C in both experiments and at 21 °C in experiment 2 (Ta-ble 19). However, control efficacy was on average below 40% at temperaturesabove 15 °C but increased to between 50 and 90% as temperatures decreased. G.

Results 117
roseum reduced the SI for B. cinerea significantly (P < 0.05) in both experiments at 24and 21 °C. At temperatures below 21 °C, no significant control of B. cinerea sporu-lation was achieved with G. roseum.A highly significant (P < 0.001) relationship was found between the log-transformed number of conidia produced cm-2 (x) and the average SI for the corre-sponding leaf discs (y) (y = 4.228 + 0.019 x; R2 = 0.909).In the second experiment, B. cinerea formed up to two sclerotia per leaf segmentwhen incubated at temperatures above 9 °C (Table 19). The number of sclerotiaformed on leaves incubated at temperatures above 9 °C treated with one of the
Table 19. Effect of Ulocladium atrum and Gliocladium roseum on the sporulation index (SI)
and sclerotia production of Botrytis cinerea on dead cyclamen leaves incubated at differ-ent temperatures. (From: Köhl et al., 1999.)
Treatment x SI y for B. cinerea after incubation at
6 °C 9 °C 12 °C 15 °C 18 °C 21 °C 24 °C
Experiment 1
B. cinerea 64 a z 73 a 66 a 62 a 69 a 54 a 76 aB. cinerea + U. atrum 12 b 26 b 37 b 43 b 59 a 49 a 57 bB. cinerea + G. roseum 57 a 71 a 74 a 71 a 62 a 31 b 16 c
Experiment 2B. cinerea 25 a 63 a 64 a 62 a 49 a 68 a 79 aB. cinerea + U. atrum 1 b 12 b 18 b 28 b 39 a 37 b 41 bB. cinerea + G. roseum 22 a 66 a 71 a 65 a 41 a 18 c 3 c
Number of sclerotia of B. cinerea per leaf segment after incubation at
6 °C 9 °C 12 °C 15 °C 18 °C 21 °C 24 °C
B. cinerea 0.0 0.0 a 0.8 a 1.9 a 1.9 a 1.9 a 1.7 aB. cinerea + U. atrum 0.0 0.0 a 0.0 c 0.2 c 0.6 b 0.4 b 0.3 bB. cinerea + G. roseum 0.0 0.1 a 0.3 b 0.9 b 0.3 b 0.0 c 0.0 c
x Suspensions containing 1 x 10³ conidia ml-1 of B. cinerea and 1 x 10⁶ conidia ml-1 of U. atrum orG. roseum were applied.
y SI was assessed after 19 days for all treatments.z Values within a column of the same experiment with the same letter do not differ significantly (LSD test;
= 0.05).

118 Biological control of Botrytis spp. with Ulocladium atrum
antagonists was always lower compared to leaves from the control treatment. Inmost cases the number of sclerotia was reduced by more than 70% by either an-tagonist.
3.3.3.3 Antagonism of U. atrum on dead hydrangea leavesB. cinerea sporulated on dead hydrangea leaves when incubated at 18 °C in the moistchambers within three weeks (Table 20). When incubated at 1 or 3 °C, B. cinereasporulation started after several weeks. A significant (P < 0.05) interaction betweentemperature, concentration and treatments with U. atrum was observed. For allthree temperatures and concentrations of B. cinerea, the application of U. atrum re-sulted in a significant decrease in the SI of B. cinerea. This effect was less pro-nounced at the highest concentration of B. cinerea applied (1 x 10⁵ conidia ml-1).
Table 20. Effect of Ulocladium atrum on the sporulation index (SI) for Botrytis cinerea ondead hydrangea leaves incubated at different temperatures. (From: Köhl et al., 1999.)
Treatment w SI x for Botrytis spp. after incubation at
1 °C 3 °C 18 °C
B. cinerea (103) 38.0 a y 58.7 a 57.0 aB. cinerea (103) + U. atrum 2.0 b 4.6 b 2.9 b
B. cinerea (104) 40.4 a 51.9 a 74.4 aB. cinerea (104) + U. atrum 4.9 b 5.9 b 4.9 b
B. cinerea (105) n.d. z 58.7 a 71.4 aB. cinerea (105) + U. atrum n.d. 25.2 b 43.7 b
w Suspensions containing 1 x 10³, 1 x 10⁴ or 1 x 10⁵ conidia ml-1 of B. cinerea and 1 x 10⁶ conidiaml-1 of U. atrum were applied.
x Means of two experiments. SI of B. cinerea was assessed 21 days after B. cinerea inoculation forleaves incubated at 18 °C and 56 days after inoculation for leaves incubated at 1 or 3 °C.
y Values of each concentration of B. cinerea within a column with the same letter do not differ signifi-cantly (LSD test; = 0.05).
z Not determined.
3.3.4 Effect of water potential on antagonism of U. atrum
against B. cinerea on cyclamen leaves
The sporulation intensity of B. cinerea decreased with water potential but sporula-tion was also found on leaves treated with the higher dose of B. cinerea and incu-

Results 119
bated at –7 MPa (Table 21). Significant interactions between treatment and waterpotential occurred. The sporulation of B. cinerea was significantly reduced by U.atrum at all water potentials, except for leaves inoculated with the low dose of B.cinerea and incubated at –7 MPa which showed only sparse sporulation of thepathogen. Similar results were obtained in both replicate experiments.
Table 21. Effect of Ulocladium atrum on the sporulation index (SI) of Botrytis cinerea oncyclamen leaves at different water potentials (MPa). (From: Köhl and Molhoek, 2001.)
Treatment y SI for B. cinerea after incubation at
–1 MPa –3 MPa –7 MPa
B. cinerea 105 17.2 a z 4.6 a 0.05 bB. cinerea 105 + U. atrum 0.4 c 0.1 c 0.00 bB. cinerea 106 15.3 a 6.1 a 0.63 aB. cinerea 106 + U. atrum 3.0 b 1.0 b 0.01 b
y B. cinerea was applied at 105 or 106 conidia ml-1. U. atrum was applied at 106 conidia ml-1.z Backtransformed means of two experiments. Values within a column followed by the same letter do not
differ significantly (LSD test after angular transformation; = 0.05).
3.3.5 Persistence of U. atrum conidia on green leaves and sub-
sequent competitive colonisation of senesced leaves by
B. cinerea and U. atrum
3.3.5.1 Greenhouse-grown cyclamen without top irrigationPersistence on leaves. On green cyclamen leaves treated with conidial suspen-sions of U. atrum (1 x 10⁶ conidia ml-1), 3880 and 4070 conidia cm-2 of leaf werefound directly after spraying for each experiment (Fig. 14). In the first experiment,the number of conidia cm-2 of leaf remained stable for eight weeks, but at day 70significantly (P < 0.05) fewer conidia were found (1120 conidia cm-2 of leaf). In thesecond experiment, the conidial density was stable until the end of the experimentand was 3165 at day 70. On leaves of the water control, conidia of U. atrum werefound only on rare occasions in both experiments. The mean conidial density forall assessment dates was below 0.03 conidia cm-2 leaf.The percentage of germinated conidia of U. atrum on the healthy cyclamen leaves inthe greenhouse remained below 12% during the first experiment (Fig. 15). Duringthe second experiment, the percentage of germinated conidia increased after day 7

120 Biological control of Botrytis spp. with Ulocladium atrum
2.5
3
3.5
4
0 20 40 60 80
Days after spraying
Log 1
0-num
ber
of c
onid
ia c
m-2
leaf
are
a
Figure 14. Density of conidia of Ulocladium atrum on green cyclamen leaves under greenhouseconditions ( experiment 1, experiment 2). Leaves were sprayed with aconidial suspension (1 x 10⁶ conidia ml-1) at day 0. Means ± standard errors of the meanof five leaves (replicates) per assessment date. (From: Köhl et al., 1998.)
0
20
40
60
80
100
0 20 40 60 80
Days after spraying
Ger
min
atio
n (%
)
Figure 15. Germination of conidia of Ulocladium atrum on green cyclamen leaves under greenhouseconditions directly after sampling ( experiment 1, experiment 2) or afterincubation in a moist chamber at 24 °C for 8 h ( experiment 1,
experiment 2). Leaves were sprayed with a conidial suspension (1 x 10⁶ conidiaml-1) at day 0. Means ± standard errors of the mean of 100 conidia on each of five leaves(replicates) per assessment date. (From: Köhl et al., 1998.)

Results 121
from 0.4% to 10%. Thereafter, percentages of germinated conidia ranged be-tween 10% and 30%, but there was no trend of a further increase of the germina-tion over time. After incubation of leaf samples in moist chambers, the percentageof germinated conidia of U. atrum was consistently high during both experiments:80% and 86% at the beginning and 81% and 64% at the end of experiment 1 and2, respectively.
Competitive colonisation of dead cyclamen leaves by B. cinerea and U.atrum. In experiment 1, B. cinerea sporulation was significantly lower at the threeanalysed sampling dates on U. atrum-treated leaves than on leaves of the watercontrol. At sampling day 42, 56, and 70, the coverage of the leaf area with sporu-lating B. cinerea was 42, 58, and 33% on the water-treated leaves but 12, 0, and 10%on U. atrum-treated leaves, respectively. In the second experiment, no difference infungal colonisation was found for leaves that had been left senescing for 28 or 42days in the greenhouse, and the data of such leaves were pooled for data analysis.Leaves were highly contaminated by B. cinerea inoculum produced on infected cy-clamen plants present in the greenhouse, and sporulation of the pathogen wasfound on 84% of the area of leaves from the water control (mean of all samplingdates; Fig. 16). B. cinerea sporulation was significantly reduced by the treatment with
0
20
40
60
80
100
0 20 40 60 80
Days after spraying
% L
eaf a
rea
with
B. c
iner
ea
Figure 16. Percentage of leaf area with Botrytis cinerea sporulation on necrotic cyclamen leaves(experiment 2). Leaves were sprayed with a conidial suspension of Ulocladium atrum(1 x 10⁶ conidia ml-1) ( ) or with water ( ). Healthy green leaves ofplants in an experimental greenhouse were treated at day 0, detached from plants at the in-dicated sampling date, allowed to senesce for 28 to 42 days in the greenhouse, and subse-quently incubated in a moist chamber (14 days, 18 °C). The two treatments differedsignificantly (P < 0.05) at all assessment dates according to LSD tests. (From: Köhl etal., 1998.)

122 Biological control of Botrytis spp. with Ulocladium atrum
U. atrum compared to the water control for all sampling dates. On average, 19% ofthe leaf area was covered with B. cinerea sporulation. The reduction in sporulationof B. cinerea by U. atrum ranged from 95% on leaves removed at day 0 to 56% onleaves sampled at day 70 after application of U. atrum conidia.
3.3.5.2 Greenhouse-grown cyclamen with top irrigationPersistence on leaves. Densities of U. atrum conidia on green cyclamen leaveswere 6900 and 6700 conidia cm-2 at the beginning of experiments 1 and 2, respec-tively. Densities decreased to 1700 and 3500 conidia cm-2 during the first 10 days ofthe two experiments and thereafter remained relatively stable (Fig. 17; data pre-sented as Log10 numbers). At the end of both experiments, approximately 3000conidia cm-2 were found. On untreated leaves, densities were below 1 conidiumcm-2 for all sampling dates.The percentage of conidia germinated on the green leaves under greenhouse con-ditions increased during both experiments to a level of approximately 50%(Fig. 18). After an additional incubation of the sampled leaves in a moist chamber,the percentage of germinated conidia increased to approximately 75% for mostsampling dates with no reduction in percentages at the end of the experiment.Formation of new conidia of U. atrum on the leaf surfaces was not observed.
Competitive colonisation of dead leaves by B. cinerea and U. atrum. In bothexperiments, for all sampling dates, dead leaves were naturally contaminated in thegreenhouse with B. cinerea, resulting in leaf coverage with sporulating B. cinerea afterincubation in a moist chamber ranging from 17.5 to 59.5% on leaves not treatedwith U. atrum (Fig. 19a). Significantly less (P < 0.05) B. cinerea sporulation wasfound on U. atrum-treated leaves for all sampling dates except for leaves sampled70 days after U. atrum application in experiment 1. The efficacy of the U. atrumtreatment was highest on leaves sampled at the beginning of the experiment, with100 and 97% for experiments 1 and 2, respectively (Fig. 19b). Thereafter, efficaciesranged between 51 and 96%, except for the last sampling date of experiment 1where the efficacy was only 29%.

Results 123
2.5
3
3.5
4
4.5
0 20 40 60 80
Days after spraying
Log 1
0-num
ber
of c
onid
ia c
m-2
leaf
are
a
Figure 17. Density of conidia of Ulocladium atrum on green leaves of cyclamen plants (cv SuperSerie) under greenhouse conditions with top irrigation three times per week( experiment 1; experiment 2). Leaves were sprayed with a conidialsuspension (1 x 10⁶ conidia ml -1) at day 0. Means ± standard errors of the mean of fiveleaves (replicates) per assessment date. (From: Köhl et al., 2000.)
0
20
40
60
80
100
0 20 40 60 80
Days after spraying
Ger
min
atio
n (%
)
Figure 18. Germination of conidia of Ulocladium atrum on green leaves of cyclamen plants (cvSuper Serie) under greenhouse conditions with top irrigation three times per week. Leaveswere sprayed with a conidial suspension (1 x 10⁶ conidia ml-1) at day 0. Germination wasassessed directly after sampling ( experiment 1; experiment 2) or afterincubation in moist chamber at 24 °C for 8 h ( experiment1; experiment 2). Means ± standard errors of the mean for 100 conidia on eachof five leaves (replicates) per assessment date. (From: Köhl et al., 2000.)
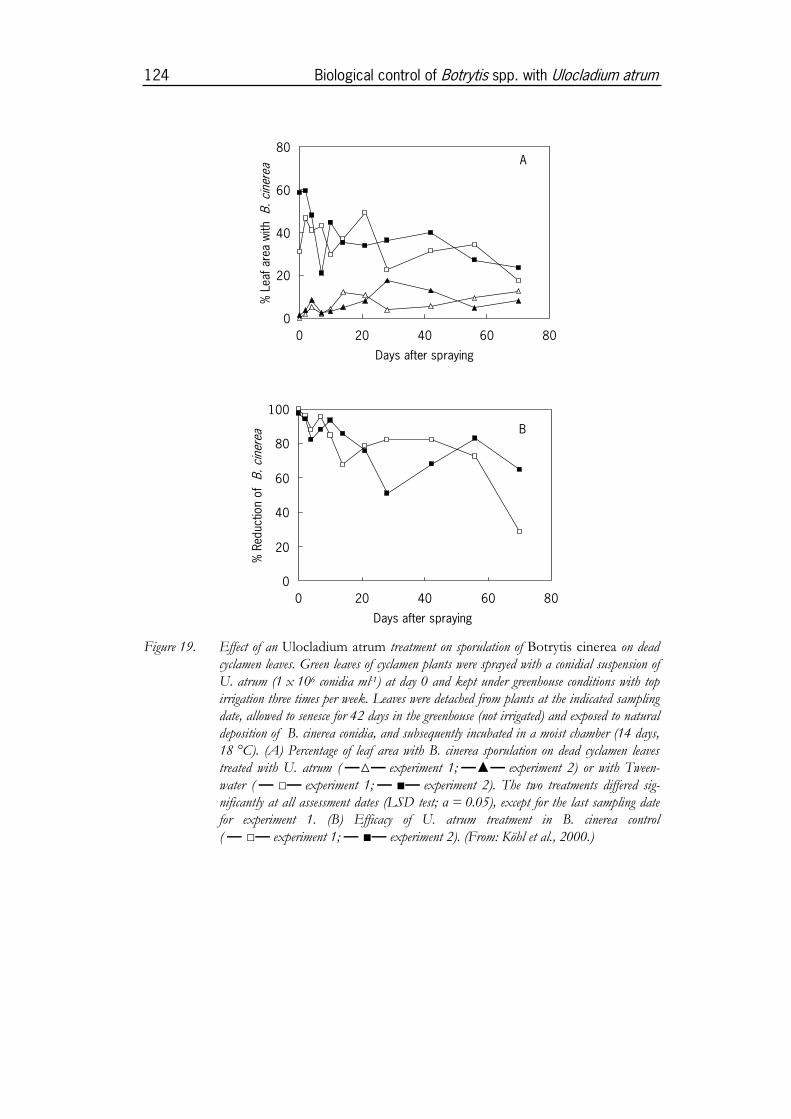
124 Biological control of Botrytis spp. with Ulocladium atrum
0
20
40
60
80
0 20 40 60 80
Days after spraying
% L
eaf a
rea
with
B. c
iner
ea
A
0
20
40
60
80
100
0 20 40 60 80
Days after spraying
% R
educ
tion
of B
. cin
erea B
Figure 19. Effect of an Ulocladium atrum treatment on sporulation of Botrytis cinerea on deadcyclamen leaves. Green leaves of cyclamen plants were sprayed with a conidial suspension ofU. atrum (1 x 10⁶ conidia ml-1) at day 0 and kept under greenhouse conditions with topirrigation three times per week. Leaves were detached from plants at the indicated samplingdate, allowed to senesce for 42 days in the greenhouse (not irrigated) and exposed to naturaldeposition of B. cinerea conidia, and subsequently incubated in a moist chamber (14 days,18 °C). (A) Percentage of leaf area with B. cinerea sporulation on dead cyclamen leavestreated with U. atrum ( experiment 1; experiment 2) or with Tween-water ( experiment 1; experiment 2). The two treatments differed sig-nificantly at all assessment dates (LSD test; = 0.05), except for the last sampling datefor experiment 1. (B) Efficacy of U. atrum treatment in B. cinerea control( experiment 1; experiment 2). (From: Köhl et al., 2000.)
Results 125
3.3.5.3 Field-grown liliesMicroclimatic conditions. In the first week of experiment 1 five wetness periodsof necrotic lily leaves were recorded and four of these were longer than 10 h (Ta-ble 22). In contrast, leaf wetness periods were relatively short and only one rainevent was recorded in the first week of experiment 2 (week 2, Table 22). The fol-lowing weeks were characterised by relatively short leaf wetness periods. The onlysignificant rain event (rainfall > 5 mm) was recorded on 27 July 1995. Several mi-nor rain events (< 0.5 mm) were also recorded but these did not result in leaf wet-ness inside the dense lily canopy. During leaf wetness periods, temperatures rangedbetween 7.2 °C and 24.8 °C with an average of 14.3 °C. Temperatures above 25 °Cconsistently occurred during the five weeks of experimentation.
Conidia density. The background number of U. atrum conidia on green leaves ateach level in the lily canopy in the water-treated control plots was very low (< 60cm-2) at all sampling times in experiment 1 and less than 160 cm-2 at all samplingtimes in experiment 2. The number of conidia on lily leaves sampled directly afterU. atrum application was 4184, 2664 and 816 cm-2 for leaves at the top, middle andbottom canopy levels, respectively, in experiment 1 (Fig. 20a). Significantly(P < 0.01) less conidia were found on leaves from the bottom of the canopy com-pared to the middle or top levels of the canopy. In experiment 2, the number ofconidia on lily leaves sampled directly after spraying was 14040, 4720 and 2464 cm-2
for leaves at the top, middle and bottom levels of the canopy, respectively(Fig. 20b). In this experiment, the number of U. atrum conidia cm-2 at each leaflevel was significantly different (P < 0.05). The number of U. atrum conidia cm-2 onlily leaves declined over time in both experiments and after 21 days were 672, 1264and 336 conidia cm-2 on leaves at the top, middle and bottom level of the lily can-opy, respectively (experiment 1). In experiment 2, the number of U. atrum conidiacm-2 declined to 5112, 1920 and 512 on leaves at the top, middle and bottom levelsof the lily canopy, respectively. There were significant (P < 0.01) effects of canopylevel and linear time (P < 0.001) based on the calculated P values of the F-tests inboth experiments. The decline in number of conidia cm-2 over time was best de-scribed by a linear polynomial with different intercepts for canopy levels. Sincethere were no significant (P < 0.05) differences in the rate of decline of conidiadensity on leaves at each canopy level, a single slope value (b) is presented (Fig. 20).Despite large differences in the initial density of conidia on green leaf surfaces inexperiment 1 and 2, the rate of decline in both experiments was similar and was notsignificantly (P > 0.05) different.
Field germination and germination potential. Seven days after U. atrum appli-cation, the germination of conidia on green leaf surfaces in the field (mean of allleaf levels) was 81% and 60% in experiment 1 and experiment 2, respectively(Table 23). Field germination was significantly (P < 0.05) lower on leaves sampledfrom the top level of the canopy than from the middle or bottom levels in

Tab
le 2
2.M
icro
clim
ate
mea
sure
men
ts d
urin
g fie
ld e
xpe
rim
enta
tion
(Wag
enin
gen,
NL
, 24
Jul
y -
4 Sep
tem
ber
1995
). (
Fro
m: E
lmer
and
Köh
l,19
98.)
Wee
kn
o.y
Wet
nes
s p
erio
ds
of
nec
roti
c lil
y le
aves
Rai
n e
ven
tsA
vera
ge t
emp
erat
ure
(°C
) re
cord
edd
uri
ng:
To
tal
num
ber
Ave
rage
dura
tio
n(h
)T
ota
l dur
a-ti
on
(h)
To
tal
num
ber
To
tal a
mo
unt
(mm
)th
e w
ho
le p
erio
d z
leaf
wet
nes
sp
erio
ds
z
15
17.1
85.5
511
.020
.5 (
13.0
-29.
8)17
.9 (
13.0
-24.
8)2
56.
733
.51
0.2
21.4
(12
.0-3
0.3)
14.8
(12
.0-1
9.3)
35
5.0
25.0
10.
219
.3 (
8.5-
30.5
)12
.7 (
8.5-
18.8
)4
76.
948
.04
0.8
19.3
(7.
2-30
.1)
13.0
(7.
2-19
.8)
59
7.1
64.0
126.
018
.3 (
9.0-
29.7
)14
.4 (
9.0-
19.0
)6
73.
122
.012
7.4
13.5
(5.
4-20
.2)
12.9
(11
.3-1
6.7)
yE
xpe
rim
ent 1
and
2 w
ere
star
ted
on 2
4 an
d 31
Jul
y, r
espe
ctiv
ely.
zV
alue
s ar
e th
e av
erag
e te
mpe
ratu
re a
nd fi
gure
s in
par
enth
esis
are
the
ran
ge.
126 Biological control of Botrytis spp. with Ulocladium atrum

Results 127
0
1
2
3
4
0 7 14 21
Log
10-n
umbe
r of
con
idia
cm
-2 A
0
1
2
3
4
0 7 14 21
Days after conidia application
Log
10-n
umbe
r of
con
idia
cm
-2 B
Figure 20. Number of conidia of Ulocladium atrum on leaves at the top ( ), middle( ) and bottom ( ) level of the lily canopy in experiment 1 (A) and ex-periment 2 (B). The regression equation was log10 (number of conidia cm-2) = a + b(time).Intercept values (a) were 3.50, 3.35, and 2.87 (LSD = 0.2945; = 0.05) for leaves lo-cated at the top, middle and bottom canopy levels (experiment 1) and were 4.21, 3.75, and3.11 (LSD = 0.2250; = 0.05) for leaves located at the top, middle and bottom canopylevels in experiment 2. Slope (b) values were –0.0238 (Standard error = 0.005) and–0.0271 (Standard error = 0.005) for experiment 1 and experiment 2, respectively.(From: Elmer and Köhl, 1998.)
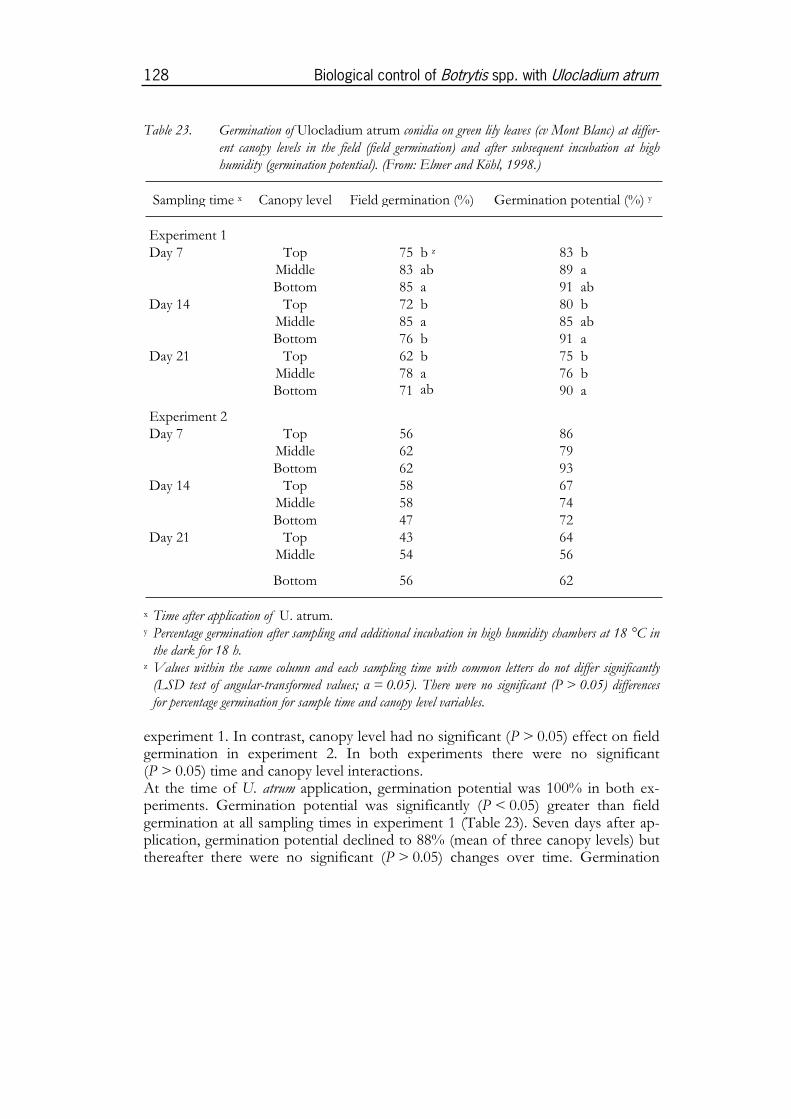
128 Biological control of Botrytis spp. with Ulocladium atrum
Table 23. Germination of Ulocladium atrum conidia on green lily leaves (cv Mont Blanc) at differ-ent canopy levels in the field (field germination) and after subsequent incubation at highhumidity (germination potential). (From: Elmer and Köhl, 1998.)
Sampling time x Canopy level Field germination (%) Germination potential (%) y
Experiment 1Day 7 Top 75 b z 83 b
Middle 83 ab 89 aBottom 85 a 91 ab
Day 14 Top 72 b 80 bMiddle 85 a 85 abBottom 76 b 91 a
Day 21 Top 62 b 75 bMiddle 78 a 76 bBottom 71 ab 90 a
Experiment 2Day 7 Top 56 86
Middle 62 79Bottom 62 93
Day 14 Top 58 67Middle 58 74Bottom 47 72
Day 21 Top 43 64Middle 54 56
Bottom 56 62
x Time after application of U. atrum.y Percentage germination after sampling and additional incubation in high humidity chambers at 18 °C in
the dark for 18 h.z Values within the same column and each sampling time with common letters do not differ significantly
(LSD test of angular-transformed values; = 0.05). There were no significant (P > 0.05) differencesfor percentage germination for sample time and canopy level variables.
experiment 1. In contrast, canopy level had no significant (P > 0.05) effect on fieldgermination in experiment 2. In both experiments there were no significant(P > 0.05) time and canopy level interactions.At the time of U. atrum application, germination potential was 100% in both ex-periments. Germination potential was significantly (P < 0.05) greater than fieldgermination at all sampling times in experiment 1 (Table 23). Seven days after ap-plication, germination potential declined to 88% (mean of three canopy levels) butthereafter there were no significant (P > 0.05) changes over time. Germination

Results 129
potential of conidia on leaves at the bottom level of the canopy was significantly(P < 0.05) higher than conidia deposited on the top level of the canopy at all sam-pling times. In experiment 2, germination potential (mean of all canopy levels) was26% higher than the percentage field germination at the 7-day assessment. In ex-periment 2, germination potential declined significantly (P < 0.01) from 86% (meanof all canopy levels) at day 7 to 61% at day 21, and in contrast to experiment 1,there were no significant (P > 0.05) canopy level effects.
Colonisation of artificially induced necrotic lily leaves by U. atrum. The abil-ity of surviving U. atrum inoculum on green leaf surfaces to successfully colonisenecrotic tissues was measured after paraquat induction of necrosis on tagged greenleaves. Necrosis induction was not successful immediately after U. atrum applica-tion (day 0) in experiment 1 and U. atrum colonisation of necrotic tissue was notrecorded. On leaves in the control treatment without U. atrum application, the leafarea colonised by Ulocladium spp. was 1.6% and 4.4% in experiment 1 and experi-ment 2, respectively. Up to 74% of the necrotic leaf area was colonised by U. atrumafter the leaves were treated with this antagonist (Fig. 21). Leaf area colonisation byU. atrum was always highest on the leaves from the top level of the canopy andlowest for leaves sampled from the bottom canopy level in both experiments. Thispattern was consistent for all times of necrosis induction and there was a significant(P < 0.05) effect of canopy level on U. atrum colonisation.The colonisation of necrotic leaves by U. atrum decreased over time. When necrosiswas induced immediately after antagonist application (day 0), colonisation of theleaf area by U. atrum was 74%, 54% and 26% for leaves sampled from the top,middle and bottom canopy levels, respectively (Fig. 21b, experiment 2). In contrast,when necrosis was induced 21 days after application of the antagonist, colonisationwas 40%, 16% and 7% for the three canopy levels, respectively. Seven days afterantagonist application (day 7, Fig. 21a), leaf area colonisation by U. atrum was 43%,31% and 14% for leaves sampled from the top, middle and bottom canopy levels,respectively, in experiment 1. When necrosis was induced 21 days after applicationof the antagonist (day 21, Fig. 21a), colonisation was 29%, 10% and 6% for the topmiddle and bottom canopy levels, respectively. Despite a reduction of U. atrumcolonisation 21 days after antagonist application colonisation was still greater thanin untreated control treatments (17%, 1%, and 1%), experiment 1, and 2%, 2%,and 1%, experiment 2, for top middle and bottom levels, respectively.For both experiments, ANOVA indicated that there were significant (P < 0.05)linear and quadratic effects over time. A quadratic polynomial in time with differentintercepts and slopes for the linear effect was the best model which fitted the datafor both experiments. However, pairwise comparisons within canopy levels indi-cated that the decrease of colonisation by U. atrum in time was not significant(P > 0.05) in all cases (Fig. 21).

130 Biological control of Botrytis spp. with Ulocladium atrum
0
25
50
75
100
0 7 14 21
Leaf
are
a (%
) with
U. a
trum
A
a
cab
bc
de
c
d
ef
f
0
25
50
75
100
0 7 14 21
Days after conidia application
Leaf
are
a (%
) with
U. a
trum
B
de
cc
b
a
b
d
ed
e e f
Figure 21. Colonisation of necrotic lily leaves by Ulocladium atrum sampled from the top( ), middle ( ) and bottom ( ) levels of the canopy in experi-ment 1 (A) and experiment 2 (B). Leaves were sprayed with U. atrum at day 0. Necrosiswas induced at day 0, 7, 14 and 21. Leaves were sampled 14 days after induction of necro-sis, incubated for nine days at 18 °C in moist chambers and the leaf area covered with co-nidiophores of U. atrum was estimated. Values with common letters do not differsignificantly at P > 0.05 (t-test of angular-transformed values). (From: Elmer and Köhl,1998.)

Results 131
U. atrum conidial density and colonisation relationship. For U. atrum treatedleaves, there was a significant (P < 0.001) relationship between the density of U.atrum conidia (germinated and ungerminated) assessed on the leaves prior to induction of necrosis and the leaf area (%) covered with U. atrum found after inductionof necrosis, field exposure for a further 15 days, and subsequent incubation inmoist chambers in the laboratory (Fig. 22).
0
25
50
75
100
2 3 4 5
Log10-number of conidia cm- 2
Leaf
are
a (%
) with
U. a
trum
Figure 22. Relationship between density of Ulocladium atrum conidia on the green leaf surface oflilies prior to induction of necrosis and leaf area (%) covered with conidiophores of U.atrum. Number of conidia cm-2 of leaf tissue was log-transformed. Regression equation is ofthe form % leaf area with U. atrum = –66.23 + 29.61 (log10-number of conidia cm-2);R2 = 0.713; P < 0.001). Data from experiment 1 ( ) and experiment 2 ( ) werepooled for analysis. (From: Elmer and Köhl, 1998.)
Colonisation of artificially induced necrotic lily leaves by commonly occur-ring saprophytic fungi. The dominant saprophytic fungi detected on lily leavesafter artificial induction of necrosis were Alternaria spp. and Cladosporium spp. Sev-eral other saprophytic fungi such as Epicoccum spp., Stemphylium spp. and Gonatobo-trys spp. covered only 1% or less of the area of necrotic leaves (mean of all leaves)in the untreated water control plots. Botrytis spp. were found sporadically and onlyon three and five leaves throughout the entire periods of experiment 1 and 2, re-spectively. The leaf area covered with conidiophores of Botrytis spp. for all leaves inthe untreated plots was less than 0.05% in both experiments. The effect of U.atrum application to green lily leaves on subsequent colonisation of leaf tissue bycommon saprophytic fungi after induction of necrosis was investigated for Alter-naria spp. and Cladosporium spp. The occurrence of other saprophytic fungi wassporadic and was therefore not analysed further.
132 Biological control of Botrytis spp. with Ulocladium atrum
In the absence of U. atrum, and after incubation in high humidity chambers, Alter-naria spp. sporulation on necrotic leaves was 16.3% (experiment 1) and 18.4% (ex-periment 2) of the leaf area when averaged over all times of necrosis induction andcanopy level. Leaves sampled from the bottom canopy level were generally lesscolonised by Alternaria spp. and the occurrence of Alternaria spp. tended to increasewith time (Table 24).Significant (P < 0.01) treatment and leaf level interactions were detected (at eachnecrosis induction time) and the statistical comparisons are summarised for eachcanopy level at each necrosis induction time. The application of U. atrum resulted insignificantly (P < 0.05) reduced colonisation of lily leaves by Alternaria spp. at alltimes of necrosis induction on leaves from the top and the middle canopy levelsand in two out of the seven observations on leaves from the bottom level. Alter-naria spp. sporulation was reduced by between 63 and 78% in experiment 1 and by51 and 90% in experiment 2 on leaves from the top and middle canopy levels. U.atrum suppression of Alternaria spp. declined over time in experiment 2 (90% at day0 and 66% at day 21). This decline was statistically not further analysed since therewas evidence that Alternaria spp. colonisation in the control treatment increasedover time (16% at day 0 to 31% at day 21, Table 24).In the absence of U. atrum, and after incubation in high humidity chambers, Clado-sporium spp. sporulation on necrotic leaves was 7.4% (experiment 1) and 12.0%(experiment 2) of the leaf area when averaged over all times of necrosis inductionand canopy level. In contrast to Alternaria spp., there did not appear to be any trendof Cladosporium spp. colonisation over time. The application of U. atrum resulted insignificantly (P < 0.05) reduced colonisation of Cladosporium spp. on lily leaves byup to 97% when necrosis was induced on the same day as the U. atrum application(Table 25). The suppression of Cladosporium spp. by U. atrum tended to decreaseover time and was generally lower on leaves at the bottom canopy level. Whennecrosis was induced 21 days after U. atrum application, there were no significant(P > 0.05) reductions of Cladosporium spp. sporulation in both experiments

Tab
le 2
4.E
ffect
of
U
locl
adiu
m
atru
m
appl
icat
ion
on
colo
nisa
tion
of
ar
tific
ially
in
duce
d ne
crot
ic
lily
leaf
tiss
ue
by
Alt
ern
aria
sp
p.(F
rom
: Elm
er a
nd K
öhl,
1998
.)
Tre
atm
ent
Can
op
y le
vel
Per
cen
tage
leaf
are
a co
vere
d w
ith
co
nid
iop
ho
res
of
Alte
rnar
ia s
pp
. u
0 day
s v
7 day
s14
day
s21
day
s
Exp
erim
ent
1W
ater
To
p-
w10
.5*
x18
.0*
27.7
*U
. atr
um-
3.8
(64)
y5.
3(7
1)6.
0(7
8)W
ater
Mid
dle
-12
.8*
20.1
*24
.8*
U. a
trum
-4.
8(6
3)6.
5(6
8)8.
4(6
6)W
ater
Bo
tto
m-
6.1
n.s
. z10
.3n
.s.
16.4
*U
. atr
um-
5.2
(15)
6.7
(35)
8.2
(50)
Exp
erim
ent
2W
ater
To
p16
.1*
17.8
*29
.4*
30.5
*U
. atr
um1.
6(9
0)2.
9(8
4)7.
0(7
6)10
.5(6
6)W
ater
Mid
dle
20.8
*19
.4*
19.4
*20
.2*
U. a
trum
3.2
(85)
5.7
(71)
9.4
(52)
10.0
(51)
Wat
erB
ott
om
10.4
n.s
.11
.5n
.s.
15.8
*10
.0n
.s.
U. a
trum
6.3
(39)
5.9
(49)
6.6
(58)
7.3
(27)
uA
sses
sed
afte
r le
af s
ampl
es w
ere
incu
bate
d in
hig
h hu
mid
ity c
ham
bers
at
18 °
C in
the
dark
for
nine
day
s..
vN
ecro
sis
was
ind
uced
0, 7
, 14
and
21 d
ays
afte
r ap
plicat
ion
of U
. atr
um
ont
o gr
een
leav
es.
w N
ot a
sses
sed.
xSig
nific
antly
diff
eren
t at
P <
0.0
5 fr
om U
. atr
um
tre
atm
ent
(t-tes
t of
ang
ular
-tra
nsfo
rmed
val
ues)
.y
Fig
ures
in
pare
nthe
ses
are
perc
enta
ge r
educ
tion
of A
lter
nar
ia s
pp. s
poru
lation
in
com
pari
son
to the
wat
er tre
atm
ent.
zn.
s. =
no
sign
ifica
nt d
iffer
ence
.
Results 133
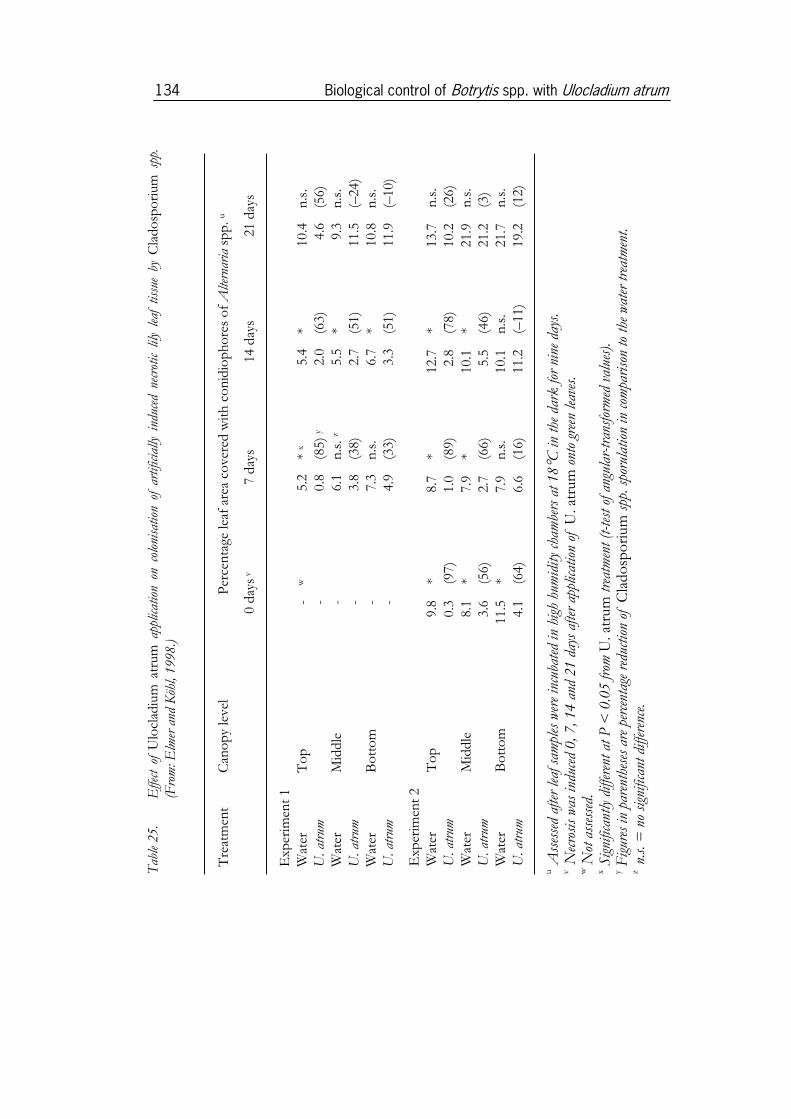
Tab
le 2
5.
Effe
ct o
f U
locl
adiu
m a
trum
app
licat
ion
on c
olon
isat
ion
of a
rtifi
cial
ly i
nduc
ed n
ecro
tic
lily
leaf
tis
sue
by C
lado
spo
rium
spp
.(F
rom
: Elm
er a
nd K
öhl,
1998
.)
Tre
atm
ent
Can
op
y le
vel
Per
cen
tage
leaf
are
a co
vere
d w
ith
co
nid
iop
ho
res
of
Alte
rnar
ia s
pp
. u
0 day
s v
7 day
s14
day
s21
day
s
Ex p
erim
ent
1W
ater
To
p-
w5.
2*
x5.
4*
10.4
n.s
.U
. atr
um-
0.8
(85)
y2.
0(6
3)4.
6(5
6)W
ater
Mid
dle
-6.
1n
.s. z
5.5
*9.
3n
.s.
U. a
trum
-3.
8(3
8)2.
7(5
1)11
.5(–
24)
Wat
erB
ott
om
-7.
3n
.s.
6.7
*10
.8n
.s.
U. a
trum
-4.
9(3
3)3.
3(5
1)11
.9(–
10)
Ex p
erim
ent
2W
ater
To
p9.
8*
8.7
*12
.7*
13.7
n.s
.U
. atr
um0.
3(9
7)1.
0(8
9)2.
8(7
8)10
.2(2
6)W
ater
Mid
dle
8.1
*7.
9*
10.1
*21
.9n
.s.
U. a
trum
3.6
(56)
2.7
(66)
5.5
(46)
21.2
(3)
Wat
erB
ott
om
11.5
*7.
9n
.s.
10.1
n.s
.21
.7n
.s.
U. a
trum
4.1
(64)
6.6
(16)
11.2
(–11
)19
.2(1
2)
uA
sses
sed
afte
r le
af s
ampl
es w
ere
incu
bate
d in
hig
h hu
mid
ity
cham
bers
at 18
°C in
the
dar
k fo
r ni
ne d
ays.
vN
ecro
sis
was
ind
uced
0, 7
, 14
and
21 d
ays
afte
r ap
plic
atio
n of
U
. atr
um
ont
o gr
een
leav
es.
wN
ot a
sses
sed.
x Sig
nific
antly
diff
eren
t at
P <
0.0
5 fr
om U
. atr
um
tre
atm
ent (t
-tes
t of
ang
ular
-tra
nsfo
rmed
val
ues)
.y F
igur
es in
pare
nthe
ses
are
perc
enta
ge r
educ
tion
of
Cla
do
spo
rium
spp
. spo
rula
tion
in
com
pari
son
to t
he w
ater
tre
atm
ent.
zn.
s. =
no
sign
ifica
nt d
iffer
ence
.
134 Biological control of Botrytis spp. with Ulocladium atrum

Results 135
3.4 Mode of action of U. atrum
3.4.1 Fungal interactions: microscopical and ultra-structural
studies
Bioassay. Under constant humid conditions, all four antagonists efficiently sup-pressed the sporulation of B. aclada as in earlier experiments (Köhl et al., 1995c).The sporulation index for B. aclada was 41.8 (with a standard deviation of 5.8) whenthe pathogen had been sprayed alone. On leaf segments treated with B. aclada, nosporulation of B. aclada was observed when G. catenulatum or C. globosum had beenapplied and the sporulation index was 0.8 and 0.3 for leaf segments treated with U.atrum or A. pullulans, respectively. B. aclada was not observed on leaf segments thathad been treated with antagonists without B. aclada. Growth of all antagonists, re-sulting in sporulation of U. atrum and G. catenulatum and blastospore formation ofA. pullulans, could be observed on the leaf segments whether or not treated withthe pathogen. No fungal development was observed on leaves that had not beeninoculated with any of the fungal suspensions.
Agar plate assay. Colonies of B. aclada or U. atrum grown alone showed a regularradial growth. When two colonies of the same fungus had been inoculated on apetri dish, colonies were slightly flattened where growing towards each other.Similar colony shapes were observed when U. atrum and B. aclada were grown incombination on the same petri dishes. There were no distinct inhibition zones be-tween colonies of the same or the two different fungi. However, the colonies didnot seem to grow into each other during the seven days of the experiment.
3.4.1.1 Light microscopyColonisation of dead onion leaves. Despite the fact that tissues and cells of irra-diated dead onion leaves were quite disorganised, it was possible to observe a dif-ferential pattern of colonisation among the five fungi six days after theirinoculation. For instance, in all samples examined, B. aclada was found throughoutthe leaf section including the vascular tissue. In the same manner, U. atrum wasfound to be a very aggressive coloniser of onion leaves and was consistently ob-served in dense concentrations throughout the leaf tissues.On the other hand, both C. Globosum, and to an extent, G. catenulatum appeared tobe confined primarily to the outer portion of the leaf surface. In all examined sam-ples, C. globosum appeared less dense than B. aclada or U. atrum. G. catenulatum wasfound occasionally, although in low concentrations, in the parenchymal tissues andaround the veins. A. pullulans was characteristically concentrated in the leaf stomata

136 Biological control of Botrytis spp. with Ulocladium atrum
(or between epidermal cells) with a few fungal propagules being randomly dis-persed underneath the epidermal cells.
Interactions between Botrytis aclada and the fungal antagonists. Of the fourinteractions, it was nearly impossible to generate salient information under lightmicroscopy because of the difficulty of precisely differentiating the fungi sincedifferential staining techniques (2.2.4.2) were not yet available for these studies. Inthe case of Botrytis-Gliocladium, differences in mycelium diameter between the twospecies made it somewhat easier to separate them. From all samples studied, it wasobvious that B. aclada was unable to colonise onion leaves to the extent observed incontrol treatments when competing against G. catenulatum. In some instances, cellsof B. aclada appeared dead, as evident by their lack of reaction with methylene blue.For the Botrytis-Ulocladium interaction, abundant colonisation and sporulation by theantagonist suggested that U. atrum had completely saturated the substrate. Theantagonist was as abundant as in the controls with the distinction that more sporeswere consistently observed on the leaf surface. In this situation, typical dic-tyospores of U. atrum covering the leaf surface made it easy to identify the antago-nist. In the numerous samples studied, it was impossible to confirm conclusivelythe presence of B. aclada under light microscopy.
3.4.1.2 Transmission electron microscopyBotrytis-Ulocladium. In samples of dead onion leaves inoculated with U. atrumalone, the fungus was observed easily within tissues. Its cells were characterised bya granular cytoplasm containing several large lipid bodies of variable electron den-sity; its cell wall was covered by a regular hairy mucilage making it easy to discrimi-nate from the cells of B. aclada (Fig. 23a). The fungus seemed to colonise all deadleaf tissues and it was capable of degrading the plant cell walls (Fig. 23a, arrow-head). In the numerous samples observed, it was impossible to obtain conclusiveevidence of the presence of B. aclada when both fungi were inoculated onto onionleaves (Fig. 23b). On the other hand, U. atrum was always conspicuously presentand degraded the cell walls of onion leaves.Because of the inability to observe interactions in planta between B. aclada and U.atrum, in vitro confrontations were studied in an attempt to understand the basis ofthe antagonistic activity of U. atrum. In control samples, as observed in the bioas-say, neither B. aclada nor U. atrum were markedly altered by a self-confrontation.Confrontations between the pathogen and the antagonist failed to show typicalreactions of parasitism or antibiosis in the bioassay. On the other hand, TEM ob-servations at the zone of contact revealed that fungal cells from both fungi showedvarying degrees of alteration at the immediate zone of contact. This ranged fromdetached plasmalemma to slight disorganisation of the cytoplasm (Fig. 23c, d).These alterations subsided gradually away from the contact zone and neither fun-gus appeared to overcome the other.
Results 137
Botrytis-Gliocladium. Ultrastructural observations of dead onion leaves inocu-lated with B. aclada showed that fungal cells were of regular shape and contained adense cytoplasm (Fig. 24a). Typical organelles such as nuclei and mitochondriawere clearly visible and the cells were surrounded by a thick fibrillar mucilage. Bycomparison, G. catenulatum cells were characteristically smaller than those of thepathogen (thus confirming light microscope observations) and were covered by athin and irregular mucilage (Fig. 24b). Their cytoplasm was regular and contained afew large electron-dense lipid bodies.In the instances where it was possible to observe both fungi in close vicinity, cellsof B. aclada had lost all turgor pressure and were typically devoid of cytoplasmiccontent (Fig. 24c). They were reduced to empty shells being shaped according tothe presence of G. catenulatum hyphae. The cell wall of the pathogen were thickercompared to controls (Fig. 24a), but were otherwise unaltered and no samples re-vealed the presence of the antagonist within B. aclada cells (Fig. 24c).
Botrytis-Chaetomium. In dead onion leaves inoculated with C. globosum alone,cross-sections of fungal cells revealed a dense and uniform cytoplasm with a darklateral lipid body that sometimes covered most of the section (Fig. 25a). Leaf cellwalls adjacent to fungal propagules were either degraded or characterised by a loosefibrillar appearance, suggestive of cellulolytic activity by the antagonist.In the samples inoculated with both the pathogen and the antagonist, simultaneouspresence of both fungi was rarely observed under TEM. In longitudinal sections,lipid bodies of C. globosum were quite numerous and distinctive, making it easy toidentify the antagonist (Fig. 25b). Based on our observations, C. globosum was pre-dominant over B. aclada within all treated leaf tissues. In a few instances, dead fun-gal cells completely devoid of their cytoplasm, appearing as empty hyphal shells,were observed in the proximity to C. globosum (Figs. 25b, c). However, because ofthe advanced stage of degradation of these former cells, it was impossible to con-firm whether they belonged to B. aclada.
Botrytis-Aureobasidium. In dead onion leaves inoculated with A. pullulans, cellsof the antagonist were typically found in clusters (Fig. 26a) as observed under lightmicroscopy. They were characterised by a very dense cytoplasm and the presenceof dark lipid bodies.Close contact between B. aclada and A. pullulans cells revealed that the pathogenwas affected by the presence of the antagonist (Fig. 26b). In these observations,cells of B. aclada had lost their integrity and the cytoplasmic content of damagedcells had retracted away radially from the cells of A. pullulans. At the point of directcontact between the pathogen and the antagonist cells, the cell wall of B. aclada hadlost some of its definition and appeared distended and fibrillar (Fig. 26b, open ar-row).

138 Biological control of Botrytis spp. with Ulocladium atrum
Figure 23. Transmission electron micrographs of (A) Ulocladium atrum (Ua) cells in dead onion(Allium cepa cv Hyton) leaf tissues, (B) U. atrum cells in dead onion leaf tissues inocu-lated with both Botrytis aclada (Ba) and U. atrum and (C) and (D) B. aclada and U.atrum cells taken at the meeting point of two colonies growing on agar plates. Leaf sampleswere taken six days after inoculation with U. atrum. Bar = 1 µm. (A) Plant cell walls(cw) of onion leaves are highly degraded in the presence of U. atrum. Note the passage ofan Ua cell through the plant cell wall (arrowhead). (B) In the interaction B. aclada-U.atrum (Ua), only cells of the antagonist are observed within the plant tissues. Note the deg-radation of the plant cell walls (cw). (C) and (D) Cells of both fungi show varying degreesof alteration when grown in confrontation on agar medium. (From: Köhl et al., 1997.)

Results 139
Figure 24. Transmission electron micrographs of (A) Botrytis aclada cells, (B) Gliocladiumcatenulatum cells and (C) the interaction between B. aclada and G. catenulatum cellsin dead onion (Allium cepa cv Hyton) leaf tissues. (A) Botrytis aclada cells (Ba) sur-rounded by a thick fibrillar mucilage (mu) and characterised by a dense cytoplasm filledwith distinct organelles such as a nucleus (N) and mitochondria (M). Bar = 1 µm. (B)Cells of Gliocladium catenulatum (Gc) showing typical large lipid bodies (lb) and sur-rounded by a thin and irregular mucilage. Bar = 1 µm. (C) A dead cell of B. aclada (Ba)surrounded by three cells of G. catenulatum (Gc). External pressure by Gc induces walldeformation. Note thickness of the cell wall of Ba. Bar = 2 µm. (From: Köhl et al.,1997.)

140 Biological control of Botrytis spp. with Ulocladium atrum
Figure 25. Transmission electron micrographs of (A) Chaetomium globosum cells in dead onion(Allium cepa cv Hyton) leaf tissues and (B) and (C) C. globosum cells and dead fungalcells, six days after inoculation of the antagonist on dead onion leaf tissues that had beeninoculated with Botrytis aclada. Bar = 1 µm. (A) C. globosum (Cg) is characterizedby a dense cytoplasm and the presence of large and electron dense lipid bodies (lb). The plantcell wall (cw) is highly degraded and near complete disruption in certain areas (open arrow).(B) and (C) Presence of empty hyphal shells (ehs) in proximity of C. globosum cells.Note typical lipid bodies (lb) of the antagonist. (From: Köhl et al., 1997.)

Results 141
Figure 26. Transmission electron micrographs of (A). Aureobasidium pullulans cells in dead onion(Allium cepa cv Hyton) leaf tissues and (B) A. pullulans and B. aclada cells in deadonion leaf tissues inoculated with both the pathogen and the antagonist. Samples were takensix days after inoculation with A. pullulans. Bar = 1 µm. (A) Cells of A. pullulans(Ap) are frequently found in clusters and characterized by a very dense cytoplasm. (B) In-teraction between B. aclada (Ba) and A. pullulans (Ap). Note Ba cytoplasm retractedradially from Ap (arrows). Note change in Ba cell wall definition and density at point ofdirect contact with Ap (open arrow). (From: Köhl et al., 1997.)

142 Biological control of Botrytis spp. with Ulocladium atrum
3.4.2 Competitive substrate colonisation: experimental studies
and simulation modelling
3.4.2.1 Head start experimentsThe yields (sporulation) of monocultures of B. cinerea and U. atrum on necrotic cy-clamen leaf tissue were not influenced by differences in total incubation timecaused by the different application intervals (dotted lines in Fig. 27a). Therefore, itcan be concluded that two weeks after the first spray application, sporulation wasfully developed and stable. Sporulation of B. cinerea was not significantly reduced bythe presence of the antagonist when B. cinerea and U. atrum were applied simultane-ously or when B. cinerea was inoculated before U. atrum. With increasing applicationadvantages for U. atrum, B. cinerea sporulation was reduced until it was completelysuppressed at advantages of 48 h or more for U. atrum (Fig. 27a).Sporulation of U. atrum was not significantly reduced by B. cinerea when U. atrumhad an application advantage of 12 h or more. With simultaneous inoculation orearlier application of B. cinerea, sporulation of U. atrum was suppressed although B.cinerea was not capable of suppressing sporulation of U. atrum completely at theapplication intervals tested. U. atrum sporulation seems to stabilise at a low level inthe interval of 12 to 24 h advantage for B. cinerea, despite the dominating presenceof B. cinerea (Fig. 27a).The relative yields (RY) of U. atrum and B. cinerea increased with growing applica-tion advantages. The intersection between both RY lines was displaced upward andslightly to the right when compared to the reference position of the intersection forequal competitive abilities at 0 hours and 50% relative yield (Fig. 27b). As indicatedby the standard errors of the average relative yield totals (RYT), the RYT was sig-nificantly higher than 1 for application intervals of 0 and 12 h advantages for U.atrum. For longer or shorter advantages for U. atrum the RYT did not differ signifi-cantly from 1. The convex shape of the RYT line indicates stronger intraspecificcompetition than interspecific competition, i.e. some degree of niche differentiationbetween both fungi.
3.4.2.2 Dynamics of internal mycelial colonisationInternal mycelial biomass followed a more or less sigmoidal time course but maxi-mum colonisation levels were not stable between experiments and in some casescolonisation levels were observed to decrease during the latest phases of colonisa-tion. Variation within experiments might be related to differences in leaf qualitybetween leaves within a batch as reported by Kessel et al. (1999). Variation betweenexperiments might be related to differences in leaf quality between batches. Leavesfor the different experiments were harvested in December, February and April,respectively.

Results 143
0
25
50
75
100
-24 0 24 48 72
Spor
ulat
ion
(%)
A
0.0
0.5
1.0
1.5
2.0
-24 0 24 48 72
Application interval between U. atrum and B. cinerea (h)
Rela
tive
yiel
d
B
Figure 27. (A) Sporulation measured as SPLACI (0 to 100%) of Botrytis cinerea and Ulocla-dium atrum on sterilised necrotic cyclamen leaf tissue after two weeks incubation at 18 °C.Leaves were sprayed with conidial suspensions (1 x 10⁶ conidia ml-1) of B. cinerea and U.atrum, B. cinerea and sterile tap water containing 0.01% Tween 80 or U. atrum andsterile tap water containing 0.01% Tween 80 at different application intervals ranging from24 h application advantage for B. cinerea (–24 h) to 72 h application advantage for U.atrum (72 h). ( ) = U. atrum sporulation in monoculture. ( ) = B. ci-nerea sporulation in monoculture. ( ) = U. atrum sporulation in mixed culturewith B. cinerea. ( ) = B. cinerea sporulation in mixed culture with U. atrum.(B) Relative yields (RY, average sporulation in mixed culture divided by the average sporu-lation in the corresponding monoculture) and relative yield total (RYT) for sporulation of U.atrum and B. cinerea in mixed cultures. ( ) = Experimental RY of U. atrum.( ) = Experimental RY of B. cinerea. ( ) = Experimental RYT. ( - - - )= theoretical RYT in case of equal intra- and interspecific competition. ( * ) = theoreticalintersection of RY lines for B. cinerea and U. atrum in case of equal intra- and interspeci-fic competition. Error bars represent standard error of the mean. (From: Kessel, 1999.)
144 Biological control of Botrytis spp. with Ulocladium atrum
For B. cinerea and U. atrum it was observed that in the latest phases of colonisationthe clearly visible fluorescing hyphae were replaced by a halo of fluorescence with-out any apparent structure as if the hyphae had dissolved and the antigen had dis-persed in the tissue. The decrease of colonisation levels during later phases ofcolonisation could thus be caused by lysis of the hyphal elements. Observations oneven later phases of colonisation were not possible due to high levels of macerationof the cyclamen tissue. During the first 60 h of colonisation, colonisation levelsdisplayed a consistent exponential increase. No significant effects of fungal specieson the colonisation rate were detected. During competitive substrate colonisation,fungal colonisation dynamics followed the same patterns as in monoculture with atrend towards lower maximum colonisation levels in mixed cultures than inmonocultures.
3.4.2.3 SimulationUnder the assumption that the final fungal biomass level reached in the simulationsis proportional to sporulation, the general behaviour of the simulation model wasin agreement with experimental results from the head start experiments. Simulatedand measured RY lines displayed a sigmoid shape over the range of applicationintervals (Fig. 28a). The simulated reference scenario of equal inter- and intra-specific competition (Fig. 28a) resulted in a close resemblance of the simulated andmeasured RY’s for U. atrum. The simulated RY’s for B. cinerea however were under-estimated in this scenario. A major difference between the experimental results andthe simulated results was found in the shape of the RYT line. The experimentalRYT line was convex whereas the simulated RYT lines were straight horizontallines.The effect of small changes of the model parameters, giving one of the fungi acompetitive advantage, on the simulation results is summarised in Fig. 28. Theresponse of the model system is described using five characteristics of the RYcurves and RYT: (1) the steepness of both RY curves, (2) the position of the inter-section of both RY curves, (3) the value of the RYT, (4) the lowest RY achievedand (5) the head start needed by each of the fungi to completely suppress the com-petitor. The relative growth rates (rU and rB) are the only parameters controlling thesteepness of the RY curves. Higher relative growth rates resulted in shorter headstarts needed for complete exclusion of the competitor (Fig. 28b). Differences inthe relative growth rate of U. atrum and B. cinerea result in a lateral displacement ofthe intersection between both RY curves (Fig. 28c, d). Changes in the relativegrowth rates did not influence the value of the RYT or the minimum colonisationlevel achieved.The availability of species specific resources (RB 0 and / or RU 0) raised boththe minimum colonisation level of the species to whom the specific resources wereaccessible and the RYT. Availability of species-specific resources also caused the

Results 145
0.0
0.5
1.0
1.5
-24 0 24 48 72
Rela
tive
Yiel
dA
0.0
0.5
1.0
1.5
-24 0 24 48 72
Rela
tive
Yiel
d B
0.0
0.5
1.0
1.5
-24 0 24 48 72
Rela
tive
Yiel
d
C
0.0
0.5
1.0
1.5
-24 0 24 48 72
Rela
tive
Yiel
d
D
0.0
0.5
1.0
1.5
-24 0 24 48 72
Rela
tive
Yiel
d E
0.0
0.5
1.0
1.5
-24 0 24 48 72
Rela
tive
Yiel
d F
0.0
0.5
1.0
1.5
-24 0 24 48 72Application interval between U. atrum
and B. cinerea (h)
Rela
tive
Yiel
d G
0.0
0.5
1.0
1.5
-24 0 24 48 72
Application interval between U. atrumand B. cinerea (h)
Rela
tive
Yiel
d H
Figure 28. Relative yield (RY) of Botrytis cinerea and Ulocladium atrum colonising necroticcyclamen leaves in simulated and experimental head start experiments. ( ) = U. atrumexperimental RY. ( ) = B. cinerea experimental RY. ( ) = B. cinerea simu-lated RY. ( ) = U. atrum simulated RY. ( ) = simulated RYT. (A) Ref-erence scenario with equal inter- and intraspecific competition. Model parameters: R = 1;RB = RU = 0, rU = rB = 0.1; U0 = B0 = 0.01 and µ = = 1. All other figures weregenerated with identical model parameters except for the following: (B) rU = rB = 0.3. (C)rU = 0.2, rB = 0.1. (D) rU = 0.1, rB = 0.2. (E) RB = 0, RU = 0.2. (F) RB = 0.2,RU = 0. (G) U0 = 0.001, B0 = 0.0001. (H) U0 = 0.0001, B0 = 0.001. (From: Kes-sel, 1999.)

146 Biological control of Botrytis spp. with Ulocladium atrum
intersection between both RY curves to shift laterally and upward (Fig. 28e, f).Extra species-specific resources did only marginally affect the steepness of both RYcurves.Differences in initial biomass for both fungi caused the intersection between bothRY lines to shift laterally (Fig. 28g, h). The head start needed for complete suppres-sion of the competitor shifted laterally along with the intersection of the RY lines.Minimum colonisation levels and the RYT value were not influenced by differencesin initial biomass.
3.5 Use of U. atrum for disease control in crops
3.5.1 Experiments in strawberries
3.5.1.1 Grey mould at harvestIn total, seven field experiments were carried out (Table 26). The incidence of greymould in untreated plots was generally low, from 1.4 to 12.3% of the total fruits(Tables 27 and 28). The application of U. atrum weekly at 2 x 10⁶ conidia ml-1 fromtransplanting until first fruits turned red significantly reduced the percentage ofgrey mould in comparison to the control in experiments 1, 2 and 4 (Table 27). U.atrum weekly sprayed from transplanting and twice weekly from beginning of flow-ering significantly reduced grey mould in comparison to the control in experiment5, but not in experiment 6 (Table 28). U. atrum applied weekly from the beginningof flowering at 2 x 10⁶ conidia ml-1 gave significant reduction of grey mould incomparison to the control in experiment 2 but not in experiment 4 (Table 28). U.atrum at 2 x 10⁶ conidia ml-1, applied twice per week from the beginning of flower-ing, reduced grey mould in comparison to the control in experiment 5 but not inexperiment 6 (Table 28). In experiment 7 (data not presented), U. atrum applied at0.5 x 106 conidia ml-1 from the beginning of flowering until first fruits turned red,did not reduce grey mould in comparison to the control when applied at two- orfour-day intervals. However, the incidence of grey mould in the control treatment(2.2%) was low. The effects of applications of U. atrum at 2 x 10⁶ conidia ml-1
starting at transplanting were superior to those starting at flowering in only oneexperiment (experiment 4, Table 27). Fungicide programmes reduced grey mouldsignificantly more than U. atrum applied at 2 x 10⁶ conidia ml-1 from the beginningof flowering in four experiments (experiment 2 and 4, Table 27; experiment 5 and6, Table 28). Crop sanitation by removing senescent and necrotic leaflets did notreduce grey mould in comparison to the control (experiment 5 and 6, Table 28). U.atrum spray programmes effectively reduced grey mould in four of seven experi-ments. In two of seven experiments at least one U. atrum spray programme gave
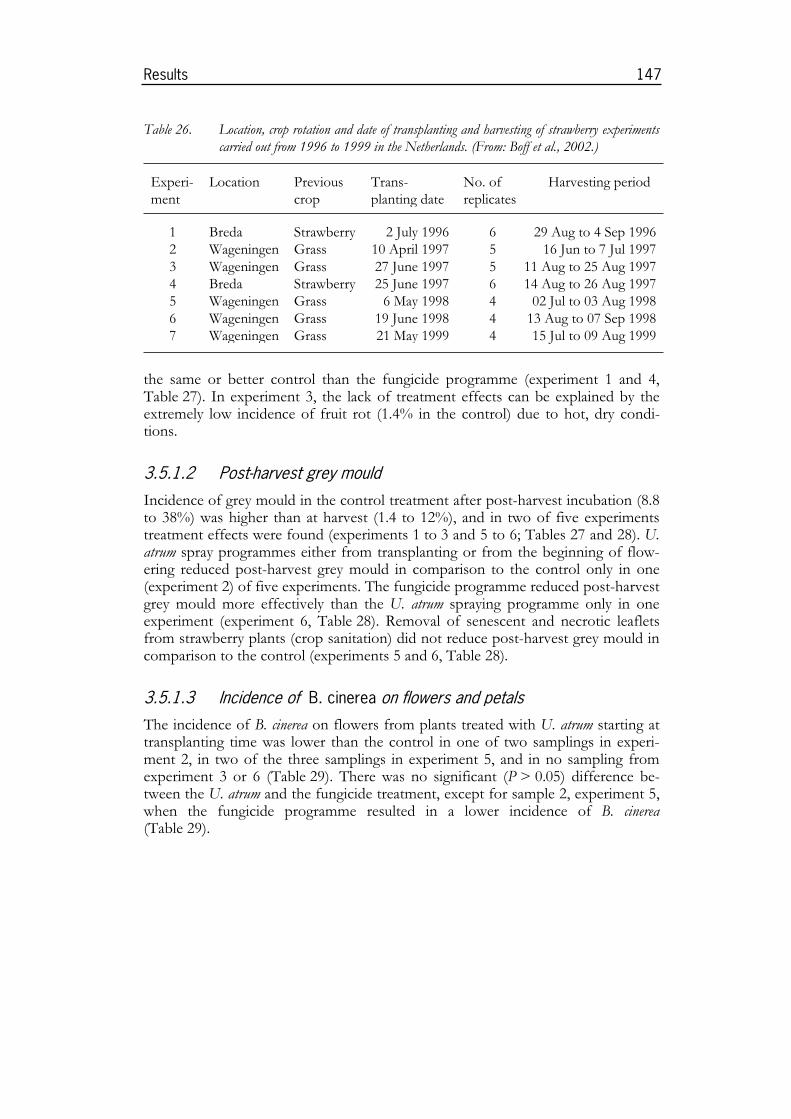
Results 147
Table 26. Location, crop rotation and date of transplanting and harvesting of strawberry experimentscarried out from 1996 to 1999 in the Netherlands. (From: Boff et al., 2002.)
Experi-ment
Location Previouscrop
Trans-planting date
No. ofreplicates
Harvesting period
1234567
BredaWageningenWageningenBredaWageningenWageningenWageningen
StrawberryGrassGrassStrawberryGrassGrassGrass
2 July 199610 April 199727 June 199725 June 1997
6 May 199819 June 199821 May 1999
6556444
29 Aug to 4 Sep 199616 Jun to 7 Jul 1997
11 Aug to 25 Aug 199714 Aug to 26 Aug 1997
02 Jul to 03 Aug 199813 Aug to 07 Sep 199815 Jul to 09 Aug 1999
the same or better control than the fungicide programme (experiment 1 and 4,Table 27). In experiment 3, the lack of treatment effects can be explained by theextremely low incidence of fruit rot (1.4% in the control) due to hot, dry condi-tions.
3.5.1.2 Post-harvest grey mouldIncidence of grey mould in the control treatment after post-harvest incubation (8.8to 38%) was higher than at harvest (1.4 to 12%), and in two of five experimentstreatment effects were found (experiments 1 to 3 and 5 to 6; Tables 27 and 28). U.atrum spray programmes either from transplanting or from the beginning of flow-ering reduced post-harvest grey mould in comparison to the control only in one(experiment 2) of five experiments. The fungicide programme reduced post-harvestgrey mould more effectively than the U. atrum spraying programme only in oneexperiment (experiment 6, Table 28). Removal of senescent and necrotic leafletsfrom strawberry plants (crop sanitation) did not reduce post-harvest grey mould incomparison to the control (experiments 5 and 6, Table 28).
3.5.1.3 Incidence of B. cinerea on flowers and petalsThe incidence of B. cinerea on flowers from plants treated with U. atrum starting attransplanting time was lower than the control in one of two samplings in experi-ment 2, in two of the three samplings in experiment 5, and in no sampling fromexperiment 3 or 6 (Table 29). There was no significant (P > 0.05) difference be-tween the U. atrum and the fungicide treatment, except for sample 2, experiment 5,when the fungicide programme resulted in a lower incidence of B. cinerea(Table 29).
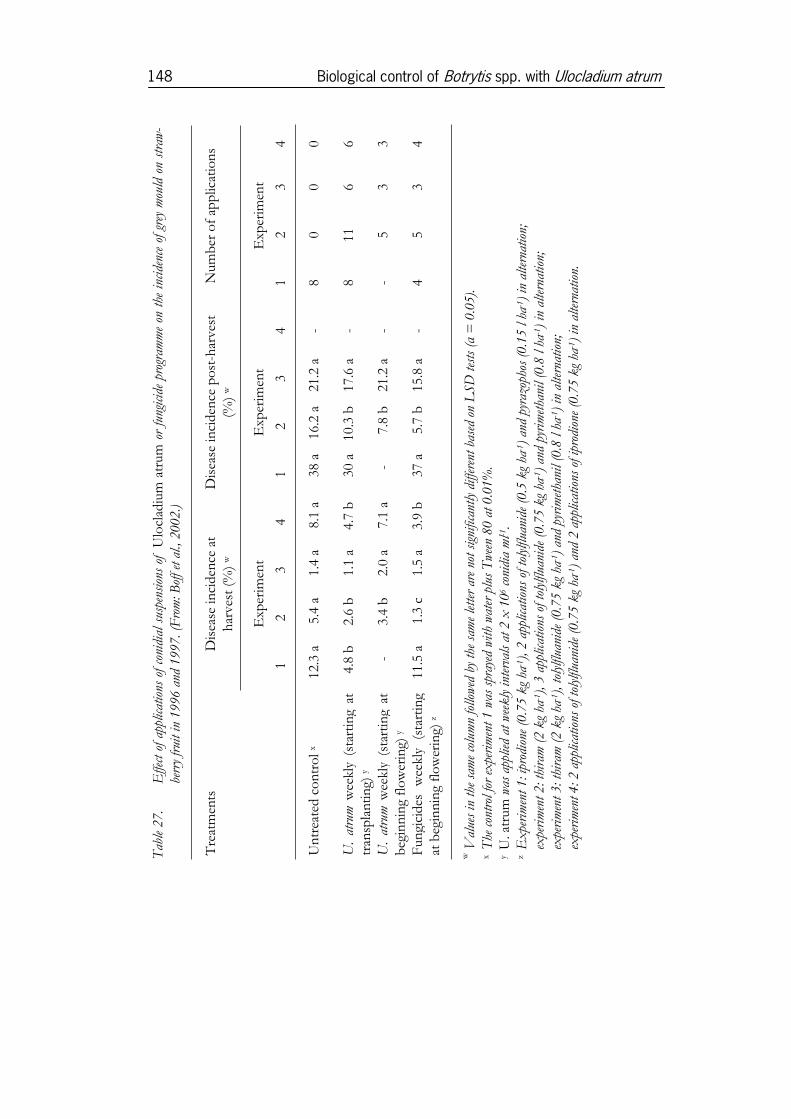
Tab
le 2
7.E
ffect
of
appl
icat
ions
of
coni
dial
sus
pens
ions
of
Ulo
clad
ium
atr
um
or
fung
icid
e pr
ogra
mm
e on
the
inc
iden
ce o
f gr
ey m
ould
on
stra
w-
berr
y fr
uit in
199
6 an
d 19
97. (
Fro
m: B
off e
t al
., 20
02.)
Dis
ease
inci
den
ce a
th
arve
st (
%)
w
Dis
ease
inci
den
ce p
ost
-har
vest
(%)
w
Num
ber
of
app
licat
ion
s
Exp
erim
ent
Exp
erim
ent
Exp
erim
ent
Tre
atm
ents
12
34
12
34
12
34
Un
trea
ted c
on
tro
l x
U.
atru
m w
eekl
y(s
tart
ing
attr
ansp
lanti
ng)
y
U.
atru
m w
eekl
y(s
tart
ing
atb
egin
nin
g fl
ow
erin
g) y
Fun
gici
des
w
eekl
y(s
tart
ing
at b
egin
nin
g fl
ow
erin
g) z
12.3
a
4.8
b
-
11.5
a
5.4
a
2.6
b
3.4
b
1.3
c
1.4
a
1.1
a
2.0
a
1.5
a
8.1
a
4.7
b
7.1
a
3.9
b
38 a
30 a -
37 a
16.2
a
10.3
b
7.8
b
5.7
b
21.2
a
17.6
a
21.2
a
15.8
a
- - - -
8 8 - 4
0 11 5 5
0 6 3 3
0 6 3 4
wV
alue
s in
the
sam
e co
lum
n fo
llow
ed b
y th
e sa
me
letter
are
not
sig
nific
antly
diff
eren
t ba
sed
on L
SD
tes
ts (
= 0
.05)
.x
The
con
trol
for
expe
rim
ent
1 w
as s
pray
ed w
ith
wat
er p
lus
Tw
een
80 a
t 0.
01%
.y
U. a
trum
was
app
lied
at w
eek
ly int
erva
ls a
t 2
x 1
06 c
onid
ia m
l-1.
zE
xpe
rim
ent 1:
ipr
odio
ne (
0.75
kg
ha-1), 2
app
licat
ions
of t
olyl
fluan
ide
(0.5
kg
ha-1)
and
pyra
zoph
os (
0.15
l ha
-1)
in a
ltern
atio
n;ex
peri
men
t 2:
thi
ram
(2
kg
ha-1), 3
app
licat
ions
of t
olyl
fluan
ide
(0.7
5 k
g ha
-1)
and
pyri
met
hani
l (0.
8 l h
a-1 )
in
alte
rnat
ion;
expe
rim
ent 3:
thi
ram
(2
kg
ha-1), tol
ylflu
anid
e (0
.75
kg
ha-1)
and
pyri
met
hani
l (0.
8 l h
a-1 )
in
alte
rnat
ion;
expe
rim
ent 4:
2 a
pplic
atio
ns o
f tol
ylflu
anid
e (0
.75
kg
ha-1)
and
2 ap
plicat
ions
of i
prod
ione
(0.
75 k
g ha
-1)
in a
ltern
atio
n.
148 Biological control of Botrytis spp. with Ulocladium atrum
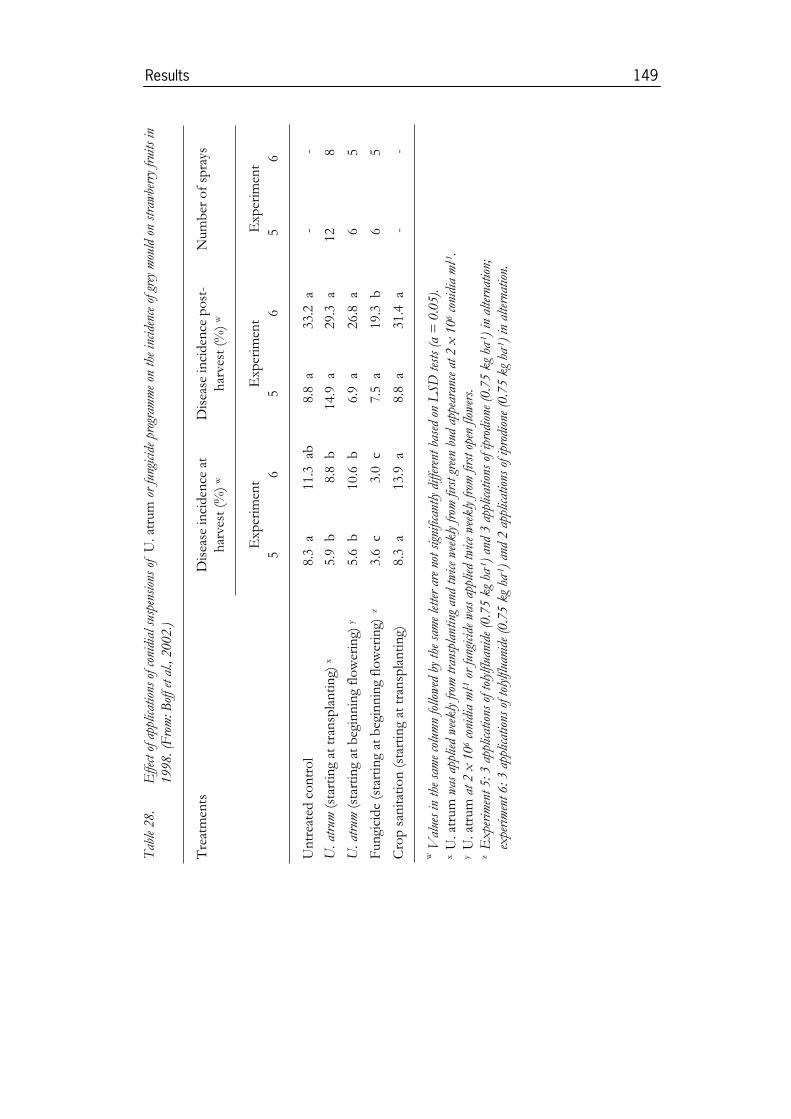
Tab
le 2
8.
Effe
ct o
f app
licat
ions
of c
onid
ial s
uspe
nsio
ns o
f U
. atr
um o
r fu
ngic
ide
prog
ram
me
on t
he inc
iden
ce o
f gre
y m
ould
on
stra
wbe
rry
frui
ts in
1998
. (F
rom
: Bof
f et al
., 20
02.)
Dis
ease
inci
den
ce a
th
arve
st (
%)
w
Dis
ease
inci
den
ce p
ost
-h
arve
st (
%)
w
Num
ber
of
spra
ys
Exp
erim
ent
Exp
erim
ent
Exp
erim
ent
Tre
atm
ents
56
56
56
Un
trea
ted c
on
tro
l8.
3a
11.3
ab8.
8a
33.2
a-
-
U. a
trum
(st
arti
ng
at t
ran
spla
nti
ng)
x5.
9b
8.8
b14
.9a
29.3
a12
8
U. a
trum
(st
arti
ng
at b
egin
nin
g fl
ow
erin
g) y
5.6
b10
.6b
6.9
a26
.8a
65
Fun
gici
de
(sta
rtin
g at
beg
inn
ing
flo
wer
ing)
z3.
6c
3.0
c7.
5a
19.3
b6
5
Cro
p s
anit
atio
n (
star
tin
g at
tra
nsp
lan
tin
g)8.
3a
13.9
a8.
8a
31.4
a-
-
wV
alue
s in
the
sam
e co
lum
n fo
llow
ed b
y th
e sa
me
letter
are
not
sig
nific
antly
diff
eren
t ba
sed
on L
SD
tes
ts (
= 0
.05)
.x
U. a
trum
was
app
lied
wee
kly
from
tra
nspl
anting
and
tw
ice
wee
kly
from
firs
t gr
een
bud
appe
aran
ce a
t 2
x 1
06 c
onid
ia m
l-1.
yU
. atr
um
at 2
x 1
06 c
onid
ia m
l-1 o
r fu
ngicid
e w
as a
pplie
d tw
ice
wee
kly
from
firs
t op
en fl
ower
s.z
Expe
rim
ent 5:
3 a
pplic
atio
ns o
f tol
ylflu
anid
e (0
.75
kg
ha-1)
and
3 ap
plicat
ions
of i
prod
ione
(0.
75 k
g ha
-1)
in a
ltern
atio
n;ex
peri
men
t 6:
3 a
pplic
atio
ns o
f tol
ylflu
anid
e (0
.75
kg
ha-1)
and
2 ap
plicat
ions
of i
prod
ione
(0.
75 k
g ha
-1)
in a
ltern
atio
n.
Results 149
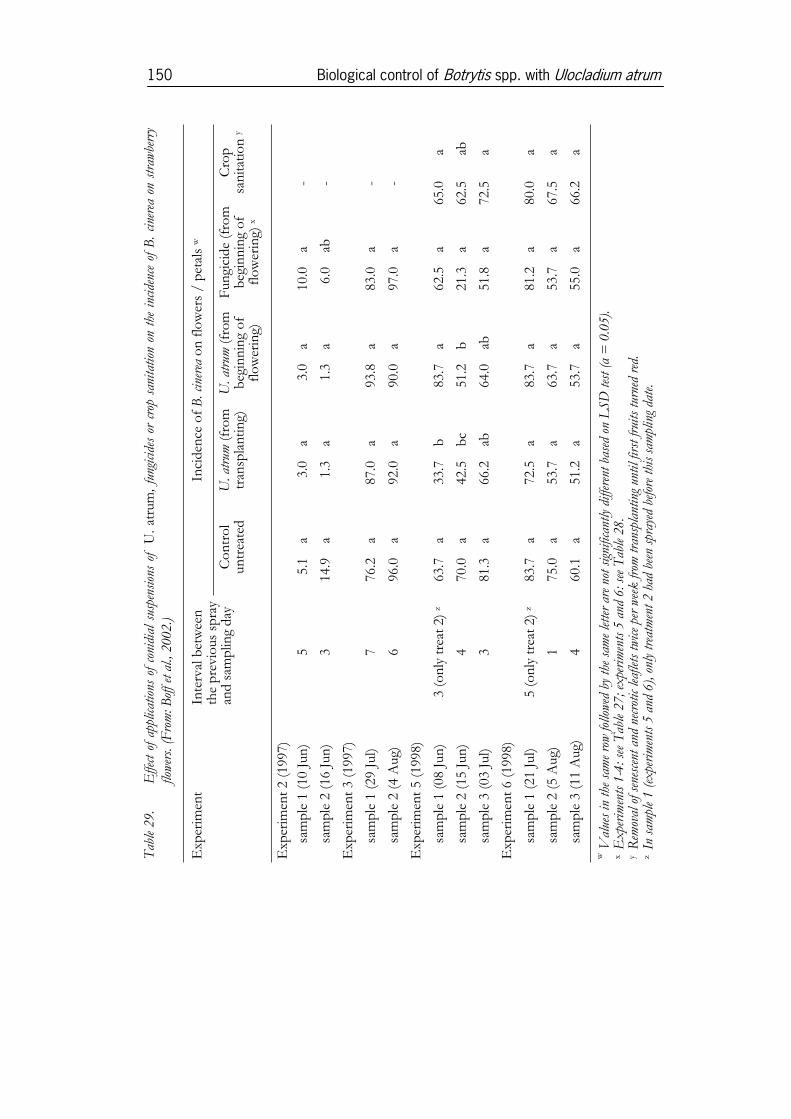
Tab
le 2
9.
Effe
ct o
f ap
plicat
ions
of
coni
dial
sus
pens
ions
of
U.
atru
m,
fung
icid
es o
r cr
op s
anitat
ion
on t
he i
ncid
ence
of
B.
cine
rea
on s
traw
berr
yflo
wer
s. (
Fro
m: B
off e
t al
., 20
02.)
Inci
den
ce o
f B
. cin
erea
on
flo
wer
s / p
etal
s w
Exp
erim
ent
Inte
rval
bet
wee
nth
e p
revi
ous
sp
ray
and s
amp
ling
day
Co
ntr
ol
un
trea
ted
U. a
trum
(fr
om
tran
spla
nti
ng)
U. a
trum
(fr
om
beg
inn
ing
of
flo
wer
ing)
Fun
gici
de
(fro
mb
egin
nin
g o
ffl
ow
erin
g) x
Cro
psa
nit
atio
ny
Exp
erim
ent
2 (1
997)
sam
ple
1 (
10 J
un
)5
5.1
a3.
0a
3.0
a10
.0a
-
sam
ple
2 (
16 J
un
)3
14.9
a1.
3a
1.3
a6.
0ab
-
Exp
erim
ent
3 (1
997)
sam
ple
1 (
29 J
ul)
776
.2a
87.0
a93
.8a
83.0
a-
sam
ple
2 (
4 A
ug)
696
.0a
92.0
a90
.0a
97.0
a-
Exp
erim
ent
5 (1
998)
sam
ple
1 (
08 J
un
)3
(on
ly t
reat
2)
z63
.7a
33.7
b83
.7a
62.5
a65
.0a
sam
ple
2 (
15 J
un
)4
70.0
a42
.5b
c51
.2b
21.3
a62
.5ab
sam
ple
3 (
03 J
ul)
381
.3a
66.2
ab64
.0ab
51.8
a72
.5a
Exp
erim
ent
6 (1
998)
sam
ple
1 (
21 J
ul)
5 (o
nly
tre
at 2
) z
83.7
a72
.5a
83.7
a81
.2a
80.0
a
sam
ple
2 (
5 A
ug)
175
.0a
53.7
a63
.7a
53.7
a67
.5a
sam
ple
3 (
11 A
ug)
460
.1a
51.2
a53
.7a
55.0
a66
.2a
wV
alue
s in
the
sam
e ro
w fo
llow
ed b
y th
e sa
me
letter
are
not
sig
nific
antly
diff
eren
t ba
sed
on L
SD
tes
t (
= 0
.05)
.x
Expe
rim
ents
1-4
: see
Tab
le 2
7; e
xpe
rim
ents
5 a
nd 6
: see
Tab
le 2
8.y
Rem
oval
of s
enes
cent
and
nec
rotic
leaf
lets
tw
ice
per
wee
k fr
om tra
nspl
anting
unt
il fir
st fr
uits
tur
ned
red.
zIn
sam
ple
1 (e
xpe
rim
ents
5 a
nd 6
), o
nly
trea
tmen
t 2
had
been
spr
ayed
bef
ore
this
sam
plin
g da
te.
150 Biological control of Botrytis spp. with Ulocladium atrum
Results 151
In experiment 7, the incidence of B. cinerea on petals from plots treated with U.atrum or fungicides was lower as compared to untreated plots. However, these dif-ferences were statistically significant only for sample 1. The incidence of B. cinereaon petals did not differ between the untreated plots and plots with crop sanitation(Table 29).
3.5.1.4 Fruit qualityHealthy fruit weight, as measure of quality, did not differ among the treatments,except in experiment 5 in which plants treated twice weekly with U. atrum at 2 x 10⁶
conidia ml-1 from first flowering presented significantly smaller fruits (8.8 g perfruit) than the control (10.3 g per fruit) and in experiment 7, in which plantssprayed with fungicides presented significantly larger fruits (13.2 g) than the un-treated control plants (11.6 g) (other data not presented).
3.5.2 Experiments in onion
3.5.2.1 Fungal sporulation on necrotic onion leaf segments exposed ononion field plots
On necrotic onion leaf segments exposed in 1995 on onion plots treated with wa-ter, conidial suspensions of U. atrum or Ronilan, sporulation of Botrytis spp. wasfound only sporadically even after moist incubation for ten days at 18 °C for all tenperiods in which such experiments had been carried out. Sporulation after moistincubation of Alternaria spp., Cladosporium spp. and U. atrum varied for the differentperiods (Fig. 29). In most cases, high values for sporulation of Alternaria spp. coin-cided with low values for Cladosporium and vice versa. On leaf segments treatedwith conidial suspensions of U. atrum, the sporulation of Alternaria spp. and Clado-sporium spp. was lower than on leaf segments from control plots treated with water.Such effects were not found for Ronilan treated leaf segments. Colonisation of U.atrum (and naturally occurring fungi which cannot be distinguished from U. atrummicroscopically) was high with approximately 50% coverage on average of all ex-periments for U. atrum treated leaf segments, but below 7% for leaf segments fromcontrol or Ronilan treated plots. Colonisation of leaf segments not sprayed withconidial suspensions of U. atrum but exposed on U. atrum treated plots tended tohave only a slightly higher colonisation by U. atrum than leaf segments sampledfrom plots not treated with U. atrum. Such leaf segments exposed on U. atrumtreated plots but not sprayed with U. atrum were covered by Alternaria spp. andCladosporium spp. to the same extend as leaves from water treated control plots(data not shown).

152 Biological control of Botrytis spp. with Ulocladium atrum
0
20
40
60
80
180 200 220 240
Cove
rage
(%)
A. Alternaria spp.
0
20
40
60
80
180 200 220 240
Julian date
Cov
erag
e (%
)
B . C ladosporium spp.
Figure 29. Colonisation of necrotic onion leaf segments exposed to field plots before treatment withwater ( ), Ronilan ( ) or Ulocladium atrum (2 x 10⁶ conidia ml-1)( ) or after treated with U. atrum ( ). Leaf segments fixed to leaf supportswere left on the field plots for seven days, incubated in moist chamber for ten days at 18 °Cand leaf surface covered by fungal sporulation was assessed for (A) Alternaria spp., (B)Cladosporium spp., and (C) U. atrum. Field experiment 1995. (From: Köhl et al.,2003.)

Results 153
0
20
40
60
80
180 200 220 240Julian date
Cove
rage
(%)
C. U. atrum
Figure 29. Continued.
3.5.2.2 Colonisation of necrotic leavesNecrotic leaf parts sampled during both field experiments were incubated in amoist chamber to stimulate Botrytis spp. sporulation. On all samples, Botrytis spp.sporulated only incidentally after incubation in a moist chamber except for leavessampled on 21 August 1996. On necrotic leaf tips sampled at this date from watertreated plots, 3.0% of the area was covered with sporulating Botrytis spp. after moistincubation, whereas on necrotic leaf parts from U. atrum or Ronilan treated plotsstatistically significantly less sporulation was found with 0.2 and 0.3% coveragewith sporulating Botrytis spp. (LSD test; = 0.05).
3.5.2.3 Aerial spore loadDuring the field experiment in 1996, spore load of Botrytis spp. above onion plotsand outside plots in the buffer crop was quantified (Table 30). Spore counts ingeneral were low with a maximum of 150 spores (sized <15 µm) m-3 of air as com-pared to counts made during a leaf spot epidemic in 1991 with a maximum value ofnearly 600 spores m-3 of air (3.1.1; Fig. 2). For all runs, the spore load outside theexperimental field was the same as for plots treated with U. atrum or Ronilan. Sporeload in water treated control plots was statistically significantly higher in four as-sessments and tended to be higher in another two assessments. In the other runs,no differences in spore load of Botrytis spp. were found inside and outside experi-mental plots.

154 Biological control of Botrytis spp. with Ulocladium atrum
Table 30. Aerial load with conidia of Botrytis spp. above and outside onion plots treated weeklywith Ulocladium atrum w or Ronilan in comparison to a water treated control. (From:Köhl et al., 2003)
Treatment Number of conidia of Botrytis spp. m-3 of air<15 µm x >15 µm <15 µm >15 µm <15 µm >15 µm
19 Aug Run 1 (11:44) y Run 2 (12:19) Run 3 (12:56)
Water 150 a z 31 n.s. 149 a 14 n.s. 141 n.s. 19 n.s.U. atrum 76 b 14 99 b 16 126 15Ronilan 92 b 16 86 b 9 101 13outside 85 b 15 89 b 8 121 13
22 Aug Run 1 (9:56) Run 2 (10:40) Run 3 (11:18)
Water 102 a 39 a 73 n.s. 9 n.s. 137 n.s. 9 n.s.U. atrum 49 b 11 b 75 7 58 4Ronilan 52 b 16 b 61 9 44 4outside 73 ab 8 b 87 5 87 5
w Conidial suspensions with 2 x 10⁶ conidia ml-1 were sprayed at 500 l ha-1.x Spore length.y Starting time of 15 min-run.z Values of the same column and sampling day with a common letter do not differ statistically(LSD test; = 0.05).
3.5.2.4 Leaf spotsIn both years, the number of leaf spots cm-2 of green leaf tissue was low. Lesionsdid not expand and no symptoms of leaf die back were observed. In 1995, maxi-mum values at the end of the growing season were approximately 0.1 leaf spot cm-2
of green leaf surface (data not presented). A statistically significant reduction of thenumber of leaf spots by approximately 40% was found for both U. atrum andRonilan treated plots as compared to the water control only one week before 50%of the leaves had lodged (data not presented). In 1996, 0.2 spots cm-2 of green leafsurface were counted on plants from the water treated control when 50% of theleaves had lodged (Fig. 30). The number of leaf spots cm-2 of green leaf surface wasstatistically significantly reduced by 60% in both U. atrum treated and Ronilantreated plots.

Results 155
0
0.05
0.1
0.15
0.2
0.25
170 190 210 230
Julian date
Num
ber
of le
af s
pots
cm
-2
*
*
**
*
Figure 30. Number of leaf spots caused by Botrytis squamosa or B. cinerea in onion treated atweekly intervals with conidial suspensions of Ulocladium atrum (2 x 10⁶ conidia ml-1)( ) or Ronilan ( ) in comparison with a water treated control( ). Statistically significant differences between control and treatments with U.atrum or Ronilan are indicated with asterisks (LSD test; = 0.05). Field experiment1996. (From: Köhl et al., 2003.)
3.5.3 Experiments in cyclamen under commercial growing con-
ditions
3.5.3.1 Development of a biocontrol system with U. atrum andG. roseum
In the first experiment, no sporulation of B. cinerea was found at the beginning ofthe experiment. Sporulation initially was observed on dead leaf tissue of 153-dayold plants. The estimated leaf area with B. cinerea sporulation corrected for sporula-tion intensity (SPLACI; 2.2.5.4) increased with time in all treatments (Fig. 31a).When plants were near marketable age at 205 days, more than 0.8 leaves per plantof the control treatment were completely covered with sporulating B. cinerea.SPLACI was reduced significantly to 0.15 by the application of U. atrum or thefungicides. Disease incidence increased with time, and more than 80% of the wa-ter-treated plants showed symptoms of B. cinerea at a plant age of 205 days(Fig. 31b). Treatments with U. atrum or fungicides resulted in significant diseasesuppression with disease incidences of 40% and 46%, respectively. The number ofdiseased petioles per plant increased during the experiment in all treatments, butwas significantly reduced by treatment with U. atrum (0.9) or fungicides (0.7) ascompared to the control (3.5) at a plant age of 205 days (Fig. 31c). On average,approximately 1.8 petioles per plant treated with G. roseum were infected.

156 Biological control of Botrytis spp. with Ulocladium atrum
Several heavily infected plants of the different treatments were removed from thegreenhouse at a plant age of 205 days to reduce the inoculum density for neigh-bouring commercially grown crops. SPLACI, disease incidence, and disease sever-ity of the remaining plants of the control treatment increased during thesubsequent 14 days but SPLACI and disease severity increased slower for plantstreated with U. atrum (Fig. 31a-c).In the second experiment, treatments were started with younger plants (plant ageof 109 days) that did not show symptoms caused by B. cinerea. B. cinerea sporulationfirst occurred at a plant age of 151 days. During the last month of experiment 2,disease development was more rapid than in the first experiment (Fig. 32). Whenplants were close to marketability (plant age of 236 days), approximately 1.4 leavesper plant of the water control were completely covered with B. cinerea (Fig. 32a).SPLACI was significantly reduced to below 0.7 leaves by the application of U.atrum (applied at intervals as in experiment 1), G. roseum (applied at a five timeshigher dose than in experiment 1) and the fungicides. U. atrum applied at increasedintervals significantly reduced SPLACI assessed at a plant age of 179, 193, 207, and221 days, but not of 236 days. Disease incidence in the treatments with antagonistsor fungicides was significantly reduced to 50 to 60% as compared to 77% in thecontrol treatment at a plant age of 236 days (Fig. 32b). Disease severity based ondiseased petioles per plant showed the same pattern (Fig. 32c). Antagonist andfungicide treatments significantly reduced the number of diseased petioles from 3.9in the water control to 1.5 to 2.3 with no significant differences between thesetreatments. After heavily diseased plants were removed when plants were 236 daysold, the disease severity of the remaining control plants increased from 1.5 to 3.0during the next 14 days. For U. atrum-treated plants, the disease severity increasedfrom 1.1 to 1.6 (regular application intervals) and from 0.9 to 1.5 (increased appli-cation intervals), respectively.For both experiments, the different treatments had similar effects on sporulation ofB. cinerea on both leaf blades (SPLA, SPLACI) and petioles (SPPA, SPPACI) as ondisease severity (Fig. 31 and 32, Table 31). Significant block effects, at least partlyto be attributed to possible differences in resistance against B. cinerea of lines withdifferent flower colour, were found for several assessment dates during experiment2 but not during experiment 1; e.g., disease severity was twice as high in one blockconsisting of plants with wine red coloured flowers, than in the three other blocks,consisting of plants with pink, white with red heart, or lilac coloured flowers.Occasionally, epiphytic colonies of U. atrum were found on the lower side of leaveswhere humidity in the canopy allowed epiphytic growth. Such colonies could bewiped off without any sign of leaf damage underneath the colony.

Results 157
Table 31. Effect of Ulocladium atrum, Gliocladium roseum, and fungicides on the spore-producing leaf area (SPLA), spore-producing petiole area (SPPA), and spore-producingpetiole area corrected for intensity (SPPACI) x of cyclamen plants cv Super Serie grown ina commercial greenhouse. (From: Köhl et al., 1998.)
Treatment y SPLA SPPA SPPACI
Experiment 1Control 1.31 a z 2.82 a 1.73 aFungicides 0.25 b 0.46 c 0.23 bG. roseum 0.76 a 1.27 b 0.78 bU. atrum 0.25 b 1.03 bc 0.63 b
Experiment 2Control 1.86 a 3.01 a 2.08 aFungicides 0.83 b 1.33 bc 0.77 bcG. roseum 0.97 b 0.90 c 0.59 cU. atrum (2-3 weekly) 1.05 b 1.75 bc 0.88 bcU. atrum (4-6 weekly) 1.46 ab 2.02 ab 1.38 ab
x SPLA is defined as the estimated equivalent number of leaf blades per plant with conidiophores of Bo-trytis cinerea; SPPA is defined as the estimated equivalent number of petioles per plant with conidio-phores of B. cinerea; SPPACI is defined as the estimated equivalent number of petioles per plantcompletely covered with conidiophores of B. cinerea. Plant age at assessment date was 205 days (ex-periment 1) and 236 days (experiment 2).
y In experiment 1, conidial suspensions of U. atrum (1 x 10⁶ conidia ml-1) and G. roseum (2 x 10⁶
conidia ml-1) were applied at a plant age of 133, 153, 174, 189, and 205 days. The fungicides tolyl-fluanid, prochloraz-manganese, tolylfluanid, prochloraz-manganese, and iprodione were applied in alter-nation when plants were 112, 133, 153, 174, and 200 days old. In experiment 2, conidial suspensionsof U. atrum (1 x 10⁶ conidia ml-1) and G. roseum (1 x 10⁷ conidia ml-1) were applied at intervals oftwo to three weeks at a plant age of 109, 130, 151, 166, 179, 193, 207, 221, and 236 days. In anadditional treatment U. atrum was applied at intervals of four to six weeks at a plant age of 109, 151,179, 207, and 236 days. Chlorothalonil, tolylfluanid, prochloraz-manganese, iprodione, and iprodionewere applied in alternation when plants were 84, 106, 130, 160, and 225 days old.
z In the two experiments, 25 and 24 plants of each of four replicates were assessed. Means in the samecolumn and the same experiment with a common letter do not differ significantly (P < 0.05) according tolog-linear regression followed by t-tests.

158 Biological control of Botrytis spp. with Ulocladium atrum
A
0
0.2
0.4
0.6
0.8
1
1.2
1.4
140 160 180 200 220 240
SPLA
CI
ControlFungicidesG. roseumU. atrum
aa
ab
b bb
a
a
B
0
20
40
60
80
100
140 160 180 200 220 240
Dis
ease
inci
denc
e (0
-100
)
b
b
a
a
a
aa
b
C
0
1
2
3
4
5
140 160 180 200 220 240
Plant age (days)
Dis
ease
d pe
tiole
s pe
r pl
ant
a
a
b
b
b
Figure 31.Effect of treatments with Ulocladiumatrum, Gliocladium roseum, and afungicide programme on (A) spore-producing leaf area corrected for inten-sity (SPLACI); (B) disease incidence;and (C) disease severity of Botrytiscinerea on cyclamen plants cv SuperSerie under commercial growing condi-tions. Conidial suspensions of U.atrum (1 x 10⁶ conidia ml-1) and G.roseum (2 x 10⁶ conidia ml-1) wereapplied at a plant age of 133, 153,174, 189, and 205 days. Tolylfluanid,prochloraz-manganese, tolylfluanid,prochloraz-manganese, and iprodionewere applied in alternation when plantswere 112, 133, 153, 174, and 200days old. SPLACI is defined as theestimated equivalent number of leafblades per plant completely covered withconidiophores of B. cinerea, anddisease incidence is defined as the per-centage of plants with symptoms of B.cinerea; disease severity is defined asthe average number of petioles withsymptoms of B. cinerea per plant.Dotted lines represent remaining plantsafter heavily diseased plants had beenremoved at a plant age of 205 days.Twenty-five plants of each of fourreplicates were assessed. Values of thesame assessment date with a commonletter do not differ significantly(P < 0.05) according to logistic or log-linear regression followed by t-tests.(From: Köhl et al., 1998.)

Results 159
B
0
20
40
60
80
100
140 160 180 200 220 240 260
Dis
ease
inci
denc
e (0
-100
)
b
a
a
ab
b
b
C
0
1
2
3
4
5
140 160 180 200 220 240 260
Plant age (days)
Dis
ease
d pe
tiole
s pe
r pl
ant
a
b
a
b
b
Figure 32.Effect of treatments with Ulocladiumatrum, Gliocladium roseum and afungicide programme on (A) spore-producing leaf area corrected for inten-sity (SPLACI); (B) disease incidence;and (C) disease severity of Botrytiscinerea on cyclamen plants cv SuperSerie under commercial growing condi-tions. Conidial suspensions of U.atrum (1 x 10⁶ conidia ml-1) and G.roseum (1 x 10⁷ conidia ml-1) wereapplied at intervals of two to threeweeks at a plant age of 109, 130,151, 166, 179, 193, 207, 221, and236 days. In an additional treatmentU. atrum was applied at intervals offour to six weeks at a plant age of109, 151, 179, 207, and 236 days.Chlorothalonil, tolylfluanid, pro-chloraz-manganese, iprodione, andiprodione were applied in alternationwhen plants were 84, 106, 130, 160,and 225 days old. SPLACI is definedas the estimated equivalent number ofleaf blades per plant completely coveredwith conidiophores of B. cinerea,disease incidence is defined as the per-centage of plants with symptoms of B.cinerea; disease severity is defined asthe average number of petioles withsymptoms of B. cinerea per plant.Dotted lines represent remaining plantsafter heavily diseased plants had beenremoved at a plant age of 236 days.Twenty-four plants of each of fourreplicates were assessed. Values of thesame assessment date with a commonletter do not differ significantly(P < 0.05) according to logistic or log-linear regression followed by t-tests.(From: Köhl et al., 1998.)
A
0
0.2
0.4
0.6
0.8
1
1.2
1.4
140 160 180 200 220 240 260
SPLA
CIControlFungicidesG. roseumU. atrum (9x)U. atrum (5x)
a
b
ab
a
b

160 Biological control of Botrytis spp. with Ulocladium atrum
3.5.3.2 Biocontrol with U. atrum in different cropping systemsGrey mould occurred in all ten experiments with different cropping systems (Table32). Disease incidence (DI) at marketing ranged between 41% and 87% in the un-treated controls for experiments carried out in greenhouses 1-5 (Table 33), and wasabove 90% in the three experiments carried out in greenhouse 6 (data not shown).The experiments were not designed to compare the effect of different growingsystems or cultivars on B. cinerea development; therefore, no conclusions can bedrawn about the reasons for such a variable level of disease between experiments.
Table 32. Growing systems of cyclamen crops in greenhouses 1 to 6. (From: Köhl et al., 2000.)
Green-housenumber
Pot Plant arrangement Irrigation Heating
1 Clay Concrete floor Ebb and flow Additional tubes30 cm aboveplants
2 Plastic Tables Capillary matting
3 Plastic Tables; from plantage of 150 days ongutters
Top irrigation; from plantage of 150 days intermit-tent flow irrigation
4 Plastic Ground on poly-ethylene foil; fromplant age of 190days on gutters
Top irrigation; from plantage of 190 days intermit-tent flow irrigation
Additional tubes30 cm aboveplants
5 Plastic Tables Capillary matting plus topirrigation
6 z Clay Tables Capillary matting plus topirrigation
z Data of experiments not presented in Table 33.

Results 161
Table 33. Effect of treatments of cyclamen with Ulocladium atrum or fungicides on Botrytiscinerea disease development (AUDPC) and disease manifestation at marketable ageo.(From: Köhl et al., 2000.)
Treatment Disease development(AUDPC)
Disease manifestation atmarketing
DI p DS q DI DS
Greenhouse 1; cv Laser r
Untreated nd s nd 41 a t 0.8 aTween-water nd nd 45 a 0.9 aU. atrum 2x nd nd 17 b 0.3 b
Greenhouse 2; cv Super Serie u
Untreated 830 a 24 a 46 a 1.4 aTween-water 851 a 29 a 51 a 1.9 aCarbendazim/diethocarb,iprodione, iprodione
381 bc 7 bc 19 bc 0.4 bc
U. atrum 2x 643 ab 18 ab 34 ab 1.1 abU. atrum 4x 175 c 6 c 11 c 0.3 c
Greenhouse 3; cv Pastel v
Untreated 9424 a 279 a 87 a 5.5 abTween-water 9290 a 295 a 93 a 6.7 aIprodione 10001 a 330 a 96 a 7.4 aU. atrum 2x 8032 b 209 b 89 a 4.4 bcU. atrum 5x 7365 b 164 b 69 b 3.2 c
Greenhouse 4; cv Anglia w
Untreated 3424 a 64 a 52 a 2.0 aTween-water 2974 a 64 a 43 ab 1.5 abU. atrum 2x 1767 b 32 b 29 bc 0.7 bU. atrum 4x 1518 b 27 b 17 c 0.4 b
Greenhouse 4; cv Miracle x
Untreated 1954 a 42 a 70 a 2.3 aTween-water 1837 a 41 a 71 a 2.1 aU. atrum 2x 409 b 7 b 21 b 0.4 bU. atrum 3x 882 b 18 b 26 b 0.6 b

162 Biological control of Botrytis spp. with Ulocladium atrum
Table 33. Continued.
Treatment Disease development(AUDPC)
Disease manifestation atmarketing
DI p DS q DI DS
Greenhouse 5; cv Marvel y
Untreated 3011 a 92 a 76 ab 3.6 aTween-water 2841 a 89 a 78 a 3.2 aTolylfluanid 2555 a 69 ab 67 ab 2.6 aU. atrum 2x 1885 b 49 b 65 ab 2.4 aU. atrum 3x 1802 b 44 b 63 b 2.2 a
Greenhouse 5; cv Sierra z
Untreated 2409 b 54 b 78 a 2.7 aTween-water 3244 a 73 a 85 a 3.3 aU. atrum 2x 1577 c 27 c 51 b 1.2 bU. atrum 3x 1816 c 28 c 43 b 0.9 b
O U. atrum was applied as conidial suspension containing 0.01% Tween 80 at 1 x 10⁶ conidia ml-1. The
water control contained 0.01% Tween 80. No data provided for three experiments in Greenhouse 6where U. atrum or fungicides were not effective.
p Disease incidence (DI) measured as the percentage of plants with B. cinerea symptoms.q Disease severity (DS) measured as the number of leaves or flower petioles per plant with B. cinerea
symptoms.r Experiment started with 168-day old plants, and plants were marketable at 224 days. U. atrum and
Tween-water was applied at plant ages of 168 and 196 days (U. atrum 2x).s Not determined because DI and DS were assessed only three times.t Values of the same experiment within one column with a common letter do not differ statistically (LSD
test; = 0.05).u Experiment started with 77-day old plants and plants were marketable at 189 days. U. atrum was
applied at plant ages of 77 and 105 days (U. atrum 2x) or of 77, 105, 136, and 163 days (U. atrum4x). Tween-water was applied at plant age of 77, 105, 136, and 163 days. Carbendazim plus dithio-fencarb (as Sumico with 1 g l-1; at 250 g a.i. kg-1 and 250 g a.i. kg-1, respectively), iprodione (as Rovralwith 1 ml l-1; at 500 g a.i. l-1) and iprodione were applied in alternation at a plant age of 111, 125,and 153 days, respectively.
v Experiment started with 133-day old plants and plants were marketable at 263 days. U. atrum wasapplied at plant ages of 133 and 157 days (U. atrum 2x) or of 133, 157, 184, 211, and 240 days(U. atrum 5x). Tween-water was applied at plant ages of 133, 157, 184, 211, and 240 days. Ipro-dione (as Rovral with 1 ml l-1; at 500 g a.i. l-1) was applied at a plant age of 149 days.
w Experiment started with 126-day old plants and plants were marketable with 229 days. U. atrum wasapplied at plant ages of 126 and 154 days (U. atrum 2x) or of 126, 154, 182, and 208 days (U.atrum 4x). Tween-water was applied at plant ages of 126, 154, 182, and 208 days.

Results 163
x Experiment started with 119-day old plants and plants were marketable at 196 days. U. atrum wasapplied at plant ages of 119 and 147 days (U. atrum 2x) or of 119, 147, and 175 days (U. atrum3x). Tween-water was applied at plant ages of 119, 147, and 175 days.
y Experiment started with 140-day old plants and plants were marketable at 214 days. U. atrum wasapplied at plant ages of 140 and 167 days (U. atrum 2x) or of 140, 167, and 195 days (U. atrum3x). Tween-water was applied at plant ages of 140, 167, and 195 days. Tolylfluanid (as Euparen Mwith 1 g l-1; at 500 g a.i. kg-1) was applied at a plant age of 147 days.
z Experiment started with 140-day old plants and plants were marketable at 222 days. U. atrum wasapplied at plant ages of 140 and 167 days (U. atrum 2x) or of 140, 167, and 195 days (U. atrum3x). Tween-water was applied at plant ages of 140, 167, and 195 days.
When U. atrum was applied at four-week intervals, DI at marketing was signifi-cantly lower than in the water controls in seven of the ten experiments. In the threeexperiments carried out in greenhouse 6, five U. atrum applications at four-weekintervals showed no effect. Disease severity (DS) at marketing ranged between 0.8and 11.0 in the untreated controls in the ten experiments, with exceptionally highvalues above 7.0 in greenhouse 6. A significant reduction in DS after four-weeklyapplications of U. atrum was found for five experiments. Again there was no effectby U. atrum in greenhouse 6. The application of U. atrum twice at the beginning ofthe experiment was less effective on DI and DS at marketing when compared toapplications at four-week intervals when crops were marketed more than 60 daysafter the second treatment (greenhouses 2, 3, 4 and 6). Significant effects of U.atrum applications at four-week intervals were found on the disease progression asexpressed by AUDPC for both DI and DS in five out of the nine experimentswhere AUDPC could be determined. The significant effects of only two applica-tions of U. atrum at the beginning of the experiments were found more often ondisease development (AUDPC) than on DI and DS at marketing.Fungicide applications reduced DI and DS at marketing and AUDPC’s significantlyin greenhouse 2, but not in greenhouses 3, 5, and 6. In no case did fungicide appli-cations give a better control than U. atrum applied at four-week interval.
3.5.4 Experiments in Pelargonium
3.5.4.1 Visual assessmentAt the start of the experiments the stock plants had no necrotic leaves. However,when the plants grew older they gradually developed necrotic leaves. Their numberrose to about ten per plant at the end of the first experiment, and 16 for the secondexperiment. In the first experiment, the incidence of B. cinerea sporulation on thenecrotic leaves was only 4.4% for the control in week 50 (1996) and 8.3% in week10 (1997) (Fig. 33). However, only a fraction of colonised leaves was really covered

164 Biological control of Botrytis spp. with Ulocladium atrum
0
2
4
6
8
10
12
48 50 52 2 6 8 10Week number
% N
ecro
tic le
aves
with
B. c
iner
ea
Euparen MU. atrumControl
A
48 50 52 2 6 810
0
0.2
0.4
0.6
0.8
1
1.2
Seve
rity
of B
. cine
rea
Week number
Euparen MU. atrumControl
B
Figure 33. Effect of treatments (Control, Euparen M and Ulocladium atrum) on the developmentof Botrytis cinerea incidence (A) and severity (B) on necrotic leaves for the first experi-ment (1996/97). Incidence is expressed as percentage of the necrotic leaves on which B. ci-nerea occurs, severity as the equivalent number of leaves with maximum colonisation by B.cinerea. (See 2.2.5.3). (From Gerlagh et al., 2001.)
by B. cinerea (¼ and ¾ respectively), and the intensity of colonisation was far lessthan maximum (weight <1 in formula 1). This resulted in insignificant values for B.cinerea severity on the stock plants in the first experiment, with the exception of thefinal weeks (Fig. 33). For the control it reached a maximum of 0.36 in week 10against only 0.08 for the U. atrum treatment and less than 0.01 for the fungicidetreatment. However, due to high variation within treatments, differences were notstatistically significant (Table 34).In the second experiment about 80% of the necrotic leaves in both the control andthe U. atrum treatment were colonised by B. cinerea at the first sampling date (week

Tab
le 3
4.
Sum
mar
y of
sta
tist
ical
dat
a. T
he s
tatis
tica
l sig
nific
ance
is ind
icat
ed b
y F
val
ues.
Pro
babi
litie
s be
twee
n 0.
05 a
nd 0
.10
are
betw
een
brac
ket
s.P
>0.
10 i
s in
dica
ted
as n
.s.
(non
sig
nific
ant)
. Sin
ce s
tatis
tica
l an
alys
is i
s co
mpl
icat
ed b
y ze
ro v
alue
s so
me
wee
ks
had
to b
e ex
clud
ed f
rom
anal
ysis
; the
wee
ks
cons
ider
ed a
re in
dica
ted.
(F
rom
Ger
lagh
et al
., 20
01.)
Co
nid
ia x
% D
ead
cutt
ings
Cat
ego
rySe
veri
ty w
Nec
roti
cG
reen
Spo
re lo
ad y
4 w
eeks
6 w
eeks
4 w
eeks
z
1996
/’9
7T
reat
men
tn
.s.
(0.0
62)
0.00
20.
05<
0.0
010.
029
(0.0
82)
Wee
kn
.s.
0.01
80.
022
< 0
.001
0.00
3<
0.0
01<
0.0
01T
reat
*Wee
kn
.s.
0.04
7n
.s.
n.s
.n
.s.
0.00
6<
0.0
01W
eeks
co
nsi
d-
ered
6, 8
, 10
7, 1
17,
11
49,
51,
52,
3,5,
647
, 51,
9, 1
147
, 49
, 51
, 5,
7, 9
47, 5
, 7, 9
, 11
1997
/’9
8T
reat
men
t0.
006
0.03
40.
026
0.00
1<
0.0
01<
0.0
01W
eek
< 0
.001
< 0
.001
< 0
.001
< 0
.001
< 0
.001
< 0
.001
Tre
at*W
eek
< 0
.001
n.s
.n
.s.
< 0
.001
< 0
.001
< 0
.001
Wee
ks c
on
sid-
ered
43, 4
5, 4
7, 4
9,51
45, 4
9, 1
, 545
, 49,
1, 5
43, 4
7, 5
1, 3
41, 4
3, 4
5, 4
7,49
, 51,
1, 3
, 541
, 43,
45,
47,
49, 5
1, 1
, 3, 5
wS
ever
ity
of B
otr
ytis
cin
erea
on
necr
otic
leav
es.
xC
ount
s of
con
idia
on
necr
otic a
nd g
reen
leav
es r
espe
ctiv
ely.
yS
pore
load
(C
FU
of B
. cin
erea
) in
the
air
as
capt
ured
on
agar
pla
tes.
zC
utting
s w
ere
colle
cted
in
one
sepa
rate
gre
enho
use,
and
wer
e sc
ored
fou
r an
d si
x w
eek
s af
ter
thei
r co
llect
ion,
ex
cept
for
par
t of
the
cut
ting
s in
199
6/’9
7w
hich
wer
e pl
aced
in
the
sam
e co
mpa
rtm
ents
as
the
stoc
k p
lant
s (las
t co
lum
n).
Results 165
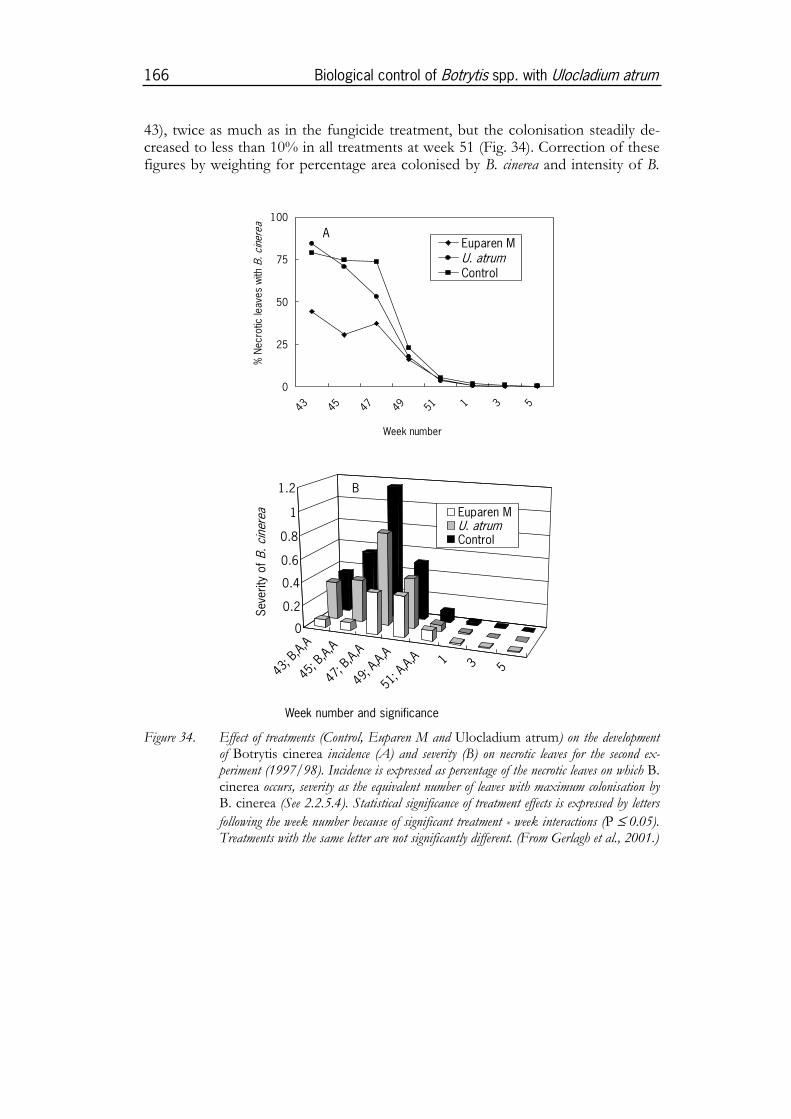
166 Biological control of Botrytis spp. with Ulocladium atrum
43), twice as much as in the fungicide treatment, but the colonisation steadily de-creased to less than 10% in all treatments at week 51 (Fig. 34). Correction of thesefigures by weighting for percentage area colonised by B. cinerea and intensity of B.
0
25
50
75
100
43 45 47 49 51 1 3 5
Week number
% N
ecro
tic le
aves
with
B. c
inere
aEuparen MU. atrumControl
A
43; B
,A,A
45; B
,A,A
47; B
,A,A
49; A
,A,A
51; A
,A,A 1 3 5
0
0.2
0.4
0.6
0.8
1
1.2
Seve
rity
of B
. cin
erea
Week number and significance
Euparen MU. atrumControl
B
Figure 34. Effect of treatments (Control, Euparen M and Ulocladium atrum) on the developmentof Botrytis cinerea incidence (A) and severity (B) on necrotic leaves for the second ex-periment (1997/98). Incidence is expressed as percentage of the necrotic leaves on which B.cinerea occurs, severity as the equivalent number of leaves with maximum colonisation byB. cinerea (See 2.2.5.4). Statistical significance of treatment effects is expressed by letters
following the week number because of significant treatment * week interactions (P ≤ 0.05).Treatments with the same letter are not significantly different. (From Gerlagh et al., 2001.)
Results 167
cinerea sporulation led to a peak severity of B. cinerea for the control at week 47. Atthe same time the other treatments peaked at a lower level (1.16, 0.80 and 0.35respectively for control, U. atrum and fungicide; Fig. 34). Effects of treatment, weekand their interaction were all highly significant (Table 34) for weeks 43 to 51. Inweeks 43 to 47, Euparen M treatment was more effective than U. atrum, which wasindistinguishable from the control.
3.5.4.2 Conidia trapped in the airIn the first experiment, significant numbers of B. cinerea conidia were trapped fromthe air only at two occasions. At week 51, the number was 4.3 per petri dish for thecontrol, 1.5 for U. atrum treatment and lowest (0.2) for the fungicide treatment(Fig. 35). On average for six samplings, the treatment effect was just significant,however, only the fungicide reduced the number of conidia compared to the con-trol. In the second experiment, a more regular pattern of numbers of conidia of B.cinerea was obtained. U. atrum treatment resulted in lower numbers of conidia of B.cinerea in the air than with the control in three out of four samples collected undersimilar conditions. However, fungicide treatment did not differ from control(Fig. 35).
3.5.4.3 Conidia counts on necrotic and green leavesBoth experiments showed a reduction of B. cinerea conidia on necrotic tissue and onyoung green leaves of stock plants by U. atrum and fungicide treatments comparedto control when assessed by counting conidia numbers (Fig. 36 and 37). Data basedon numbers of B. cinerea conidia per sample (the sampled leaves of all five plantsper greenhouse compartment put together), per gram of tissue (first experiment) orper surface area (second experiment) yielded similar results (data not shown).In the first experiment, only one sampling date (week 11) yielded significant num-bers of conidia of B. cinerea per sample on necrotic leaves of control plants(27.5 x 10⁶) (Fig. 36). U. atrum (1.3 x 10⁶) and fungicide (0.07 x 10⁶) suppressed B.cinerea. Only two samples of green leaves yielded enough spores for significant data.The control had its peak value at 5622 conidia per sample in week 11 against 119and 71 for U. atrum and fungicide treatments. The mean of weeks 7 and 11 was2510, 67 and 8 conidia per sample, respectively, and both U. atrum and fungicidetreatments significantly reduced the conidial count compared to the control.In the second experiment, high numbers of conidia of B. cinerea on necrotic leaveswere counted at several sampling dates from the start of the experiment, but theydecreased with time (Fig. 37). In week 45, the numbers were 86 x 106, 29 x 106
and12 x 106, respectively, for control, U. atrum and fungicide treatment. In week 5,only 4.5, 1.3 and 1.6 times 106 were found. On green leaves, the highest number ofconidia of B. cinerea for the control was 79 cm-2 in week 45. U. atrum and fungicidetreatments gave 30 and 14 conidia cm-2 at that date. On average over four sam-

168 Biological control of Botrytis spp. with Ulocladium atrum
plings, the reduction of number of conidia by U. atrum and fungicide treatmentscompared to control was significant, with values of 5.3, 5.5 and 13.2 respectively.
49 51 52 3 5 6
mean;
B,A,A
0
1
2
3
4
5
CFU
B. c
iner
ea p
er
petr
i dis
h
Week number, mean and significance
Euparen MU. atrumControl
A
43; A
,B,A
47; A
,B,A
51; A
,B,AB
3; A,B
,A
0
1
2
3
4
5
CFU
B. c
iner
ea p
er
petr
i dis
h
Week number and significance
Euparen MU. atrumControl
B
Figure 35. Effect of treatments (Control, Euparen M and Ulocladium atrum) on numbers ofconidia of Botrytis cinerea in the air of greenhouse compartments. The spore traps, ac-cording to Kerssies (1990), were incubated for 24 h. (A) Experiment 1996/’97. (B) Ex-periment 1997/’98. Statistical significance of treatment effects is expressed by lettersfollowing the week number in case of significant treatment * week interactions (P ≤ 0.05)or following the label ‘mean’ when the treatment effect but not the treatment * week interac-tion was significant. Treatments with the same letter are not significantly different. (FromGerlagh et al., 2001.)

Results 169
7;A,A
,A
11; B
,AB,A
0
20
40
60
80
100
Num
ber
of B
. ci
nere
a c
onid
ia
(x 1
,000
,000
)
Week number and significance
Euparen MU. atrumControl
A
711
mean;
B,B,A
0
2000
4000
6000
Num
ber
of B
. ci
nere
a co
nidi
a
Week number, mean and significance
Euparen MU. atrumControl
B
Figure 36. Effect of treatments (Control, Euparen M and Ulocladium atrum) on numbers ofconidia of Botrytis cinerea on (A) necrotic leaves (figures for a sample consisting of all ne-crotic leaves of five plants) and (B) young green leaves (figures for a sample of 25 leaves, fivefrom each of five plants) of stock plants. First experiment (1996/97). Statistical signifi-cance of treatment effects is expressed by letters following the week number in case of signifi-cant treatment * week interactions (P ≤ 0.05) or following the label ‘mean’ when thetreatment effect but not the treatment * week interaction was significant. Treatments withthe same letter are not significantly different. (From Gerlagh et al., 2001.)

170 Biological control of Botrytis spp. with Ulocladium atrum
45 49 1 5
mean;
B,B,A
0
20
40
60
80
100
Num
ber
of B
.ci
nere
a co
nidi
a (x
1,0
00,0
00)
Week number, mean and significance
Euparen MU. atrumControl
A
Figure 37. Effect of treatments (Control, Euparen M and Ulocladium atrum) on numbers ofconidia of Botrytis cinerea on (A) necrotic leaves (figures for a sample consisting of all ne-crotic leaves of five plants) and (B) young green leaves (figures expressed cm-2 leaf surfacearea for a sample of 25 leaves, five from each of five plants) of stock plants. Second experi-ment (1997/98). Statistical significance of treatment effects is expressed by letters followingthe label ‘mean’ since the treatment effect but not the treatment * week interaction was sig-nificant (P 0.05). Treatments with the same letter are not significantly different. (FromGerlagh et al., 2001.)
3.5.4.4 CuttingsCuttings were progressively killed by B. cinerea. At two weeks few cuttings werekilled, at four weeks a considerable number were dead, and at six weeks this num-ber was still higher.
45 49 1 5
mean;
B,B,
A
0
20
40
60
80
Num
ber
of
B. c
iner
ea c
onid
ia
(cm
-2)
Week number, mean and significance
Euparen MU. atrumControl
BB
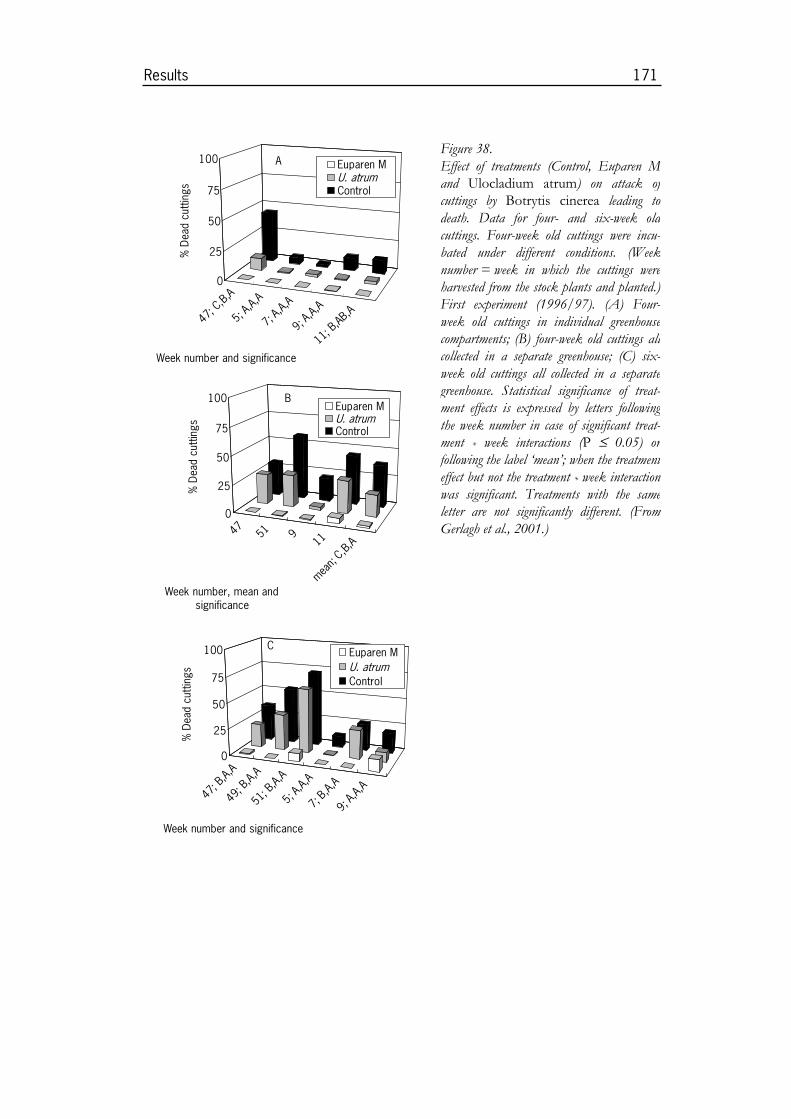
Results 171
47;C,B,A
5; A,A,
A
7; A,A,
A
9; A,A,
A
11;B,A
B,A
0
25
50
75
100
% D
ead
cutti
ngs
Week number and significance
Euparen MU. atrumControl
A
47 51 911
mean;
C,B,A
0
25
50
75
100
% D
ead
cutti
ngs
Week number, mean and significance
Euparen MU. atrumControl
B
47; B
,A,A
49; B
,A,A
51; B
,A,A
5; A,A
,A
7; B,
A,A
9; A,A
,A
0
25
50
75
100
% D
ead
cutti
ngs
Week number and significance
Euparen MU. atrumControl
C
Figure 38.Effect of treatments (Control, Euparen Mand Ulocladium atrum) on attack ofcuttings by Botrytis cinerea leading todeath. Data for four- and six-week oldcuttings. Four-week old cuttings were incu-bated under different conditions. (Weeknumber = week in which the cuttings wereharvested from the stock plants and planted.)First experiment (1996/97). (A) Four-week old cuttings in individual greenhousecompartments; (B) four-week old cuttings allcollected in a separate greenhouse; (C) six-week old cuttings all collected in a separategreenhouse. Statistical significance of treat-ment effects is expressed by letters followingthe week number in case of significant treat-ment * week interactions (P ≤ 0.05) orfollowing the label ‘mean’; when the treatmenteffect but not the treatment * week interactionwas significant. Treatments with the sameletter are not significantly different. (FromGerlagh et al., 2001.)

172 Biological control of Botrytis spp. with Ulocladium atrum
In the first experiment, the loss of cuttings due to B. cinerea attack was moderate,and fungicide treatment was more effective than U. atrum, whereas control had thehighest loss (Fig. 38). This was most pronounced with four-week old cuttings in
41;C,
A,B
43;B,
A,A
45;B,
A,A
47;B,
A,AB
49;A,
A,A
51;A,
A,A
1;A,A,
A
3;B,A,
AB
5;B,A,
AB
0
20
40
60
80
100
% D
ead
cutti
ngs
Week number and significance
Euparen MU. atrumControl
A
41; B
,A,A
43; C
,A,B
45; B
,A,A
47; B
,A,B
49; B
,AB,A
51; B
,A,AB
1; A,A
,A
3; B,A
,A
5; B,
A,A
0
20
40
60
80
100
% D
ead
cutti
ngs
Week number and significance
Euparen MU. atrumControl
B
Figure 39. Effect of treatments (Control, Euparen M and Ulocladium atrum) on attack of cuttingsby Botrytis cinerea leading to death. Data for four- and six-week old cuttings. (Weeknumber = week in which the cuttings were harvested from the stock plants and planted.)Second experiment (1997/98). (A) Four-week old cuttings all collected in a separategreenhouse; (B) six-week old cuttings all collected in a separate greenhouse. Statistical sig-nificance of treatment effects is expressed by letters following the week number because ofsignificant treatment * week interactions (P ≤ 0.05). Treatments with the same letter arenot significantly different. (From Gerlagh et al., 2001.)

Results 173
the separate greenhouse. For six-week old cuttings taken at week 51, maximumpercentage death was 72, 61 and 7%, respectively, for control, U. atrum and Eu-paren M treatment. With the exception of week 47, four-week old cuttings whichremained in the small individual greenhouse compartments tended to show lessattack by B. cinerea than those in the common (separate) greenhouse.In the second experiment, depending on the harvest date, already about 50% of thecuttings was dead within four weeks, and 65 to 87% of the cuttings of all harvestdates with both control and U. atrum treatment were killed at six weeks (Fig. 39).With 39 to 76% of the cuttings of any harvest date killed, the fungicide treatmentwas significantly better, although very high loss rates still occurred.
3.5.5 Experiments in pot roses
Two experiments were carried out with pot roses in a commercial greenhouse. Inboth experiments B. cinerea sporulated abundantly on senescent and dead leaves,but seldom killed cuttings. For all treatments except U. atrum the number of foci ofB. cinerea per pot in the first experiment varied between 1.33 and 1.43 in the firstexperiment. The U. atrum treatment significantly (P < 0.05) reduced this number to0.54 (Fig. 40). The sporulation index (SI) at the second assessment varied from16.5 for the U. atrum treatment to 34.1 for the non-treated control. Both controlshad significantly more sporulation than the treatment with the antagonist. WithSI = 26.1 the fungicide treatment did not differ from any of the other treatments(Fig. 41). Three B. cinerea isolates from the greenhouse showed equal linear growthon carbendazim amended agar as a resistant isolate, whereas a wild-type isolate ofB. cinerea (culture collection Plant Research International) did not grow at the rele-vant concentration of the fungicide (data not shown).Results of the second experiment showed a strong reduction of B. cinerea foci andSI by the use of fenhexamide as a fungicide, whatever its concentration. The effectdid not differ significantly from the effect of U. atrum (values for foci were 0.22,0.20 and 0.32, respectively). The mixture of the low concentration of fenhexamidewith U. atrum did not affect B. cinerea compared to the control (0.42 and 0.53, re-spectively; Fig. 42); neither did U. atrum alone. At the second assessment date theSI was extremely low for fenhexamide (0.7; Fig. 43). Fenhexamide at low dose,whether alone or as a mixture with U. atrum led to a significantly higher sporulationindex (5.0 and 6.3, respectively). U. atrum alone was somewhat less effective(SI = 10.0), but significantly better than the control (SI = 24.5).

174 Biological control of Botrytis spp. with Ulocladium atrum
Figure 40. Effect of treatment of pot roses on number of Botrytis cinerea foci per pot (first experi-ment) (Tween = water plus 0.01% Tween 80). Columns headed by the same letter are notstatistically different (LSD test; = 0.05). (From: Köhl and Gerlagh, 1999.)
0
10
20
30
40
Contr
ol
Twee
n
U. atr
um
Carb
enda
zim
B. c
iner
ea s
poru
latio
n in
dex
(0-1
00)
aa
b
b
Figure 41. Effect of treatment of pot roses on the sporulation of Botrytis cinerea (first experiment).Tween = water plus 0.01% Tween 80. Sporulation index = percentage area of leaf residuewith sporulating B. cinerea multiplied by the intensity of sporulation (scale 0 - 10) anddivided by 10). Columns headed by the same letter are not statistically different (LSD test; = 0.05). (From: Köhl and Gerlagh, 1999.)
0
0.5
1
1.5
Contr
ol
Twee
n
U. at
rum
Carb
enda
zim
Num
ber
of B
. cin
erea
foci a a
b
a

Results 175
0
0.2
0.4
0.6
water fenhex. fenhex.0.1
U. atrum fenhex.0.1 +U.a.
Num
ber
of B
. cin
erea
foci
bcc
abc
ab
a
Figure 42. Effect of treatment of pot roses on number of Botrytis cinerea foci per pot (second experi-ment). Fenhex. = fenhexamide; fenhex. 0.1 = fenhexamide at 10% of recommended dose;water = water plus 0.01% Tween 80). Columns headed by the same letter are not statisti-cally different (LSD test; = 0.05). (From: Köhl and Gerlagh, 1999.)
0
10
20
30
water fenhex. fenhex.0.1
U. atrum fenhex.0.1 +U.a.
B. c
iner
ea s
poru
latio
n in
dex
(0-1
00)
d
c
b
c
a
Figure 43. Effect of treatment of pot roses on the sporulation of Botrytis cinerea (second experi-ment). Fenhex. = fenhexamide; fenhex. 0.1 = fenhexamide at 10% of recommended dose;water = water plus 0.01% Tween 80. Sporulation index = percentage area of leaf residuewith sporulating B. cinerea multiplied by the intensity of sporulation (scale 0-10) and di-vided by 10). Columns headed by the same letter are not statistically different (LSD test; = 0.05). (From: Köhl and Gerlagh, 1999.)

176 Biological control of Botrytis spp. with Ulocladium atrum

4 Discussion

Discussion 179
4.1 Introduction
When our research on biological control of Botrytis spp. started in the early 1990’s, acontrol strategy was developed which differed from strategies commonly appliedusing chemical control or biological control methods interfering with diseases dur-ing the infection process. In this strategy only a short part of the pathogen life cycleis considered as target of control efforts. The control agent needs to persist on theplant tissue to prevent infection whenever pathogen inoculum arrives and condi-tions are suitable for infection. To achieve reliable control of infection, mecha-nisms of control agents must work quickly within the few hours needed by thepathogen for infection and must be persistently present on the plant tissue as longas new pathogen inoculum may arrive and tissue is susceptible to infection.Antagonists usually act much slower than fungicides. Furthermore, introducedpopulations of antagonists such as yeasts or bacteria on leaves often decrease rap-idly within a few days (Fokkema, 1971; Dik et al., 1991; Jongebloed et al., 1993).Only antagonists excreting strong antibiotics killing the target pathogen can achievethe rapid control needed to prevent infection.When studying the whole life cycle of pathogens other stages can be identifiedduring which antagonist applications may be more powerful if time periods of in-teractions are longer and other mechanisms than antibiosis can be exploited. In thecase of necrotrophic pathogens we expected suppression of pathogen sporulationon necrotic plant tissues to be a valid biocontrol strategy (Köhl and Fokkema,1998). Targeting biocontrol agents against specific stages of the life cycle of thepathogen needs antagonists with specific characteristics. Competitive substratecolonisation under the broad range of microclimatic conditions and persistenceduring long dry periods were identified as the key success factors for biocontrolagents targeting saprophytic pathogen development in necrotic tissues. Researchwas necessary in several steps to develop such a biocontrol system:(1) Epidemiological knowledge on diseases caused by Botrytis spp. in different
crops was necessary to identify valid target tissues (3.1; 4.2). Only if necrotictissues that are significant inoculum sources during Botryis epidemics can be tar-geted with a biocontrol agent such a strategy may result in disease control.
(2) Suitable antagonists with a high competitive ability during the colonisation ofvarious necrotic plant tissues had to be selected (3.2; 4.3).
(3) Antagonists with superior ecological competence had to be found (3.3; 4.4).(4) Knowledge on the mode of action of selected antagonists was needed to opti-
mise targeting and timing of antagonist applications to different target sub-strates of different crops (3.4; 4.5).
(5) The potential of the control strategy and applications of the selected antagonisthad to be studied under field and greenhouse conditions (3.5; 4.6).

180 Biological control of Botrytis spp. with Ulocladium atrum
These subsequent research steps have been carried out successfully. U. atrum hasbeen found to be an antagonist suitable for application on necrotic above-groundplant tissues and application strategies for U. atrum in several crops have been de-veloped to achieve significant disease control. Further steps are needed towardscommercial exploitation of the results by developing and marketing a biocontrolagent based on U. atrum (4.7).
4.2 Role of necrotic tissues in Botrytis epidemics
Conidia of B. cinerea are common atmospheric microbes (Gregory and Hirst, 1957).Main sources of conidia of B. cinerea are diseased plants of field crops or the naturalvegetation, plant debris and sclerotia. A certain background level of airborne co-nidia of B. cinerea may always be present in the field, even when no disease is pres-ent in the crop. Inoculum produced outside a crop may initiate an epidemic in afield crop, but once an epidemic has started and sporulation occurs inside the field,airborne inoculum from outside the field becomes relatively less important asshown by our experiment in onion (3.1).For other crops such as perennial strawberries and raspberries it has been demon-strated that necrotic plant tissue inside the crop serves as the main inoculum sourceduring an epidemic of B. cinerea (Braun and Sutton, 1987, 1988; Jarvis 1962a, 1962b,1962c; Jordan and Pappas, 1977; Miller and Waggoner, 1957). In kiwifruit orchards,senescing male flowers and prunings on the ground were found to be the mainsources of inoculum of B. cinerea (Elmer et al., 1993). A significant correlation wasfound between inoculum potential inside a plot and external kiwifruit contamination.Control of polycyclic diseases can be aimed at reduction of either initial or subse-quent inoculum. Disease control may only be achieved when the progression of anepidemic mainly depends on inoculum density and when control agents can reachmain sources of inoculum. Reduction of inoculum of Botrytis spp., which is producedoutside the crop is not feasible because inoculum sources are spread over large areas,but inoculum produced inside the crop, such as on crop debris or on sclerotia, couldbe accessible for biological control. Antagonists such as cold-tolerant Trichoderma spp.may destroy overwintering sclerotia (Köhl and Schlösser, 1989). A reduction of initialinoculum may delay disease development. Adee and Pfender (1989) demonstrated apositive relationship between the amount of local initial inoculum of Pyrenophora tritici-repentis and the disease progress curve of tan spot in wheat in field experiments withdifferent levels of primary inoculum. However, a 60 to 80% reduction of ascosporeformation as reached with applications of the antagonist Limonomyces roseipellis was notsufficient to control tan spot because of secondary conidiation (Pfender et al., 1993).For three other polycyclic pathosystems, including B. cinerea on Begonia semperflorens,Plaut and Berger (1981) found that initially low inoculum densities were compen-sated for by higher rates of disease increase compared to initially high inoculum den-

Discussion 181
sities. Thus, reduction of initial inoculum alone by biological control or other meansmay not always result in efficient disease control.Control strategies aimed at reduction of the initial inoculum and subsequent conidialinoculum of a polycyclic pathogen may be more successful because they interferewith the multiplication of the pathogen during the whole epidemic. Control of B.cinerea by suppressing sporulation was suggested by Jarvis (1962a, 1962c) by using achemical antisporulant or by means of plantation hygiene, which may limit potentialsporulation sites for B. cinerea. Jordan and Pappas (1977) suppressed sporulation of B.cinerea in the field by spraying fungicides on strawberry debris before flowering. Con-sequently, the number of conidia trapped with Rotorods inside treated plots duringflowering was drastically reduced and strawberry fruit rot was reduced by 66%.Braun and Sutton (1986) also controlled strawberry fruit rot by pre-blossom fungi-cide applications on dead host leaves.We studied the role of necrotic tissues in manipulative experiments for epidemics ofleaf spot in onion (3.1.1), grey mould in strawberry (3.1.2) and leaf rot in cyclamen(3.1.3). Necrotic leaves were identified as the important inoculum source of Botrytisspp. in onion and cyclamen but not in annual strawberries.
Onions. The artificial removal of necrotic leaves in an onion crop reduced the sporeload of B. cinerea above the experimental plots and retarded the epidemic of onionleaf spot compared to the control treatment (Fig. 2). The relationship between theamount of necrotic tissue as substrate for Botrytis to sporulate on, the spore loadabove a plot, and number of leaf lesions, indicated that the progression of the onionleaf spot epidemic largely depended on the rate of inoculum production inside thecrop (Fig. 3). From these relationships it can be concluded that application of an-tagonists to suppress sporulation of Botrytis spp. on necrotic leaf tissue could be aneffective strategy for biocontrol.The counts of spores recovered in traps positioned between the experimental plotsand at a distance of 18 m from onion plots indicated that there was a gradient in theconcentration of airborne spores for several meters away from diseased onions. Con-sequently, even though plots were separated by a 12-m buffer strip of sugar beet,interplot interference may have occurred during the experiments. A treatment at fieldlevel without interplot interference from nearby untreated control plots could haveresulted in even greater disease suppression in response to reduced spore productionin the plots.
Strawberries. Necrotic leaf tissue in the crop is the major source of conidial in-oculum for flower infection by B. cinerea in perennial strawberry crops (Jordan,1978; Braun and Sutton, 1987). The amount of necrotic leaf residue produced inannual strawberry crops in our experiments was much less than in perennial straw-berry production systems (3.1.2). The maximum we found was a necrotic leaf areaof about 150 cm2 per plant, which is equivalent to a dry weight of about 2 g per

182 Biological control of Botrytis spp. with Ulocladium atrum
plant (Table 2). In perennial crops, dry weights were found to vary between 10 and25 g (Sutton et al., 1988).Despite the considerable incidence of B. cinerea on senescent and necrotic leaves oftransplants (25 to 75%), the relatively low amount of necrotic leaf substrate for sporeproduction and the low levels of actual and potential spore production observed,suggest that necrotic leaves were not a major inoculum source of B. cinerea in theannual strawberry crops we studied. This conclusion is supported by the absence ofsignificant differences in the air load of conidia inside and outside the crops, andbetween crops with and without necrotic leaves (Table 1). In this respect the epide-miology of B. cinerea in the annual waiting-bed strawberry production system differsfrom the epidemiology as described for perennial and overwintering strawberrycrops.The incidence of B. cinerea on sampled flowers was high in almost all experiments.According to Braun and Sutton (1987, 1988) the inoculum for flower colonisation byB. cinerea in spring originates mainly from necrotic leaves inside the crop. We did notfind significant correlations between the incidence of B. cinerea on flowers and totalnecrotic leaf area present during flowering, the leaf area with potential sporulation ofB. cinerea, or predicted amount of sporulation based on colonised leaf area andweather conditions (Sosa-Alvarez et al., 1995) (Table 2). An explanation for the ab-sence of positive correlations is that the amount of conidia produced locally on ne-crotic leaves in the untreated plots was too low for a marked increase of theinoculum pressure as compared to its background level. The finding that removal ofall necrotic leaf tissue from strawberry plots did not affect the incidence of B. cinereaon flowers (3.5.1.1; Table 29; Boff et al., 2002) confirms this explanation. However,when conditions for symptom expression are suitable, the level of flower colonisa-tion determines the level of grey mould by B. cinerea, as demonstrated by the correla-tion between post-harvest grey mould and petal colonisation (Table 3). Controlstrategies for grey mould in annual strawberry cropping systems using waiting-bedtransplants should therefore aim to protect flowers from colonisation by inoculum ofB. cinerea.
Cyclamen. Necrotic tissue, dead due to senescence, is present in cyclamen cropsduring the second half of the growing period (Table 4). B. cinerea sporulation wastypically first observed on this type of leaf. Regular removal of the precursor of thistype of tissue, senescing, symptomless cyclamen leaves, resulted in a significant re-duction of the AUDPC (Table 5). Apparently, cyclamen leaves, dead from senes-cence, play an important role in the onset of disease. Saprophytic colonisation ofthese leaves by an antagonist could exclude later saprophytic colonisation by B. cinereaand result in a biocontrol effect. Mycelial contact infections from B. cinerea-colonisednecrotic tissue to the petioles that are the least resistant (Schlösser, 1978) and frompetiole to petiole could then generate the typical symptom of infected clusters ofleaves.

Discussion 183
Colonisation and subsequent sporulation of B. cinerea on necrotic leaf tissue of cy-clamen results not only in a high inoculum potential within the canopy of individ-ual plants but also increases the spore load within the greenhouse. It is likely thatmicrobial suppression of sporulation can be exploited for disease control within agreenhouse when all potential sources of spore production within a greenhousecompartment are treated. The application of antagonists may then affect thespreading of the disease within the canopy of the individual plant as well as be-tween plants.
4.3 Antagonist screening
The bioassay method developed for antagonist screening, based on interactionsbetween Botrytis spp. and antagonistic fungi on dead leaf tissue, was an effectivetool to select such antagonists (3.2.1). Onion leaves that senesced and driednaturally in the field were not suitable for standardised experiments because theyfrequently were already colonised by naturally occurring saprophytes. Symptomlessgreen leaves of field-grown onions that were killed by drying and subsequentlysterilised gave reproducible results in the bioassays. Senescing tissue of leavesattached to the plant contains lower amounts of nutrients than tissue of healthyleaves because during senescence nutrients are translocated to younger tissue(Baddeley, 1971) or because soluble nutrients are leached. Therefore, leaf segmentsused in bioassays were thoroughly washed to remove soluble nutrients creating asubstrate comparable to naturally senesced tissue. Under field conditions, necroticleaf tissue may already partly be colonised by Botrytis spp. before antagonists arrive.Therefore, leaves used in the bioassays were inoculated with conidia of Botrytis spp.8 to 24 h before antagonists were applied to select antagonists with strongcompetitive abilities.The method used to estimate sporulation intensity of Botrytis spp. gave reproducibleresults and was less time-consuming than counting conidia produced on the sub-strate per square centimetre. Because the estimated leaf area covered with conidio-phores correlated closely with the log-transformed numbers of conidia producedon the substrate (Fig. 4), this method was reliable to detect distinct reductions ofsporulation as were found in the bioassays. However, the method may not be ef-fective when antagonists affect the sporulation index (SI) only slightly in the upperrange of the scale. It is possible that moderately competitive antagonists suppressthe number of conidia produced per conidiophore of Botrytis spp. whereas highlycompetitive antagonists suppress chiefly the number of conidiophores produced bythe pathogen.Under constantly humid experimental conditions most of the antagonists sup-pressed sporulation of B. aclada efficiently in the initial screening experiments (Ta-ble 6). Complete inhibition of sporulation of B. aclada was common with a range ofantagonists even when dead leaves had been incubated with the pathogen for 24 h

184 Biological control of Botrytis spp. with Ulocladium atrum
before antagonists had been applied and the inoculum density of antagonists wasonly ten-fold of that of the pathogen. Only saprophytic fungi were included in thescreening that had been isolated from necrotic leaf parts or that belong to a groupof well-known antagonists, Trichoderma spp. and Gliocladium spp. Trichoderma spp.and Gliocladium spp. have been shown to be antagonistic against a wide range offungal pathogens (Papavizas, 1985) including Botrytis spp. (Dubos, 1992; Sutton etal., 1997). Saprophytes isolated from necrotic leaf tips of field-grown plants had tocompete with other naturally occurring saprophytes in the field during the fungalsuccession in the substrate. Thus, it could be assumed that such fungi show a highcompetitive saprophytic ability also in bioassays.Antagonists with high competitive saprophytic ability in necrotic leaf tissue may besuppressive to a wide range of Botrytis spp. and necrotrophic pathogens. While B.aclada was used in most of the experiments to select antagonists, antagonistsshowed the same differentiation of antagonism and sensitivity to interrupted wet-ness periods when tested with B. cinerea (Table 9). However, reduction of sporula-tion of B. cinerea was less compared to B. aclada when applied 24 h before theantagonists.The performance of antagonists under field conditions is determined mainly bytheir ecological competence. The environmental conditions of above-ground ne-crotic leaves are harsh for the development of both pathogen and saprophytic an-tagonists. Water availability, extreme temperatures, UV radiation and nutrientdepletion are among the factors limiting fungal development (Burrage, 1971; Diem,1971; Park, 1982; Rotem et al., 1985). Frequent and rapid fluctuations of the waterpotential may be highly restrictive for fungal development in the field, where peri-ods of leaf wetness or high humidity are usually interrupted daily by dry periods(3.3.1.1). In general, fungal hyphae, especially fungal germ tubes, are sensitive todry periods, but fungi can essentially differ in their potential to regrow and in thelag time needed for regrowth (Park, 1982). Antagonists aimed at suppression ofsporulation of Botrytis spp. and other necrotrophic leaf pathogens on necrotic leaftissue may only be reliable under field conditions if they are able to survive duringdry periods and to start regrowth rapidly with only short lag times after conditionsbecome favourable for fungal growth again. Bioassays with interrupted leaf wetnessperiods were suitable to differentiate antagonists according to their sensitivity todry conditions during the colonisation process.Two main factors determine the efficacy of antagonists after an interruption of leafwetness: (1) their mycelial growth rates and competitive ability at low water poten-tials during the drying process, and (2) their survival during, and rapid regrowthafter, dry periods when water potentials of the substrate are too low to allow fungalgrowth. Under our experimental conditions, the water potential of the dead leavesdecreased continuously after wet leaves had been placed on dry filter paper in openpetri dishes placed in a laminar flow cabinet. The drying process lasted approxi-mately 7 h until the water potential was lower than –12 MPa, at which fungalgrowth is slow or stops (Alderman and Lacy, 1984; Magan and Lacey, 1984; Magan

Discussion 185
and Lynch, 1986; Hocking et al., 1994). As a consequence, antagonists sensitive tolow water potentials may colonise the substrate to a lower extent and may not be ascompetitive as antagonists growing also at lower water potentials. Under the ex-perimental conditions, antagonists and Botrytis spp. also had to survive severalhours in the substrate at water potentials too low for fungal growth, so that as-pects of drought tolerance, growth at low water potential and survival during dryperiods were tested in combination in these bioassays.Antagonists originating from necrotic leaf tissue such as A. alternata and U. atrumwere highly antagonistic even after leaf wetness periods had been interrupted re-peatedly on three consecutive days (Table 7). On the other hand, soil-borne fungisuch as Gliocladium spp. and T. harzianum showed sensitivity to interrupted leaf wet-ness periods especially during the early stage of colonisation on the first day afterapplication. Germinating spores and germ tubes of these fungi may be more sensi-tive to dry periods than well-developed mycelium formed later during the colonisa-tion process.Antagonist screening was completed in subsequent experiments in which the per-formance of four selected antagonists, A. pullulans, C. globosum, G. catenulatum andU. atrum, under field conditions was studied using artificially killed lily leaves assubstrate. U. atrum germinated rapidly on dead lily leaves during the night afterspraying, provided temperatures during wetness periods were not below 10 °C(3.2.2; Table 10). Germination rates of almost 20% were reached within 4 h andgermination rates above 90% were found after wetness periods of 18 h. Germina-tion of ascospores of C. globosum was also high 18 h after spraying when leaf wet-ness periods lasted 15 h or longer. Almost no germination occurred when wetnessperiods were 9 h or shorter. Germination rates of spores of both antagonists werealso recorded during an experiment with onions at the same location (data notpresented). On naturally senescent leaf tips of field-grown onions, germination ofspores of U. atrum and C. globosum were comparable to those found on the dead lilyleaves fixed onto holders; they evidently were also highly dependent on favourablemicroclimatic conditions. Recovery of conidia of U. atrum was high after field ex-posure of five to six days. Apparently conidia of this antagonist were not washedoff the leaves during rainfall that occurred during all experiments except experi-ment 3. Germination of conidia of U. atrum was consistently higher in all experi-ments after five to six days than after 18 h. Thus, conidia may survive at leastseveral days under field conditions without losing their germination capacity. Dur-ing our experiments, conidia of U. atrum formed mycelium with a length of up to239 µm (Table 11). Length of germ tubes increased with total leaf wetness durationunless individual wetness periods were short, as during experiment 7.These findings indicate that hyphal tips of U. atrum may regrow after dry periodswith a short lag time. On the other hand, recovery of ascospores of C. globosum wasmostly low. Even when spores had germinated for more than 70% during the firstnight after spraying in experiments 2 and 8 (Table 10), such spores could not berecovered after five to six days. Spores of C. globosum may have been washed from
186 Biological control of Botrytis spp. with Ulocladium atrum
leaves during rainfall. Germination after five to six days under field conditionsranged between 0 and 10% in the nine experiments. Even in experiments whereleaf wetness periods longer than 15 h had occurred (experiments 6, 8, and 9), nohigher germination could be found. When applied to leaf surfaces, ascospores of C.globosum may rapidly lose their vigour to germinate under field conditions.The sporulation potential of B. cinerea was consistently lower on dead lily leaveswhen U. atrum had been applied (Table 12). The antagonistic effect of U. atrumoccurred in all microclimatic conditions during the period when leaves were ex-posed to field conditions. U. atrum seemed to survive during the long dry periods inexperiment 3 as well as during frequent but short wetness periods during experi-ment 7 and was able to colonise the substrate during the subsequent incubationperiod in moist chambers. Intensive substrate colonisation under field conditionswas found after long leaf wetness periods that occurred during experiments 2, 4, 6,8, and 9; as a result, the antagonist might suppress saprophytic growth of B. cinereaduring the field exposure period as well as during the subsequent incubation periodin moist chambers. Results of the field experiments show that U. atrum is welladapted to the rapid changes in the microclimatic conditions in the phyllosphereand is able to colonise necrotic leaf tissue. It can germinate rapidly with high ger-mination percentages. Germ tubes and hyphal tips seem to withstand dry condi-tions and regrow rapidly during wet conditions.C. globosum is a potential antagonist against a wide range of fungal pathogens. C.globosum has a high cellulolytic activity (Domsch et al., 1980) and produces potentialantifungal antibiotics (Di Pietro et al., 1992). Applications of conidia of the antago-nist to apple leaf litter prevented ascospore production of Venturia inaequalis andenhanced leaf decomposition (Heye and Andrews, 1983; Miedtke and Kennel,1990). C. globosum produces antifungal antibiotics that control apple leaf infectionby ascospores of V. inaequalis, without spore germination of the antagonist (Bou-dreau and Andrews, 1987).In our study, C. globosum reduced the sporulation potential of B. cinerea in three ex-periments and was competitive with Cladosporium-like fungi in two experiments. Inall cases where spores of C. globosum germinated with high percentages during thenight after field application, no antagonism was found later after incubation inmoist chambers. Although able to germinate during the first night after applicationif leaf wetness periods were longer than approximately 15 h, recovery of germi-nated or ungerminated spores was low after five to six days. In contradiction tothese low recovery rates, sporulation of B. cinerea was significantly suppressed by C.globosum after incubation of the dead lily leaves in moist chambers subsequent tothe field exposure period in the experiments 1, 5, and 7. The antagonist may havethe potential to germinate under the optimum conditions in moist chambers and alow inoculum density may be sufficient for a high antagonistic activity. Toxins al-ready present in suspensions applied to leaves can also explain antagonistic activitywith the presence of low densities of C. globosum. Toxins may be stable only undercertain environmental conditions (Boudreau and Andrews, 1987), resulting in vari-

Discussion 187
able antagonistic activities during the nine experiments, independent of the pres-ence of an actively growing population of C. globosum.The application of a combination of spores of C. globosum and U. atrum consistentlyreduced the sporulation potential of B. cinerea, but effects were less marked com-pared to applications of U. atrum alone. In combined applications, both fungi wereapplied in half the concentration of the suspensions used for applications of singleantagonists. Thus, the reduced effectiveness of combined applications of the twoantagonists may be explained by the lower inoculum rate of U. atrum applied. Incombined applications, toxins produced by C. globosum may also partly inhibitgrowth of U. atrum. However, germination of conidia of U. atrum was not lowerwhen applied in combination with C. globosum compared to applications alone (Ta-ble 12).Gliocladium spp. are antagonistic against many pathogens, including Botrytis spp.(Dubos, 1992; Papavizas, 1985; Sutton et al., 1997). Intensive research on the an-tagonistic potential of Gliocladium spp. and the closely related Trichoderma spp. re-sulted in the development of the biocontrol product Trichodex based on T.harzianum against B. cinerea (Elad et al., 1993). In our study, G. catenulatum did notcontrol sporulation of B. cinerea. Most of the ungerminated or germinated conidiamay not survive on necrotic leaf tissue under field conditions. Even if a limitedamount of the inoculum of the antagonist survives during field exposure, it maynot suppress sporulation of B. cinerea effectively if the pathogen already had colo-nised the dead leaf (Sutton and Peng, 1993). A high sensitivity of G. roseum to dryperiods was found by Park (1982). This was also found in bioassays on dead onionleaves in moist chambers (3.2.1.2; Table 7). Gliocladium spp. generally lost their ca-pacity to control sporulation of Botrytis spp. when wetness periods in the growthsubstrate were interrupted for several hours.A. pullulans is a common inhabitant of the phyllosphere of green and senescingleaves with a high tolerance to dry conditions (Hudson, 1971; Park, 1982). Theantagonistic potential of A. pullulans to prevent leaf infections of onion by Alter-naria porri was demonstrated by Fokkema and Lorbeer (1974). A. pullulans was notefficient in suppressing sporulation of B. cinerea in our experiments. In bioassays ondead onion leaves, this antagonist generally was less effective under optimum con-ditions than the other three antagonists used in our study (Table 12).Daconil M, a combination of the fungicides chlorothalonil and maneb, is a com-monly used product that protects crops such as lilies, tulips and onions effectivelyfrom Botrytis damage. In our experiments, the fungicides never affected Botrytissporulation on dead lily leaves. However, in three experiments with lily leaves ex-posed to field conditions for five to six days as well as in the experiment with anexposure period of 24 days, a reduction of Cladosporium-like fungi was found afterfungicide treatment. Cladosporium spp. may be more sensitive to one of the fungi-cidal compounds of the applied fungicide than Botrytis spp. A high efficacy of chlo-rothalonil against Cladosporium spp. on necrotic leaf tissue of Lolium perenne L. wasfound by Thomas and Shattock (1986). The ineffectiveness of the fungicides
188 Biological control of Botrytis spp. with Ulocladium atrum
against B. cinerea may be explained by the high adsorption capacity of chlorothalonilto organic matter. Chlorothalonil may have been adsorbed to cell walls in the ne-crotic tissue, inactivating the compound. Possibly, heavy rainfalls that occurredduring most of the experiments have also washed off the nonadsorbed fraction offungicides from dead leaves.During nine experiments in which dead lily leaves were exposed to field conditionsfor five to six days, U. atrum was the only antagonist that consistently suppressedcolonisation and subsequent sporulation of B. cinerea on dead lily leaves. The an-tagonist showed a great potential to colonise necrotic leaf tissue under field condi-tions and to survive adverse conditions in the field. U. atrum could compete with B.cinerea as well as with Cladosporium-like fungi as a main group of naturally occurringsaprophytes on necrotic leaf tissue. The same results were obtained in an additionalexperiment in which fungal development was examined after dead lily leaves hadbeen exposed to field conditions for 24 days without subsequent incubation inmoist chambers. The high saprophytic competitive ability of U. atrum makes thisfungus the most attractive candidate amongst fungi tested in the screening pro-gramme for the development of a biological control product against Botrytis spp.exploiting antagonistic interactions in necrotic plant tissues. To our knowledge, U.atrum had not been described as antagonist of Botrytis spp. or other fungal plantpathogens before.
4.4 Effect of environmental factors on U. atrum
Strong saprophytic competitive ability during colonisation of above-ground ne-crotic tissues depends on two parameters: (1) a high enzymatic activity for substrateutilisation (Berto et al., 2001), and (2) the adaptation to the harsh microclimaticconditions in the phyllosphere. Before applying antagonists in large-scale field ex-periments, their ecological attributes should be known in order to prevent failureunder the prevailing environmental conditions. In our studies, we investigated theeffect of different constant temperatures as well as constant and fluctuating waterpotentials. The persistence of conidia of U. atrum was followed under three verydifferent environmental conditions in field-grown lily and greenhouse-grown cy-clamen without and with top irrigation.
4.4.1 Temperature
No information was available in the literature on temperature requirements of U.atrum. For the closely related U. cucurbitae, an optimum temperature of 30 °C forconidial germination as well as for mycelial growth was reported (Zitter and Hsu,1992). Conidia of U. cucurbitae germinate quickly reaching a germination percentageof 90% within 2 h on water agar. In our experiments, we also found that conidia of

Discussion 189
U. atrum germinate rapidly (Fig. 8). Within 5 h a germination percentage of at least50% is reached over a broad temperature range (18 to 36 °C).The optimum temperature for germination was between 27 and 30 °C. Even attemperatures as low as 3 °C, conidial germination occurred within 24 h. The speedof germination was similar on both water agar and necrotic lily leaves. The rapidgermination of conidia of U. atrum over a broad temperature range may enable thisantagonist to produce sufficient hyphal biomass during the limited hours of leafwetness in the crop to establish itself in the substrate. In contrast, antagonistsneeding time periods for germination much longer than the average duration ofleaf wetness periods coinciding with low temperatures may suffer from interrup-tions of wetness periods before becoming established in the substrate and as a con-sequence may fail to colonise the necrotic tissue under such conditions.G. roseum germinated only in the presence of exogenous nutrients and not on wateragar. This may be due to the small size of the conidia, possibly containing only littlenutrient resources. The germination process of conidia of G. roseum was muchslower than that of U. atrum. At 15 °C, the mean temperature recorded during leafwetness periods under Dutch growing season conditions (3.3.1), G. roseum conidianeeded 24 h to reach a germination percentage of 50%. Conidia of U. atrumreached that level already after 6 h. Sutton and Peng (1993) also reported slowgermination of G. roseum conidia which required 48 h to reach 80% germination at10 °C. However, this fungus reduced sporulation of B. cinerea on necroticstrawberry leaf discs in bioassays over a broad temperature range between 10 and25 °C in their study. Jackson et al. (1991) found a temperature optimum formycelial growth between 25 and 30 °C for G. virens (currently reclassified asTrichoderma virens). A large variation in growth rates and antagonistic activity at lowtemperatures was found for closely related Trichoderma spp. (Köhl and Schlösser,1988; 1989). It may be possible also to select more cold-tolerant strains of G.roseum.Our results for Botrytis spp. mycelial growth are in accordance with other publisheddata showing that Botrytis spp. have a relatively low optimum temperature and areable to grow and sporulate in the range of temperatures that typically occur duringleaf wetness periods under Dutch growing conditions (Fig. 9). The optimumtemperature for flower infection of strawberry and berry infection of grapes by B.cinerea and for leaf infection of onion by B. squamosa is 20 °C (Bulger et al., 1987;Nair and Allen, 1993; Broome et al., 1995; Alderman and Lacy, 1983). Theoptimum for conidia production of B. cinerea on strawberry leaf discs and tomatostems was 17 °C (Sosa-Alvarez et al., 1995; O´Neill et al, 1997). At highertemperatures, conidia production decreased and was almost zero at 25 °C in theirstudies. Since spore production of Botrytis spp. was not determined over time in ourstudy, the data obtained from our bioassays give no information on the optimumtemperature for speed of sporulation.The bioassays conducted on dead onion leaves showed that U. atrum suppressedsporulation of B. aclada and B. cinerea over the entire temperature range studied (6 to

190 Biological control of Botrytis spp. with Ulocladium atrum
24 °C; Table 18). High antagonistic potential against B. cinerea, even at temperaturesas low as 1 °C, was found in the experiments with U. atrum on hydrangea leaves(Table 20). On cyclamen, control efficacy of U. atrum was also high at temperatureslower than 18 °C. Different from the results obtained on onion leaves, controlefficacy of U. atrum on cyclamen leaves was much lower at 18 °C or at higher tem-peratures in the repeat experiments (Table 19). In addition to conidia, B. cinerea alsoproduced sclerotia in both experiments. Sclerotia production increased with tem-perature and was significantly higher on control leaves. The formation of sclerotiaby B. cinerea may have resulted in reduced sporulation of the pathogen at highertemperatures especially on leaves of the control treatments. On the other hand,dead leaf tissues obtained from different hosts may have a differential effect on theoutcome of the competitive substrate colonisation by U. atrum and B. cinerea.The comparison of U. atrum and G. roseum in the bioassays on cyclamen leavesclearly showed that U. atrum was the more efficient antagonist at 18 °C or lowertemperatures whereas G. roseum was a better antagonist at temperatures higher than18 °C. Contradictory to the results obtained in bioassays, the shapes of curves fit-ted to data on mycelial growth rates on agar for the two antagonists were verysimilar (Fig. 9). U. atrum had the same high optimum temperature as G. roseum andthe decline of the U. atrum growth rate with declining temperature was similar tothat for G. roseum. Botrytis spp. had lower optimum temperatures for growth thanboth antagonists. The production and activity of enzymes involved in the colonisa-tion of necrotic leaf tissues by fungi or their growth on an artificial medium such asmalt extract agar may differ in their temperature requirements.Our experiments were carried out at constant temperatures but temperatures ofabove-ground necrotic tissues are characterised by rapid diurnal changes. UnderDutch growing conditions, temperatures recorded during leaf wetness periods of-ten fluctuate from below 5 °C at night to above 20 °C during daylight before thecanopy dries (Fig. 7). It has not been investigated whether such changes have anyadverse effect on growth rates of the pathogen or antagonists during the competi-tive substrate colonisation. Morton and Eggins (1977) found for several wood-inhabiting fungi that diurnal temperature cycles result in growth rates similar togrowth rates estimated from those determined at constant temperatures and noadverse effects of temperature fluctuations were found.The two antagonists compared in our study showed clearly different temperaturerequirements. U. atrum, although having the same high optimum temperature as G.roseum, was less affected by lower temperatures than G. roseum. U. atrum suppressedsporulation of B. cinerea in bioassays conducted at temperatures down to 1 °C. Con-sidering the temperatures recorded for leaf wetness periods under Dutch growingconditions and the temperature requirements of Botrytis spp. for substrate colonisa-tion and sporulation, U. atrum would therefore be a better antagonist than G. roseumfor applications in the open field or in greenhouse crops such as cyclamen grown atmoderate temperatures. Only under conditions with long leaf wetness periods withtemperatures above 18 °C in heated greenhouses, the application of the G. roseum
Discussion 191
isolate may result in a better control of B. cinerea sporulation than that obtainedwith U. atrum. The differential temperature requirements of both antagonists maypartly explain the higher antagonistic efficacy of U. atrum compared to a Gliocladiumsp. applied to necrotic lily leaves in the open field (3.2.2) and applied to cyclamencrops in cold greenhouses (3.5.3).
4.4.2 Water potential
Little information is available in the literature about the fate of germlings of sapro-phytic fungi in the phyllosphere. More information is published on leaf pathogensthat are exposed to periods of low water availability. However, in contrast to sap-rophytes, once the moist period is long enough for infection, pathogens may es-cape such adverse microclimatic conditions by penetrating host tissue. Bashi andRotem (1974) showed that pathogens developed different survival strategies undersemi-arid conditions. Phytophthora infestans rapidly penetrates host leaves to escapefrom dry conditions; Stemphylium botryosum f.sp. lycopersici produces drought-resistantgerm tubes. High drought resistance of germlings is also reported for other fungalleaf pathogens. The majority of germinated conidia of Venturia inaequalis survivedon apple leaves during dry periods, but survival was reduced compared to unger-minated conidia (Becker and Burr, 1994). Germlings of Cercospora kikuchii, causingleaf blight in soybean (Schuh, 1993), Botrytis cinerea, Cercospora musae and Moniliniafructicola survived dry periods (Good and Zathureczky, 1967). In contrast, germlingsof Botryosphaeria obtusa, causing leaf spot in apple, were extremely sensitive to inter-ruptions of leaf wetness and did not resume growth (Auruz and Sutton, 1990).Also, germinated pycnidiospores of Mycosphaerella pinodes were found to be sensitiveto interruption of leaf wetness period before appressorium formation on pea leaves(Roger et al., 1999).Survival of germlings during dry periods can differ for dematiaceous and hyalinefungi (Diem, 1971). A high percentage of germlings of dematiaceous fungi such asAlternaria tenuis, Stemphylium botryosum, Helminthosporium sativum and Cladosporiumherbarum survived dry periods (Diem, 1971), but germlings of hyaline species suchas Aspergillus sp., Penicillium sp. and Colletotrichum graminicola died during dry periods.Park (1982) compared the time fungal hyphal tips needed for regrowth after dryperiods. Phyllosphere-inhabitants such as A. alternata, Aureobasidium pullulans, B.cinerea, Cladosporium cladosporioides and Epicoccum purpurascens initiated hyphal tipgrowth within 60 min of moist incubation. Hyphal tips of soil fungi such as Fusar-ium solani, Gliocladium roseum, Humicola grisea and Trichoderma harzianum and storagefungi such as Penicillium spp. were all nonviable after a dry period. Park (1982)found that phylloplane fungi could not grow at a water potential below –15 MPabut survived under such conditions. Nonphylloplane fungi can seriously be af-fected by such low water potentials. Hjeljord and Tronsmo (pers. comm.) foundthat conidia of T. harzianum were killed when exposed to desiccation during germi-

192 Biological control of Botrytis spp. with Ulocladium atrum
nation and poorly germinated under greenhouse conditions on leaves (Hjeljord etal., 2000).It was known from earlier studies that U. atrum survives and successfully competeswith Botrytis spp. on necrotic leaves after interruptions of leaf wetness periods un-der controlled conditions (3.2.1) and in the field (3.2.2). However, the effect ofinterruptions of wetness periods on the development of germ tubes and the effectof low water potentials on conidial germination and competitive colonisation ofnecrotic leaves with Botrytis spp. has not been studied before. Water potential rela-tionships in fungi can be studied on artificial media in which the osmotic or matricconditions are altered by adding salts, glycerol or polyethylene glycol (PEG). Directeffects of these additions on fungal metabolism cannot be excluded and may ex-plain the interactions often found between water potential and additives when fun-gal development is quantified (Magan, 1988; Magan and Lynch, 1986). To avoidsuch interactions, methods were applied in our study to control the water potentialof a thin water agar layer via equilibrium with the relative air humidity, which wascontrolled by media with adjusted water potential, but separated from the fungalgrowth medium (Pfender et al., 1991).When conidia of U. atrum were incubated on water agar slides, the speed of germi-nation and the estimated maximum germination (upper asymptote C) decreasedwith decreasing water potential (Table 14; Fig. 10). Endogenous nutrients play acrucial role during germination under water stress and the establishment of theantagonist Epicoccum nigrum after application in the field (Pascual et al., 1996). Co-nidia of the U. atrum inoculum used in the present study may contain differentamounts of endogenous nutrients, possibly accumulated during maturation. As aconsequence, the fraction of conidia with low nutrient level may remain ungermi-nated under stress conditions.Germinating conidia were not killed when humid incubation was interrupted byone dry period and the maximum germination percentage (C) was the same forconidia incubated with or without an interruption of moist conditions (Table 15;Fig. 11). Significant differences were found for the time needed to reach 37% ofthe level of the maximum germination percentage (point of inflection M). Afterincubation at –10 MPa, conidia and germ tubes needed 1.6 to 2.3 h longer to takeup water again from the surrounding humid air and to start regrowth when theywere first incubated under moist conditions for 2 to 8 h, as compared to the con-trol conidia incubated without interruption of the moist period. Thereafter, thespeed of the germination process (slope parameter B) showed no statistically sig-nificant difference between treatments. Conidia incubated first at –42 MPa neededlonger to start regrowth (Table 16; Fig. 12). The delay for conidia that had an initialmoist incubation, was 1.3 to 4.3 h longer than for conidia incubated without inter-ruption of the moist period. The speed of germination tended to be slower withlonger initial incubation period under moist conditions. Conidia initially incubatedfor 4 to 6 h under moist conditions needed longer periods to continue with germi-nation than conidia incubated initially for 2 or 8 h under moist conditions. It can be

Discussion 193
concluded that pregerminated conidia of U. atrum survive a dry period but continuethe germination process at lower speed after such a dry period. The most vulner-able stage is reached after an initial moist incubation period at 18 °C of 4 to 6 h,when the germination percentage was 0 to 10% and germ tubes were shorter than20 µm. Conidia were more stressed when incubated with two or three moist/drycycles resulting in a slower germination process as compared to conidia incubatedwith or without a single dry interruption of moisture (Table 17; Fig. 13). However,germinated conidia survived the repeated moist/dry cycles and reached the samehigh maximum germination percentage as conidia incubated without a moist/drycycle.Conidia incubated without or with one or three moist/dry cycles had the samenumber of germ tubes. After moist incubation following dry periods, germ tubelength significantly increased as compared to their length before dry periods, whichindicates that conidia of U. atrum do not produce new germ tubes after dry periodsbut that the existing germ tubes already formed during the initial humid periodcontinued growth. In contrast to our results, renewed germination was found byDickinson (1981) for Alternaria alternata, closely related to U. atrum. Our attempts tofollow viability and growth of individual germ tubes more directly failed. Tech-niques using vital stains such as fluoresceine diacetate (FDA) were not reliablesince germ tubes showed no reaction directly after a dry period but the same germtubes were stained after several hours of moist incubation. A reliable differentiationbetween living and dead germ tubes during dry periods was not possible. Attemptswere also made to measure the speed of hyphal tip growth by following individualgerm tubes in time during and after dry periods. Therefore, video-microscopycombined with automated image analysis was used. However, germ tubes rapidlygrew out of focus and germ tube length could not be measured.To study the antagonism of U. atrum against B. cinerea at different water potentials, amethod was developed which guaranteed a constantly controlled water potential ofthe substrate. Conidia were applied to glass slides in water suspensions which wasallowed to evaporate before the conidia came into contact with the necrotic leaveswith adjusted water potentials; hence, the water potential of the leaves was notchanged. The results show that U. atrum can successfully compete with B. cinereanot only under conditions of optimum water availability but also when water avail-ability is suboptimal (Table 21).This study into the effect of moist/dry cycles on germinating conidia of U. atrumand the effect of different constant water potentials on conidial germination andantagonism against B. cinerea, together with earlier studies (3.2.1, 3.2.2), demon-strates that U. atrum tolerates water stress and thus is adapted to the ecologicalniche of leaf surfaces and above-ground necrotic tissues. The results help to under-stand the fate of conidial inoculum of the antagonist after field applications. Basedon this knowledge on the ecological competence of the antagonist, applicationfrequencies and densities can be optimised to achieve sufficiently high population
194 Biological control of Botrytis spp. with Ulocladium atrum
densities of the antagonist on the target substrates with economically sound dos-ages.
4.4.3 Persistence of conidia
U. atrum survived for several days on necrotic tissues in the field without any lossof germination capacity and results indicated that U. atrum conidia were not af-fected by microclimate conditions during that time (3.2.2). In order to gain a betterunderstanding of the behaviour of U. atrum in the phyllosphere, we obtained in-formation in subsequent studies on the density, survival and colonisation ability ofU. atrum conidia on the green leaf surfaces of cyclamen grown in greenhouses un-der different irrigation regimes (3.3.5.1 and 3.3.5.2) and of Asian lilies in the field asinfluenced by (1) the vertical nature of the lily canopy, and (2) the duration of ex-posure to field conditions (3.3.5.3).The number of U. atrum conidia cm-2 on green lily leaves at the top and middlecanopy levels was not significantly different (experiment 1) immediately after U.atrum application to lily microplots with a propane powered backpack (Fig. 20a).However, conidia density was significantly less on green leaves at the lower canopylevel compared to the middle and top levels. In the second experiment, the numberof conidia was significantly different at each level of the canopy (Fig. 20b). In bothexperiments the number of conidia detected on leaves at the bottom level of thecanopy was 20% (experiment 1) and 18% (experiment 2) of the number depositedonto leaves at the top of the lily canopy. An uneven vertical distribution of antago-nist inoculum may have significant epidemiological consequences since primaryinfections in host canopies may commence on the older leaves at the bottom of thecanopy where host and microclimate conditions are likely to be more conducive toinfection and sporulation. These results indicate that the spraying system used inthese studies resulted in uneven vertical distribution of antagonist inoculum in thelily canopy and that further evaluation of application methods may be required toimprove penetration of the antagonist suspension.After antagonist application, the number of U. atrum conidia on green leaf surfacesdeclined at a similar rate at each canopy level in both experiments (Fig. 20). Thisresult is in contrast to earlier findings in 1994 which indicated that a loss of U.atrum conidia from the top of the lily canopy coincided with an accumulation ofconidia on the bottom leaves of the canopy (Köhl et al., unpublished). The 1994growing season was characterised by more frequent rain events than in 1995 andindicates that rain splash may be an important mechanism for redistribution ofantagonist inoculum. Rain splash has been shown to be an efficient mechanism forspreading large numbers of pathogen propagules from a source of inoculum butthe relative role of rain and wind dispersal has only been described for somepathogens (Fitt et al., 1989; Vloutoglou et al., 1995). The relative importance of rainversus wind as a dispersal mechanism for redistributing antagonists such as U.

Discussion 195
atrum is poorly understood. The use of molecular markers may enable better inves-tigation of the spatial and temporal dynamics of U. atrum as was recently reportedfor the antagonist Trichoderma harzianum (Bowen et al., 1996).The number of U. atrum conidia on green lily leaf surfaces after 21 days exposure tofield conditions declined substantially by 70% and 73% in experiment 1 and 2,respectively (Fig. 20). Only one significant rain event was recorded over the dura-tion of these experiments and suggests that other factors may also be responsiblefor the movement of conidia. The use of stickers in fungicide formulations iscommon and has improved chemical persistence on plant surfaces. The formula-tion of U. atrum used in these studies was a spore suspension in water with Tween80 and it is likely that improved adhesion of antagonist spores could be achieved byimproving the formulation of the antagonist suspension.Germination of U. atrum conidia on green leaves in the field reached a maximum of81% and 60% seven days after antagonist application in experiment 1 and 2 (Ta-ble 23). Field germination was lower in experiment 2 than in experiment 1. Resultsobtained in earlier studies (3.2.2) suggested that germination on necrotic leaf sur-faces was dependent upon the duration of leaf wetness and temperatures above10 °C. Low temperatures during the wetness periods were reported to hampergermination. In the first seven days of experiment 1, five leaf wetness periods withan average duration of 17.1 h were recorded (Table 22). The average temperatureduring the leaf wetness periods was 17.9 °C. In contrast, the average duration ofleaf wetness in the first seven days of experiment 2 was 6.7 h with an average tem-perature of 14.8 °C. Shorter leaf wetness duration may have been the factor re-sponsible for a reduction of conidia germination on green lily leaf surfaces.Long-term survival on green leaf surfaces is a necessary attribute for many success-ful saprophytic species since spores that land on the leaf surface must wait for theonset of senescence in order to penetrate the host tissue. Conidial viability (germi-nation potential) declined slightly (100 to 88%) after seven days exposure to fieldconditions (mean of three canopy levels, experiment 1). Thereafter, there were nosignificant changes in germination potential even after 21 days (Table 23). Germi-nation potential was significantly higher on leaves from the bottom level of the lilycanopy (experiment 1), but germination potential was not affected by canopy levelin experiment 2. It is possible that direct exposure to UV radiation may increaseconidial mortality and host tissue shading may provide some protection. Sporesurvival in the field was also reported to be greater on the underside of leaves thanon the upper leaf surfaces (Ceasar and Pearson, 1983; Rotem et al., 1985). Thissuggests that there is a need to study further U. atrum survival on the underside ofleaves at different canopy levels.The success of a potential antagonist is not only dependent upon antagonist in-oculum remaining viable for prolonged periods of time but also on retention ofcellular functions required for rapid colonisation of the host substrate. In ourstudy, we found a significant decline in the capacity of germ tubes to produce newextension growth, indicating a loss of germling vigour, when U. atrum conidia were

196 Biological control of Botrytis spp. with Ulocladium atrum
incubated in a high humidity chamber after an exposure to field conditions for 21days on green leaves (data not presented). In addition, the number of new germtubes arising from conidia exposed in the field for 21 days was also significantlyreduced. A reduction of germ tube development may affect the ability of U. atrumto remain competitive in the phyllosphere and subsequently colonise host tissue atthe onset of senescence.In our study the ability of surviving U. atrum inoculum on green leaf surfaces tosuccessfully colonise necrotic tissues was measured after paraquat induction ofnecrosis on tagged green leaves. Colonisation by U. atrum was consistently higheston necrotic leaves at the top level of the canopy and consistently lower on the ne-crotic leaves sampled from the bottom canopy level in both experiments (Fig. 21).This pattern was also consistent for all times of necrosis induction and indicatesthat the density of U. atrum conidia on the green leaf surface prior to artificial in-duction of necrosis had a profound effect on the level of necrotic lily leaf colonisa-tion. Necrotic leaf colonisation by U. atrum decreased over time (Fig. 21) from 51%(averaged over the three canopy levels) when necrosis was induced immediatelyafter antagonist application (day 0) to 21% (averaged over the three canopy levels)when necrosis was induced 21 days after antagonist application (experiment 2). Asignificant decline in colonisation may have been due to a combination of factors.Conidial density declined significantly over time and regression analysis indicated asignificant relationship between U. atrum density on green leaves, prior to artificialinduction of necrosis, and subsequent U. atrum colonisation of necrotic lily tissue(Fig. 22). A reduction in germination potential, germ tube elongation and numberof germ tubes per conidium may have also contributed to a decline in colonisationafter 21 days in the field.The ability of U. atrum inoculum to compete with common saprophytic species onartificially induced necrotic tissues was measured. When necrosis was induced im-mediately after antagonist application (Table 24 and 25, day 0, experiment 2), U.atrum completely colonised necrotic lily leaves and outcompeted commonly occur-ring saprophytic Alternaria spp. and Cladosporium spp. The ability of U. atrum tosignificantly reduce colonisation by Alternaria spp. and Cladosporium spp. was main-tained throughout the 14 days (Cladosporium spp.) and 21 days (Alternaria spp.) ofeach experiment. The reduction of Alternaria spp. colonisation on necrotic tissueswas generally less on leaves at the bottom level of the canopy. Lower numbers ofU. atrum conidia reaching the bottom leaves of the canopy may account for a re-duction of competitive ability since basic ecological principles state that the effectsof competition are density-dependent (Begon et al., 1986; Kessel, 1999). Our re-sults suggested that when the density of U. atrum was relatively low (approximately1000 conidia cm-2), the reduction of Alternaria spp. colonisation compared to thewater treatment was not significant. This is potentially important information andindicates that high densities of U. atrum conidia (approximately greater than 4000cm-2) on green leaves should be maintained to ensure that colonisation by naturallyoccurring saprophytes is effectively suppressed. Such high numbers are practical

Discussion 197
and were achieved immediately after field application to the top leaves of the can-opy (experiment 1) and the top and middle leaves in experiment 2. This informa-tion is required in order to optimise U. atrum frequency of application andapplication methodology.In our study we found that U. atrum had the ability to survive and persist in the lilyphyllosphere for up to 21 days in the field. In addition, U. atrum colonised artifi-cially induced necrotic tissues and competed successfully against naturally occurringsaprophytes on Asian lily leaves in the Netherlands. Unfortunately, Botrytis spp.were not present in our experimental plots in 1995, so that the effect of persistingU. atrum inoculum on colonisation of necrotic lily tissue by Botrytis spp. could notbe quantified.Our studies into the persistence of U. atrum conidia on cyclamen leaves undergreenhouse conditions demonstrated that propagules of this antagonist have thepotential to survive on the surface of green leaves for at least seventy days underdry conditions (3.3.5.1). When such green leaves senesced seventy days after theantagonist application and thus became available as substrate for saprophytic colo-nisation by both B. cinerea and U. atrum, propagules of the antagonist still had thepotential to compete successfully with the pathogen (Fig. 16). Because the amountof B. cinerea inoculum on the leaves was not standardised during the experiments,the amount of suppression obtained with antagonist propagules exposed to green-house conditions for different time periods cannot directly be compared.At the beginning of the study on conidial persistence in cyclamen canopies it washypothesised that U. atrum may be less effective in situations where top irrigation isapplied since conidia may be washed off. Furthermore, top irrigation, especially incombination with capillary matting, results in a higher relative humidity within thecanopy and thus may favour B. cinerea (Grantzau and ter Hell, 1993). On the otherhand, during periods with low relative humidity in the greenhouse, top irrigationwill result in leaf wetness periods of only a few hours allowing conidia of U. atrumto germinate. Under these alternating conditions such germinated conidia may be-come exhausted after several wet/dry cycles because of insufficient nutrient supplyand thus be lost.No indications were found that top irrigation affected the persistence of U. atruminoculum (3.3.5.2). Under these conditions, a significant part of the conidia had theability to attach to green leaves of cyclamen and to survive (Fig 17 to 19). An an-tagonistic activity of the U. atrum propagules against B. cinerea in necrotic tissuecould even be found when conidia had been sprayed onto green leaves ten weeksbefore necrosis was induced by removing the leaves from the plants. Given thatleaves were allowed to senesce slowly under dry conditions during the six weeksafter removal from the plant, U. atrum retained its antagonistic potential for a totalof sixteen weeks after application. These findings on the persistence of U. atrumpropagules confirm the results obtained in lilies in the open field (3.3.5.3).
198 Biological control of Botrytis spp. with Ulocladium atrum
4.5 Mode of action of U. atrum
Two different studies were carried out to elucidate the mode of action of U. atrumantagonism against Botrytis spp. Firstly, ultrastructural observations on the interfer-ence between saprophytically growing B. aclada and U. atrum were made (Köhl etal., 1997). Observations on three other antagonists were included in this study forcomparison. Secondly, the mechanistic principles behind the interaction between B.cinerea and U. atrum were elucidated by studies on internal substrate colonisationusing a recently developed technique for immunolocalisation of fungal mycelium innecrotic tissues (Kessel et al., 1999) and external sporulation in time series experi-ments. Results were integrated in a dynamic simulation to check the validity of thehypothesis of nutrient competition as the prevailing antagonistic mechanism be-tween B. cinerea and U. atrum (Kessel, 1999).
4.5.1 Fungal interactions: microscopical and ultra-structural
studies
All four antagonists tested in this study suppressed sporulation of B. aclada almostcompletely in the bioassay on necrotic onion leaves. This agrees with resultsobtained earlier (3.2.1) that had shown the relative biocontrol potential ofAureobasidium pullulans, Chaetomium globosum, Gliocladium catenulatum and Ulocladiumatrum. However, microscopic observations of the interactions have highlightedsome important differences among the four fungi in terms of their antagonisticactivity against B. aclada. This information is of key importance in establishing therespective behaviour of the antagonists and how this behaviour can influence thepossible success of biocontrol of Botrytis spp.Based on our light and electron microscope studies, A. pullulans grew in a yeastlikemanner. Clusters of cells, most probably blastospores, were formed on the leafsurface or inside stomata whereas hyphae were rarely found inside the tissue. Thiscan be explained by the limited formation of hyphae in solid media by this dimor-phic fungus (Andrews et al., 1994). Considering this colonisation pattern, it is un-likely that nutrient competition within the substrate would play a major role inantagonism since the substrate would only be depleted locally at the site wherecolonies are formed. On the other hand, A. pullulans could be an efficient antago-nist for the protection of leaf surfaces and man-made wounds, as previously re-ported (Falconi and Mendgen, 1994; Fokkema and Lorbeer, 1974). The in vitroproduction of antibiotic compounds by A. pullulans has been described (Bhatt andVaugham, 1963; McCormack et al., 1994). In the present work, in the rare instanceswhere close contact between A. pullulans and B. aclada was found, our observationsappeared to support a chemical antibiosis by A. pullulans (Fig. 26).The colonisation of dead onion tissues by C. globosum was poor and its hyphae weremostly restricted to the leaf surface. However, the ultrastructural studies indicated
Discussion 199
that this antagonist, which is known for its strong cellulolytic activity (Domsch etal., 1980), has the potential to degrade plant cell walls (Fig. 25). C. globosum waspreviously found to be antagonistic against several plant pathogens such as Pythiumultimum (Di Pietro et al., 1992) and Venturia inaequalis (Heye and Andrews, 1983)and is known to produce two antifungal substances (Di Pietro et al., 1992). Theproduction of antibiotics by C. globosum may also explain its antagonistic activityagainst B. cinerea under certain field conditions regardless of the presence of anactively growing population of the antagonist on the substrate (3.2.2). In our ultra-structural studies, highly disorganised fungal cells were associated with cells of C.globosum, whereas such dead cells were not found when the antagonist was grownalone. This would support the manifestation of an in situ antibiotic activity by C.globosum. However, it was not possible to confirm whether these dead cells be-longed to B. aclada, but it can be assumed, supported by the information given inthe literature and our observations, that the antagonist did induce cell death of B.aclada. Because of its limited colonisation potential, it would appear that antibiosis,if not exclusively, is at least an important component of the biocontrol ability of C.globosum.In previous experiments, G. catenulatum displayed strong antagonism against Botrytisspp. under continuously moist conditions favourable for fungal growth (3.2.1). Ourstudies revealed that G. catenulatum could colonise all parts of necrotic tissues, butthat this colonisation was not very extensive. Nevertheless, colonisation of B. acladawas considerably reduced in the presence of the antagonist. Antibiosis was clearlyone of the modes of action of G. catenulatum based on cell reactions of B. acladawhich were typical of toxic activity such as cytoplasm degradation and loss of tur-gor pressure (Fig. 24) (Hjlaoui et al., 1994; Yoder, 1980). No clear signs of hyper-parasitism such as cell wall degradation at sites of contact between hyphae of thetwo organisms were found. While no information is given in the literature aboutthe mode of action of G. catenulatum, such information abounds about other speciesof Gliocladium and the closely related Trichoderma spp. (Chet, 1987; Papavizas, 1985).For instance, G. virens has been described as an antibiotic producer and its activityagainst P. ultimum and R. solani is strongly related to the antibiotics it produces(Howell and Stipanovic, 1995). Di Pietro et al. (1993) suggested that enzymes suchas beta-glucanases provided a synergistic effect with the toxins but evidence ofhydrolytic activity of G. virens in situ has never been reported. In addition, whilesome Trichoderma spp. have been shown to degrade their host cells enzymatically, itis well established that they produce a number of antibiotic substances (Ghisalbertiand Sivasithamparam, 1991). In the chronological events associated with the an-tagonism of T. harzianum against B. cinerea, Bélanger et al. (1995) showed that anti-biosis preceded penetration and suggested that the enzymatic cell wall degradationwas more a saprophytic action than the cause of death in B. cinerea.In the case of U. atrum, there were no previous reports on microscopic studies ofthe colonisation of necrotic plant tissue or possible mechanisms of antagonism bythis fungus. U. atrum mycelium was found to be present and distributed throughout

200 Biological control of Botrytis spp. with Ulocladium atrum
necrotic leaf tissues and B. aclada seemed to be completely excluded from thatniche. Ultrastructural studies showed that U. atrum degraded plant cell walls activelyso that it could grow through the dead plant cells walls (Fig. 23a, b). Because B.aclada could not be detected in necrotic leaf tissues in the presence of U. atrum, itwas not possible to determine if antibiosis and/or parasitism complemented itscompetition for substrate in onion leaves. However, when the interaction betweenboth fungi was studied on agar, there were no obvious signs of hyperparasitism orantibiosis as the fungi seemed unaltered (Fig. 23c, d).
4.5.2 Competitive substrate colonisation: experimental studies
and simulation modelling
The dynamics of internal mycelial colonisation were found to follow logisticgrowth patterns. The logistic equation is the most widely used equation to describethe evolution of biomass in fungal solid fermentation (Smits, 1998). However, largestandard errors and observed decline of colonisation levels in the latest phases ofthe process urge for some reservation regarding this conclusion. The large standarderrors may be due to the variable nutritional status of the cyclamen leaves used forthe study. B. cinerea and U. atrum displayed similar colonisation patterns and maxi-mum colonisation levels within experiments. The nutritional status of the necroticcyclamen leaves was thus equally stimulating or hampering both fungi and did notresult in a competitive advantage for B. cinerea or U. atrum. Necrotic leaves in cy-clamen and especially in other crops are likely to differ significantly in their nutri-tional composition. Consequently this must be taken into account when assessingthe perspectives for biocontrol of B. cinerea using U. atrum. The decline in colonisa-tion levels observed after reaching carrying capacity was supported by visual obser-vations. Autolysis of cell walls, initiated in the ageing mycelium by nutrientdeprivation as described for Schizophyllum commune (Wessels and Sietsema, 1984) is alikely cause of this phenomenon.The mechanistic principles behind the interaction of U. atrum and B. cinerea wereanalysed using head start experiments. Factors potentially influencing the outcomeof a replacement experiment such as active host resistance, host susceptibility orpathogenicity factors (Newton et al., 1998) are unlikely to interfere in necrotic tis-sue. Potential effects of inoculum density on the competitive interaction (Firbankand Watkinson, 1985; Snaydon, 1991) were not taken into account. The choseninoculum densities represented a worst case scenario for the antagonist with realis-tic conidial densities for U. atrum and unrealistically high conidial densities for B.cinerea.The position of the two experimental RY lines and the RYT line in Fig. 27, whichis located well above the reference line for equal inter- and intraspecific competi-tion, implies that the available resources for U. atrum in a necrotic cyclamen leafinclude all the essential resources available to B. cinerea plus a small amount of re-
Discussion 201
sources specifically available to U. atrum. Alternatively, U. atrum could benefit fromby-products of enzymatic degradation of the tissue by B. cinerea, which would oth-erwise not have been available to the antagonist.The hypothesis on nutrient competition as the dominant antagonistic mechanismbetween B. cinerea and U. atrum and on the nutrient utilisation spectra of both fungiwere checked using simulation. In general, comparison of experimental and modelresults supported the hypothesis of nutrient competition as the dominant competi-tive mechanism between U. atrum and B. cinerea. A major difference between modelresults and experimental results was found in the shape of the RYT line. The ex-perimental RYT line (Fig. 27), based on sporulation, was convex whereas themodel RYT lines (Fig. 28), based on mycelial biomass, were horizontal straightlines. The convex shape of the experimental RYT line indicates a less than propor-tional reduction of sporulation of U. atrum and B. cinerea in competitive situations(Fig. 28) and thus a stimulating effect of competition on sporulation. Alternatively,the convex shape of the RYT line could be caused by (1) by-products of enzymaticdegradation of the tissue produced by one of the species and beneficial to the other(Rayner and Webber, 1984), or (2) differences in metabolic capabilities of the fungiduring their development. The shape of the RYT line also indicates that toxins areunlikely to be involved in the competitive relationship between U. atrum and B.cinerea. In case toxins would have been involved the RYT line would be concaveand fall below 1 (Fig. 27; Braakhekke, 1980).Competitive interactions comprise interactions based on primary resource captureand combative interactions. For the present system we find that (1) B. cinerea and U.atrum both belong to the primary colonisers of necrotic plant tissue; (2) mycelialcontact between both species does not negatively affect the mycelia (3.4.1; Köhl etal., 1997); (3) U. atrum and B. cinerea grow and sporulate in mixed cultures; (4) U.atrum pre-emptively colonises necrotic cyclamen leaf tissue and excludes B. cinerea;and (5) the outcome of the race for resources between B. cinerea and U. atrum innecrotic cyclamen tissue can be decided within the very first phase of the colonisa-tion process. All these facts point towards a competitive interaction based on pri-mary resource capture.Both studies (Köhl et al., 1997; Kessel, 1999) indicate that U. atrum relies exclu-sively on competition for gaining access to its ecological niche over Botrytis spp.The ability to colonise and to utilise necrotic tissues rapidly may enable U. atrum toexclude competitors from the substrate without any other antagonistic interaction.These findings may have practical implications for the proper timing of applicationof the antagonist and for predicting its limitations. Most efficient control of sub-strate colonisation and subsequent sporulation of the pathogen may be achieved onfreshly senesced tissues or in freshly pathogen-induced lesions where mycelium ofthe pathogen is not established in high density to allow profuse sporulation. Sincethe antagonist seems to lack the ability to kill fungal cells by toxins or by hyper-parasitism, a curative application of U. atrum would be unlikely to reduce thepathogen population already established in high densities. However, nutrient com-
202 Biological control of Botrytis spp. with Ulocladium atrum
petition resulting in reduced spore yields of the pathogen may also play a role whenU. atrum colonises substrates where Botrytis mycelium is already established.The exploitation of biological control agents with mechanisms that are mainlybased on competition for nutrients and space can provide distinct advantagesagainst necrotrophic plant pathogens that rely on their saprophytic phase for estab-lishing a critical base population. Firstly, the antagonistic interaction is not specificfor certain pathogen-antagonist relationships. For example, U. atrum is known tocompete with and suppress sporulation of a range of Botrytis species and other sap-rophytic fungi such as Cladosporium spp. and Alternaria spp. (3.2.2; Köhl et al.,1995b). Secondly, there is no strict necessity for the simultaneous presence of an-tagonist and pathogen. The antagonist can utilise the limited amounts of nutrientsin necrotic tissues long before the pathogen arrives and thus restricts access to thesubstrate. Organisms acting strictly by hyperparasitism depend on the presence ofthe pathogen for activity. In addition, the process can be relatively slow and oftenonly activated when the pathogen itself is under stress. In the case of antibiosis,while efficient against biotrophs such as powdery mildews (Paulitz and Bélanger,2001), it is also subject to a precise timing of release against necrotrophs becauseantibiotics produced early before arrival of the pathogen may be degraded or maybe adsorbed to cell surfaces (Boudreau and Andrews, 1987). Thirdly, it is unlikelythat resistance against competition will be developed by Botrytis populations. Thispoint is of particular significance considering the ability of B. cinerea to developresistance against fungicides (Gullino, 1992; Rosslenbroich and Stuebler, 2000).This phenomenon was also reported against two antibiotics produced by Bacillussubtilis after nine subsequent crops of Astilbe had been sprayed with the antagonist(Li and Leifert, 1994).
4.6 Use of U. atrum for disease control in crops
4.6.1 Strawberries
U. atrum was effective in reducing grey mould at harvest in at least one spray pro-gramme per experiment in four out of seven experiments (3.5.1). In experiments 3and 7, U. atrum failed to show an effect on grey mould, probably due to the lowincidence of grey mould (1.4 and 2.2%, respectively).Compared to applications during flowering only, season-long applications of U.atrum resulted in an improved control of grey mould at harvest only in one out offive experiments (Table 27 and 28). Bhatt and Vaughan (1963) studied the biocon-trol of grey mould in strawberry by Cladosporium spp. The effect of the fungus onreduction of fruit rot at harvest was attributed to prevention of establishment of B.cinerea on the senescent and dead flower organs of strawberry. The same mecha-nism may be involved in the interaction between U. atrum and B. cinerea. In this

Discussion 203
case, targeting applications to flower parts would be effective to reduce B. cinereainfection. Moreover, the small amount of necrotic leaves produced inside annualstrawberry crops may mean that the inoculum produced on these tissues does notplay an important role in the epidemiology of grey mould in such cropping systems(3.1.2; Boff et al., 2001). This could explain the limited additional effect of U. atrumtreatments before flowering, although the antagonist is able to colonise and sup-press the sporulation of B. cinerea on dead strawberry leaves (Berto et al., 2001;Köhl et al., unpublished). Crop sanitation by removing senescent and necrotic leaftissue in our system did not reduce Botrytis infection in comparison to the untreatedcontrol as it did in similar experiments in onion crops (3.1.1) and in another peren-nial strawberry system using raised beds (Mertely et al., 2000).Shorter application intervals of U. atrum may result in better control. In the straw-berry crops new flowers are produced each day and flower parts start to senesceafter three to five days. Since the mode of action of U. atrum is by substrate com-petition (3.4; Kessel, 1999), the antagonist should reach the site of colonisation onthe flower parts before or at the same time as the pathogen. This explains the needof frequent applications to reach all flowers at an early stage.U. atrum tested under low disease pressure in the field showed its potential to con-trol grey mould by regularly spraying conidia from transplanting or floweringthrough to the beginning of fruit ripening. Further studies should evaluate the per-formance of the antagonist on strawberry crops under conditions more favourableto grey mould development. In such experiments, treatments with other antago-nists described for grey mould control in strawberry, such as Gliocladium roseum (syn.Clonostachys rosea) (Sutton, 1994) and Paenibacillus polymyxa (Helbig, 2001) should beincluded for comparison. The integrated use of U. atrum together with Serratiaplymuthica antagonistic to several soilborne diseases of strawberry (Kurze et al.,2001) should also be investigated. Testing bees or bumble bees as vectors for U.atrum application to strawberry flowers is another attractive option in future exeri-ments (Sutton, 1994; Kovach et al., 2000).
4.6.2 Onion
Spray applications of conidia of U. atrum resulted in colonisation of necrotic onionleaves under field conditions (3.5.2). This was demonstrated in ten subsequentexperiments with artificially killed leaves exposed on onion plots. Colonisation ofnecrotic leaf tissue by U. atrum resulted in significant reduction of colonisation ofother naturally occurring saprophytic fungi such as Alternaria spp. and Cladosporiumspp. It can be assumed that under conditions more conducive for Botrytis spp. alsocolonisation of onion leaf tissue by Botrytis spp. may be lower after U. atrum treat-ments as observed in similar experiments on lily leaves exposed to field conditions(3.2.2).

204 Biological control of Botrytis spp. with Ulocladium atrum
On necrotic leaf tissues of onion crops, at one sampling date substantial sporula-tion of Botrytis spp. was observed after additional moist incubation of leaf tissuesduring both experiments. For this single observation a clear reduction in the po-tential to sporulate was found for leaves from U. atrum or Ronilan-treated plots.This indicates that crop treatments with U. atrum may lower the risk of rapid build-up of epidemics. Results on aerial load of Botrytis spp. conidia confirm this conclu-sion (Table 30). Although not visually observed on sampled leaf tissues, Botrytisspp. produced and released conidia as proven by the significantly higher spore loadof Botrytis spp. above control plots as compared to the spore load outside experi-mental plots above the buffer crop. Treatments with U. atrum significantly reducedthe aerial spore load of Botrytis spp. down to levels as found above the buffer crops.This proves a substantial reduction of sporulation by U. atrum within the onioncrop.Competitive colonisation of necrotic onion leaf tissue by U. atrum suppressed colo-nisation and sporulation of Botrytis spp. in treated plots, which may result in aslower epidemic of onion leaf spot. Although leaf spot epidemics were mild in bothyears, U. atrum and Ronilan-treated plots tended to have lower amounts of leafspots as compared to water-treated plots (Fig. 30). In summary, results show thatU. atrum has the potential to slow down epidemics of leaf spot under field condi-tions. However, further research is needed under more severe disease pressure toinvestigate the relevance of this finding for commercial onion production.Sporulation of U. atrum was not observed on leaf tissues if not further incubated ina moist chamber. Conidia of U. atrum were not trapped with Rotorods. The level oftissue colonisation by U. atrum of artificially killed leaf segments exposed after sprayapplications on U. atrum treated onion plots did not differ from U. atrum colonisa-tion of leaf tissues exposed on plots not treated with U. atrum (Fig. 29). These re-sults indicate that the antagonist may not spread secondarily in the crop aftersporulation. Repeated applications of the antagonist may thus be necessary.Under controlled conditions, U. atrum suppressed sporulation of different Botrytisspp. including B. cinerea, B. aclada, (3.2.1; Nielsen, 2000) and B. squamosa (Köhl et al.,unpublished). Further studies in field-grown onions should include assessments ofthe possible effect of U. atrum on B. aclada to obtain information on the potential ofthe antagonist to also control neck rot caused by B. aclada (Maude, 1984).
4.6.3 Cyclamen
Regular application of conidial suspensions of U. atrum (1 x 10⁶ conidia ml-1) sup-pressed the incidence and severity of B. cinerea rot in cyclamen under commercialgrowing conditions (3.5.3.1; Fig. 31). Increasing the intervals between applicationsof the antagonist from two to four weeks in the second experiment resulted insimilar control levels of disease incidence and disease severity (Fig. 32). Regularapplications of conidial suspensions of G. roseum (2 x 10⁶ conidia ml-1) suppressed

Discussion 205
the disease half as effectively as U. atrum (experiment 1) and were similar to U.atrum treatments when applied at 1 x 10⁷ conidia ml-1 (experiment 2). Such antago-nist applications reached control levels similar to those of the standard fungicideprogramme used by the grower.The results of the experiments in the different commercial greenhouses (3.5.3.2)show that U. atrum controls B. cinerea when sprayed at four-week intervals (Ta-ble 33), except when the disease pressure of B. cinerea was extremely high as ingreenhouse 6. Under such conditions even fungicide applications did not controlthe disease.No indications were found that top irrigation, as applied in greenhouses 3, 4, 5 and6, affected the efficacy of U. atrum applications. This finding is in line with the re-sults obtained in experiments where the survival of U. atrum conidia in the cycla-men canopy was monitored in a growing system with top irrigation (3.3.5.2; Fig. 17to 19).Further experiments under commercial growing conditions with antagonist appli-cations only to green leaves in an early growth stage of the cyclamen crop areneeded and may provide information as to whether propagule survival of U. atrumis sufficient for a persistent disease control during cyclamen production. Such earlyapplications will reduce labour costs, especially because an overhead treatment ofthe plants will be sufficient to reach all surfaces. An individual treatment of theheart of the plant as necessary for fungicide or antagonist application during thelater developmental stage of the plants will then not be necessary. An early applica-tion of U. atrum on plants before the dense canopy is formed also reduces the riskof black spots from dried droplets of the conidial suspension on marketable plantsas found when plants are sprayed a couple of weeks before marketing.
4.6.4 Pelargonium
B. cinerea severity on stock plants. The experiments have been performed dur-ing two seasons at periods considered risky for development of B. cinerea epidemics.Due to high RH in greenhouses in autumn, senescent and necrotic leaves of gera-nium stock plants are easily colonised by B. cinerea. The start of the first experimentwas rather late, which caused the experiment to partly escape from the high hu-midity which usually prevails during October to December. The few necrotic leavesduring the first weeks of the experiment had a low percentage B. cinerea incidence,and the intensity of the pathogen was low (Fig. 33). A cold and dry spell in themiddle of the experimental period reduced B. cinerea still further, but towards theend of the experiment the percentage of necrotic leaves colonised by B. cinerea andthe intensity of colonisation increased again. In combination with a higher numberof necrotic leaves this led to the highest B. cinerea severity to occur at the end of theexperiment. The second experiment started earlier and developed a higher inci-
206 Biological control of Botrytis spp. with Ulocladium atrum
dence of B. cinerea on necrotic leaves of the stock plants, leading to a high B. cinereapressure in the first half of the experimental period (Fig. 34).
B. cinerea spores in the air. The results of the spore traps to monitor the inocu-lum pressure in the greenhouse air did not correspond to the severity of B. cinerea asvisually assessed, nor to the more precise counts of B. cinerea spores on necrotic andgreen leaves (Fig. 35). The average numbers of colonies formed per petri dish after24 h exposure are very low indeed. This is the more striking since the plates werealso exposed on days of manipulation of the stock plants for spraying or collectionof cuttings. At such occasions clouds of spores are to be expected (Hausbeck andPennypacker, 1991a, b). Also, the significant suppression of the B. cinerea spore loadby the fungicide in the first experiment and by U. atrum, but not the fungicidetreatment in the second experiment cannot be explained.
B. cinerea conidia counts on necrotic and green leaves. The counts of conidiaof B. cinerea on necrotic and green leaves, both in the first and second experimentare in full agreement with each other (Fig. 36 and 37). They consistently show sup-pression of the pathogen by the antagonist as well as by the fungicide. In both ex-periments these estimates of B. cinerea severity show highest values in the weekswhen visual estimates of the stock plants gave highest values too. In the first ex-periment the number of conidia of B. cinerea on green leaves is low; in the second itis several times higher. The data of the two years as presented cannot be compareddirectly, since only in the second year the number of spores was more accuratelyscored per cm2. However, a comparison is possible by multiplication of the1997/’98 data by 14.8, the average surface area of green leaves measured in thesamples, and 25, the number of leaves per sample. This calculation shows thatcontrol leaves had about twice the spore load in 1997/’98 as in 1996/’97, but in theU. atrum and fungicide treatments the difference is a factor 100 (means of twosamples in 1996/97: control 2510, U. atrum 67, fungicide 8; means of four samplesin 1997/98 after correction: control 4884, U. atrum 2035, fungicide 1961).
Death of cuttings. Cuttings of geranium may get infected by B. cinerea on thewound surface, or through contamination of the young top leaves with conidia.Normally, green leaves are not readily infected by conidia without exogenous nutri-ent supply, but very young geranium leaves show increased susceptibility comparedto older ones (Sirjusingh et al., 1996). December is also the month with light at aminimum, which causes poor conditions for cutting vigour, leading to increasedsusceptibility to B. cinerea as demonstrated by Shtienberg et al. (1998) in shadingexperiments with tomato. In the first experiment low B. cinerea inoculum pressurein the middle of the experiment, combined with increasing daylength may be heldresponsible for relatively low loss of cuttings due to B. cinerea. The second experi-ment started earlier, and B. cinerea on stock plants was present at a high level forseveral weeks at the beginning of the experiment. Contamination of cuttings with

Discussion 207
conidia of B. cinerea, as represented by the counts of spores on green leaves, washigh in November/December 1997, which, in combination with poor light condi-tions, may explain the extremely high loss of cuttings.The higher contamination in the second year might explain the high percentagescuttings killed even for U. atrum and fungicide treatments in experiment 2 (Fig. 39).The reduction of the number of spores of the pathogen on green leaves by thesetreatments compared to the control seems effective in the first, but not in the sec-ond experiment. Two factors may account for this. First, a minimum number ofconidia is required for infection, even of highly susceptible young leaves (Sirjusinghet al., 1996). Second, when inoculum pressure is high the significant reductionbrought about by U. atrum or fungicide may not yet be enough for a substantialreduction of infection. It is generally observed with biological control that the ef-fect is better at low than at high disease pressure (cf. McQuilken et al., 1990). In thetwo experiments described it seems that the spore load in the first experiment wasoften below the critical level, even in the control. In the second experiment it wasabove the threshold, even in the U. atrum and fungicide treatments.
Integrated control. The results of the present experiments show a potential for U.atrum in an integrated programme. Several management practices can lead to lessenthe pressure of B. cinerea. A dry atmosphere is primordial. This can be obtained bychanges in greenhouse climate by plastic on the soil or heating under the planttables (Hausbeck and Moorman, 1996; Hausbeck et al., 1996), or by lower plantdensity. Hausbeck et al. (1996) have shown that the combination of two practices,plastic cover and heating, was much more effective than a single treatment, thougheach intervention on its own resulted already in a significant effect. An additionaldecrease in spore production by B. cinerea by application of the competitor U. atrummay be another contribution to reduce the spore contamination of the cuttings. Itcould well cause a strong effect by bringing the pressure of B. cinerea under thecritical threshold, and thus positively affect the success rate of cuttings.
4.6.5 Pot roses
In both experiments treatment of pot roses with U. atrum resulted in effective con-trol of B. cinerea (3.5.5; Fig. 40 and 42). In the first experiment the fungicide car-bendazim was not effective at all. This has to be attributed to the resistance of thegreenhouse population of B. cinerea to this specific fungicide. In the second trial thefungicide Teldor (fenhexamide) proved highly effective, even at a dose of 10% ofthe recommended concentration. It even surpassed the effect of U. atrum.The positive results of the present experiments hold promise for a potential practi-cal application of U. atrum as a biocontrol agent replacing fungicides in the produc-tion of pot roses. This is in agreement with other observations (Yohalem, 1997;2000). There may be a potential risk, however, of wound infection by a saprophyte
208 Biological control of Botrytis spp. with Ulocladium atrum
on the fresh pruning wounds of pot roses. In the present production system wehave delayed the treatment with U. atrum to one day after pruning, and we havenever observed any damage by the biological control agent.In a related crop, cut roses, B. cinerea is a great problem with certain cultivars insome periods of the year. The cropping system in greenhouses is such that cleaningand pruning the plants leaves a mass of vegetative tissue such as stem pieces andleaves on the soil. This results in colonisation by saprophytes, but also by B. cinerea,and consequently a heavy spore load of the pathogen in the air. The risk in thiscase lies in contamination of the flowers. Post-harvest handling of the flowers cre-ates conditions which often induce colonisation of rose petals by B. cinerea, leadingto brown specks, which may coalesce and finally cause rotting of the completeflower. The commercial circuit is very sensitive to this type of unacceptable dam-age. Growers may be able to reduce the risk of flower contamination by treatmentof vegetative residues with U. atrum, thus limiting sporulation of B. cinerea and re-ducing the spore load in the air. Trials on this aspect are expensive, because theyneed to be done at the scale of whole greenhouse compartments. But the problemto be solved is sufficiently important to plead for further research in this direction.
4.6.6 Other crops or diseases
The potential of U. atrum to control Botrytis spp. has been tested in several othercrops such as tomato, grapevine and lily, and against several other pathogens invarious crops.In tomato, B. cinerea is causing severe damage after stem infection leading to gir-dling. Yield losses can be substantial since entire plants can be killed. This disease isa major limiting factor in tomato production in greenhouses and plastic tunnelswith limited climate control as common in Mediterranean countries. In this pro-duction system, regular leaf removal creates pruning wounds on stems which arepotential entrance sites for B. cinerea. In a series of experiments carried out by L.Fruit and P.C. Nicot in Southern France (Fruit and Nicot, 1999; Fruit, 2001) ingreenhouses and plastic tunnels, U. atrum was applied to stem wounds artificiallyinoculated also with conidia of B. cinerea. Applications of U. atrum protected stemsfrom infection as effective as a fungicide applied in separate treatments whereasstem lesions occurred on 30-40% of water-treated stems serving as control in thedifferent experiments. Such a consistently high level in control efficacy was alsofound in experiments carried out under controlled conditions in a broad range ofcombinations of temperature and relative humidity (Fruit, 2001; Nicot et al., inpress). The high potential of U. atrum in protecting wounds from invasion by B.cinerea had not been expected at the beginning of the experiments because the an-tagonists had been selected for competitive colonisation of necrotic plant tissuesbut not of wounds. The mode of action of U. atrum in wound tissue is not yet

Discussion 209
known but investigations on antagonistic interactions in tomato stem wounds areongoing (Nicot, pers. comm.).Studies on biocontrol of grey mould in grapevine were carried out by Schoene et al.(2000) in 1997 and 1998 with two German white grape varieties at two differentlocations. In all three field experiments development of grey mould epidemics wasslower in plots treated three to four times with conidial suspensions of U. atrumthan in water-treated control plots. The percentage of infected berries at harvestwas significantly reduced by U. atrum applications. Antagonist applications reachedthe same efficacy as conventional fungicide programmes.U. atrum did not control B. elliptica on lily cv. Mont Blanc, which is highly suscepti-ble to the pathogen causing lily fire on leaves (Kessel et al., 2001). In several fieldexperiments it was found that B. elliptica was stronger in competitive substratecolonisation of necrotic tissue of pathogen-incited lesions than U. atrum. Withinsuch lesions, applications of U. atrum did not reduce sporulation of the pathogen.On naturally senesced tissue, U. atrum was the superior competitor and sporulationof B. elliptica was significantly reduced. However, it was demonstrated that such leaftissues play no important role as inoculum source during lily fire epidemics becausethe majority of conidia is produced within pathogen-incited lesions. Consequently,epidemics of lily fire could not be retarded by U. atrum applications.Alternaria radicina can cause black spots on stored carrots. The pathogen can betransmitted by seed. Experiments are initiated to study the use of U. atrum in carrotseed production to control A. radicina. In bioassays under controlled conditions, U.atrum suppressed seed colonisation by A. radicina (Meekes et al., 2002). Preliminaryresults of field experiments show that applications of U. atrum to carrot flowersresulted in colonisation of seeds by U. atrum and a moderate reduction of A.radicina infection of seeds (Meekes, pers. comm.).In cabbage, ring spot (Mycosphaerella brassicicola) can lead to severe losses of bothyield and quality. The pathogen can produce ascospores in lesions on leaves. Thisinoculum is important for secondary spreading of the disease in crops. Under con-trolled conditions, U. atrum could colonise lesions caused by M. brassicicola andsuch lesions expanded slower than untreated control lesions (Meekes et al., 2002).Field experiments so far did not lead to conclusive results.In several field experiments, Lennartz et al. (1998) applied U. atrum to wheat. Mod-erate control effects were found on epidemics caused by Leptosphaeria nodorum orMycosphaerella graminicola.
4.7 Perspectives for development of a biocontrolagent based on U. atrum
Applications of U. atrum in various crops showed the high potential of the antago-nist in controlling diseases caused by B. cinerea. This makes the antagonist an attrac-tive candidate for the development of a biological control agent. For the

210 Biological control of Botrytis spp. with Ulocladium atrum
development of a biocontrol agent by commercial companies for use by growersseveral prerequisites must be fulfilled. The market size must justify the investments,production of spores must be economically sound and criteria considered duringregistration procedures such as toxicological and ecotoxicological aspects must befulfilled.For a biocontrol agent against B. cinerea market sizes are large because major highvalue crops suffer from grey mould and regular fungicide applications are commonin grey mould control. Alternative disease control methods are needed to protectthe environment but also because of the occurrence of fungicide resistance in B.cinerea populations (Gullino, 1992; Rosslenbroich and Stuebler, 2000). For use inintegrated crop protection systems, a biocontrol agent must be compatible withchemical control agents, e.g. in grapevine production under German conditionsgrey mould control with U. atrum should be compatible with chemical control ofdowny mildew. Schoene et al. (1999) tested the effect of a broad range of fungi-cides on U. atrum in vitro and in the field. It could be demonstrated that U. atrum isless sensitive than target pathogens to many fungicides so that the integrated use ofantagonist and fungicides is feasible. This opens a substantial market for a biocon-trol agent in integrated production systems of grapes and vegetables.Economically sound inoculum production is one of the key factors in commerciali-sation of biocontrol agents. U. atrum conidia can easily be produced in solid statefermentation on oat or other cereal substrates. In our studies, we used autoclavableplastic bags with microfilters for gas exchange. Autoclaved and inoculated cerealsubstrates were incubated for four weeks at 18 °C to obtain mature conidia. Ourprocedure yielded sufficient conidia to carry out field experiments. However, thisprotocol will not be suitable for commercial inoculum production because fer-mentation units were small and incubation periods were long. Designing proce-dures for up-scaling conidia production in solid state fermentors with growingconditions allowing fast production of high quality conidia will be necessary for thedevelopment of a biocontrol agent based on U. atrum. Frey and Magan (2001) de-veloped a method to produce conidia and mycelial fragments in oat meal broth.The quality of inocula, quantified by germination tests on water stressed media,could be manipulated by alternating the water potential of the growth media. Inoc-ula were viable for a period of at least six months. However, conidia produced onsolid substrate in the same study had a shelf life of at least 12 months. Further in-vestigations are needed to develop production methods for solid state fermentationor liquid fermentation which allow high spore yields in short fermentation runs.Possible negative side effects of biocontrol agents have to be investigated duringthe registration procedures according to governmental regulations. Toxicologicaldata on U. atrum have not been published in medical literature. Results of toxico-logical and ecotoxicological studies will be needed for registration. Saprophyticantagonists such as U. atrum might be plant pathogenic under certain circumstances.Considering that Ulocladium spp. are ubiquitous saprophytes colonising leaf litter andsoil (Domsch et al., 1980), reports on plant-pathogenicity of U. atrum are rare. How-

Discussion 211
ever, U. atrum has been described as causal agent of cucumber leaf spot in GreatBritain (Butler et al., 1979), of a potato leaf disease in Peru (Turkensteen, 1979) andeastern Turkey (Demirci and Doken, 1989), and as a possible biological control agentof Orobanche spp. (Linke et al., 1992). In our own experiments in crops such as straw-berries, onions, lilies, tulips, cyclamen, pelargonium and pot roses, U. atrum did notproduce any symptoms of disease. Disease symptoms caused by U. atrum were nei-ther described by Schoene et al. (2000) in grapevine or Fruit and Nicot (1999) intomato.In conclusion, U. atrum isolate 385 fulfils all requirements tested so far for a candi-date biological control agent so that the development and registration of a biocon-trol product based on U. atrum 385 is feasible.

212 Biological control of Botrytis spp. with Ulocladium atrum

5 Literature cited


Literature cited 215
Adee, E.A. and Pfender, W.F. 1989. The effect of primary inoculum level of Pyrenophoratritici-repentis on tan spot epidemic development in wheat. Phytopathology 79:873-877.
Adee, S.R., Pfender, W.F. and Hartnett, D.C. 1990. Competition between Pyrenophora tritici-repentis and Septoria nodorum in the wheat leaf as measured with the de Wit replace-ment series. Phytopathology 80: 1177-1182.
Alderman, S.C. and Lacy, M.L. 1983. Influence of dew period and temperature on infec-tion of onion leaves by dry conidia of Botrytis squamosa. Phytopathology 73: 1020-1023.
Alderman, S.C. and Lacy, M.L. 1984. Influence of temperature and water potential ongrowth of Botrytis allii. Can. J. Bot. 62: 1567-1570.
Andrews, J.H. 1990. Biological control in the phyllosphere: Realistic goal or false hope? Can.J. Plant Pathol. 12: 300-307.
Andrews, J.H., Berbee, F.M. and Nordheim, E.V. 1983. Microbial antagonism to theimperfect stage of the apple scab pathogen, Venturia inaequalis. Phytopathology 73:228-234.
Andrews, J.H., Harris, R.F., Spear, R.N. and Nordheim, E.V. 1994. Morphogenesis andadhesion of Aureobasidium pullulans. Can. J. Microbiol. 40: 6-17.
Andrews, J.H. and Hirano, S.S. 1992. Microbial Ecology of Leaves. Springer, New York.Aquino, V.M., Shokes, F.M., Gorbet, D.W. and Nutter, F.W. Jr. 1995. Late leaf spot
progression on peanut as affected by components of partial resistance. Plant Dis. 79:74-78.
Auruz, L.F. and Sutton, T.B. 1990. Effect of interrupted wetness periods on spore germi-nation and apple infection by Botryosphaeria obtusa. Phytopathology 80: 1218-1220.
Aylor, D.E. 1993. Relative collection efficiency of Rotorod and Burkhard spore samplersfor airborne Venturia inaequalis ascospores. Phytopathology 83: 1116-1119.
Baddeley, M.S. 1971. Biochemical aspects of senescence. In: Preece, T.F. and Dickinson,C.H. (eds), Ecology of Leaf Surface Micro-organisms. Academic Press, London, pp415-429.
Bannon, E. 1978. A method of detecting Septoria nodorum on symptomless leaves of wheat.Irish J. Agric. Res. 17: 323-324.
Bashi, E. and Rotem, J. 1974. Adaptation of four pathogens to semi-arid habitats as condi-tioned by penetration rate and germinating spore survival. Phytopathology 64:1035-1039.
Becker, C.M. and Burr, T.J. 1994. Discontinuous wetting and survival of conidia ofVenturia inaequalis on apple leaves. Phytopathology 84: 372-378.
Begon, M., Harper J.L. and Townsend, C.R. 1986. Ecology: Individuals, Populations andCommunities. Blackwell Scientific Publishers, Oxford.
Bélanger, R.R., Dufour, N., Caron, J. and Benhamou, N. 1995. Chronological eventsassociated with the antagonistic properties of Trichoderma harzianum against Botrytiscinerea: Indirect evidence for sequential role of antibiosis and parasitism.Biocontrol Sci. Technol. 5: 41-53.
Bélanger, R.R., Labbé, C. and Jarvis, W.R. 1994. Commercial scale control of powderymildew with a fungal antagonist. Plant Dis. 78: 420-424.

216 Biological control of Botrytis spp. with Ulocladium atrum
Berto, P., Jijakli, H.M. and Lepoivre, P. 2001. Possible role of colonization and cell wall-degrading enzymes in the differential ability of three Ulocladium atrum strains tocontrol Botrytis cinerea on necrotic strawberry leaves. Phytopathology 91: 1030-1036.
Bhatt, D.D. and Vaughan, E.K. 1963. Inter-relationships among fungi associated withstrawberries in Oregon. Phytopathology 53: 217-220.
Biles, C.L. and Hill, J.P. 1988. Effect of Trichoderma harzianum on sporulation of Cochliobolussativus on excised wheat seedling leaves. Phytopathology 78: 656-659.
Blakeman, J.P. 1981. Microbial Ecology of the Phylloplane. Academic Press, London.Blakeman, J.P. and Brodie, I.D.S. 1976. Inhibition of pathogens by epiphytic bacteria on
aerial plant surfaces. In: Dickinson, C.H. and Preece, T.F. (eds) Microbiology ofAerial Plant Surfaces. Academic Press, London, pp 529-557.
Blakeman, J.P. and Brodie, I.D.S. 1977. Competition for nutrients between epiphytic micro-organisms and germination of spores of plant pathogens on beetroot leaves. Physiol.Plant Pathol. 10: 29-42.
Blakeman, J.P. and Parbery, D.G. 1977. Stimulation of appressorium formation inColletotrichum acutatum by phyllosphere bacteria. Physiol. Plant Pathol. 11: 313-325.
Bodreau, D.D. and Andrews, J.H. 1987. Factors influencing antagonism of Chaetomiumglobosum to Venturia inaequalis: A case study in failed biocontrol. Phytopathology 77:1470-1475.
Boff, P., Kastelein, P., de Kraker, J., Gerlagh, M. and Köhl, J. 2001. Epidemiology of greymould in annual waiting-bed production of strawberry. Eur. J. Plant Pathol. 107:615-624.
Boff, P., Köhl, J., Jansen, M., Horsten, P.J.F.M., Lombaers-van der Plas, C.H. and Gerlagh,M. 2002. Biological control of gray mold with Ulocladium atrum in annual straw-berry crops. Plant Dis. 86: 220-224.
Boland, G.J. and Hunter, J.E. 1988. Influence of Alternaria alternata and Cladosporium cladospo-rioides on white mold of bean caused by Sclerotinia sclerotiorum. Can. J. Plant Pathol. 10:172-177.
Boland, G.J. and Inglis, G.D. 1989. Antagonism of white mold (Sclerotinia sclerotiorum) of beanby fungi from bean and rapeseed flowers. Can. J. Bot. 67: 1775-1781.
Bollen, G.J. 1982. Fungicide resistance and microbial balance. In: Dekker, J. andGeorgopoulos, S.G. (eds), Fungicide Resistance in Crop Protection. PudocAgricultural Publishing and Documentation, Wageningen, pp 161-176.
Bossi, R. and Dewey, F.M. 1992. Development of a monoclonal antibody-based immuno-detection assay for Botrytis cinerea. Plant Pathol. 41: 472-482.
Boudreau, M.A. and Andrews, J.H. 1987. Factors influencing antagonism of Chaetomiumglobosum to Venturia inaequalis: A case study in failed biocontrol. Phytopathology 77:1470-1475.
Bowen, J.K., Crowhurst, R.N., Templeton, M.D. and Stewart, A. 1996. Molecular markersfor a Trichoderma harzianum biological control agent - introduction of the hygro-mycin B resistance gene and the beta-glucuronidase gene by transformation. NewZeal. J. Crop Hort. 24: 219-228.
Braakhekke, W.G. 1980. On coexistence: a causal approach to diversity and stability ingrassland vegetation. PhD thesis, Agricultural University Wageningen.
Literature cited 217
Braun, P.G. and Sutton, J.C. 1986. Management of strawberry grey mould with fungicidestargeted against inoculum in crop residues. Proceedings British Crop ProtectionConference - Pests and Diseases, pp. 915-921.
Braun, P.G. and Sutton, J.C. 1987. Inoculum sources of Botrytis cinerea in fruit rot ofstrawberries in Ontario. Can. J. Plant Pathol. 9: 1-5.
Braun, P.G. and Sutton, J.C. 1988. Infection cycles and population dynamics of Botrytis cinereain strawberry leaves. Can. J. Plant Pathol. 10: 133-141.
Brodie, I.D.S. and Blakeman, J.P. 1975. Competition for carbon compounds by a leaf surfacebacterium and conidia of Botrytis cinerea. Physiol. Plant Pathol. 6: 125-135.
Brodie, I.D.S. and Blakeman, J.P. 1976. Competition for exogenous substrates in vitro by leafsurface micro-organisms and germination of conidia of Botrytis cinerea. Physiol. PlantPathol. 9: 227-239.
Broome, J.C., English, J.T., Marois, J.J., Latorre, B.A. and Aviles, J.C. 1995. Developmentof an infection model for Botrytis bunch rot of grapes based on wetness durationand temperature. Phytopathology 85: 97-102.
Bujold, I., Paulitz, T.C. and Carisse, O. 2001. Effect of Microsphaeropsis sp. on the produc-tion of perithecia and ascospores of Gibberella zeae. Plant Dis. 85: 977-984.
Bulger, M.A., Ellis, M.A. and Madden, L.V. 1987. Influence of temperature and wetnessduration on infection of strawberry flowers by Botrytis cinerea and disease incidenceon fruit originating from infected flowers. Phytopathology 77: 1225-1230.
Bunster, L., Fokkema, N.J. and Schippers, B. 1989. Effect of surface-active Pseudomonas spp.on leaf wettability. Appl. Environ. Microbiol. 55: 1340-1345.
Burchill, R.T. and Cook, R.T.A. 1971. The interaction of urea and mirco-organisms insuppressing the development of perithecia of Venturia inaequalis (Cke.) Wint. In:Preece, T.F. and Dickinson, C.H. (eds), Ecology of Leaf Surface Micro-organisms.Academic Press, London, pp 471-483.
Burrage, S.W. 1971. The micro-climate at the leaf surface. In: Preece, T.F. and DickinsonC.H. (eds), Ecology of Leaf Surface Micro-organisms. Academic Press, London, pp91-101.
Butler, D., Griffin, M.J. and Fletcher, J.T. 1979. Leaf spot on cucumber caused by Ulocladiumatrum. Plant Pathol. 28: 96-97.
Caesar, A.J. and Pearson, R.C. 1983. Environmental factors affecting survival of asco-spores of Sclerotinia sclerotiorum. Phytopathology 73: 1024-1030.
Campbell, G.S. and Gardner, G.A. 1971. Psychrometric measurement of soil water poten-tial: Temperature and bulk density effects. Proceedings Soil Science Society ofAmerica 35: 8-12.
Carisse, O., Philion, V., Rolland, D. and Bernier, J. 2000. Effect of fall application offungal antagonists on spring ascospore production of the apple scab pathogen,Venturia inaequalis. Phytopathology 90: 31-37.
Cerkauskas, R.F. and Sinclair, J.B. 1980. Use of Paraquat to aid detection of fungi in soy-bean tissues. Phytopathology 70: 1036-1038.
Chet, I. 1987. Trichoderma-application, mode of action and potential as a biocontrol agentof soilborne plant pathogenic fungi. In: Chet, I. (ed), Innovative Approaches toPlant Disease Control. John Wiley and Sons, New York, pp 137-160.
Chou, M.C. and Preece, T.F. 1968. The effect of pollen grains on infections caused by Botrytiscinerea Fr. Ann. appl. Biol. 62: 11-22.
218 Biological control of Botrytis spp. with Ulocladium atrum
Clarkson, J.P. and Lucas, J.A. 1993. Screening for potential antagonists of Pseudocercosporellaherpotrichoides, the causal agent of eyespot disease of cereals. 2. Fungi. Plant Pathol.42: 552-559.
Cook, R.J. 1970. Factors affecting saprophytic colonization of wheat straw by Fusarium roseumf.sp. cerealis 'Culmorum'. Phytopathology 60: 1672-1676.
Dallyn, H. and Fox, A. 1980. Spoilage of material of reduced water activity by xerophylicfungi. In: Gould, G.H. and Corry, J.E.L. (eds) Society of Applied Bacterial Tech-nology. Series no. 15, pp 129-139.
De Nazareno, N.R.X., Lipps, P.E. and Madden, L.V. 1993. Effects of levels of corn residueson the epidemiology of gray leaf spot of corn in Ohio. Plant Dis. 77: 67-70.
De Waard, M.A., Georgopoulos, S.G., Hollomon, D.W., Ihsii, H., Leroux, P., Ragsdale,N.N. and Schwinn, F.J. 1993. Chemical control of plant diseases: problems andprospects. Annu. Rev. Phytopathol. 31: 403-421.
De Wit, C.T. 1960. On competition. Verslagen Landbouwkundige OnderzoekingenWageningen 66: 1-82.
Dehne, H.-W., Stenzel, K. and Schönbeck, F. 1984. Zur Wirksamheit induzierter Resistenzunter praktischen Anbaubedingungen. III. Reduktion Echter Mehltaupilze aufinduziert resistente Pflanzen. Z. Pflanzenkr. Pflanzensch. 91: 258-265.
Demirci, E. and Doken, M.T. 1989. Studies on the determination and identification of fungalagents of the diseases isolated from the roots, stems and leaves of potatoes inErzurum region. Journal of Turkish Phytopathology 18: 51-60.
Di Pietro, A., Gut-Rella, M., Pachlatko, J.P. and Schwinn, F.J. 1992. Role of antibioticsproduced by Chaetomium globosum in biocontrol of Pythium ultimum, a causal agent ofdamping-off. Phytopathology 82: 131-135.
Di Pietro, A., Lorito, M., Hayes, C.K., Broadway, R.M. and Harman, G.E. 1993. Endo-chitinase from Gliocladium virens: isolation, characterization and synergistic antifun-gal activity in combination with gliotoxin. Phytopathology 83: 308-313.
Dickinson, C.H. 1976. Fungi on the aerial surfaces of higher plants. In: Dickinson, C.H. andPreece, T.F. (eds), Microbiology of Aerial Plant Surfaces. Academic Press, London,pp 293-324.
Dickinson, C.H. 1981. Biology of Alternaria alternata, Cladosporium cladosporioides and C.herbarum in respect of their activity on green plants. In: Blakeman, J.P. (ed),Microbial Ecology of the Phylloplane. Academic Press, London, pp 169-184.
Dickinson, C.H. 1986. Adaptations of micro-organisms to climatic conditions affecting aerialplant surfaces. In: Fokkema, N.J. and Heuvel, J. van den (eds), Microbiology of thePhyllosphere. Cambridge University Press, Cambridge, pp 77-100.
Dickinson, C.H. and Preece, T.F. 1976. Microbiology of Aerial Plant Surfaces. AcademicPress, London.
Diem, H.G. 1971. Effect of low humidity on the survival of germinated spores commonlyfound in the phyllosphere. In: Preece, T.F. and Dickinson, C.H. (eds), Ecology ofLeaf Surface Micro-organisms. Academic Press, London, pp 211-219.
Dik, A.J., Fokkema, N.J. and Pelt, J.A. van 1991. Consumption of aphid honeydew, a wheatyield reducing factor, by phyllosphere yeasts under field conditions. Neth. J. Pl.Pathol. 97: 209-232.

Literature cited 219
Dommelen, L. van and Bollen, G.J. 1973. Antagonisms between benomyl-resistant fungion cyclamen sprayed with benomyl. Acta Bot. Neerl. 22: 169-170.
Domsch, K.H., Gams, W. and Anderson, T.H. 1980. Compendium of Soil Fungi. Aca-demic Press, London.
Dubos, B. 1992. Biological control of Botrytis: state-of-the-art. In: Verhoeff, K.,Malathrakis, N.E. and Williamson, B. (eds), Recent Advances in Botrytis Research.Pudoc Scientific Publishers, Wageningen, pp 169-178.
Duthie, J.A. and Campbell, C.L. 1991. Effects of plant debris on intensity of leaf spotdiseases, incidence of pathogens and growth of alfalfa. Phytopathology 81: 511-517.
Edmonds, R.L. 1972. Collection efficiency of Rotorod samplers for sampling fungusspores in the atmosphere. Plant Dis. Rep. 56: 704-708.
Edwards, M.C. and Blakeman, J.P. 1984. An autoradiographic method for determing nutrientcompetition between leaf epiphytes and plant pathogens. J. Microscopy 133: 205-212.
Edwards, S.G. and Seddon, E. 1992. Bacillus brevis as a biocontrol agent against Botrytis cinereaon protected Chinese cabbage. In: Verhoeff, K., Malathrakis, N.E. and Williamson,B. (eds), Recent Advances in Botrytis Research. Pudoc Scientific Publishers,Wageningen, pp 267-271.
Elad, Y. 1996. Mechanisms involved in the biological control of Botrytis cinerea incited dis-eases. Eur. J. Plant Pathol. 102: 719-732.
Elad, Y., Chet, I. and Henis, Y. 1982. Degradation of plant pathogenic fungi by Trichodermaharzianum. Can. J. Microbiol. 28: 719-725.
Elad, Y., Zimand, G., Zaqs, Y., Zuriel, S. and Chet, I. 1993. Use of Trichoderma harzianum incombination or alternation with fungicides to control cucumber grey mould(Botrytis cinerea) under commercial greenhouse conditions. Plant Pathol. 42: 324-332.
Elad, Y., Köhl, J. and Fokkema, N.J. 1994a. Control of infection and sporulation of Botrytiscinerea on bean and tomato by saprophytic yeasts. Phytopathology 84: 1193-1200.
Elad, Y., Köhl, J. and Fokkema, N.J. 1994b. Control of infection and sporulation of Botrytiscinerea on bean and tomato by saprophytic bacteria and fungi. Eur. J. Plant Pathol.100: 315-336.
Ellerbrock, L.A. and Lorbeer, J.W. 1977. Sources of primary inoculum of Botrytis squamosa.Phytopathology 67: 363-372.
Ellis, M.B. 1971. Dematiaceous Hyphomycetes. Commonw. Mycol. Inst., Kew.Elmer, P.A.G. and Köhl, J. 1998. The survival and saprophytic competitive ability of the
Botrytis spp. antagonist Ulocladium atrum in lily canopies. Eur. J. Plant Pathol. 104:435-447.
Elmer, P.A.G., Boyd-Wilson, K., Cook, D., Gaunt, R.E., Frampton, C. and Pyke, N. 1993.Sources of Botrytis cinerea inoculum in kiwifruit orchards and the relationshipbetween total inoculum potential, external fruit contamination and stem end rot ofkiwifruit. Abstracts of the 6th International Congress of Plant Pathology, Montreal,Canada, p 110.
Falconi, C. J. and Mendgen, K. 1994. Epiphytic fungi on apple leaves and their value forcontrol of the postharvest pathogens Botrytis cinerea, Monilinia fructigena andPenicillium expansum. Z. Pflanzenkr. Pflanzensch. 101: 38-47.

220 Biological control of Botrytis spp. with Ulocladium atrum
Fernandez, M.R. 1992. The effect of Trichoderma harzianum on fungal pathogens infestingsoybean residues. Soil Biol. Biochem. 24: 1027-1029.
Fernando, W.G.D., Watson, A.K. and Paulitz, T.C. 1994. The role of phylloplanePseudomonas spp. in the enhancement of disease control caused by Colletotrichumcoccodes on velvetleaf. Biol. Control 4: 125-131.
Fernando, W.G.D., Watson, A.K. and Paulitz, T.C. 1996. The role of Pseudomonas spp. andcompetition for carbon, nitrogen and iron in the enhancement of appressoriumformation by Colletotrichum coccodes on velvetleaf. Eur. J. Plant Pathol. 102: 1-7.
Firbank, L.G. and Watkinson, A.R. 1985. On the analysis of competition within two-species mixtures of plants. J. Appl. Ecol. 22: 503-517.
Fitt, B.D.L., McCartney, H.A., Walklate, P.J. 1989. Role of rain in dispersal of pathogeninoculum. Annu. Rev. Phytopathol. 27: 241-270.
Fokkema, N.J. 1971. The effect of pollen in the phyllosphere of rye on colonization by sap-rophytic fungi and on infection by Helminthosporium sativum and other leaf pathogens.Neth. J. Plant Pathol. 77 Suppl. 1: 1-60.
Fokkema, N.J. 1973. The role of saprophytic fungi in antagonism against Drechslera sorokiniana(Helminthosporium sativum) on agar plates and on rye leaves with pollen. Physiol. PlantPathol. 3: 195-205.
Fokkema, N.J. 1984. Competition for endogenuous and exogenuous nutrients betweenSporobolomyces roseus and Cochliobolus sativus. Can. J. Bot. 62: 2463-2468.
Fokkema, N.J. 1993. Opportunities and problems of control of foliar pathogens with micro-organisms. Pestic. Sci. 37: 411-416.
Fokkema, N.J. and Heuvel, J. van den 1986. Microbiology of the Phyllosphere. CambridgeUniversity Press, Cambridge.
Fokkema, N.J. and Lorbeer, J.W. 1974. Interactions between Alternaria porri and the sapro-phytic mycoflora of onion leaves. Phytopathology 64: 1128-1133.
Fokkema, N.J., Riphagen, I., Poot, R.J. and Jong, C. de 1983. Aphid honeydew, a potentialstimulant of Cochliobolus sativus and Septoria nodorum and the competitive role ofsaprophytic microflora. Trans. Br. mycol. Soc. 81: 355-363.
Fokkema, N.J., Gerlagh, M. and Köhl, J. 1992. Biological control of Sclerotinia sclerotiorumand Botrytis spp. In: Tjamos, E.C., Papavizas, G. and Cook, R.J. (eds), BiologicalControl of Plant Diseases - Progress and Challenge for the Future (Proc. Nat. Ad-vanced Research Workshop). Plenum Press, New York, pp 267-271.
Frossard, R., Fokkema, N.J. and Tietema, T. 1983. Influence of Sporobolomyces roseus andCladosporium cladosporioides on leaching of 14C-labelled assimilates from wheat leaves.Trans. Br. mycol. Soc. 80: 289-296.
Frey, S. and Magan, N. 2001. Production of the fungal biocontrol agent Ulocladium atrum bysubmerged fermentation: accumulation of endogenous reserves and shelf-lifestudies. Appl. Microbiol. Biotechnol. 56: 372-377.
Fruit, L. 2001. Etude des facteurs d’efficacité d’un agent de lutte biologique (Ulocladiumatrum) pour la protection des plaies d’effeuillage sur tomate contre Botrytis cinerea.PhD ThesisUniversite Claude Bernard, Lyon, France.
Fruit, L. and Nicot, P. 1999. Biological control of Botrytis cinerea on tomato stem woundswith Ulocladium atrum. Integrated Control in Glasshouses. IOBC Bulletin 22, pp.81-84.

Literature cited 221
Gerlagh, M., Goossen-van der Geijn, H.M., Verdam, B. and Fokkema, N.J. 1995. Biologicalcontrol of white mould (Sclerotinia sclerotiorum) in various crops by application ofConiothyrium minitans. In: Whipps, J. M. and Gerlagh, T. (eds), Biological Control ofSclerotium-forming Fungi, IOBC/WPRS Bulletin 18(3), pp 13-17.
Gerlagh, M., Amsing, J.J., Molhoek, W.M.L., Bosker-van Zessen, A.I., Lombaers-van derPlas, C.H. and Köhl, J. 2001. The effect of treatment with Ulocladium atrum onBotrytis cinerea-attack of geranium (Pelargonium zonale) stock plants and cuttings. Eur.J. Plant Pathol. 107: 377-386.
Ghisalberti, E.L. and Sivasithamparam, K. 1991. Antifungal antibiotics produced byTrichoderma spp. Soil Biol. Biochem. 23: 1011-1020.
Good, H.M. and Zathureczky, P.G.M. 1967. Effects of drying on the viablility of germi-nated spores of Botrytis cinerea, Cercospora musae, and Monilinia fructicola. Phytopa-thology 57: 719-722.
Grantzau, E. and Hell, B. ter 1993. Botrytis bei Cyclamen. Einfluss von Bewässerungs-system, Düngung oder Substrat. Gartenbau und Gartenwirtschaft 93: 542-543.
Gregory, P.H. and Hirst, J.M. 1957. The summer air-spora at Rothamsted in 1952. J. Gen.Microbiol. 17: 135-152.
Gullino, M.L. 1992. Chemical control of Botrytis spp. In: Verhoeff, K., Malathrakis, N.E.and Williamson, B. (eds), Recent Advances in Botrytis Research. Pudoc ScientificPublishers, Wageningen, pp 217-222.
Hajlaoui, M.R., Traquair, J.A., Jarvis, W.R. and Bélanger, R.R. 1994. Antifungal activity ofextracellular metabolites produced by Sporothrix flocculosa. Biocontrol Sci. Technol.4: 229-237.
Hancock, J.G. and Lorbeer, J.W. 1963. Pathogenesis of Botrytis cinerea, B. squamosa, and B. alliion onion leaves. Phytoapthology 53: 669-673.
Hannusch, D.J. and Boland, G.J. 1996a. Interactions of air temperature, relative humidityand biological control agents on grey mold of bean. Eur. J. Plant Pathol. 102: 133-142.
Hannusch, D.J. and Boland, G.J. 1996b. Influence of air temperature and relative humidityon biological control of white mold of bean (Sclerotinia sclerotiorum). Phytopathology86: 156-162.
Hau, B. and Kranz, J. 1978. Modellrechnungen zur Wirkung des Hyperparasiten Eudarlucacaricis auf Rostepidemien. Z. Pflanzenkr. Pflanzensch. 85: 131-141.
Hausbeck M.K. and Moorman, G.W. 1996. Managing Botrytis in greenhouse-grown flowercrops. Plant Dis. 80: 1212-1219.
Hausbeck, M.K. and Pennypacker, S.P. 1991a. Influence of grower activity and diseaseincidence on concentrations of airborne conidia of Botrytis cinerea among geraniumstock plants. Plant Dis. 75: 798-803.
Hausbeck, M.K. and Pennypacker, S.P. 1991b. Influence of grower activity on concentra-tions of airborne conidia of Botrytis cinerea among geranium cuttings. Plant Dis. 75:1236-1243.
Hausbeck, M.K., Pennypacker, S.P. and Stevenson, R.E. 1996. The effect of plastic mulchand forced heated air on Botrytis cinerea on geranium stock plants in a researchgreenhouse. Plant Dis. 80: 170-173.

222 Biological control of Botrytis spp. with Ulocladium atrum
Helbig, J. 2001. Biological control of Botrytis cinerea Pers. ex. Fr. in strawberry by Paenibacilluspolymyxa (isolate 18191). J. Phytopathol. 149: 265-273.
Henseler, K. 1981. Fungizide beeinträchtigen den Ertrag. Möglichkeiten der Botrytis-Bekämpfung bei Schnittcyclamen. Gartenbau und Gartenwirtschaft 81: 382.
Heye, C.C. and Andrews, J.H. 1983. Antagonism of Athelia bombacina and Chaetomium globosumto the apple scab pathogen, Venturia inaequalis. Phytopathology 73: 650-654.
Hjeljord, L.G., Stensvand, A. and Tronsmo, A. 2000. Effect of temperature and nutrientstress on the capacity of commercial Trichoderma products to control Botrytis cinereaand Mucor piriformis in greenhouse strawberries. Biol. Control 19: 149-160.
Hocking, A.D., Miscamble, B.F. and Pitt, J.I. 1994. Water relations of Alternaria alternata,Cladosporium cladosporioides, Cladosporium sphaerospermum, Curvularia lunata andCurvularia pallescens. Mycol. Res. 98: 91-94.
Howell, C.R. and Stipanovic, R.D. 1995. Mechanisms in the biocontrol of Rhizoctonia solani-induced cotton seedling disease by Gliocladium virens-antibiosis. Phytopathology 85:469-472.
Hudson, H.J. 1971. The development of the saprophytic fungal flora as leaves senesce andfall. In: Preece, T.F. and Dickinson, C.H. (eds), Ecology of Leaf Surface Micro-organisms. Academic Press, London, pp 447-455.
Hudson, H.J. and Webster, J. 1958. Succession of fungi on decaying stems of Agropyron repens.Trans. Br. mycol. Soc. 41: 165-177.
Iyozumi, H., Komagata, T., Hirayae, K., Tsuchiya, K., Hibi, T. and Akutsu, K. 1996. Bio-logical control of cyclamen gray mould (Botrytis cinerea) by Serratia marcescens B2.Ann. Phytopathol. Soc. Jpn. 62: 559-565.
Jackson, A.M., Whipps, J.M. and Lynch, J.M. 1991. Effects of temperature, pH and waterpotential on growth of four fungi with disease biocontrol potential. World J. Mi-crobiol. Biotechnol. 7: 494-501.
Jacob, M. 1987. Bekämpfung bedeutender Schaderreger bei der Produktion von Cyclamen.Gartenbau 34: 281-283.
Janisiewicz, W.J. and Roitman, J. 1988. Biological control of blue mold and gray mold onapple and pear with Pseudomonas cepacia. Phytopathology 78: 1697-1700.
Jarvis, W.R. 1962a. The epidemiology of Botrytis cinerea Pers. in strawberries. Proceedings16th International Horticultural Congress Vol.III, pp 258-262.
Jarvis, W.R. 1962b. The infection of strawberry and raspberry fruits by Botrytis cinerea Fr..Ann. Appl. Biol. 50: 569-575.
Jarvis, W.R. 1962c. The dispersal of spores of Botrytis cinerea Fr. in a rasberry plantation.Trans. Br. mycol. Soc. 45: 549-559.
Jarvis, W.R. 1980. Epidemiology. In: Coley-Smith, J.R., Verhoeff, K. and Jarvis, W.R. (eds),The Biology of Botrytis. Acad. Press, London, UK, pp 219-250.
Johnson, C.S., Beute, M.K. and Ricker, M.D. 1986. Relationship between components ofresistance and disease progress of early leaf spot on Virginia-type peanut.Phytopathology 76: 495-499.
Jongebloed, P.H. J., Kessel, G.J.T., Molhoek, W.M.L., Plas, C.H. van der and Fokkema, N.J.1993. Biological control of Phytophthora infestans with compost extracts and selectedbacterial antagonists. In: Fokkema, N.J., Köhl, J. and Elad, Y. (eds), BiologicalControl of Foliar and Postharvest Diseases IOBC/WPRS Bulletin 16(11), pp 16-20.

Literature cited 223
Jordan, V.W.L. 1978. Epidemiologie und Bekämpfung des Grauschimmels (Botrytis cinerea) anErdbeeren. Pflanzenschutz-Nachrichten 31: 1-10.
Jordan, V.W.L. and Pappas, A.C. 1977. Inoculum suppression and control of strawberryBotrytis. Proceedings British Crop Protection Conference - Pests and Diseases:341-348.
Karpovich-Tate, N. and Dewey, F.M. 2001. Quantification of Ulocladium atrum in necroticplant tissues by monoclonal antibody-based enzyme-linked immunosorbent assay.Mycol. Res. 105: 567-574.
Kerssies, A. 1990. A selective medium for Botrytis cinerea to be used in a spore trap. Neth. J.Plant Pathol. 96: 247-250.
Kessel, G.J.T. 1999. Biological control of Botrytis spp. by Ulocladium atrum: an ecologicalanalysis. PhD ThesisWageningen University, Wageningen.
Kessel, G.J.T., Haas, B.H. de, Lombaers-van der Plas, C.H., Meijer, E.M.J., Dewey, F.M.,Goudriaan, J., Werf, W. van der and Köhl, J. 1999. Quantification of mycelium ofBotrytis spp. and the antagonist Ulocladium atrum in necrotic leaf tissue of cyclamenand lily by fluorescence microscopy and image analysis. Phytopathology 89: 868-876.
Kessel, G.J.T., Haas, B.H. de, Lombaers-van der Plas, C.H., Ende, J.E. van der, Pennock-Vos, M.G., Werf, W. van der and Köhl, J. 2001. Comparative analysis of the roleof substrate specificity in biological control of Botrytis elliptica in lily and B. cinerea incyclamen with Ulocladium atrum. Eur. J. Plant Pathol. 107: 273-284.
Kessmann, H., Staub, T., Hofmann, C., Maetzke, T., Herzog, J., Ward, E., Uknes, S. andRyals, J. 1994. Induction of systemic acquired disease resistance in plants bychemicals. Annu. Rev. Phytopathol. 32: 439-459.
Klepzig, K.D. and Wilkens, R.T. 1997. Competitive interactions among symbiotic fungi ofthe southern pine beetle. Appl. Environ. Microbiol. 63: 621-627.
Köhl, J. and Fokkema, N.J. 1994. Fungal interactions on living and necrotic leaves. In:Blakeman, J.P. and Williamson, B. (eds), Ecology of Plant Pathogens. CABI, Oxon,pp 321-334.
Köhl, J. and Fokkema, N.J. 1998. Strategies for biological control of necrotrophic fungalfoliar pathogens. In: Boland, G.J. and Kuykendall, L.D. (eds), Plant-Microbe Inter-actions and Biological Control. Marcel Dekker, Inc, New York, pp. 49-88.
Köhl, J. and Gerlagh, M. 1999. Biological control of Botrytis cinerea in roses by the antago-nist Ulocladium atrum. Med. Fac. Landbouww. Univ. Gent 64/3b: 441-445.
Köhl, J. and Molhoek, W.M.L. 2001. Effect of water potential on conidial germination andantagonism of Ulocladium atrum against Botrytis cinerea. Phytopathology 91: 485-491.
Köhl, J. and Schlösser, E. 1988. Occurrence and temperature requirements of fourTrichoderma species from different regions and substrates. Angew. Bot. 62: 301-309.
Köhl, J. and Schlösser, E. 1989. Decay of sclerotia of Botrytis cinerea by Trichoderma spp. atlow temperatures. J. Phytopathol. 125: 320-326.
Köhl, J., Krijger, M.C. and Kessel, G.J.T. 1992. Drought tolerance of Botrytis squamosa, B.aclada and potential antagonist. In: Verhoeff, K., Malathrakis, N.E. andWilliamson, W. (eds), Recent Advances in Botrytis Research. Pudoc ScientificPublishers, Wageningen, pp 206-210.

224 Biological control of Botrytis spp. with Ulocladium atrum
Köhl, J., Plas, C.H. van der, Molhoek, W.M.L. and Fokkema, N.J. 1993. Drought toleranceas a major selection criterium for antagonists of Botrytis spp. In: Fokkema, N.J.,Köhl, J. and Elad, Y. (eds), Biological Control of Foliar and Postharvest DiseasesIOBC/WPRS Bulletin 16(11), pp 169-172.
Köhl, J., Molhoek, W.M.L., Goossen-van de Geijn, H.M. and Lombaers-van der Plas, C.H.2003. Potential of Ulocladium atrum for biocontrol of onion leaf spot through sup-pression of sporulation of Botrytis spp. BioControl 48: 349-359.
Köhl, J., Molhoek, W.M.L., Plas, C.H. van der and Fokkema, N.J. 1995a. Suppression ofsporulation of Botrytis spp. as a valid biocontrol strategy. Eur. J. Plant Pathol. 101:251-259.
Köhl, J., Molhoek, W.M.L., Plas, C.H. van der and Fokkema, N.J. 1995b. Effect ofUlocladium atrum and other antagonists on sporulation of Botrytis cinerea on dead lilyleaves exposed to field conditions. Phytopathology 85: 393-401.
Köhl, J., Plas, C.H. van der, Molhoek, W.M.L. and Fokkema, N.J. 1995c. Effect ofinterrupted leaf wetness periods on suppression of sporulation of Botrytis allii andB. cinerea by antagonists on dead onion leaves. Eur. J. Plant Pathol. 101: 627-637.
Köhl, J., Bélanger, R.R. and Fokkema, N.J. 1997. Interaction of four antagonistic fungi withBotrytis aclada in dead onion leaves: A comparative microscopic and ultrastructuralstudy. Phytopathology 87: 634-642.
Köhl, J., Gerlagh, M., Haas, B.H. de and Krijger, M.C. 1998. Biological control of Botrytiscinerea in cyclamen with Ulocladium atrum and Gliocladium roseum under commercialgrowing conditions. Phytopathology 88: 568-575.
Köhl, J., Lombaers-van der Plas, C.H., Molhoek, W.M.L., Kessel G.J. and Goossen-van derGeijn, H.J. 1999. Competitive ability of the antagonist Ulocladium atrum andGliocladium roseum at temperatures favourable for Botrytis spp. development.BioControl 44: 329-346.
Köhl, J., Gerlagh, M. and Grit, G. 2000. Biocontrol of Botrytis cinerea by Ulocladium atrum indifferent production systems of cyclamen. Plant Dis. 84: 569-573.
Kovach, J., Petzoldt, R. and Harman, G.E. 2000. Use of honey bees and bumble bees todisseminate Trichoderma harzianum 1295-22 to strawberries for Botrytis control. Biol.Control 18: 235-242.
Kranz, J. 1981. Hyperparasitism of biotrophic fungi. In: Blakeman, J.P. (ed), MicrobialEcology of the Phylloplane. Academic Press, London, pp 327-352.
Kurze, S., Bahl, H., Dahl, R. and Berg, G. 2001. Biological control of fungal strawberrydiseases by Serratia plymuthica HRO-C48. Plant Dis. 85: 529-534.
Labrinos, J.L. and Nutter, F.W. Jr. 1993. Effects of a protectant versus a systemic fungicideon disease components of peanut late leaf spot. Plant Dis. 77: 837-845.
Lacroix, L. and Gouot, J.M. 1981. Etude en serre de la resistance de Botrytis cinerea al’iprodione. Med. Fac. Landbouww. Rijksuniv. Gent 46: 979-989.
Leifert, C., Li, H., Chidburee, S., Hampson, S., Workman, S., Sigee, D., Epton, H.A.S. andHarbour, A. 1995. Antibiotic production and biocontrol activity by Bacillus subtilisCL27 and Bacillus pumilus CL45. J. Appl. Bacteriol. 78: 97-108.
Lennartz, B., Schoene, P. and Oerke, E.C. 1998. Biocontrol of Botrytis cinerea on grapevineand Septoria spp. on wheat. Med. Fac. Landbouww. Univ. Gent 63/3b: 963-970.
Leonard, K.J. and Mundt, C.C. 1984. Methods for estimating epidemiological effects ofquantitative resistance to plant diseases. Theor. Appl. Genet. 67: 219-230.

Literature cited 225
Li, H. and Leifert, C. 1994. Development of resistance in Botryotinia fuckeliana (de Bary)Whetzel against the biological control agent Bacillus subtilis CL27. Z. Pflanzenkr.Pflanzensch. 101: 414-418.
Lima, G., Ippolito, A., Nigro, F. and Salerno, M. 1997. Effectiveness of Aureobasidiumpullulans and Candida oleophila against postharvest strawberry rots. Postharv. Biol.Tech. 10: 169-178.
Linke, K.H., Scheibel, C., Saxena, M.C. and Sauerborn, J. 1992. Fungi occurring on Orobanchespp. and their preliminary evaluation for Orobanche control. Tropical Pest Manage.38: 127-130.
Lockwood, J.L. 1988. Evolution of concepts associated with soilborne plant pathogens.Annu. Rev. Phytopathol. 26: 93-121.
Lockwood, J.L. 1992. Exploitation competition. In: Carroll, G.C. and Wicklow, D. T. (eds),The Fungal Community. Marcel Dekker, New York, pp 243-261.
Logan, J.A., Wollkind, D.J., Hoyt, S.C. and Tanigoshi, L.K. 1976. An analytical model fordescription of temperature dependant rate phenomena in arthropods. Environ.Entomol. 5: 1133-1140.
López-Herrera, C.J., Verdú-Valiente, B. and Melero-Vara, J.M. 1994. Eradication of primaryinoculum of Botrytis cinerea by soil solarization. Plant Dis. 78: 594-597.
Lorbeer, J.W. 1966. Diurnal periodicity of Botrytis squamosa conidia in the air. Phytopathol-ogy 56: 887.
Maas, J.L. 1984. Compendium of strawberry diseases. American Phytopathological Society,St. Paul, USA.
MacCullagh, P. and Nelder, J.A. 1989. Generalized Linear Models. 2nd ed. Chapman andHall, London.
Madrigal, C., Pascual, S. and Melgarejo, P. 1994. Biological control of peach twig blight(Monilinia laxa) with Epicoccum nigrum. Plant Pathol. 43: 554-561.
Magan, N. 1988. Effects of water potential and temperature on spore germination andgerm-tube growth in vitro and in straw leaf sheaths. Trans. Br. mycol. Soc. 90: 97-107.
Magan, N. and Lacey, J. 1984. Effect of temperature and pH on water relations of fieldand storage fungi. Trans. Br. mycol. Soc. 82: 71-81.
Magan, N. and Lynch, J.M. 1986. Water potential, growth and cellulolysis of fungi involvedin decomposition of cereal residues. J. Gen. Microbiol. 132: 1181-1187.
Maude, R.B., Shipway, M.R., Presley, A.H. and O’Connor, D. 1984. The effects of directharvesting and drying systems on the incidence and control of neck rot (Botrytisallii) in onions. Plant Pathol. 33: 263-268.
McCormack, P.J., Wildman, H.G. and Jeffries, P. 1994. Production of antibacterialcompounds by phylloplane-inhabiting yeasts and yeastlike fungi. Appl. Environ.Microb. 60: 927-931.
McQuilken, M.P., Whipps, J.M. and Cooke, R.C. 1990. Control of damping-off in cressand sugar-beet by commercial seedcoating with Pythium oligandrum. Plant Pathol.39: 452-462.
Mead, R. 1988. The Design of Experiments. Cambridge University Press, Cambridge, UK.
226 Biological control of Botrytis spp. with Ulocladium atrum
Meekes, E.T.M., Köhl, J., Molhoek, W.M.L., Goossen-van der Geijn, H.M.G. and Gerlagh,M. 2002. Biologische bestrijding van bovengrondse plantenziekten met Ulocladiumatrum. In: Wijnands, F.G., Schröder, J.J., Sukkel, W. and Booij, R. (eds), BiologischBedrijf Onder de Loep – Biologische Akkerbouw en Vollegrondsgroenteteelt inPerspectief, Praktijkonderzoek Plant en Omgeving, Lelystad, pp 103-112.
Mertely, J.C., Chandler, C.K., Xiao, C.L. and Legard, D.E. 2000. Comparison of sanitationand fungicides for management of Botrytis fruit rot of strawberry. Plant Dis. 84:1197-1202.
Metz, C., Oerke, E.-C. and Dehne, H.-W. (in press). Biological control of grey mould(Botrytis cinerea) with the antagonist Ulocladium atrum. Med. Fac. Landbouww. Univ.Gent.
Michailides, T.J. and Spotts, R.A. 1991. Effects of certain herbicides on the fate of sporan-giospores of Mucor piriformis and conidia of Botrytis cinerea and Penicillium expansum.Pestic. Sci. 33: 11-22.
Miedtke, U. and Kennel, W. 1990. Athelia bombacina and Chaetomium globosum as antagonists ofthe perfect stage of the apple scab pathogen (Venturia inaequalis) under fieldconditions. Z. Pflanzenkr. Pflanzensch. 97: 24-32.
Miller, P.M. and Waggoner, P.E. 1957. Dispersal of spores of Botrytis cinerea among straw-berries. Phytopathology 47: 24-25.
Mizubuti, E.S.G., Maffia, L.A., Muchovej, J.J., Romeiro, R.S. and Batista, U.G. 1995.Epidemiological aspects of Uromyces appendiculatus on dry bean (Phaseolus vulgaris) aftertreatment with Bacillus subtilis. J. Phytopathol. 143: 689-691.
Morandi, M.A.B., Sutton, J.C. and Maffia, L.A. 2000. Effects of host and microbial factorson development of Clonostachys rosea and control of Botrytis cinerea in rose. Eur. J.Plant Pathol. 106: 439-448.
Morandi, M.A.B., Maffia, L.A. and Sutton, J.C. 2001. Development of Clonostachys rosea andinteractions with Botrytis cinerea in rose leaves and residues. Phytoparasitica 29: 103-113.
Morris, C., Nicot, P. and Nguyen-The, C. 1996. Aerial Plant Surface Microbiology. PlenumPress, New York.
Morton, L.H.G. and Eggins, H.O.W. 1977. The effect of constant, alternating and fluctu-ating temperatures on the growth of some wood inhabiting fungi. Int. Biodeterior.13: 116-122.
Mostafa, M.M. 1993. Biological control of Drechslera teres: ability of antagonists to reduceconidia formation, coleoptile infection and leaf infection in barley (Hordeum vulgare).Cryptogamie Mycol. 14: 287-295.
Nair, N.G. and Allen, R.N. 1993. Infection of grape flowers and berries by Botrytis cinerea asa function of time and temperature. Mycol. Res. 97: 1012-1014
Nair, N.G. and Nadtotchei, A. 1987. Sclerotia of Botrytis as a source of primary inoculum forbunch rot of grapes in New South Wales, Australia. J. Phytopathol. 119: 42-51.
Nelson, M.E. and Powelson, M.L. 1988. Biological control of grey mold of snap beans byTrichoderma hamatum. Plant Dis. 72: 727-729.
Newhook, F.J. 1957. The relationship of saprophytic antagonism to control of Botrytis cinereaPers. on tomatoes. New Zeal. J. Sci. Technol. 38: 473-481.
Newton, M.R., Kinkel, L.L. and Leonard, K.J. 1998. Constraints on the use of de Witmodels to analyze competitive interactions. Phytopathology 88: 873-878.

Literature cited 227
Nicot, P.C., Decognet, V., Fruit, L., Bardin, M. and Trottin, Y. (in press). Combined effectof microclimate and dose of application on the efficacy of biocontrol agents forprotection of pruning wounds on tomatoes against Botrytis cinerea. In: Elad, Y.,Köhl, J. and Shtienberg, D. (eds), Influence of A-biotic and Biotic Factors on Bio-control Agents, IOBC/WPRS Bulletin.
Nielsen, K. 2000. Molecular characterisation and biological control of grey mould (Botrytisspp.) in onion. PhD thesis Danish Institute of Agricultural Sciences, Slagelse,Denmark.
O´Neill, T.M., Shtienberg, D. and Elad, Y. 1997. Effect of some host and microclimatefactors on infection of tomato stems by Botrytis cinerea. Plant Dis. 81: 36-40.
Papavizas, G.C. 1985. Trichoderma and Gliocladium: Biology, ecology, and potential for bio-control. Annu. Rev. Phytopathol. 23: 23-54.
Pappas, A.C. 1982. Inadequate control of grey mould on cyclamen by dicarboximide fun-gicides in Greece. Z. Pflanzenkr. Pflanzensch. 89: 52-58.
Park, D. 1982. Phylloplane fungi: Tolerance of hyphal tips to drying. Trans. Br. mycol. Soc.79: 174-178.
Pascual, S., Magan, N., and Melgarejo, P. 1996. Improved biological control of peach twigblight by physiological manipulation of Epicoccum nigrum. Proceedings of theBrighton Crop Protection Conference - Pests and Diseases: 411-412.
Paulitz, T.C. and Bélanger, R.R. 2001. Biological control in greenhouse systems. Annu.Rev. Phytopathol. 39: 103-133.
Payne, G.A., Duncan, H.E. and Adkins, C.R. 1987. Influence of tillage on development ofgray leaf spot and number of airborne conidia of Cercospora zeae-maydis. Plant Dis. 71:329-332.
Peng, G. and Sutton, J.C. 1991. Evaluation of microorganisms for biocontrol of Botrytiscinerea in strawberry. Can. J. Plant Pathol. 13: 247-257.
Pfender, W.F. 1988. Suppression of ascocarp formation in Pyrenophora tritici-repentis byLimonomyces roseipellis, a basidiomycete from reduced-tillage wheat straw. Phyto-pathology 78: 1254-1258.
Pfender, W.F., Sharma, U. and Zhang, W. 1991. Effect of water potential on microbialantagonism to Pyrenophora tritici-repentis in wheat residue. Mycol. Res. 95: 308-314.
Pfender, W.F. and Wootke, S.L. 1988. Microbial communities of Pyrenophora-infested wheatstraw as examined by multivariate analysis. Microbial Ecol. 15: 95-113.
Pfender, W.F., Zhang, W. and Nus, A. 1993. Biological control to reduce inoculum of thetan spot pathogen Pyrenophora tritici-repentis in surface-borne residues of wheat fields.Phytopathology 83: 371-375.
Philipp, W.D. and Crüger, G. 1979. Parasitismus von Ampelomyces quisqualis auf EchtenMehltaupilzen an Gurken und anderen Gemüsearten. Z. Pflanzenkr. Pflanzensch.86: 129-142.
Plaut, J.L. and Berger, R.D. 1981. Infection rates in three pathosystem epidemics initiatedwith reduced disease severities. Phytopathology 71: 917-921.
Preece, T.F. and Dickinson, C.H. 1971. Ecology of Leaf Surface Micro-organisms. AcademicPress, London.
Raposo, R., Gomez, V., Urrutia, T. and Melgarejo, P. 2001. Survival of Botrytis cinerea insoutheastern Spanish greenhouses. Eur. J. Plant Pathol. 107: 229-236.
228 Biological control of Botrytis spp. with Ulocladium atrum
Rappoldt C. and Kraalingen, D.W.G. van 1996. The Fortran Simulation Translator, FSTversion 2.0. Introduction and reference manual. Quantitative Approaches in Sys-tems Analysis No 5. DLO-Research Institute for Agrobiology and Soil Fertility,The C.T. de Wit Graduate School for Production Ecology, Wageningen.
Rayner, A.D.M. and Webber, J.F. 1984. Interspecific mycelial interactions - an overview.In: Jennings, D.H. and Rayner, A.D.M. (eds), The Ecology and Physiology ofFungal Mycelium. Cambridge University Press, Cambridge, pp 383-417.
Reimherr, P. 1985. Atlas der Krankheiten und Schädlinge bei Cyclamen. Gartenbau undGartenwirtschaft 85: 1780-1790.
Ringer, C.E. and Grybauskas, A.P. 1995. Infection cycle components and disease progress ofgray leaf spot on field corn. Plant Dis. 79: 24-28.
Roger, C., Tivoli, B. and Huber, L. 1999. Effects of interrupted wet periods and differenttemperatures on the development of ascochyta blight caused by Mycosphaerellapinodes on pea (Pisum sativum) seedlings. Plant Pathol. 48: 10-18.
Rosati, P. 1991. The strawberry in Europe. In: Dale, A. and Luby, J.J. (eds), The Strawberryinto the 21st Century. Proceedings of the third North American StrawberryConference, Houston, USA, 14-16 February 1990, Timber Press, Oregon, USA, pp27-35.
Rosslenbroich, H.-J. and Stuebler, D. 2000. Botrytis cinerea – history of chemical control andnovel fungicides for its management. Crop Prot. 19: 557-561.
Rotem, J. 1990. Overwintering of Alternaria macrospora in cotton debris. Phytoparasitica 18:143-152.
Rotem, J. and Aust, H.J. 1991. The effect of ultraviolet and solar radiation and temperatureon survival of fungal propagules. J. Phytopathol. 133: 76-84.
Rotem, J., Wooding, B. and Aylor, D.E. 1985. The role of solar radiation, especially ultra-violet, in the mortality of fungal spores. Phytopathology 75: 510-514.
Sache, I. and Vallavieille-Pope, C. de 1995. Classification of airborne plant pathogens basedon sporulation and infection characteristics. Can. J. Bot. 73: 1186-1195.
Schoene, P., Lennartz, B. and Oerke, E.-C. 1999. Fungicide sensitivity of fungi used forbiocontrol of perthotrophic pathogens. In: Lyr, H., Russell, P.E. and Dehne, H.-W. (eds), Modern Fungicides and Antifungal Compounds. Proceedings of the 12th
International Reinhardsbrunn Symposium, Friedrichsroda, Germany, pp 477-482.Schoene, P., Oerke, E.-C. and Dehne, H.-W. 2000. A new concept for integrated control
of grey mould (Botrytis cinerea) in grapevine. Proceedings British Crop ProtectionConference - Pests and Diseases: 1031-1036.
Schlösser, E. 1978. Entwicklungsstadien von Alpenveilchenblättern (Cyclamen persicum) -Besiedlung durch Botrytis cinerea. Z. Pflanzenkr. Pflanzensch. 85: 179-185.
Schönbeck, F. and Dehne, H.-W. 1986. Use of microbial metabolites inducing resistanceagainst plant pathogens. In: Fokkema, N.J. and Heuvel, J. van den (eds),Microbiology of the Phyllosphere. Cambridge University Press, Cambridge, pp 363-375.
Schönherr, J. and Baur, P. 1996. Cuticle permeability studies: A model for estimating leachingof plant metabolites to leaf surfaces. In: Morris, C., Nicot, P. and Nguyen-The, C.(eds), Aerial Plant Surface Microbiology. Plenum Press, New York, pp 1-23.

Literature cited 229
Schuh, W. 1993. Influence of interrupted dew periods, relative humidity, and light on dis-ease severity and latent infections caused by Cercospora kikuchii on soybean. Phyto-pathology 83: 109-113.
Seddon, B. and Edwards, S.G. 1993. Analysis of and strategies for the biocontrol of Botrytiscinerea by Bacillus brevis on protected Chinese cabbage. In: Fokkema, N.J., Köhl, J.and Elad, Y. (eds), Biological Control of Foliar and Postharvest DiseasesIOBC/WPRS Bulletin 16(11), pp 38-41.
Seddon, B., Edwards, S.G., Markellou, E. and Malathrakis, N.E. 1997. Bacterial antagonist -fungal pathogen interactions on the plant aerial surface. In: Gange, A.C. and BrownV.K. (eds), Multitrophic Interactions in Terrestrial Systems. Blackwell ScientificPublishers, pp 5-25.
Shtienberg, D., Elad, Y., Niv, A., Nitzani, Y. and Kirshner, B. 1998. Significance of leafinfection by Botrytis cinerea in stem rotting of tomatoes grown in non-heated green-houses. Eur. J. Plant Pathol. 104: 753-763.
Sirjusingh, C. and Sutton, J.C. 1996. Effects of wetness duration and temperature oninfection of geranium by Botrytis cinerea. Plant Dis. 80: 160-165.
Sirjusingh, C., Sutton, J.C. and Tsujita, M.J. 1996. Effects of inoculum concentration andhost age on infection of geranium by Botrytis cinerea. Plant Dis. 80: 154-159.
Smits, J.P. 1998. Solid-state fermentation, modelling fungal growth and activity. PhD the-sis, Wageningen Agricultural University, Wageningen.
Snaydon, R.W. 1991. Replacement or additive designs for competition studies? J. Appl.Ecol. 28: 930-946.
Snedecor, G.W. and Cochran, W.G. 1989. Statistical Methods. Iowa State Univ. Press, 8th
ed., Iowa, USA.Sosa-Alvarez, M., Madden, L.V. and Ellis, M.A. 1995. Effects of temperature and wetness
duration on sporulation of Botrytis cinerea on strawberry leaf residues. Plant Dis. 79:609-615.
Spencer, D.M. 1980. Parasitism of carnation rust (Uromyces dianthi) by Verticillium lecanii.Trans. Br. mycol. Soc. 74: 191-194.
Sutton, J.C. 1990. Epidemiology and management of Botrytis leaf blight of onion and graymold of strawberry: a comparative analysis. Can. J. Plant Pathol. 12: 100-110.
Sutton, J.C. 1994. Biological control of strawberry diseases. Advances in strawberry research13: 1-12.
Sutton, J. C. and Peng, G. 1993. Biocontrol of Botrytis cinerea in strawberry leaves. Phyto-pathology 83: 615-621.
Sutton, J.C., Swanton, C.J. and Gillespie, T.J. 1978. Relation of weather variables and hostfactors to incidence of airborne spores of Botrytis squamosa. Can. J. Bot. 56: 2460-2469.
Sutton, J.C., James, T.D.W. and Rowell, P.M. 1986. BOTCAST: A forcasting system totime the initial fungicide spray for managing Botrytis leaf blight of onions. Agr.Ecosyst. Environ. 18: 123-143.
Sutton, J. C., Li, D.-W., Peng, G., Yu, H., Zhang, P. and Valdebenito-Sanhueza, R.M.1997. Gliocladium roseum, a versatile adversary of Botrytis cinerea in crops. Plant Dis.81: 316-328.

230 Biological control of Botrytis spp. with Ulocladium atrum
Swinburne, T.R. 1981. Iron and iron chelating agents as factors in germination, infection andaggression of fungal pathogens. In: Blakeman, J. P. (ed), Microbial Ecology of thePhylloplane. Academic Press, London, pp 227-243.
Szandala, E.S. and Backhouse, D. 2001. Suppression of sporulation of Botrytis cinerea byantagonists applied after infection. Austr. Plant Pathol. 30: 165-170.
Thakur, V.S. and Sharma, R.D. 1999. Effect of urea on microbial degradation of apple leaflitter and its relationship to the inhibition of pseudothecial development of Venturiainaequalis. Indian J. Agr. Sci. 69: 147-151.
Thomas, M.R. and Shattock, R.C. 1986. Effects of fungicides on Drechslera spp. and leafsurface filamentous saprophytic fungi on Lolium perenne. Plant Pathol. 35: 120-125.
Tukey, H.B. Jr. 1970. The leaching of substances from plants. Annu. Rev. Plant Phys. 21:305-324.
Turkensteen, L.J. 1979. Ulocladium atrum, el organismo causal de Kasahui, enfermedad foliarde la papa en el altiplano del Peru. Fitopatologia 14: 85-86.
Upper, C.D. 1992. Manipulation of microbial communities in the phyllosphere. In: Andrews,J.H. and Hirano, S.S. (eds), Microbial Ecology of Leaves. Springer, New York, pp451-463.
Verhaar, M.A., Strien, P.A.C. van and Hijwegen, T. 1993. Biological control of cucumberpowdery mildew (Sphaerotheca fuliginea) by Verticillium lecanii and Sporothrix cf. flocculosa.In: Fokkema, N.J., Köhl, J. and Elad, Y. (eds), Biological Control of Foliar andPostharvest Diseases, IOBC/WPRS Bulletin 16(11), pp 79-81.
Vincelli, P.C. and Lorbeer, J.W. 1989. BLIGHT-ALERT: A weather-based predictive sys-tem for timing fungicide applications on onion before infection periods of Botrytissquamosa. Phytopathology 79: 493-498.
Visser, C.L.M. de 1996. Field evaluation of a supervised control system for Botrytis leaf blightin spring sown onions in the Netherlands. Eur. J. Plant Pathol. 102: 795-805.
Vloutoglou, I., Fitt, B.D.L. and Lucas, J.A. 1995. Periodicity and gradients in dispersal ofAlternaria linicola in linseed crops. Eur. J. Plant Pathol. 101: 639-653
Wessels, J.G.H. and Sietsema, J.H. 1984. Wall structure and growth in Schizophyllumcommune. In: Jennings, D.H. and Rayner, A.D.M (eds), The Ecology andPhysiology of the Fungal Mycelium. Cambridge University Press, Cambridge,pp 27-48.
Whipps, J.M. 1992. Status of biological disease control in horticulture. Biocontrol Sci. Techn.2: 3-24.
Whipps, J.M. and Gerlagh, M. 1992. Biology of Coniothyrium minitans and its potential for usein disease biocontrol. Mycol. Res. 96: 897-907.
Wilkinson, V. and Lucas, R.L. 1969. Influence of herbicides on the competitive ability offungi to colonise plant tissues. New Phytopathol. 68: 701-708.
Williamson, M.A. and Fokkema, N.J. 1985. Phyllosphere yeasts antagonize penetration fromappressoria and subsequent infection of maize leaves by Colletotrichum graminicola.Neth. J. Pl. Pathol. 91: 265-276.
Yoder, O.C. 1980. Toxins in pathogenesis. Annu. Rev. Phytopathol. 18: 103-129.Yohalem, D. 1997. Prospects for the biological control of foliar plant diseases in Danish
greenhouses. 14th Danish Plant Protection Conference. Pests and Diseases. SpecialReport Statens Planteavlsforsog. no. 8, pp 199-206.

Literature cited 231
Yohalem, D.S. 2000. Microbial management of early establishment of grey mould in potroses. DJF-rapport 12: 97-102.
Yu, H. and Sutton, J.C. 1999. Density dynamics of Gliocladium roseum in relation to biologicalcontrol of Botrytis cinerea in red raspberry. Can. J. Plant Pathol. 21: 23-32.
Yunis, H. and Elad, Y. 1989. Survival of dicarboximide-resistant strains of Botrytis cinerea inplant debris during summer in Israel. Phytoparasitica 17: 13-21.
Zhang, W. and Pfender, W.F. 1993. Effect of wetting-period duration on ascocarpsuppression by selected antagonistic fungi in wheat straw infested with Pyrenophoratritici-repentis. Phytopathology 83: 1288-1293.
Zhou, T. and Reeleder, R.D. 1989. Application of Epicoccum purpurascens spores to controlwhite mold of snap bean. Plant Dis. 73: 639-642.
Zhou, T. and Reeleder, R.D. 1991. Colonization of bean flowers by Epicoccum purpurascens.Phytopathology 81: 774-778.
Zimand, G., Elad, Y., Gagulashvilly, N. and Chet, I. 1995. Effect of the biocontrol agentTrichoderma harzianum T-39 on the pathogenicity of Botrytis cinerea. Phytoparasitica23: 241.
Zitter, T.A. and Hsu, L.W. 1992. Influence of temperature and fungicide on germination,growth, and virulence of Ulocladium cucurbitae on cucumber. Phytopathology 82:358-362.

232 Biological control of Botrytis spp. with Ulocladium atrum