BIOLOGICAL CHEMISTRY -...
100
BIOLOGICAL CHEMISTRY Chapter 5: CARBOHYDRATE METABOLISM Dr. T.K. Bose Department of Zoology, Miranda House, University of Delhi, Delhi-110007, India Date of Submission 2/9/2009
Transcript of BIOLOGICAL CHEMISTRY -...

BIOLOGICAL CHEMISTRY
Chapter 5: CARBOHYDRATE METABOLISM
Dr. T.K. Bose
Department of Zoology, Miranda House,
University of Delhi, Delhi-110007, India
Date of Submission 2/9/2009

CONTENTS
Introduction
Sections:
5.1 GLYCOLYSIS
5.2 OXIDATION OF PYRUVATE
5.3 CITRIC ACID CYCLE
5.4 HEXOSE MONOPHOSPHATE PATHWAY
5.5 GLYCOGEN METABOLISM
5.5.1 Glycogenolysis
5.5.2 Glycogenesis
5.5.3 Reciprocal regulation of glycogenolysis and glycogenesis
5.6 GLUCONEOGENESIS
5.6.1 Pathway of gluconeogenesis
5.6.2 Reciprocal regulation of glycolysis and gluconeogenesis
5.7 MAINTENANCE OF BLOOD GLUCOSE
Credits for illustrations
2

CARBOHYDRATE METABOLISMINTRODUCTION
Carbohydrates constitute a major part of our diet and our food is the ultimate source of all the sugars that enter our metabolic pathways. About two-thirds of ingested carbohydrate is the plant polysaccharide, starch. Disaccharides like lactose and sucrose and some other polysaccharides like cellulose are also a part of our food, but our intake of free monosaccharides like glucose, fructose and galactose is relatively minimal.
The table below indicates the class of dietary carbohydrate from which we derive the main sugars that enter our blood stream.
TABLE 5.1. COMMON CARBOHYDRATES IN OUR FOOD
(Source: Vander, Sherman and Luciano, 2001, p 562)
Ingested food is digested by enzymatic hydrolysis in our gastrointestinal tract (GIT) and the products obtained are simpler, absorbable molecules. All the hydrolytic reactions in digestion are exergonic and proceed to completion. Starch is digested by the enzyme α-amylase (present in saliva and pancreatic juice) to yield maltose and short-chain dextrins. These products, together with other ingested disaccharides, are degraded to their constituent monosaccharides by disaccharidases present in the luminal membranes of epithelial cells in the small intestine.
We do not have enzymes to digest cellulose and some other polysaccharides that constitute the “fiber” in our diet, but bacteria in the colon can partially metabolize them.
The products of successful carbohydrate digestion are primarily glucose, fructose and galactose. They are absorbed from the intestinal lumen i.e. transported across the intestinal epithelium into the blood. Fructose enters the epithelial cells by facilitated diffusion while glucose and galactose enter by secondary active transport coupled to sodium. All of them are then transported across the baso-lateral membranes of the epithelial cells to the blood using facilitated diffusion transporters.
The portal vein carries the absorbed monosaccharides from the small intestine to the liver. Subsequently the sugars enter the pathways of carbohydrate metabolism in the hepatic cells or in the cells of our body tissues.
3
Glucose is the central molecule in carbohydrate metabolism. An overview of carbohydrate metabolism (fig. 5.1) shows the links of glucose to almost all major groups of biomolecules in the cell. Fructose and galactose have more restrictive routes of utilization.
RNADNA
ET HANO L
Ribosephosphate G LYCO G ENGlucose
O T HER SUG ARSG LYCO CO NJUG ATES
Triose phosphate
PyruvateLACT AT ELIPIDS
PRO T EINS
AMINOACIDS
+ -eH+ electrontransport chain
H2OO2
A T P
citricacid cycle C O2
Acetyl A-Co
F AT T Y ACIDS
Fig 5.1. Overview of carbohydrate metabolism: Glucose is the central molecule in carbohydrate metabolism and its metabolites form links with protein, lipid and nucleic acid metabolism. (Reversibility of pathways has not been indicated).
All major pathways of carbohydrate metabolism are connected to conversions of glucose (fig. 5.2). This is not surprising since glucose is the main sugar in the blood and the main energy fuel in the body. The metabolic pathways that we will deal with in this chapter are:
1. Glycolysis2. Oxidation of Pyruvate3. Citric Acid Cycle4. Pentose Phosphate Pathway5. Glycogen metabolism:
a. glycogenolysisb. glycogenesis
6. Gluconeogenesis
4

Glycolysis, oxidation of pyruvate, citric acid cycle, pentose phosphate pathway and glycogenolysis are catabolic pathways, while glycogenesis and gluconeogenesis are anabolic in nature.
When considered in isolation, the first three pathways in the list above, involve only a modest gain of energy as ATP. However a substantial gain in ATP is obtained when the products of the pathways are linked to the mitochondrial electron transport chain. The other pathways (4, 5 and 6) do not directly involve a major gain or loss of ATP.
Pathways 1 to 4 provide reductants (NADH, FADH2 and NADPH) for other metabolic reactions. Glycogen metabolism and gluconeogenesis provide glucose or store it for later use. They are typical to the animal system only.
glycogenesis
alcohol
2 C O2
2
2 LactateC 3 C 2
fermentation
2 C O22Ethanol +
oxidativedecarboxylation
4 C O2
Acetyl- Co A2C
cyclecitric acid
2 PyruvateC 3lactate
fermentation
C skeleton fromnon - carbohydrates
G LUCO SEC 6
Ribose+ C O2C5
pentose phosphatepathway
glycogenolysis
glycolysis
gluconeogenesis
Glycogen
nC 6 )(
Fig. 5.2. Major pathways of glucose metabolism, showing transformations of its C-skeleton. Anabolic pathways are in blue; catabolic pathways are in pink.
The six pathways, their energy implications and their regulatory mechanisms are described in separate sections of this chapter (Sections 1 to 6). We have briefly touched upon the regulation of blood glucose in Section 7. We have primarily dealt with carbohydrate metabolism in heterotrophs. Some of the pathways (Pathways 1 to 4) are common to plants.
5

However, photosynthesis which is an anabolic pathway converting CO2 to glucose, and is typical to autotrophs, will not be discussed in this chapter.
Chapter 5 Section 1GLYCOLYSIS
(Embden-Meyerhoff Pathway)
INTRODUCTIONGlycolysis is an almost universal pathway for catabolism of glucose in animals and plants. It occurs in all cells of our body. The process is a partial oxidation of glucose where the 6-C molecule is cleaved to form two 3-C units (pyruvate), and the energy released is conserved in the form of ATP and NADH. The objective of glycolysis is to provide (i) energy and (ii) intermediates for other metabolic pathways.
all cellsaerobicstate
CoA
N A D H
Citric acidcyc le
ACETYL -
CO2
Oxidativephosphorylation
N A D H + FADH 2
+ A T P+ + H2OFA DN A D +
O2
+
yeast
+ETHANOL C O2
state
muscle , RBC
+LACTATE N A D
an
A T P
PYRUVATE
FRUCTOSE BISPHOSPHATE1, 6 -
A T P + N A D H
aerobic
Ingestedcarbohydrate
Cellular glycogen
GLUCOSE
Fig 5.1.3 Summary of glycolysis and processing of pyruvate by aerobic (green) and anaerobic (blue) methods. Only the main intermediates and products are shown; stoichometry has not been indicated.
6

The major sources of glucose for glycolysis are dietary carbohydrates and cellular glycogen. Ingested carbohydrates are digested to their constituent monosaccharides, absorbed in the intestine, conveyed by blood to the liver and then distributed to the tissues. Glucose is also obtained by degradation of glycogen reserves in the liver and muscle.
Other monosaccharides that enter glycolysis are fructose and galactose, and to some extent, mannose.
Glucose (Glc) from the blood enters the cell, using membrane-located, tissue-specific glucose transporter(s) ((e.g. GLUT2: liver, pancreatic β-cells; GLUT4: muscle, adipose tissue). Normally muscle cells have a low-capacity transport system, which requires insulin for maximum uptake of glucose. On the other hand, hepatocytes have a high-capacity, insulin-insensitive rapid transport system for entry of glucose.
Fig. 5.1.4. Proposed model of a glucose transporter, GLUT 1 (Source: Nelson and Cox, 2005, p 393 fig 11-30)
REACTIONS OF GLYCOLYSISGlucose undergoes glycolysis by a sequence of 10 cytosolic reactions, seven of which are reversible while three are irreversible. The first five reactions (Reactions 1 to 5 in Fig 5..1.2 constitute the “preparatory” or “investment” phase since they use ATP, while the last five reactions (Reactions 6 to 10 in Fig 5..1.2) constitute the “pay-off” or “dividend” phase and yield ATP.
7

Fig. 5.1.5. The pathway of glycolysis: Numbers represent the order of the reactions. Reactions 1 to 5 constitute the ‘preparatory phase’ in which ATP is consumed while reactions 6 to 10 constitute the ‘pay-off phase’ in which ATP is produced. The end product pyruvate, can be processed anaerobically or aerobically (see text).The enzymes catalyzing reactions 1 to 10 are:1. hexokinase/glucokinase2. phosphohexoisomerase3. phosphofructokinase4. aldolase5. triose phosphate isomerase6. glyceraldehyde 3-phosphate dehydrogenase7. phosphoglycerate kinase8. phosphoglycerate mutase9. enolase10. pyruvate kinase
(Source: Vander et al 2001, p 71 fig 4-19)
8

For ease in understanding details of the glycolytic pathway, we have grouped the sequence of ten reactions into four parts. We emphasize, however, that there is no actual division in the pathway.
I. Conversion of Glucose to Fructose 1,6-bisphosphate:
This sequence of 3 reactions activates glucose by phosphorylation and commits it to glycolysis as fructose 1,6-bisphosphate (Fru 1,6-BP). The required phosphoryl groups are obtained from ATP.
H
6
H
H
H
HO
HO
O
O
2C HH O
H
1 2
O
H
H
phoshpohexose isomerase
P6
2C H O
H
D P
H
H
H
HHOHO
HO
H
O
O
2C H O
H
P6
hexokinase/glucokinase
2+A O 2C HH O
HOH
HO H
H O
M g
A T P
Glucose Glucose 6-phosphate Fructose 6-phosphate
∆G’o = -16.7 k J/mol ∆G’o = 1.7 k J/mol
6C
H
P1
6
2C H O
H
O 2C H O
HO
PP
3
2+
phosphofructo- kinase-1
O 2C HH O
HOH
HO H
H O
P2H O
M g
A T P DA
H
HO H
H O
Fructose 6-phosphate Fructose 1,6-bisphosphate
∆G’o= -14.2 k J/mol
Fig 5.1.6. Conversion of glucose to fructose 1,6-bisphosphate with consumption of 2 molecules of ATP for every molecule of glucose.
Reaction 1 is a ‘priming’ reaction in which glucose is activated to glucose 6-phosphate (Glc 6-P) by phosphorylating it with ATP. The reaction is irreversible and catalyzed by the enzymes hexokinase (HK) or glucokinase (GK), depending on the tissue concerned. Both kinases are isozymes and have two substrates, glucose and Mg2+-ATP.
Fig. 5.1.7. Model of hexokinase with bound glucose (red) (Source: Nelson and Cox, 2005, p 218 fig 6-22)
9

HK is a highly active enzyme in all cells except the liver parenchyma, where GK (also called hexokinase IV) is dominant. The properties of these two enzymes reflect the difference in the role of hepatic cells vis-a-vis non-hepatic cells in glucose metabolism. HK has a high affinity for glucose and initiates glycolysis even when available Glc concentrations are low. GK has low affinity for glucose and operates optimally only when blood Glc is >5 mmol/L (normal = 4.5 - 5.55 mmol/L). Thus the liver does not normally utilize glucose as energy fuel. HK can use other dietary monosaccharides like fructose or mannose as substrate, but GK is specific for only glucose.
Reaction 2 is a reversible isomerization in which phosphohexose isomerase converts Glc 6-P (aldose), to fructose 6-phosphate (Fru 6-P; ketose)). Re-arrangement of C=O and –OH between C-1 and C-2 of glucose is necessary for subsequent phosphorylation and cleavage in reactions 3 and 4.
Reaction 3 is another irreversible phosphorylation, catalyzed by phosphofructokinase-1 (PFK1), a key enzyme of glycolysis. The product is fructose 1,6-bisphosphate (Fru 1,6-BP). This is the first committed step of glycolysis;
Glc 6-P and Fru 6-P can be diverted to other pathways but Fru 1,6-BP will only continue with glycolysis.
Reactions 1 and 3 are both exergonic and each consumes one molecule of ATP. Hence, the reaction sequence 1 to 3 results in an energy loss of 2 ATP molecules per molecule glucose.
II. Cleavage of Fructose 1,6-bisphosphate to Dihydroxyacetonephosphate and Glyceraldehyde 3- phosphate:
4 C= OH
CH OH
C H2OPH
OCH2O P
OH
CH2O P
H
HOH
OH
aldolase
C H2OP
C= OH
C H2OH
+
Fructose Dihydroxyacetone Glyceraldehyde 1,6-bisphosphate phosphate 3-phosphate
∆G’o = 23.8 k J/mol
P2C H O
C O=
2C HH O P2CH O
C HHO
C O=H
5triose phosphate isomerase
∆G’o = 7.5 k J/mol
Fig. 5.1.8. Cleavage of fructose 1,6-bisphosphate to the functional isomers dihydroxyacetone phosphate and glyceraldehyde 3-phosphate.
10

Reaction 4 is essentially an aldol cleavage. Aldolase catalyzes cleavage of the 6-C unit of Fru 1,6-BP into two 3-C units, producing an aldose, glyceraldehyde 3-phosphate (Glyc3-P), and a ketose, dihydroxyacetonephosphate (DHAP). Glyc-3P is directly used in the subsequent step of glycolysis, but DHAP can be used only after isomerization to Glyc 3-P in reaction 5. The forward direction of reactions 4 and 5 depends on the utilization of Glyc 3-P in subsequent steps.
The interconversion of the triose phosphates by triose phosphate isomerase in reaction 5 makes C-1, C-2 and C-3 of the starting glucose molecule indistinguishable from its C-6, C-5 and C-4 respectively.
Fig 5.1.9. Derivation of carbon atoms of glyceraldehyde 3-phosphate from the 6 carbon atoms of glucose
6- phosphate. (Source: Nelson and Cox, 2005, p 522)
There is no gain or loss of ATP in this reaction. Although the aldolase reaction has a strongly positive free energy change in the direction of Fru 1,6-BP, the low concentrations of reactants in the cell ensures that there is little change in free energy of the system.
Subsequently, both triose units obtained from glucose undergo all the reactions 6 to 10.
Summary of the “investment” phase of glycolysis: Reactions 1 to 5 consume 2ATP per molecule of glucose
11

III. Conversion of Glyceraldehyde 3-P to 3-Phosphoglycerate:
C = OH
CH OH
C H2OP
+
6N AD+ H+N ADH +
H3PO4
C
O
OP
CH OH
C H2OPglyceraldehyde3-phosphate
dehydrogenase
Glyceraldehyde 1,3-bisphosphoglycerate 3-phosphate
∆G’o = 6.3 k J/mol
C
O
OP
CH OH
C H2OP
+ A D P
7
phosphoglycerate kinase
Mg2+CH OH
C H2OP
COO-
+ A PT
1,3-bisphosphoglycerate 3-phosphoglycerate
∆G’o = -18.5 k J/mol
Fig. 5.1.10. Conversion of glyceraldehyde 3-phosphate to 3-phosphoglycerate which results in the production of ATP and NADH. This sequence constitutes ‘a coupled reaction’ and is an example of ‘substrate level phosphorylation (see text below).
Reactions 6 and 7 together constitute a crucial energy-coupling step in which reaction 6 produces a high-energy phosphoester derivative, 1,3-bisphosphoglycerate (1,3-BPG), which then directly transfers ~ P to ADP producing ATP in reaction 7.
12

Fig. 5.1.11. Details of the reaction catalyzed by glyceraldehyde 3-phosphate dehydrogenase to show phosphorylation of the substrate using inorganic phosphate. (Source: Murray et al 2003, p 139 fig 17-3)
Let us examine the details of reaction 6. The reaction is endergonic and stores free energy in 1,3-BPG. Glyceraldehyde 3-phosphate dehydrogenase is a tetramer with 4 identical subunits, each with two binding sites viz one for its co-enzyme NAD+ and the other for its substrate, Glyc3-P. The enzyme-substrate complex is a thio-hemiacetal with its terminal -CHOH oxidized to a thioester by NAD+. The reduced co-enzyme NADH.H+, is easily displaced by a second molecule of NAD+. The –C~S– bond of the thioester is then replaced by a high-energy phosphoester bond using inorganic phosphate. The product 1,3-BPG is released and the original state of the enzyme is restored.
In reaction 7, phosphoglycerate kinase converts 1,3-BPG to 3-phosphoglycerate (3-PGA). The reaction is strongly exergonic and the stored energy of the previous reaction is used to generate ATP. This is the 1st substrate-level phosphorylation, where a phosphoryl group is transferred from the substrate 1,3-BPG to ADP, without using mitochondria or molecular oxygen.
The overall reaction sequence (6+7) is exergonic, though both reactions are individually reversible under cellular conditions.
This is the first “pay-off” step of glycolysis. In terms of energy, it yields 1ATP and 1NADH.H+
(extramitochondrial) for every 3-C unit obtained from glucose.
13

IV. Conversion of 3-Phosphoglycerate to Pyruvate:
+
COO-
PC O
C H2
H2OCH OH
C H2OP
COO-phosphoglycerate
Mg2+
mutase
8COO-
PCH O
C H2OH
9
enolase
3-Phosphoglycerate 2-Phosphoglycerate Phosphoenolpyruvate
∆G’o = 4.4 k J/mol ∆G’o = 7.5 k J/mol
+ A D P + A PT
COO-
PC O
C H2
COO-
C O
C H
=
3
Mg2+
pyruvate kinase
, K+
10
Phosphoenolpyruvate Pyruvate
∆G’o = -31. 4 k J/mol
Fig. 5.1.12. Conversion of 3-phosphoglycerate to pyruvate with further yield of ATP
This sequence of 3 reactions generates ATP. Reaction 8 is catalyzed by phosphoglycerate mutase, which shifts a phosphoryl group from C-3 to C-2, thus converting 3-PGA to 2-PGA. The enzyme itself participates in the reaction and Mg2+ is essential. Reaction 9 causes a redistribution of energy in 2-PGA by dehydrating the molecule and generates a high-energy intermediate, phosphoenolpyruvate (PEP). The enzyme used is enolase.
Reaction 10 is a 2nd substrate-level phosphorylation catalyzed by pyruvate kinase. The phosphoryl group is transferred from PEP to ADP producing ATP, and the final product of glycolysis, i.e. pyruvate. Pyruvate kinase requires K+ and Mg2+/Mn2+ for its action.
The standard free energy change of PEP hydrolysis is -61.9 kJ/mol. Approximately half of this energy is conserved as ATP (-30.5 kJ/mol) and the rest is used to drive the reaction towards ATP synthesis.
The system gains 1 ATP for every 3-C unit acted on by pyruvate kinase. Recall that glucose yielded two 3-C units at the end of reaction 4. Since both 3-C units have gone through reactions 6 to 10, hence 2 ATP molecules have been produced in each of the reactions 7 and 10 i.e. 4 ATP have been obtained per glucose molecule.
14

Summary of the “dividend” phase of glycolysis: Reactions 6 to 10 directly generate 4ATP per molecule of glucose
We can now write the overall equation for glycolysis:
Glucose + NAD+ +2ADP + 2Pi à 2 Pyruvate + 2 NADH + 2H+ + 2ATP + 2H2O
Summarizing the net energy change in glycolysis, we have:
Reactions 1 to 5 utilize: 2 ATP/glucose molecule
Reactions 6 to 10 generate: 4 ATP/glucose molecule
Net gain = (4-2) ATP = 2 ATP/glucose molecule
Hence:
Glycolysis of 1 glucose molecule results in a direct net gain of 2 ATP molecules
Under actual cellular concentrations of reactants and products, the energy released in conversion of glucose to pyruvate is recovered as ATP with an efficiency of >60%. The remaining chemical energy in pyruvate can yield more ATP if pyruvate undergoes oxidation in the TCA cycle.
ENTRY OF OTHER SUGARS INTO GLYCOLYSISSeveral sugars in the diet are processed for entry into glycolysis as shown below:
MONOSACCHARIDES
Fructosefructokinase
A T PA D P
Mg2+
( in liver )Fructose
1- phosphate
aldolasefructose 1- phosphate
Glyceraldehyde Dihydroxyacetone phosphate
A T P
A D P
Mg2+triose kinase
isomerase
Glyceraldehyde- phosphate3
GLYCOLYSIS
15

Mannose
GLYCOLYSIS
isomerase
ATPMg2 +
DA P
Mannosehexokinase
Fructose6-phosphate6-phosphate
phosphoglucomutase
-
GLYCOLYSIS
N A D+
Glucose 6-phosphate
galactose 1-phosphateuridylyl transferase
Glucose 1-phosphate
Galactosegalactokinase
A TPDA P
Mg2+Galactose 1-phosphate U DP-Glucose
U DP-Galactose
4-epimerase- galactoseUDP
DISACCHARIDES
Maltose +maltase
OH2 2 Glucose GLYCOLYSIS
GLYCOLYSISlactase GlucoseLactose + OH2 + Galactose
Sucrose Fructosemaltase GLYCOLYSISGlucose ++ OH2
Fig.5.1.13. The route of entry of common sugars into glycolysis. Breakdown of disaccharides is primarily a process of digestion in the intestine but the processing of monosaccharides is a metabolic sequence.
Fructose enters glycolysis by two different pathways depending on the tissue. In adipose tissue and muscle, hexokinase converts Fructose to Fru 6-P which enters glycolysis. The affinity of HK for fructose is several times less than that for glucose. In the liver a specific enzyme, fructokinase, converts fructose to Fru 1-P which cannot enter glycolysis. An aldol type cleavage of Fru 1-P to glyceraldehyde and DHAP followed by phosphorylation enables entry into glycolysis.
Certain polysaccharides and glycoproteins in food yield mannose. It is first converted to mannose 6-P by HK and then isomerized to Fru 6-P for glycolysis.
Galactose (Gal) is a digestion product of lactose. A sequence of 4 reactions in the liver converts galactose to Glc 6-P for entry into glycolysis. First, galactokinase phosphorylates Gal to Gal 1-P. In the next step, uridylyl transferase shifts UDP from UDP-Glc to Gal 1-P, forming Glc 1-P and UDP-Galactose. Phosphoglucomutase now isomerizes Glc 1-P to Glc 6-P for glycolysis. UDP-Gal-4-epimerase converts UDP-galactose back to UDP-glucose for re-entry into the transferase reaction. The epimerization involves an oxidation and reduction at C-4, and the coenzyme used is NAD+.
16

Lack of the enzymes transferase, epimerase or galactokinase causes a clinical disorder called galactosemia.
REGENERATION OF NAD+ A cell has limited reserves of NAD+. For continuation of glycolysis it is essential that the coenzyme is quickly regenerated. The method for regeneration depends on the redox state of the tissue:
I. Anaerobic state – occurs in active skeletal muscle (when oxygen supply < demand), in RBC (no mitochondria), and in deep-sea animals (O2-deficient environment). These tissues carry out anaerobic glycolysis.
∆G’o = -25.1 kJ/mol
Fig. 5.1.14. Regeneration of NAD+ by anaerobic conversion of pyruvate to lactate. The reaction is carried out by lactate dehydrogenase. Reversibility of the reaction has not been shown. (Source: Vander et al 2001, p 72 fig 4-20)
Muscle and RBC carry out lactate fermentation. Pyruvate is reduced to lactate in the cytosol by lactate dehydrogenase (LDH). The reductant used is NADH.H+ so that NAD+ is regenerated to continue glycolysis. Lactate accumulating in the tissues, is carried away by the blood for gluconeogenesis in the liver. This prevents metabolic acidosis. There are several tissue-specific isozymes of LDH, and their identification is useful in clinical diagnosis.
In mammalian RBC, 90% of total energy yield is from lactate fermentation. Additionally, the reaction catalyzed by phosphoglycerate kinase may be by-passed, producing 2,3-bisphosphoglycerate (instead of 1,3-BPGA). The 2,3-BPGA combines with hemoglobin, decreases its affinity for O2 and thereby facilitates unloading of O2 from oxyhemoglobin. The by-pass reaction is not linked to the phosphorylation of ADP to ATP and hence, there is no energy gain in the process.
17

phosphoglyceratekinase
A D P
A T P
Glyceraldehyde3 - phosphate
glycerate1, 3 - Bisphospho-
glycerate, 3 - Bisphospho-2
bisphosphoglyceratemutase
-
H2 O
P iglycerate3 - bisphospho
phosphatase
,2
3 - phosphoglycerate
Fig 5.1.15. Production of 2,3-bisphosphoglycerate in mammalian RBC.
C
CH3
OHH2
COO-
C=O
CH3
C
CH3
H = O
C O2T PPMg2+
pyruvatedehydrogenase
N A D+N ADH + H+
alcoholdehydrogenase
Pyruvate Acetaldehyde Ethanol
Fig 5.1.16. Fermentation of pyruvate to ethanol.
In yeast, anaerobic glycolysis is by ethanol fermentation and the final products are ethanol and CO2. The enzyme pyruvate decarboxylase, which enables the reaction, is absent in mammals. As Elliot and Elliot (2005) very aptly comment, its absence is beneficial for us, otherwise vigorous exercise would have been a very intoxicating experience!
In all the above anaerobic conditions the regeneration of NAD+ is not associated with yield of ATP.
Hence:
NET GAIN IN ANAEROBIC GLYCOLYSIS REMAINS AT 2 ATP PER MOLECULE OF GLUCOSE
It is known that ∆G’o for the reaction Glucose à Lactate = -196 kJ/mol
The energy conserved in 2 molecules of ATP = (2 x 30.5) kJ/mol = 61 kJ/mol
Hence, under standard conditions, the efficiency of anaerobic glycolysis in conserving energy is approximately 31%.II. Aerobic state – The NADH.H+ produced in glycolysis is extramitochondrial. Its re-oxidation in the mitochondrial electron transport system (ETS) can generate ATP. Since the mitochondrial membrane does not allow free passage of NADH.H+, a shuttle system is ingenuously used to transport reducing equivalents from cytosolic NADH.H+ to acceptor molecules in the mitochondrial matrix. The yield of ATP depends on the type of shuttle system used.
18

Fig 5.1.17. The glycerophosphate shuttle for transfer of reducing equivalents from cytosol to mitochondrial electron transport chain. The outer mitochondrial membrane is not a barrier to transport and has not been shown. (Source: Nelson and Cox, 2005, p 715 fig 19-28)
The glycerophosphate shuttle is used in skeletal muscle. Cytosolic glycerol 3- phosphate dehydrogenase transfers electrons (and H+) from NADH.H+ to DHAP and regenerates NAD+ to continue glycolysis. Concomittant reduction of DHAP produces glycerol 3-phosphate. An isozyme of the dehydrogenase, bound to the inner mitochondrial membrane, now regenerates DHAP by transferring the reducing equivalents from glycerol 3-phosphate to FAD for oxidative phosphorylation in the ETS. This process yields 1.5 ATP per molecule of NADH.H+ re-oxidised, i.e. 3 ATP per molecule of glucose that undergoes glycolysis.
. Fig. 5.1.18 The malate shuttle for transfer of NADH from cytosol to mitochondrion. The colored ovals represent antiport proteins, one for malate-α-keoglutarate (blue) and the other for gluamate-aspartate (red). The permeable outer mitochondrial membrane has not been shown.
(Source: Lodish et al, 2003, p 311 fig 8-10)
19

The malate-aspartate shuttle operates in the liver and heart and is more energy-efficient. In this case the reducing equivalents from cytosolic NADH.H+ are carried by malate and transferred finally to mitochondrial NAD+ for oxidative phosphorylation. Hence the energy yield is 2.5 ATP per molecule of NADH.H+ i.e. 5 ATP per molecule of glucose that undergoes glycolysis.
We can now state that:
Net gain in aerobic glycolysis = (2 + 3/5) ATP = 5/7 ATP per molecule of glucoseREVERSIBILITY OF GLYCOLYSIS A re-look at the values of ∆G’o for the ten reactions of glycolysis shows that seven of them are physiologically reversible. For the reactions catalyzed by hexokinase, phosphofructokinase and pyruvate kinase, the equilibrium lies too far to the right. Hence, the overall glycolytic pathway is irreversible in the cell.
In order to reverse glycolysis, the three irreversible reactions are “by-passed”. We discuss these methods in gluconeognesis. (Section 6)
INHIBITORS OF GLYCOLYSISArsenate is a competitive inhibitor of glyceraldehyde 3-phosphate dehydrogenase. It competes with Pi to form 1-arseno, 3-phosphoglycerate, which spontaneously yields 3-phosphoglycerate and heat without producing ATP. Iodoacetate also blocks the substrate-binding site of the same enzyme.
Fluoride inhibits enolase. It is used to prevent glycolysis in blood samples which have been collected for glucose estimation.
REGULATION OF GLYCOLYSISGlycolysis is the major pathway for using glucose as an energy fuel. Accordingly, its regulation depends on the energy state of the cell and on the levels of blood glucose. Regulatory mechanisms maintain nearly constant ATP levels as well as an adequate supply of useful glycolytic intermediates for other pathways. In times of need, regulation attempts to ensure that adequate glucose is conserved for the brain and RBC.
The regulatory enzymes of glycolysis are hexokinase/glucokinase, phosphofructokinase-1 and pyruvate kinase. The sites for control are the three irreversible reactions:
• Glucose à Glucose 6-phosphate
• Fructose 6- phosphate à Fructose 1,6-bisphosphate
• Phosphoenolpyruvate à Pyruvate
The activity of the three regulatory enzymes is controlled by allosteric and covalent mechanisms and depends on the secretion of the hormones insulin and glucagon. When blood glucose is low, the pancreas secretes a high ratio of glucagon to insulin; the ratio is reversed when blood glucose increases above normal levels.
1. Regulation of Hexokinase/GlucokinaseIt is economical for a cell to control the 1st reaction of a metabolic pathway. In extrahepatic tissues hexokinase is inhibited allosterically (product feedback inhibition) by Glc 6-P i.e. the activity of the enzyme responds to the local needs of the cell. High [Glc 6-P] is a signal that the cell does not need glucose for energy or for any other purpose. However, control of HK is not the most effective step in regulation of glycolysis since Glc 6-P is needed for other pathways like glycogenesis and HMP.
20

In the liver, glucokinase is an inducible enzyme. It is not inhibited by Glc 6-P but it responds to the nutritional and hormonal state of the body. When blood levels of glucose fall, preferential uptake of glucose by the muscle, RBC and brain vis-a-vis the liver, is ensured by the low affinity of GK for glucose. GK is kept in the nucleus and released for optimal activity only when glucose levels are high. Thus, the system ensures that Glc 6-P is produced primarily for storage as glycogen in the liver, only when blood glucose is high. Insulin induces synthesis of GK, whereas the antagonistic hormone, glucagon, is its repressor.
Fig.5.1.19. Regulation of glucokinase (hexokinase IV). The regulator protein in the nucleus allows release of the enzyme from the nucleus to the cytosol for catalytic activity only when the concentration of glucose is high. (Source: Nelson and Cox, 2005, p 578 fig 15-17}
2. Regulation of Phosphofructokinase-1The most important regulatory enzyme in glycolysis is phosphofructokinase-1, which catalyzes the first committed step of glycolysis by producing Fru 1,6-BP. Increase in the levels of Fru 1,6-bisphosphate stimulates the rate of glycolysis. The levels of Fru 1,6-BP depend on the relative activity of two opposing enzymes: PFK-1 which produces it from Fru 6-P, and fructose bisphosphatase-1 (FBPase-1) which dephosphorylates it back to Fru 6-P. Allosteric modulators of these enzymes ensure that [Fru 1,6-BP] is maintained according to the requirements of the cell.
21

Fructose 1,6-bisphosphate
Fructose 6-phosphate
KP F -1
G LYCO LYSIS
PTA --citrate
-+H
+ A PM A DP,
-Fru 2,6-BP
+
-
Fructose 6-phosphate
G LUCO NEO G ENESIS
aseFBP -1
Fructose 1,6-bisphosphate
Fig 5.1.20. Allosteric modulators of PFK-1 (phosphofuctokinase-1) and FBPase-1 (fructose 1,6- bisphosphae-1)
The allosteric factors in regulation of PFK-1 are:
a. Ratio of [ATP] : [AMP] – High [ATP] inhibits while high [AMP] stimulates PFK-1
b. [Citrate] – Glycolysis is the natural feeder pathway for the TCA cycle in which citrate is the first product. If citrate accumulates in the mitochondrion, further channelizing of pyruvate into the cycle is wasteful. The system ensures that high [citrate] inhibits PFK-1, thus preventing formation of more pyruvate.
c. [Fru 2,6-bisphosphate] – A crucial regulatory step in the liver is played by fructose 2,6-bisphosphate (Fru 2,6-BP). It is a strong allosteric activator of PFK-1 and inhibitor of the gluconeogenic enzyme, FBPase-1 It prevents the two opposing pathways viz. glycolysis and gluconeogenesis, from occurring simultaneously.
2
O
CH2OH
OPC H2OP
H
OH
H OH
H
6
Fig 5.1.21. Structure of fructose2,6-bisphophate
The production of Fru 2,6-BP depends on [Fru 6-P] from which it is synthesized using a bifunctional polypeptide having two enzyme activities viz. phosphofructokinasase-2 (PFK-2) and fructose 2,6-bisphosphatatase (FBPase-2). These enzymatic functions are different from those of normal PFK-1 and FBPase-1.
22

Fig 5.1.22.Comparison of the action of enzymes PFK-1 / PFK-2 and FBPase-1 / FBPase-2 (PFK = phosphofructokinase; FBPase = fructose 1,6-bisphosphatase)
Catalytic activity of the bifunctional polypeptide depends on its own phosphorylated/dephosphorylated state. This in turn determines whether Fru 2,6-BP is produced by PFK-2, or converted back to Fru 6-P by FBPase-2. Thus, the levels of Fru 2,6-BP depend on the relative activity of PFK-2 and FBPase-2
.
Fig 5.1.23. Schematic representation of the bifunctional polypeptide which has phosphofructokinase -2 and fructose 1,6-bisphosphatase-2 activities (PFK-2 and FBPase respectively). The green and red asteriks indicate active and inactive states respectively.
When blood glucose falls, glucagon triggers a cAMP-dependent enzyme cascade mechanism (refer Section 5) to phosphorylate the bifunctional polypeptide. This enhances its FBPase-2 activity. The resultant decrease in [Fru 2,6-BP] inhibits PFK-1 and the rate of glycolysis goes down. Conversely, when blood glucose is high, insulin causes dephosphorylation of the
[Fructose 2,6-bisphosphate
]
Fructose 2,6-bisphosphate[ ]
phosphory-latedPFK-2 *
*FBPase
-2
PFK-2 *
FBPase
-2 *
dephospho-rylated
FB
P
*
*FK-2
Pase
-2
23
A D P
P FK- 2
A PT
Fructose 2,6-bisphosphate
1FBPase-
2H O Pi
A D P A PT
PF K-1
Fructose 6-phosphateFructose 1,6-bisphosphate
2H OPi
FBPase-2

bifunctional polypeptide, increasing its PFK-2 activity. The resulting increase in [Fru 2,6-BP] stimulates PFK-1 and the rate of glycolysis is enhanced.
d. [H+] – PFK-1 is inhibited by increase in H+ ions and hence a fall in pH (e.g when lactate accumulates), decreases the rate of glycolysis. This reduces lactate formation and controls metabolic acidosis.
24
STARVATION Blood Glucose[ ]
GLUCAGONsecretion enzyme cascade
-mediatedc A MP
[ Fructose 2,6-bisphosphate]phosphorylated
BIFUNCTIONALPOLYPEPTIDE
P FK-1inactive G LYCO LYSIS
A .

Blood Glucose[ ]WELL - FEDSTATE
secretionINSULIN
BIFUNCTIONALPOLYPEPTIDE
phosphorylatedde
[ ]Fructose 2,6-bisphosphate
activeP FK-1 G LYCO LYSIS
B.
Fig 5.1.24. Schematic diagram of the effect of the dietary state on the release of glucagon and insulin and the resultant effect on the rate of glycolysis.
3. Regulation of Pyruvate Kinase
Regulation of pyruvate kinase (PK) controls formation of pyruvate, a glycolytic product also linked to other metabolic pathways (refer below). Pyruvate kinase has several isozymes of which L type is present in the liver and M type is found in the muscle. Both are allosterically inhibited by high levels of ATP and acetyl-CoA (i.e. energy charge of cell is high) and stimulated by Fru 1,6-BP (i.e glucose breakdown is on). Pyruvate kinase is also inhibited by alanine, a precursor of gluconeogenesis.
25

phosphatasefructose 1,6-bis-
+
A TP
-
PYRUVAT E KINASE *dephosphorylated
-Aacetyl Co - long-chain
fatty acids, ,
alanine
-
+E PP
A PD A TP
pyruvate+
A.
B.
+
G LUCAG O N
c A PM - mediatedenzyme cascade
PYRUVAT E KINASE *dephosphorylated
+E PP
A PD A T P
pyruvate+
PYRUVAT E KINASEphosphorylated
*
proteinphosphatase
H O2
P iA T P
A PD
proteinkinase A
+
Fig 5.1.25. Regulation of pyruvate kinase: Fig A shows allosteric modulation of the enyme in all tissues. Fig B
shows covalent modification of the enzyme in the liver
The L form of PK is further subject to a covalent mode of regulation by reversible phosphorylation. When blood glucose is low, glucagon works via cAMP to activate a protein kinase (PKA), which phosphorylates and inactivates PK. Conversely, when blood glucose is high, glucagon is not secreted and a protein phosphatase dephosphorylates and activates PK. Additionally, insulin induces synthesis of active pyruvate kinase. The net result is that glycolysis is facilitated in all cells. On a longer time scale, the type of diet and diseases/metabolic disorders may lead to the hormonal induction or repression of the genes synthesizing the glycolytic enzymes. These adaptive changes are primarily enabled by insulin and glucagon. Tumors that cause hypoxia induce increased synthesis of glycolytic enzymes.
(To the young reader: The entire mechanism of regulation is confusing to everybody at this stage! It will become more comprehensible after you study glycogen metabolism and gluconeogenesis, and attempt to make your own flow diagrams).
26

FATES OF PYRUVATEThe pyruvate molecule is at the cross-roads of many metabolic pathways. Glycolysis degrades glucose to pyruvate in all tissues, while gluconeogenesis synthesizes glucose from pyruvate in the liver. Transamination interconverts pyruvate and alanine, linking carbohydrate metabolism with protein metabolism.
ACETYL-CoA
LACTATEALANINE PYRUVATE
GLUCOSE
glycolysis gluconeogenesis
tiontransamina reduction
OXALOACETATE
carboxylationoxidative
decarboxylation
Fig 5.1.26. Metabolic fates of pyruvate
Under anaerobic conditions, pyruvate undergoes fermentation into lactate or ethanol. In the aerobic state, pyruvate is oxidized to acetyl-CoA in the mitochondrion and enters the citric acid cycle with the ultimate purpose of producing ATP and biosynthetic intermediates. Pyruvate also connects with lipid metabolism via acetyl CoA and NADPH.H+, necessary precursors in the synthesis of fatty acids.
In the next section we will follow the aerobic metabolism of pyruvate, a pathway which has the potential to conserve energy as ATP.
SUMMARY 5.1: GLYCOLYSISCarbohydrate metabolism is constituted by anabolic, catabolic and amphibolic pathways, most of which deal with glucose or its metabolic products. Glycolysis is a major catabolic pathway of glucose which occurs in the cytosol. It is a well-regulated pathway that provides energy to cells under both anaerobic and aerobic conditions. A series of ten reactions degrade glucose to pyruvate, and also reduce the coenzyme, NAD. Under anaerobic conditions, a small net yield of ATP is obtained essentially by substrate level phophorylations. The reduction of pyruvate to lactate regenerates NAD from NADH to continue glycolysis. When pyruvate and NADH are processed aerobically in the mitochondrion, a much larger yield of ATP can be obtained. Shuttle systems enable transfer of reduced equivalents to the mitochondrion.
27

Chapter 5 Section 2OXIDATION OF PYRUVATE
The oxidative decarboxylation of pyruvate (C3) to acetyl-CoA (C2) is the link reaction between glycolysis and the citric acid cycle. Before we embark on the citric acid cycle in Section 3 of this chapter, let us first understand the way in which pyruvate provides the essential C-2 unit to the TCA cycle.
The conversion of pyruvate to acetyl-CoA occurs in the mitochondrion. Decarboxylation degrades the carbon skeleton of pyruvate from C3 to C2, and oxidation leads to formation of acetyl-CoA, a key metabolite in several metabolic pathways. The overall reaction is highly exergonic and irreversible.
complex
pyruvate dehydrogenase
+ +N A D_ C OO -C
O
3C H + CoA _ S H C
O
3C H ~ CoAS
+N + +
HH.A D H + 2CO
Acet yl CoA-Pyruvate
∆G’o = -33.4 k J/mol
Fig 5.2.1. Overall reaction of the conversion of pyruvate to acetyl-CoA by the pyruvate dehydrogenase complex
Oxidative decarboxylation is catalyzed by a remarkable multi-enzyme complex called pyruvate dehydrogenase complex (PDH complex), located in the inner mitochondrial membrane. It is essentially comprised by 3 enzymes and 5 cofactors:
• pyruvate dehydrogenase (E1), dihydrolipoyl transacetylase (E2),dihydrolipoyl dehdrogenase (E3)
• dissociable coenzymes : NAD+ and CoA
• enzyme-bound cofactors: thiamin diphosphate (TDP), lipoamide and FAD
Fig 5.2.2. Model of the three-dimensional structure of PDH complex: The core is constituted by 60 molecules of E2
(green) to which the peripheral E1 molecules (yellow) are connected by the lipoyllysyl arms (blue); E3
subunits are in red and are also bound to the core. (Source: Nelson and Cox, 2005, p 604 fig 16-5)
28

Multiple copies of the enzymes are clustered together to form a very large complex (diameter = 30-50 nm).The enzymes are spatially positioned in an organized manner, and their regulatory proteins are also associated with the complex. The movement of individual enzymes is restricted.
The multi-enzyme complex has a very high catalytic efficiency. The movement of individual enzymes is restricted. The reaction intermediates remain bound to the enzymes so that high local concentrations of substrates are maintained. Substrates are passed from one enzyme to the next in the sequence (substrate-channeling), thus preventing any of the substrates from going astray into other pathways. Consequently, enzyme-substrate interactions are quick and reaction rates are high. Regulation of the enzymes is also easily co-ordinated.
Fig 5.2.3a. Domain structure of dihydrolipoyl transacetylase (E2) (Source: Nelson and Cox, 2005, p 604 fig 16-5)
E1 binds TPP while E3 attaches FAD at their respective active sites. E2 presents an unusual and intriguing structure with three distinct domains. A long side-chain at the amino terminal end in E2
bears a lysyl residue which attaches lipoate. The lipoamide so formed, is now located at the end of a long, flexible arm, which can swing from the active site of E1 to the active sites of E2 and E3. Lipoate has two thiol (-SH) groups which can be reversibly oxidised to a disulphide (-S-S-). It functions as a carrier of both hydrogen and an acyl group. Coenzyme A can carry an “activated” acyl group, bonded covalently as a thioester.
Fig 5.2.3b. Lipoyllysyl arm of dihydrolipoyl transacetylase (E2) (Source: Nelson and Cox, 2005, p 603 fig 16-4)
29

The basic E1 -E2 -E3 structure is conserved in evolution and used in similar metabolic reactions like the oxidations of α-ketoglutarate and branched-chain amino acids. It is an amazing molecular system which has evolved to consolidate a specific reaction sequence in an environment (mitochondrial matrix) where so many other enzymes are always in action!
SEQUENCE OF REACTIONSPyruvate is produced in the cytosol. It is translocated to the mitochondrial matrix by an antiport mechanism whereby hydroxyl from the matrix is transferred to the cytosol.
Fig 5.2.4. Steps in the oxidative decarboxylation of pyruvate to acetyl-CoA by the pyruvate dehydrogenase complex. Note the movements of the lipoamide arm of E2. (E1 = pyruvate dehydrogenase; E2 = dihydrolipoyl transacetylase; E3 = dihydrolipoyl dehydrogenase; TPP = thiamin pyrophosphate) (Source: Boyer, R., 1999, fig. 16.3; p 484)
The oxidative decarboxylation of pyruvate is a sequence of five reactions:
Reaction 1 is catalyzed by pyruvate dehydrogenase (E1), an enzyme which also determines the substrate specificity of the multi-enzyme complex. Pyruvate is decarboxylated at C-1, releasing CO2. The remaining hydroxyethyl (C-2) unit is attached to TPP, to produce acetol-TPP.E1 .The reaction is slow and limits the overall rate of oxidative decarboxylation. Reaction 1 is irreversible and is the determinant for the reaction sequence to proceed from pyruvate towards acetyl-CoA.
Reaction 2 is catalyzed by dihydrolipoyl transacetylase (E2). The acetol unit is transferred from TPP to oxidized lipoamide on E2. As a result the disulphide of the lipoyl group is reduced to two thiol groups, one of which is then esterified and a high-energy thioester bond is created. The product is acetyl-lipoamide.E2.
30

Reaction 3 is also catalyzed by E2.The long lipoyllysyl arm of E2 transfers the acetyl group to the –SH of CoA, producing acetyl-CoA. The energy-rich thioester bond is preserved in acetyl-CoA. Reduced lipoamide (dihydrolipoamide.E2) remains attached to E2 while acetyl-CoA is released.
Reaction 4: The flavoprotein enzyme, dihydrolipoyl dehdrogenase (E3), containing FAD, re-oxidizes dihydrolipoamide and enzyme-bound FADH2 is obtained.
Reaction 5 is also catalyzed by E3. FADH2 is re-oxidized to FAD by NAD+. The NADH.H + formed is released and subsequently passed to the electron transport chain for generation of ATP.
After the 5th reaction the PDH complex is in a catalytically active form again, ready to receive another molecule of pyruvate for the next round of oxidative decarboxylation.
Energy yield Oxidative decarboxylation of a pyruvate molecule yields one molecule of NADH.H+. Since the reaction takes place in the mitochondrion, the reduced coenzyme is directly passed into the ETS and can generate 2.5 ATP per molecule of NADH.H+. The transfer of electrons from FADH2 to NAD+ is contrary to the usual direction of transfer in the ETS and is possible owing to the unusual electron transfer potential of FAD bound to E3.Hence:
ENERGY YIELD OF OXIDATIVE DECARBOXYLATION IS 2.5 ATP PER MOLECULE OF PYRUVATE.
REGULATION OF THE PDH COMPLEX
The PDH complex plays a key role in providing acetyl-CoA from carbohydrate sources to the citric acid cycle. It is a well-regulated system, primarily governed by the energy state of the cell. The rate of conversion of pyruvate to acetyl-CoA depends on the irreversible reaction catalyzed by pyruvate dehydrogenase i.e. E1, and hence this is the most appropriate site for regulation.
The mechanisms of regulation are:
1. End-product inhibition of PDH
_
+Acet yl CoA- N+
H+H.A D HPyruvate +N A D+complexDP H
CoA 2CO
_
Fig 5.2.5a. End-product inhibition of pyruvate dehydrogenase.
31

The end products of pyruvate oxidation viz. acetyl-CoA, and NADH.H+, inhibit PDH allosterically. The inhibition is enhanced if acetyl-CoA is concomittantly produced by β-oxidation of fatty acids. Conversely, when the availability of C-2 unit for the TCA cycle is insufficient, the low concentrations of acetyl-CoA and NADH.H+ are ineffective, and PDH actively oxidizes more pyruvate to acetyl-CoA.
2. Covalent modification of PDHPDH (E1) can be reversibly phosphorylated at serine residues by the converter enzymes PDH kinase and PDH phosphatase. E1 is active only in the dephosphorylated state. PDH kinase phosphorylates and inactivates E1 while PDH phosphatase promotes pyruvate oxidation by dephosphorylating and activating E1.
active inactive
+N A D/ [ ]][N A DH
Ca +2
Dichloroacetate
A T P A PD/ [ ]][+
_
Pyruvate / [ ]] CoA[Acet yl CoA-
+
+
_
_
DP H kinase
E 1_ O H
dephosphorylated
2-O P 3OE 1
_
phosphorylated
A T P
Mg +2
A PD
+INSULIN, C a +2Mg
+2
PiOH 2
phosphataseDP H+
Fig 5.2.5b. Covalent modification of pyruvate dehydrogenase (E1)
The kinase is stimulated allosterically by high ratios of [ATP]:[AMP], [NADH]:[NAD+] when the energy state of
cell is high, and by increased ratio of [acetyl-CoA]: [CoA] during starvation/intake of a high fat diet. Increased kinase activity inhibits E1 and pyruvate oxidation is suppressed.
In this way the cell conserves glucose when acetyl-CoA is either not required for the TCA cycle, or is provided by fatty acids. On the other hand, accumulation of pyruvate inhibits PDH kinase, so that E1 continues to be active and accelerates the conversion of pyruvate to acetyl-CoA.
32

Muscle contraction is associated with intracellular release of Ca2+, which also acts via covalent modification to activate E1 so that the availability of acetyl-CoA for the TCA cycle is increased and more ATP can be generated.
Insulin, secreted when blood levels of glucose are high, stimulates PDH phosphatase to dephosphorylate and activate E1 for increased oxidation of pyruvate.
SUMMARY 5.2: OXIDATION OF PYRUVATEWhen aerobic conditions prevail, the end-product of glycolysis i.e. pyruvate, is processed in the mitochondrion. A unique multi-enzyme system called the pyruvate dehydrogenase complex, oxidatively decarboxylates pyruvate to acetyl-CoA. NADH and carbon dioxide are also end-products. Oxidation of pyruvate makes acetyl-CoA available within the mitochondrion for use in the citric acid cycle as well as for fatty acid synthesis. NADH yields ATP when passed into the mitochondrial respiratory chain.
Chapter 5 Section 3CITRIC ACID CYCLE(Kreb’s cycle/TCA cycle)
The citric acid cycle is the final common pathway for oxidation of carbohydrates, lipids and many amino acids. It takes place in aerobic organisms within cells that have mitochondria. Its main purpose is to oxidize acetyl-CoA and concomitantly reduce NAD+ and FAD. Re-oxidation of the reduced co-enzymes in the mitochondrial respiratory chain uses molecular O2 and generates ATP. The cycle also provides biosynthetic intermediates for other metabolic pathways.
4
AT PGT P /
LIPIDCARBOHYDRATE
PROTEIN
Acetyl -CoAC2
2OC
NADH ETS
C4
2
C 6C4
C
C4
ETS NADH
FADH 2ETS
C4CYCLE
CITRIC ACID
C
C 5
O
NADH ETS
C6
Fig 5.3.1. Overview of the citric acid cycle (ETS = Electron Transport System)
33

REACTIONS OF THE TCA CYCLEEach turn of the TCA cycle is constituted by 8 reactions, catalyzed by the sequential action of 7 enzymes and one multi-enzyme complex. The enzymes are present in the mitochondrial matrix, in close proximity to the electron transport chain on the mitochondrial cristae. The essential precursors for the TCA cycle are acetyl-CoA and oxaloactetate (OAA). Two C atoms are received as an acetyl unit, and oxidation produces two molecules of CO2. There are four oxidation-reduction steps which yield H+ and electrons to reduce NAD+ and FAD to NADH.H+ and FADH2
respectively. There are 8 intermediates in the cycle and one 4-C unit i.e. OAA, is regenerated.
Fig 5.3.2.The reactions of the citric acid (TCA) cycle. Refer to the text for details. (Source: Nelson and Cox, 2005, p 607 fig 16-7)
34

Reaction 1: Conversion of acetyl-CoA to citrate (∆G’o = -31.5 kJ/mol)
Acetyl-CoA (2-C) and the keto-acid oxaloacetate (4-C), undergo condensation to form citrate (6-C) in a reaction catalyzed by citrate synthase. On binding OAA, the enzyme undergoes a remarkable conformational change which facilitates attachment of its 2nd substrate, acetyl-CoA. The reaction involves an aldol condensation followed by a hydrolysis in which H2O is used. The equilibrium for the hydrolysis lies far to the right so that the overall reaction moves towards the synthesis of citrate, driving the cycle forward. Reaction 1 is irreversible under cellular conditions.
Reaction 2: Isomerization of citrate to isocitrate (∆G’o = ~5 kJ/mol) Citrate is channeled directly to the active site of the next enzyme, aconitase, to undergo a two-step reaction that converts it to isocitrate (ICA). Aconitase carries 3 different Fe:S clusters which bind citrate and enable the reaction.
Fig 5.3.3. An Iron-sulfur center (pink) in aconitase which binds citrate (blue). ‘B’ is a basic residue in the enzyme which helps to position the substrate for binding and catalysis. (Source: Nelson and Cox, 2005, p 610 fig 16-10)
The symmetrical citrate molecule is acted on asymmetrically by aconitase so that an –OH is shifted from C-3 in citrate and attached to C-4, a carbon atom derived originally from OAA. The reaction involves a dehydration followed by a hydration, with cis-aconitate as intermediate.
Though the aconitase reaction is reversible, it is pulled to the right by the rapid utilization of its product, ICA, in the next step.
Reaction 3: Oxidative decarboxylation of isocitrate to α-ketoglutarate (∆G’o = -21 kJ/mol)
Isocitrate (6-C) is irreversibly oxidized and decarboxylated to α-ketoglutarate (5-C) in a two-step reaction catalyzed by isoctrate dehydrogenase (IDH). The enzyme uses NAD+ as a reductant and requires Mn2+. NADH.H + is produced in the the 1st step. Enzyme-bound intermediate, oxalosuccinate, is an unstable β-keto acid which loses CO2.
The rate of formation of α-ketoglutarate (α-KGA) is important in determining the overall rate of the TCA cycle.
35

Reaction 4: Oxidative decarboxylation of α-ketoglutarate to succinyl-CoA (∆G’o = -33 kJ/mol) This reaction is catalyzed by a multi-enzyme complex, α-ketoglutarate dehydrogenase complex (α-KGA-DH complex), which functions in a manner identical to the PDH complex for pyruvate. The α-KGA-DH complex and the PDH complex are homologous enzyme assemblies with the main function of transferring a keto group to CoA. The 1st and 3rd enzymes here, α-ketoglutarate dehydrogenase (α-KGA-DH) and trans-succinylase respectively, are functionally similar to E1 and E3 of the PDH complex. The 2nd enzyme, dihydrolipoyl dehydrogenase, is identical in both complexes. Oxidative decarboxylation of α-KGA yields succinyl-CoA (C-4), CO2 and NADH.H + .
The overall reaction is exergonic and irreversible. The energy released is conserved in the thioester bond of succinyl-CoA (∆G’o for hydrolysis of succinyl-CoA = -36 kJ/mol).
Reaction 5: Conversion of succinyl-CoA to succinate (∆G’o = -2.1 kJ/mol) Succinyl-CoA synthetase (= succinate thiokinase) converts succinyl-CoA to succinate, a 4-C compound. The reaction is a substrate-level phosphorylation in which the energy released on breaking the thioester bond of succinyl-CoA, is coupled to the phosphorylation of GDP/ADP to GTP/ATP respectively (∆G’o = -2.9 kJ/mol). Animal cells generally use GDP though some (e.g. liver) have isozymes for both GDP and ADP. (Plant cells and bacteria use only ADP). The terminal phosphate group of GTP is transferred to ADP by nucleoside diphosphate kinase.
kinase
nucleosidediphosphate
+GTP DPA + ATPG DP
(∆G’o = 0 kJ/mol)
Fig 5.3.4. Phosphorylation of ADP with GTP
Reaction 5 is reversible. The intermediates formed in subsequent reactions of the cycle, viz. fumarate, malate and OAA, are 4-C compounds.
Reaction 6: Conversion of succinate to fumarate (∆G’o = +6 kJ/mol) Succinate dehydrogenase (SDH) oxidizes succinate to fumarate, while its co-factor, FAD, is reduced to FADH2. SDH is embedded in the inner mitochondrial membrane (all other dehydrogenases are in the matrix) and transfers hydrogen and electrons directly from the substrate to FAD, without involving NAD+. The enzyme also has 3 different kinds of Fe:S clusters through which electrons flow from FADH2 to the ETS.
Reaction 7: Hydration of fumarate to malate (∆G’o = -3.4 kJ/mol) Fumarase adds –H and –OH in the trans position across the double bond of fumarate, converting it to L-malate.
36

Reaction 8: Regeneration of oxalacetate (∆G’o = +29.7 kJ/mol) Malate is oxidized to OAA by malate dehydrogenase (MDH). Its coenzyme NAD+ is reduced to generate the 3rd molecule of NADH.H + in the cycle. Regenerated OAA is now ready to accept another molecule of acetyl-CoA for the next round of the cycle.
The equilibrium favors malate formation over OAA, but is driven forward by the strongly exergonic condensation of OAA with acetyl-CoA in the next turn of the cycle, and the continuous re-oxidation of NADH.H+ in the ETS.
Overall reaction of one turn of the TCA cycle
Acetyl-CoA + NAD+ + FAD + GDP + Pi + H2O à 2 CO2 + 3 NADH + FADH2 +GTP + 2H+ + CoA
The citric acid cycle completely catabolizes acetyl-CoA. A tally of C, H and O atoms which enter the cycle with those that leave the cycle is as follows:
Carbon atoms:
Entry as 1 CH3.CO.SCoA = 2
Release as 2 CO2 = 2
Hence: Carbon atoms entering the cycle are fully oxidizedHydrogen atoms : Entry as 1 CH3.CO.SCoA = 3
Entry as 2 H2O = 4
Entry from 1 Pi (H3PO4) = 2
Total = 9 Hydrogen atoms enter the cycle Released as 3 NADH.H+ = 6
Released as 1 FADH2 = 2
Released as 1 CoASH = 1
Total = 9 Hydrogen atoms are released from the cycleOxygen atoms : Entry as 1 CH3.CO.SCoA = 1
Entry as 2 H2O = 2
Entry from 1 Pi (H3PO4) = 1
Total = 4 Oxygen atoms enter the cycle Release as 2 CO2 = 4
Total = 4 Oxygen atoms are released from the cycle
37

In each turn of the cycle the C atoms derived from acetyl-CoA have definite locations in the molecules from citrate to succinyl-CoA, but the positions are variable in the later intermediates of the cycle. During the conversion of succinyl-CoA to succinate, there is randomization in the order of carbon atoms. Consequently, the two atoms that leave as CO2 in a particular turn of the cycle, are not the same two carbon atoms that had entered as acetyl-CoA in that turn. Additional turns of the cycle are required to remove these carbon atoms as CO2.
Water is the ultimate source for the H atoms not derived from acetyl-CoA, and of the oxygen which is used to produce CO2, though its components, H and O, are utilized indirectly.
Since there is no net removal of OAA in the TCA cycle; hence one molecule of OAA can theoretically bring about the oxidation of an infinite number of acetyl groups. In practice, however, the supply of OAA needs to be replenished, since it is used by other metabolic pathways as well.
REVERSIBILITY OF THE CYCLEAll the reactions of the cycle are reversible except those catalyzed by citrate synthase, IDH and α-ketoglutarate dehydrogenase. These reactions have a sufficiently large ∆G value to be irreversible and account for an overall ∆Go’ of -40 kJ/mol. Hence the cycle operates unidirectionally.
ENERGY YIELD The step-wise degradation and oxidation of acetyl-CoA in the citric acid cycle is an efficient process for extraction of energy. The available energy is not released in one burst; it is transferred step-by-step to small packets of NADH and FADH2 to be carried to the electron transport system (ETS).
In every turn of the cycle involving one molecule of acetyl-CoA, 3 hydride ions (i.e. 6 electrons) are transferred to 3 NAD+ molecules while one pair of hydrogen atoms (i.e. 2 electrons) are transferred to an FAD molecule. Re-oxidation of 3 NADH and 1 FADH2 by oxidative phosphorylation in the ETS generates (7.5 +1.5) ATP i.e. 9 ATP (recall that ATP yield is 2.5/ NADH and 1.5/FADH2 if source is mitochondrial). In addition 1 GTP/ATP has also been obtained.
Hence, for every turn of the citric acid cycle:
TOTAL YIELD IS 10 ATP PER MOLECULE OF ACETYL COA
38

THE FINAL BALANCE SHEETFrom Sections 1, 2 and 3 of this chapter we can now summarise the energy yield in terms of ATP when one molecule of glucose undergoes complete oxidation to CO2 and water:
Gain of ATP by substrate-level phosphorylation:
• Glycolysis = 4 ATP
• Citric acid cycle = 2 ATP
Gain by oxidative phosphorylation:
• 2 NADH (cytosolic) in glycolysis = 3/5 ATP (depends on use of glycerophosphate/malate shuttle)
• 2 NADH (mitochondrial) by PDH complex = 5 ATP
• 6 NADH (mitochondrial) from TCA cycle = 15 ATP
• 2 FADH2 from TCA cycle = 3 ATP
Thus, total yield = 32/34 ATP per molecule of glucose oxidised
Loss by utilization in glycolysis = 2 ATP
Hence:
NET ENERGY YIELD IN AEROBIC OXIDATION = 30/32 ATP PER MOLECULE OF GLUCOSE
Compare this to the net energy yield of a mere 2 ATP per molecule of glucose oxidized anaerobically.
It is estimated that by synthesizing ATP, the efficiency of trapping the energy released in glucose oxidation is 65%, This is calculated on the basis of actual free energy changes that occur in cellular conditions of pH, and low, unequal concentrations of ATP, ADP and Pi.
PROVISION OF SUBSTRATES FOR THE TCA CYCLEEssential substrates for the cycle are acetyl-CoA (2-C) and oxaloacetate (4-C).
Acetyl-CoA is required in stoichometric amounts for each turn of the cycle and is obtained from:
• Glucose – as explained in sections 1 and 2
• Fatty acids – by β-oxidation (refer Ch 6)
Normally, OAA is present in the cell in very low concentrations. Since it is regenerated in every round of the cycle, OAA is required only in catalytic amounts. However, the TCA cycle may become deficient in its OAA supply if this keto-acid is pilfered by other metabolic pathways like gluconeogenesis and transamination. In order to keep the cycle operating at a steady rate, the system takes the help of anaplerotic reactions which replenish OAA, or other cycle intermediates.
39

pyruvate carboxylase+Pyruvate H CO3
_
ATP+ DPAOA A ++ P i liver( )
OA A GTP+ muscle( )+ +2CO G DPPEP
PEPcarboxy kinase
carboxylasePEP
yeast,bacteria,higher plants( )+OA A PiPEP + H CO3_
malic enzymeN A D
+H( )P .H++Pyruvate H CO3
_ + N A D( )P +Malat e
+ N A D( )P++Glutamic
acidH O2 HN 3++ +
HN A D( )P .Ha KGA-dehydrogenase
glutamate
Fig 5.3.5. Anaplerotic reactions that replenish intermediates of the TCA cycle. ( PEP = Phosphoenolpyruvate; OAA = Oxaloacetate; a-KGA = α-Ketoglutarate)
The pyruvate carboxylase reaction is one of the most important anaplerotic reactions. Pyruvate carboxylase is allosterically stimulated by acetyl-CoA and concomitantly increases production of OAA from pyruvate when [acetyl-CoA] becomes high. Succinyl-CoA is produced by oxidation of odd-chain fatty acids (see Chapter VI), and the catabolism of amino acids like Ileu, Met and Val. Transamination and deamination reactions of amino acids are reversible and depending on metabolic demand, they also replenish cycle intermediates (see Chapter VII).
The Glyoxylate cycle is an alternative pathway, which processes isocitrate without decarboxylations, and can provide succinate, OAA and other intermediates of the TCA cycle. It occurs in germinating seeds and some microbes. Unlike the TCA cycle, the glyoxylate cycle enables net conversion of acetyl-CoA into 4-C intermediates. Four C atoms enter the cycle as two molecules of acetyl-CoA and four C atoms leave as succinate. Only one molecule of NADH.H+ is produced per turn of the cycle.
40

H2 O
e
citrateIso
Succinate
lyaseisocitrat
_
C OO -
CH O
GLYOXYLATE
Malat e
NA D+
H. +HNA D
Acetyl -CoACoA
OAA Citrate
malatesynthas e
Acetyl -CoA
CoAH 2 O
Fig 5.3.6. The glyoxylate cycle in plant glyoxysomes.
ROLE OF VITAMINSFour vitamins of the B-complex group are essential constituents of co-factors used in the TCA cycle:
• Riboflavin – for FAD, used by α-KGA-DH, SDH and also PDH
• Niacin – for NAD, used by IDH, α-KGA-DH, MDH and also PDH
• Thiamin (TDP) – used by α-KGA-DH and also PDH
• Pantothenic acid – is a part of Coenzyme A which carries the acetyl and succinyl groups
ACTION OF INHIBITORSMalonate competes with succinate and inhibits SDH. Accumulation of succinate in a malonic-inhibited system stops the TCA cycle. Tissue preparations inhibited by malonate, continue with the cycle if stoichometric amounts of fumarate/malate or OAA are added but not if the tricarboxylic acids or α-KGA are provided.
Fluoroacetate combines with OAA to form fluorocitrtate, which inhibits aconitase. Citrate accumulates in such a system and the TCA cycle is suspended.
Arsenite complexes with –SH group of lipoamide to inhibit α-KGA-DH complex so that α-KGA accumulates and the cycle is stopped.
METABOLIC ROLE OF THE TCA CYCLEThe TCA cycle has a pivotal role in metabolism. It is essentially amphibolic and is connected to several catabolic as well as anabolic pathways. The 8 intermediates in the cycle are links to metabolites in other metabolic pathways.
Catabolic role:
The citric acid cycle oxidizes carbohydrates, lipids and amino acids. The 2-C, 4-C and 5-C end-products of other catabolic processes undergo degradation when fed into the cycle as acetyl-CoA,
41

succinyl-CoA or any of the other intermediates. The C-skeleton is oxidized to CO2 while the hydrogen is finally passed on to molecular oxygen to form water. We take below an example of the amino acid Isoleucine:
CoA-Propionyl + + 2COAcet yl CoA-Isoleucine )( 6 - C
2 2CO
TCA cycl e
Pyruvate
CoA-Succinyl
2CO
TCA cycl e
OA A
PEP 2CO+
PEPcarboxy kinase
pyruvate kinase
2 2CO
TCA cycl e
PDH compl xe
Acet yl CoA- + 2CO
Fig 5.3.7. Catabolic role of the TCA cycle as shown in the metabolism of the carbon skeleton of Isoleucine. The C skeleton is traced in red (OAA = oxaloacetate; PDH complex = pyruvate dehydrogenase complex; PEP = phosphoenol pyruvate)
42

Anabolic role
Purines
, ArgGln Pro ,
Glu
Fatty acids sterols,
TyrPheCys , ,
Ser Gly Try, ,
Glucose
PEP
PorphyrinsHeme
Acetyl - CoA
CYCLE
CITRIC ACID
SUCCINYL-CoA
CITRATEOA A
a - KGA
Pyrimidines
Asp , Arg
Fig 5.3.8. Schematic diagram of the anabolic role of the TCA cycle. Abbreviated names of the amino acids have
been used: PEP = Phosphoenolpyruvate; OAA = Oxaloacetate; a-KGA = α-Ketoglutarate. (Adapted from Nelson and Cox, 2005, p 617 fig 16-15)
The cycle is a major source of precursors for many biosynthetic pathways:
• Gluconeogenesis – all major acids from citrate to OAA can undergo gluconeogenesis to form glucose. The key enzyme required is PEP-carboxykinase. The acids enter the TCA cycle from various sources, the chief one being OAA from pyruvate (using pyruvate carboxylase). The products leave the mitochondrion via malate for gluconeogenesis in the cytosol. (refer Section 6)
• Synthesis of amino acids – the C-skeleton of cycle intermediates are a source for synthesis of non-essential amino acids. Transamination and deamination reactions are reversible and ideal for this purpose.
43

Reversal of the glutamate dehydrogenase reaction:
+ N A D( )P++Glutamic
acidH O2HN 3++ +
HN A D( )P .Ha KGA-dehydrogenase
glutamate
Transaminations:
glutamateamino transferase
Alanine+a KGA- Glutamat e + Pyruvate
OA + PyruvateAspartat eamino transferase
alanine
Alanine+A
Fig 5.3.9. Synthesis of amino acids from intermediates of the TCA cycle.
Fatty acid and cholesterol synthesis – is linked to citrate of the TCA cycle. The enzymes for fatty acid synthesis are located in the cytosol. A citrate transporter conveys mitochondrial citrate to the cytosol where the enzyme ATP-citrate lyase cleaves it to provide acetyl-CoA for fatty acid synthesis
Fig 5.3.10. TCA cycle and fatty acid synthesis. (Source: Murray et al, 2003, p 135 fig 16-5)
• Purine and pyrimidine nucleotides – are synthesized from α-KGA and OAA
• Porphyrin ring of heme groups – are synthesized from succinyl-CoA and used in synthesis of hemoglobin, myoglobin and cytochromes
44

REGULATION OF TCA CYCLE The TCA cycle is at the junction of many major metabolic pathways and regulation of its activity is crucial to the well-being of an aerobic organism. The rate of the TCA cycle is primarily geared to the energy needs of the cell at any particular point in time. The regulation of the PDH complex, as also that of the –oxidation of fatty acids, are major determinants of the rate of provision of acetyl-CoA to the cycle. The factors that regulate the TCA cycle and the PDH complex are similar in many respects so that the two processes are co-ordinated.
a- Hcomplex
-KGA D
N HA DCoA-succinyl
_
+ Ca +2
IDH
CoA-succinylN HA DA T P,
_
, Ca +2A PD
+
CITRATE
FUMARATE
MALATE ISOCITRATE
a - KGA
SUCCINATE
SUCCINYL-CoA
A AO
fatty acidsN A DH,A T P, ,acet yl CoA-
_
Ca +2,CoA ,+N A D,A M P
+
Pyruvate Acet yl CoA-complexDP H
citrate esyn thas
PA D
+
N HA D , CoA-succinyl,citrate A T P
_
DHSOA A_
Fig 5.3.11. Regulators of the citric acid cycle: green signs indicate stimulation and red signs indicate inhibition. (PDH = pyruvate dehydrogenase; IDH = isocitrate dehydrogenase ; α-KGA-DH = α-ketoglutarate dehydrogenase; SDH = succinate dehydrogenase)
The rate-determining steps are the 3 exergonic reactions catalyzed by citrate synthase (CS), IDH and α-KGA-DH. The mechanism of regulation depends on local molecules in the cell, many of which are part of the cycle itself. Regulation is therefore quick, effective and in tune with the existing needs of the cell. Surprisingly, covalent modification of the regulatory enzymes by the phosphorylation-dephosphorylation cycle, does not take place. In addition, hormones have no direct role in regulating the cycle.
There are three fairly simple means by which the TCA cycle is regulated:
o Substrate availabilityo End-product inhibitiono Competitive feedback inhibition
45

Substrate availability is a key factor in determining whether the cycle can fulfill its purpose. The supply of acetyl-CoA, OAA and NAD+, is particularly important. The supply of acetyl-CoA is determined by the activity of the PDH complex and β-oxidation of fatty acids, while the continued availability of OAA is ensured, if necessary, through anaplerotic reactions. Thus, if [acetyl-CoA] is high but availability of OAA is limited (by diversion into other metabolic pathways), then high [acetyl-CoA] stimulates pyruvate carboxylase allosterically to increase OAA production from pyruvate. When the rate of glycolysis is greater than the rate of the TCA cycle, accumulating citrate inhibits PFK-1. In this way, the production and utilization of acetyl-CoA is balanced so that the TCA cycle can proceed at the required rate. If TCA is inhibited at some other step (e.g. by NADH), increased OAA does not accelerate the cycle; instead OAA equilibrates with malate and is transported out of the mitochondrion.
End-product inhibition is a direct inhibition of an enzyme by accumulation of the products of the reaction catalyzed by it. All three regulatory enzymes of the TCA cycle are inhibited in this way by mass action. Thus:
• CS is inhibited by high [citrate]
• IDH is severely inhibited by increased [NADH]
• α-KGA-DH is severely inhibited by high [NADH] and by [succinyl-CoA]
The concentrations of the end-products not only affect their own specific enzymes but also result in a “domino” effect on other enzymes.
Feedback inhibitions are caused by intermediates which are products of later reactions. Thus, CS and IDH are inhibited by succinyl-CoA, which is a product of a subsequent step of the cycle. Succinyl-CoA competes with OAA for citrate synthase. Inhibition of CS by NADH, and of IDH by ATP are also examples of feedback inhibition.
Some of the molecules regulating the enzymes are allosteric modulators:
• high [ADP] – activates CS and IDH
• high [ATP] – inhibits CS and IDH
• Ca2+ release – which signals muscle contraction, stimulates PDH, IDH and α-KGA-DH so that increase in rate of TCA cycle makes more ATP available for muscle contraction
• Long-chain acyl CoA – inhibit CS
The rates of all the reactions producing NADH are dependent on the availability of NAD+, which in turn depends on re-oxidation of NADH in the respiratory chain. High ratio of [NADH]/[NAD+] inhibits all three regulatory enzymes of the cycle as well as the PDH complex.
The rate of the TCA cycle is closely linked to glycolysis and the electron transport chain. Glycolysis also responds to the cellular levels of ATP, NADH and citrate, so that the provision of pyruvate matches the rate of its utilization in the TCA cycle. When the energy state of the cell is high, the [ADP] available is low. This reduces the rate of oxidative phosphorylation and hence, the rate of re-oxidation of NADH. The consequent reduction in the supply of NAD+ decreases the rate of the TCA cycle. Thus, the TCA cycle is under “respiratory control”.
Evidence now shows that some enzymes of the citric acid cycle may be associated as supramolecular complexes (metabolons) which enable more efficient substrate channeling during reaction sequences. Obviously mechanisms regulating the citric acid cycle need further elucidation.
46

SUMMARY 5.3: CITRIC ACID CYCLEThe citric acid cycle is a major amphibolic pathway which occurs in the mitochondrion. It is a crucial metabolic pathway which accounts for the final oxidation of carbohydrate, lipid and protein in aerobic organisms. Acetyl-CoA, a common end-product in intermediary metabolism, condenses with oxaloacetate and enters the cycle as citrate. In every turn of the cycle, a series of dehydrogenases degrade a citrate molecule, oxidizing two carbon atoms to carbon dioxide and reducing the co-enzymes NAD and FAD. OAA is regenerated to continue the cycle.
The location of the citric acid cycle is in close proximity to the mitochondrial electron transport system. The reduced co-enzymes produced in the cycle, yield ATP when passed through this respiratory chain.
Several catabolic and anabolic pathways are linked to intermediates of the citric acid cycle. Anaplerotic reactions replenish cycle intermediates which are diverted to other pathways.
The availability of substrates and the concentrations of end-products regulate enzymes of the citric acid cycle.
Chapter 5 Section 4
HEXOSE MONOPHOSPHATE PATHWAY (HMP)(Pentose phosphate pathway/Hexose monophosphate shunt)
The hexose monophosphate pathway is an alternate route for glucose oxidation. Its main purpose is to generate reducing power as NADPH.H+ and not energy. It occurs in those tissues/cells which require:
• NADPH for
o (a) synthesis of fatty acid/cholesterol (e.g. liver, adipose tissue, adrenal, gonads)
o (b) detoxification (e.g.erythrocytes)
• Ribose 5-phosphate for nucleic acid synthesis when mitotic activity is high (e.g. skin)
A single run through the hexose monophosphate pathway achieves a partial oxidation of glucose without any production of ATP. Complete oxidation of glucose is possible only by a multicyclic process in which repetitions of the pathway and links with glycolysis are necessary.
47

Fig 5.4.1 Overview of the hexose monophosphate pathway (Source: Nelson and Cox, 2005, p 550 fig 14-20)
SEQUENCE OF REACTIONSThe HMP takes place entirely in the cytosol. The reactions can be grouped into two major phases:
• Oxidative – in which glucose (6-C) is oxidized to pentose (5-C) and CO2, while NADP+ is simultaneously reduced to NADPH. The process is irreversible.
• Non-oxidative – involves a series of recombinations of 7-C, 5-C, 4-C and 3-C sugar isomers, without use of NADP+. The process is reversible.
1. Reactions of the Oxidative phaseGlucose enters HMP pathway as glucose 6-phosphate (Glc 6-P) and its oxidative decarboxylation is carried out by a sequence of four reactions. The overall equilibrium for this phase lies far to the right.
48

Fig. 5.4.2. Reactions of the oxidative phase of the HMP pathway. The four reactions of this phase are explained in the text. Three of the reactions are shown here. The fourth reaction, in which ribulose 5-phosphate is isomerised to ribose 5-phosphate, is shown in Fig 5.4.4. (Adapted from Murray et al, 2003, p165 fig 20-2)
Reaction 1 (oxidation): is catalyzed by glucose 6-phosphate dehydrogenase (Glc 6-P-DH), which carries NADP as coenzyme. Glucose 6-P is oxidized at C-1 to an intramolecular ester, 6-phosphoglucono-δ-lactone, while NADP is reduced to NADPH. The reaction is irreversible under physiological conditions.
Reaction 2 (hydration): The enzyme, lactonase, uses water to convert the 6-phosphogluconolactone to an acid, 6-phosphogluconate.
Reaction 3 (oxidation): is catalyzed by 6-phosphogluconate dehydrogenase, which also has NADP as its coenzyme. Removal of hydrogen from C-3 of 6-phosphogluconate produces 3-keto, 6-phosphogluconate and NADPH. The keto acid is unstable and undergoes spontaneous decarboxylation to form ribulose 5-phosphate.
Reaction 4 (isomerization): Ribulose 5-phosphate (a ketose) is isomerized to ribose 5-phosphate (an aldose) by ribulose 5-phosphate isomerase.
At this stage the HMP pathway is terminated in those tissues which require both NADPH and ribose 5-P in balanced amounts.
NET YIELD:
2 NADPH AND 1 PENTOSE 5-PHOSPHATE PER MOLECULE OF GLUCOSE
49

2. Reactions of the non-oxidative phaseThe reactions of the non-oxidative phase follow the oxidative phase in non-dividing tissues which require more
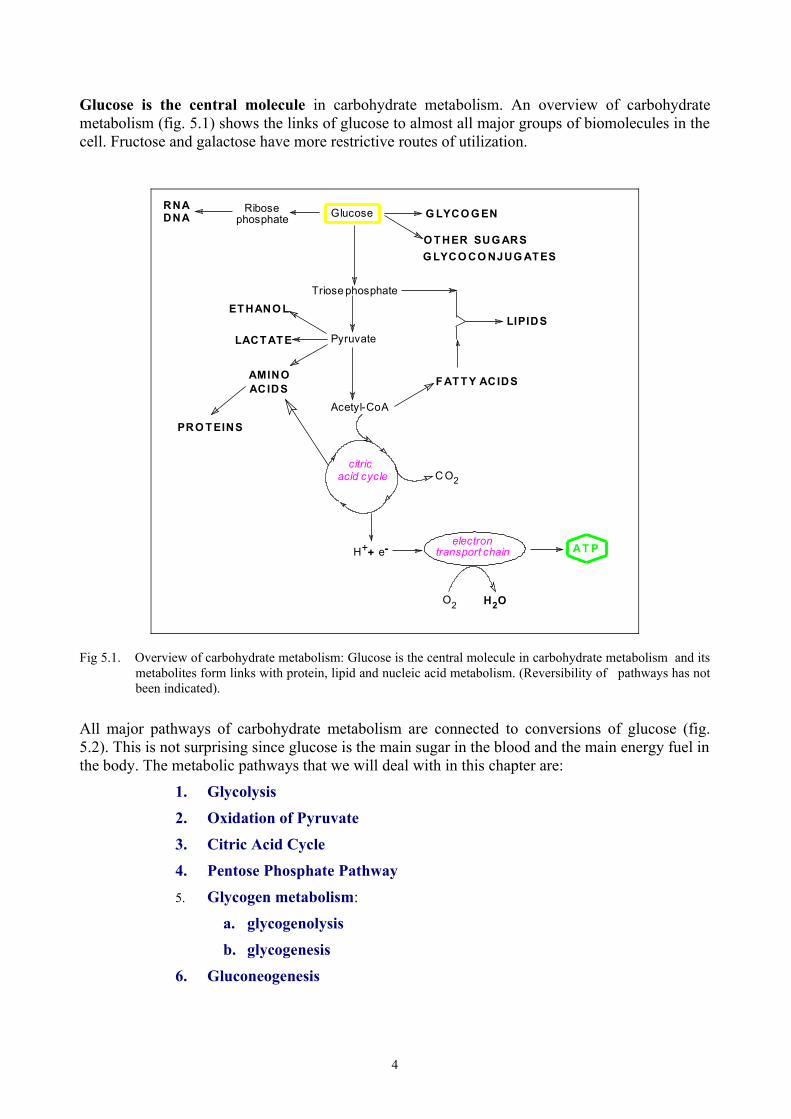
NADPH than ribose 5-P. A series of reversible reactions constitute this phase with the final goal of producing glucose 6-P or glycolytic intermediates from pentose phosphates. The main enzymes here are transketolase and transaldolase, which transfer C-2 and C-3 moieties respectively from a ketose donor to an aldose acceptor.
GLYCERALDEHYDE
AnotherXYLULOSE - 5P
-4PERYTHROSE
-7P FRUCTOSE- 6P
RIBULOSE - 5 P
SEDOHEPTULOSERIBOSE-5 P
GLYCERALDEHYDE-3 PXYLULOSE - 5P
FRUCTOSE- 6P
-3 P
Fig 5.4.3. Summary of the non-oxidative phase of the HMP pathway. Fructose 6-phosphate and glyceraldehyde 3- phosphate can enter the pathways of glycolysis or gluconeogenesis.
We break up the non-oxidative sequence into 4 parts to enable a clear understanding of the reactions. All through these molecular interchanges it would help to remember that only C-1 to C-3 of the molecules are involved.
A. Interconversion: (C5 ↔ C5 ↔ C5)
Ribose 5-P Ribulose 5-P Xylulose 5-P
Fig 5.4.4. Interconversion of pentose phosphates. Compare the enclosed functional groups in ribose 5-P and xylulose 5-P with equivalent positions in ribulose 5-phosphate.
50

Interconversion of ribose 5-P, ribulose 5-phosphate, and xylulose 5-P is readily catalyzed by the enzymes isomerase and epimerase. This is necessary since both transketolase and transaldolase use ketose sugars as group donors.
B. Recombination 1: (C5 + C5 ↔ C3 + C7)
Xylulose 5-P Ribose 5-P Glyceraldehyde 3-P Sedoheptulose 7-P
Fig 5.4.5. Action of transketolase, showing the transfer of a 2-C unit (enclosed in green) transferred by the enzyme from a 5-C ketose to a 5-C aldose.
This is the 1st reaction catalyzed by transketolase. The enzyme transfers a 2-C unit (activated glycolaldehyde moiety) from a ketose donor (xylulose 5-P) and attaches it to the C-1 of an aldose acceptor (ribose 5-phosphate). The 5-C sugar is thereby upgraded to a 7-C sugar, sedoheptulose 7-P. The second product, glyceraldehyde 3-P, is an important intermediate shared by glycolysis, HMP, gluconeogenesis and photosynthesis. Transketolase requires TPP and Mg2+ for its activity.
The two molecules of pentose phosphate used in this reaction, are obtained from the processing of two molecules of glucose 6-P in the oxidative phase.
C. Recombination 2: (C7 + C3 ↔ C4 + C6)
Sedoheptulose 7-P Glyceraldehyde 3-P Erythrose 4-P Fructose 6-P
Fig 5.4.6. Action of transaldolase, showing the 3-C unit (enclosed in green) transferred by the enzyme from a 7-C ketose to a 3-C aldose.
51
A transaldolase transfers a 3-C unit, dihydroxyacetone moiety, from sedoheptulose 7-P (ketose) to glyceraldehyde 3-P (aldose), producing erythrose 4-P and fructose 6-P. While continues into the final step of HMP, fructose 6-P can enter glycolysis or the gluconeogenic pathway.
D. Recombination 3: (C5 +C4 ↔ C3 + C6)
Xylulose 5-P Erythrose 4-P Glyceraldehyde 3-P Fructose 6-P
Fig 5.4.7. Another reaction catalyzed by transketolase to transfer a 2-C unit from a ketose to an aldose.
Transketolase catalyzes a 2nd transfer of a 2-C unit from xylulose 5-P to erythrose 4-P, yielding the final products fructose 6-P and glyceraldehyde 3-P. It is to be remembered that the availability of a 2nd molecule of xylulose 5-P for this reaction indicates that a third molecule of glucose 6-P was utilized as its source.
OVERALL REACTION
3 GLUCOSE 6-P + 6 NADP+ + 3 H2Oà
3 CO2+2 FRUCTOSE 6-P+ GLYCERALDEHYDE 3-P + 6 NADPH.H+
The 2 molecules of fructose 6-P can be isomerized to glucose 6-P to re-enter the HMP shunt, or can be diverted to glycolysis. Glyceraldehyde 3-P can enter either glycolysis or gluconeogenesis. In this way the HMP pathway becomes a link to glycolysis and gluconeogenesis for dietary pentoses and other sugars.
The HMP pathway is never a route for the complete oxidation of glucose in metabolism. However since the final products fructose 6-P and glyceraldehyde 3-P, can be reconverted to glucose 6-P, it is possible for a 6-C unit (equivalent to glucose 6-P) to be repeated re-cycled, with release of 6 CO2.
REGULATION OF HMPGlucose 6-P is processed by HMP or glycolysis as per the current need of the cell. The reactions of the HMP, glycolysis and gluconeogenesis occur in the cytosol and share common intermediates like glyceraldehyde 3-P. The fate of the triose phosphates is determined by the cell’s need for pentose phosphates, NADPH and ATP.
52

The 1st reaction of the oxidative phase, catalyzed by glucose 6-P dehydrogenase, is irreversible and rate-limiting for the whole pathway. Control is mainly by the availability of NADP+: high levels of NADP+ stimulate glucose 6-P dehydrogenase allosterically. When the cell uses NADPH (e.g. in lipid synthesis), the high [NADP+] stimulates the dehydrogenase and increases the rate of HMP. The rate of the non-oxidative branch of the pathway depends on the availability of substrates.
Fig 5.4.8. Role of NADPH in regulation of HMP pathway (Source: Nelson and Cox 2005, p 554 fig 14-27)
The relative requirements of NADPH and ribose 5-P within the cell determines the actual sequence of the reactions:
1. Need for NADPH more than for ribose 5-P (e.g. adipose tissue)
Fig 5.4.10a. Mode of HMP pathway when requirement for NADPH is more than for ribose 5-phophate(Source: Berg et al, 2002, fig 20.24)
A 6-C unit (equivalent of glucose 6-P) is completely oxidised to CO2 by repeated passages through the HMP. Both oxidative and non-oxidative branches of HMP take place, followed by
53

channeling of fructose 6-P and glyceraldehyde 3-P into gluconeogenesis to give more glucose 6-P for continuing HMP. The overall stoichometry of the sequence is:
6 Glucose 6-P + 12 NADP+ + 7 H2O à 5 Glucose 6-P + 6 CO2 + 12 NADPH + 12 H+ + Pi
2. Need for ribose 5-P more than for NADPH (e.g. skin)
Fig 5.4.10b Mode of HMP pathway when requirement of ribose 5-phophate is more than for NADPH(Source: Berg et al, 2002, fig 20.24)
Most of the glucose 6-P is processed by glycolysis to give fructose 6-P and glyceraldehyde 3-P, following which the reverse reactions of transaldolase and transketolase convert these intermediates to ribose 5-P. The oxidative part of the pathway is not involved. This occurs in rapidly dividing tissue.
5 Glucose 6-P + ATP à 6 Ribose 5-P + ADP + H+
3. Requirement for NADPH and ribose 5-P is balanced
Fig 5.4.10c Mode of HMP pathway when requirement of ribose 5-phophate balances that for NADPH(Source:Berg et al, 2002, fig 20.24)
The oxidative part of HMP is predominant over the non- oxidative part and generates NADPH and ribose 5-P.
Glucose 6-P + 2 NADP+ + H2O à Ribose 5-P + 2 NADPH + 2 H+ + CO2
54

4. NADPH required but ribose 5-P is not needed
Fig 5.4.10d. Mode of HMP pathway when only NADPH is required (Source: Berg et al, 2002, fig 20.24)
Glyceraldehyde 3-P and fructose 6-P, produced by transaldolase and transketolase reactions, enter glycolysis and undergo complete oxidation; ATP is generated.
3 Glucose 6-P + 6 NADP+ + 5 NAD+ + 5 Pi + 8 ADP à
5 Pyruvate + 3 CO2 + 6 NADPH + 5 NADH + + H+ + 8ATP + H2O
SIGNIFICANCE OF HMP
• Provides NADPH for syntheses of fatty acids, steroids, amino acids, nucleotides and neurotransmitters
• NADPH protects RBC from oxidative damage and hemolysis caused by H2O2. The peroxide is eliminated by a tripeptide, reduced glutathione, which gets oxidized in the process. NADPH enables regeneration of reduced glutathione. A hereditary lack of glucose 6-phosphate dehydrogenase causes hemolytic anemia, particularly if anti-malarial drugs are administered.
Fig 5.4.11a. Reduction of glutathione (Source: Murray et al, 2003, p 167 fig 20-3)
55

Fig. 5.4.11b. RBC showing Heinz Bodies (dark particles) which are clumps of denatured protein formed due todeficiency of glucose 6-phosphate dehydrogenase (Source: Berg et al, 2002, fig 20.25)
• NADPH is required for detoxication of cytochrome P450 monooxygenases
• NADPH is required for bactericidal activity of polymorphonuclear leucocytes
• Ribose 5-P is used in nucleotide synthesis (for RNA, DNA, ATP, NAD+, FAD and CoA)
• Excess pentose sugars in the diet can enter mainstream glucose metabolism
• Fructose 6-P and glyceraldehyde 3-P can enter glycolysis or gluconeogenesis
SUMMARY 5.4: HEXOSE MONOPHOSPHATE PATHWAYThe hexose monophosphate pathway partially oxidizes glucose in the cytosol. Its main purpose is to reduce NADP to NADPH. for fatty acid synthesis in tissues. It also provides ribose for nucleic acid synthesis but does not generate ATP.
The pathway involves irreversible oxidative and reversible non-oxidative phases. The oxidative phase decarboxylates glucose to ribulose and reduces NADPH. The non-oxidative phase carries out a series of recombinations finally yielding fructose 6-phosphate and glyceraldehyde 3-phosphate that can enter glycolysis, undergo reversal of reaction sequences to produce ribose or glucose.
Chapter 5 Section 5GLYCOGEN METABOLISM
The large reservoir of glycogen in the liver and muscle is a readily moblizable source of glucose for the body in the periods between meals and at times of increased muscular activity. This form of storage energy scores over fat stores on two major counts viz. speed of mobilization, and both aerobic and anaerobic utilization. In addition, glycogen is a source of essential glucose to those organs that cannot use lipids as energy fuel e.g. RBC and nerve cells. On the other hand, when blood glucose levels go up after a carbohydrate meal, the excess glucose is trapped by glycogen synthesis to be used later when required.
56

Fig 5.5.1. Glycogen granules in the cytoplasm of a hepatic cell (Source: Berg et al, 2002, fig 21.2)
The synthesis and degradation of glycogen is well co-ordinated so that blood glucose is maintained at the steady levels vital for all organs. Both processes occur in the liver and muscle, but there is a fundamental difference between them: the liver responds to the levels of glucose in systemic circulation, while the muscle responds to its own need of glucose.
We pursue our study of glycogen metabolism under three sub-sections:
• Glycogenolysis – the catabolic process of breakdown of glycogen to glucose
• Glycogenesis – the anabolic process of synthesis of glycogen from glucose
• Reciprocal regulation of glycogenolysis and glycogenesis – which enables control of blood glucose levels
For the first time in your perusal of regulatory mechanisms, you will encounter in this section details of the influence of hormones on metabolism. Remember that hormones are secreted by endocrine glands on stimulation by external /internal factors. They trigger cellular signals to integrate metabolism with the needs of the body. Epinephrine, glucagon and insulin play a major role in glycogen metabolism, sensitizing it to the internal and external environment.
In this section you will also learn about enzyme cascade systems. The binding of specific hormones to membrane receptors on target cells can initiate a sequence of enzyme-catalyzed reactions, in which catalysts (i.e. enzymes) successively activate other catalysts (also enzymes). The purpose is to ensure a large amplification of the initial signal. The binding of a few molecules of hormone (e.g epinephrine) is the primary signal and it precipitates a massive chemical response (e.g. glycogenolysis) by acting through enzymes that amplify the response at each intermediate step. The process generally involves second messengers in hormone action like cyclic 3’,5’-AMP (cAMP) or inositol 1,4,5-triphosphate (IP3).
57

Fig 5.5.2. Enzyme cascade systems (on left) amplify signals that stimulate glycogenolysis and provide largequantities of glucose for energy (Source: Berg et al, 2002, p 866)
Section 5.5.AGLYCOGENOLYSIS
Glycogen is stored as cytosolic granules in association with the enzymes and regulatory proteins that catalyze both its degradation and synthesis. Recall that the glycogen molecule is a highly branched homoglycan in which glucose molecules are linked by α-glycosidic bonds to form linear (1:4) and branched (1:6) chains. Glycogenolysis is initiated at the non-reducing ends of linear chains that are exposed to the exterior. The structure of the molecule ensures that glycogenolysis can start simultaneously at many such ends.
Fig 5.5.3. Schematic diagram of a glycogen molecule, showing non-reducing terminal glucosyl residues that aretargeted by glycogen phosphorylase (Source: Berg et al, 2002, fig 21.1)
Steps of glycogenolysisGlycogenolysis occurs in the cytosol and glucose is liberated by the sequential action of 3-4 enzymes:
• Phosphorylase – cleaves 1:4 α-glycosidic bonds
• “Debranching” enzyme – with two enzymatic functions in the same molecule viz.:
58

* oligo (α-1:4à α-1:4) glucan transferase – transfers a trisaccharide moiety from one glycosidic chain to an adjacent chain
* α -1:6 glucosidase – cleaves 1:6 α-glycosidic bonds
• Phosphoglucomutase – transforms Glucose 1-P to Glucose 6-P
• Glucose 6-phosphatase – removes phosphate group from Glucose 6-P
The first three enzymes are functional in both muscle and liver, but the last enzyme is found only in the liver.
Step 1: The breakdown of glycogen is initiated by phosphorylase. The enzyme cleaves 1:4 α-glycosidic bonds, starting from the non-reducing ends of the molecule. Recall from Chapter 2 Section 1 that each glycogen molecule has several peripheral and easily accessible non-reducing ends.
Fig 5.5.4. Schematic flow diagram of the steps in glycogenolysis. Two linear chains of the glycogen molecule(CORE) have been shown, connected by a branch-point. Phosphorylase action starts from the free, non-
reducing end of each chain (Source: Berg et al, fig 21.4)
Phosphorylase enables Inorganic phosphate to split the 1:4 bond by phosphorolysis, resulting in the release of one molecule of glucose 1-phosphate from each terminal residue attacked. Pyridoxal phosphate (PLP) is an essential co-factor for the enzyme and participates in the transfer of the phosphate group.
In terms of energetics, phosphorolysis is more advantageous than hydrolysis, since glucose is released as Glucose 6-P and does not require ATP to enter the glycolytic pathway.
59

Fig 5.5.5. Removal of a terminal glucose residue as glucose 1-phosphate from a linear chain of glycogen by theaction of glycogen phosphorylase
Phosphorylase catalyzes step-wise removal of glucose units from linear portions of the glycogen molecule until it approaches within four units of α-1:6 branch points. Phosphorylase cannot cleave the 1:6 α-glycosidic bonds and its action stops near such branch-points. Hence, phosphorylase per se can degrade only about 55% of the glycogen molecule, leaving a highly-branched residue called “limit dextrin”.
Step 2: The oligo (α-1:4à α-1:4) glucan transferase activity of the “de-branching enzyme” now targets the partially degraded chains. A trisaccharide unit, attached to the 1:6-linked glucose molecule of each partially degraded chain, is transferred to the non-reducing end of a different chain. The single glucose unit (shaded green in Fig 5.5.4.) at the 1:6 branch-point of the donor chain is thus exposed, while the 2nd chain is lengthened by more 1:4 α-glycosidic bonds on which phosphorylase can continue its action.
Step 3: The exposed glucose unit at the 1:6 position is removed hydrolytically by the α -1:6 glucosidase activity of the “de-branching enzyme”. Note that glucose and not glucose 1-P is released by this action.
Step 4: The major product of glycogenolysis at this stage is glucose 1-P (and some free glucose), which can neither enter glycolysis directly, nor leave the cell. The action of phosphoglucomutase transforms glucose 1-P to glucose 6-P and enables its entry into glycolysis in both liver and muscle (See Chapter 5 Section 1). Glycogenolysis thus provides skeletal muscle with a local supply of glucose as energy fuel to support muscular contractions.
Step 5: occurs only in the liver. To fulfill its obligation of supplying glucose to other tissues of the body, the liver uses another enzyme, glucose 6-phosphatase, to detach the phosphate group from
60

Glu 6-P and release free glucose into the blood. This enzyme is present only in the cells of the liver (and kidney) but not in muscle, brain and adipose tissue. Consequently, the liver can make glucose available from its stores to other tissues of the body but the muscle cannot do so.
Glucose 1- P
phosphoglucomutase
-BLOODTo
H2 OPi
GLUCOSE6Glucose - P
glucosephosphatase6-
It is interesting to know how the hepatic cell compartmentalizes and separates the action of glucose 6-phosphatase and phosphohexose isomerase (the next enzyme in glycolysis) on the same substrate i.e. glucose 6-phosphate. The isomerase is in the cytosol while the phosphatase is an integral membrane protein of the endoplasmic reticulum (ER) with its catalytic surface facing the ER lumen. A series of specific membrane transporters are brought into play. Glucose 6-P is carried from the cytosol into the ER lumen by a transporter (T1), hydrolyzed there, returned to cytosol by another transporter (T2), and then carried across the plasma membrane of the hepatocyte to the blood by the transporter GLUT2.
Fig 5.5.6. Schematic diagram to show the hydrolysis of glucose 6-phosphate in a hepatic cell and release of glucoseinto the blood (Source: Nelson and Cox, 2005, p 564 fig 15-6)
Fates of Glucose 6-phosphate As indicated in the text so far, glucose 6-P can be directed into many routes of carbohydrate metabolism. Glycolysis yields pyruvate and ATP from glucose 6-P, while the HMP pathway produces pentose phosphate and NADPH. Glucose 6-P can be used in the syntheses of glycogen, other sugars and glycocojugates. On the other hand, the action of glucose 6-phosphatase hydrolyzes glucose 6-P to liberate free glucose into the blood for uptake by extra-hepatic tissues.
61

Fig 5.5.7. Fates of glucose 6-phosphate produced by glycogenolysis in liver and muscle.(Source: Berg et al 2002, fig 21.3)
REGULATION OF GLYCOGENOLYSIS
Glycogen phosphorylase (PL) is the target enzyme for regulation of glycogenolysis. It is a dimer, composed of two identical sub-units. One serine residue (Ser14) on each sub-unit can undergo reversible phosphorylation. The structure of the subunits is rather unique. Each subunit has four sites: a glycogen-binding (‘docking’/‘storage’) site, a catalytic site which is about 30 Angstroms away, an allosteric site and a cofactor (PLP)-binding site. The narrow crevice which forms the glycogen-binding site, can accommodate only a linear chain of 4-5 glucose residues. This explains why the enzyme is unable to act on the branched portions of the glycogen molecule. At the same time the ‘docking’ of many glucosyl residues ensures better catalytic efficiency since the substrate need not be completely associated or dissociated between catalytic cycles.
62

Fig 5.5.8. A ribbon diagram of glycogen phosphorylase. The two sub-units are shown in black and yellow. Eachcatalytic site includes the cofactor PLP (pyridoxal phosphate). The yellow circle is the binding region
for Pi (inorganic phosphate). (Source: Berg et al 2002, fig 21.6)
Phosphorylase (PL) can exist in two forms:
i. Phosphorylase ‘a’ – which is phosphorylated and is the active form
ii. Phosphorylase ‘b’ – which is dephosphorylated and relatively inactive
Phosphorylation is brought about by the action of kinases viz. protein kinase and phosphorylase b kinase, and utilizes ATP. Dephosphorylation is catalyzed by protein phosphatase-1 (PP-1) and uses water.
Both phosphorylase a and b can adopt two different conformations:
i. ‘R’ or “relaxed’ conformation which is catalytically activeii. ‘T ’or “tense” conformation which is catalytically inactive
63

Fig 5.5.9. Schematic diagram of the T (inactive) and R (active) forms of phosphorylase b and a, and the factors that favor their existence. (Source: Voet and Voet, 1995, p 494 fig 17-9)
The R state of PL a (i.e active enzyme) is generally favored, unless glucose levels are high, while PL b is mostly in the T state, unless AMP is high.
The activity of phosphorylase in liver and muscle is controlled by two mechanisms:
• Hormonal: epinephrine and glucagon act through a cAMP-dependent enzyme cascade pathway to activate PL by phosphorylation (i.e. covalent modification). This is the preferred mode of regulation of PL under physiological conditions. The adrenals secrete epinephrine, (for ‘fight or flight’), when the organism is under stress. The pancreas secretes glucagon when blood levels of glucose are low, and insulin, when blood glucose levels are high.
• Allosteric: local ions/molecules (viz. AMP, Ca2+, glucose) in the cell bind to specific allosteric sites and cause conformational changes that alter the activity of phosphorylase
Muscle and liver phosphorylases are isozymes and exhibit some differences in their regulatory properties. We will, therefore, consider the regulation of phosphorylase activity separately in these two organs.
1. Regulation of phosphorylase in the muscleThe activation of muscle phosphorylase is synchronized with muscle contraction. The hormonal mechanism of regulation is initiated by epinephrine which is released when there is a need for sudden and strong muscle activity. The action of one molecule of the hormone epinephrine (i.e. the primary signal), finally leads to the activation of several molecules of the target enzyme, phosphorylase. Such a mechanism is an enzyme cascade pathway.
64

Refer to Fig 5.5.9 as we trace the steps in the cascade mechanism for activation of glycogen phosphorylase in the muscle.
Fig 5.5.10. Regulation of glycogen phosphorylase in the muscle by a cAMP-mediated enzyme cascade mechanism Other factors in regulation of the target enzyme have also been shown. (Source: Murray et al, 2003, p 149 fig 18-6)
Step 1: Epinephrine binds to β-receptors on the cell membrane of myocytes to trigger a cAMP-mediated cascade pathway for activating phosphorylase
Step 2: The binding of epinephrine activates a membrane-bound enzyme adenylyl cyclase, which converts ATP to cyclic 3’,5’-AMP.
Step 3: Cyclic AMP binds to the enzyme protein kinase and activates it by removing its regulatory subunits.
65

O
N
N N
N
H2N
H
HH
O2CH
H
O HO3'
5'
P
O-O
Fig 5.5.11. Structure of 3’,5’-cyclic AMP
Fig 5.5.12. The mechanism of activation of protein kinase by cyclic AMP: On left is the inactive holoenzyme, R2C2,in which R and C are regulatory and catalytic sub-units respectively. In the inactive R2C2 complex, thecatalytic site of C is occupied by a ‘pseudosubstrate’, i.e. a pentapeptide sequence of the R chain whichprevents entry of the substrate. Allosteric binding of cAMP moves this sequence away so that C is now
free for binding and catalytic activity. (Source: Berg et al, 2002, fig 10.28)
Step 4: Active cAMP-dependent protein kinase (PKA) performs two functions:• phosphorylates and fully activates phosphorylase kinase • phosphorylates a small regulatory protein, inhibitor-1 which inactivates protein
phosphatase-1 (PP-1) This ensures that PP-1 cannot dephosphorylate and inactivate both phosphorylase kinase and phosphorylase a. (In absence of active PKA, PP-1 will dephosphorylate and inactivate both the enzymes).
Thus, both activation and inactivation of phosphorylase depend on presence or absence of cAMP It is important to also note in Fig 5.5.9 that the enzyme phosphodiesterase can hydrolyze cAMP to 5’AMP and thus terminate hormone action within a cell.
Step 5: Activated phosphorylase kinase phosphorylates PL b to the active form, PL a, which then starts the process of glycogenolysis.
66

Fig 5.5.13. Schematic representation of the phosphorylation of glycogen phosphorylase by phosphorylase kinaseand dephosphorylation by protein phosphatase-1. Organ-specific stimulatory effects (see text) ofepinephrine, glucagon, calcium ions and AMP on phosphorylase kinase have also been shown.
(Source: Nelson and Cox, 2003, p 584 fig 15-24)
The step-wise process of activation of phosphorylase depicted in Fig 5.5.12 (below) will now enable you to understand the enzyme cascade mechanism. Notice that there have been 4 amplification steps in phosphorylase activation. Adenylate cyclase, protein kinase, phosphorylase kinase and phosphorylase actions have followed in sequence, with each enzyme activating the next enzyme in the sequence. Follow the estimated number of molecules shown at each step in the figure. Remember that since an enzyme is a catalyst, every molecule of the enzyme is available again for action at the end of every reaction. Notice also that only the enzymes per se have undergone activation and remember that this is a reversible phenomenon.
67

Fig 5.5.14. The amplification of a primary hormonal signal by an enzyme cascade mechanism: An estimate of thenumber of molecules produced at each step in the cascade has been shown. One molecule of
epinephrine finally activates 1,0000 molecules of the target enzyme, glycogen phosphorylase.(Source: Nelson and Cox, 2003, p 585 fig 15-25)
Superimposed on the hormonal regulation of muscle phosphorylase is faster allosteric regulation by:
• AMP – During muscle contraction, the breakdown of ATP increases [AMP]. An allosteric site in phosphorylase b attaches AMP and the enzyme is activated by a conformational change without conversion to phosphorylase a.
• Ca2+ – Calcium release is the signal for muscle contraction. Binding of Ca2+ activates dephosphorylated phosphorylase kinase. The muscle enzyme is represented as (αβγδ)4. Serine residues on the α and β subunits are phosphorylated by PKA. The δ subunit is calmodulin and it binds four Ca2. The enzyme is fully active only when both phosphorylation and Ca2+-binding have taken place
68

A. B. C.
Fig 5.5.15. Schematic diagram of the activation of phosphorylase kinase: the enzyme is only partly activatedby covalent modification (A: phosphorylation) or allosteric modulation (B: attachment of Ca2+ ).
Full activation requires both the mechanisms of activation (C) to occur simultaneously.(Adapted from Berg et al, 2002, fig 21.13)
• Glucose 6-P and ATP – High cellular concentrations of glucose 6-P and ATP inhibit PL b: they prevent conformational change of PL b by attaching to its AMP-binding site.
Thus, regulation of phosphorylase ensures that at times of increased muscle activity, glycogenolysis is stimulated and provides glucose. When muscle is at rest, ATP levels are adequate and glycogenolysis is not required.
2. Regulation of Phosphorylase in the LiverThe mechanism of activation of phosphorylase in the liver is similar to that in the muscle with the following differences that are in keeping with the role of the liver in carbohydrate metabolism:
• Glucagon, secreted by the pancreas when blood glucose falls, can also initiate the cAMP-dependent enzyme cascade pathway to activate phosphorylase. This ensures that hepatic cells release essential glucose into the blood when the nutritional state is low. Glucagon is ineffective in the muscle.
• Vasopressin, oxytocin, angiotensin II and epinephrine stimulate glycogenolysis through a phosphoinositide cascade pathway. The hormones bind to an α1-adrenergic receptor in the plasma membrane and activate a G protein that stimulates phospholipase C. The resulting increase in inositol 1,4,5-triphosphate (IP3) induces Ca2+ mobilization from ER stores to the cytosol and activates phosphorylase kinase.
• Allosteric regulation of phosphorylase is by glucose and not by AMP. When blood glucose is high, glucose uptake in the hepatic cell is also increased. Glucose now binds to an allosteric site on PL a, causing a conformational change that results in dephosphorylation and inactivation of the enzyme by PP-1. When blood glucose falls, the allosteric inhibition is removed and glycogenolysis starts again. Thus PL a is a “glucose sensor” in liver cells.
Fig 5.5.16. Schematic diagram of the conformational change in phosphorylase a caused by allosteric binding of
69

glucose. (Source: Nelson and Cox, 2003, p 585 fig 15-26)
• Insulin, secreted by the pancreas when blood glucose is high, stimulates PP-1, which inactivates both phosphorylase kinase and PL a. Insulin also increases the action of phosphodiesterase so that cAMP is hydrolyzed. Thus insulin action is antagonistic to that of glucagon.
Section 5.5.BGLYCOGENESIS
Glycogenesis is the synthesis of glycogen from glucose. After a meal when the levels of blood glucose are high and insulin is present, cells of the liver and muscle take up glucose to replenish their glycogen stores. The reactions of glycogenesis are cytosolic, well-regulated and co-ordinated with glycogenolysis.
Glycogen synthesis essentially involves step-wise attachment of glucose residues to a pre-existing “glycogen primer” so that it increase in size. De novo synthesis of the glycogen molecule requires a protein “primer” called glycogenin. The reactions are essentially similar in liver and muscle though their regulation differs in detail in the two organs.
A. Steps in the synthesis of Glycogen by enlarging a “glycogen primer”A “glycogen primer” is essentially a pre-existing α-1,4 glucan (i.e. amylose chains). There are three steps in expanding this structure to obtain the highly branched glycogen molecule:
GLYCOGEN( )expanded( primer )
+1n
PUD
n )(GLYCOGEN
glycogen synthase( primer )
GLUCOSE
2 P i
DA PAT P
-phosphoglucomutase
hexokinase /glucokinase
Glucose-DPU
pyrophosphataseTPU
PP i
pyrophophorylase
H2O
Glucose Glucose1- P6 - P
Fig 5.5.17. Summary of the synthesis of glycogen from glucose by using ‘glycogen primer’.
Step 1: Conversion of glucose to UDP-glucose Glucose is phosphorylated to Glucose 6-P by hexokinase /glucokinase (as in glycolysis) and then isomerised to Glucose 1-P by phosphoglucomutase. The next enzyme, UDP-glucose
70
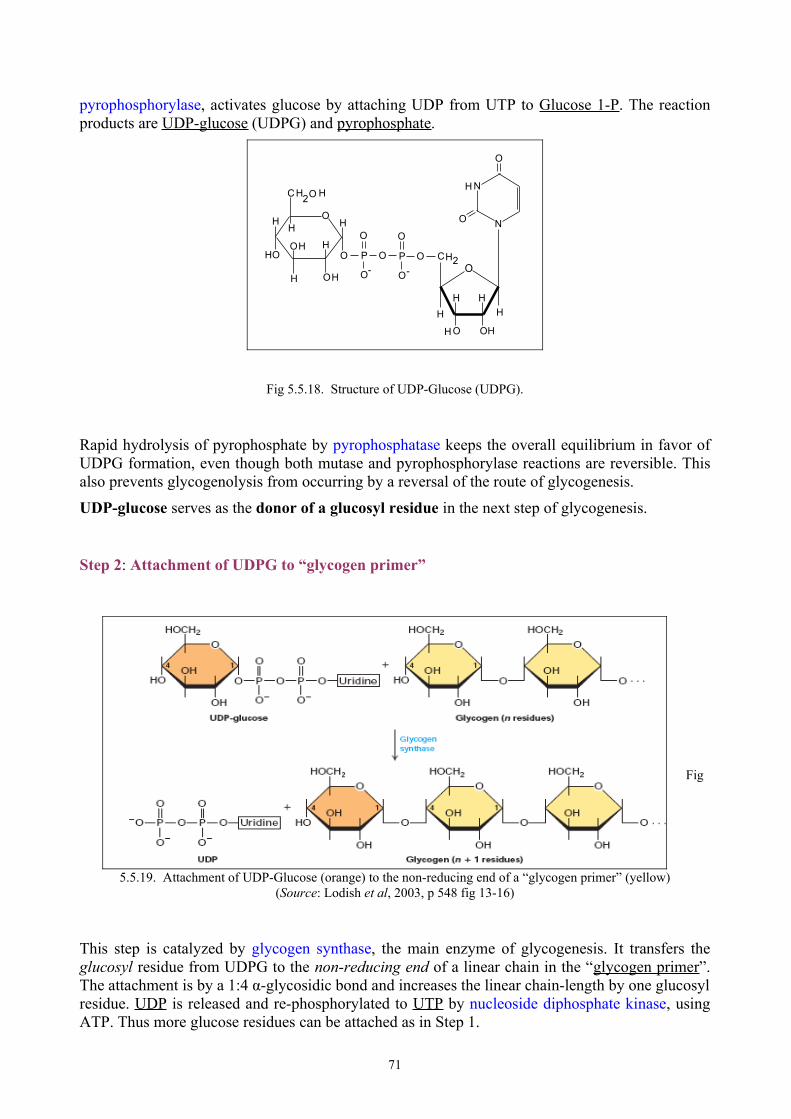
pyrophosphorylase, activates glucose by attaching UDP from UTP to Glucose 1-P. The reaction products are UDP-glucose (UDPG) and pyrophosphate.
O-P
O
O
O-P
O
OH
H
O
C
H
H
HHO
HO
O
2 HH O
O
H
H
HH
O2CH
H
O HOH
N
NO
O
H
Fig 5.5.18. Structure of UDP-Glucose (UDPG).
Rapid hydrolysis of pyrophosphate by pyrophosphatase keeps the overall equilibrium in favor of UDPG formation, even though both mutase and pyrophosphorylase reactions are reversible. This also prevents glycogenolysis from occurring by a reversal of the route of glycogenesis.
UDP-glucose serves as the donor of a glucosyl residue in the next step of glycogenesis.
Step 2: Attachment of UDPG to “glycogen primer”
Fig
5.5.19. Attachment of UDP-Glucose (orange) to the non-reducing end of a “glycogen primer” (yellow)(Source: Lodish et al, 2003, p 548 fig 13-16)
This step is catalyzed by glycogen synthase, the main enzyme of glycogenesis. It transfers the glucosyl residue from UDPG to the non-reducing end of a linear chain in the “glycogen primer”. The attachment is by a 1:4 α-glycosidic bond and increases the linear chain-length by one glucosyl residue. UDP is released and re-phosphorylated to UTP by nucleoside diphosphate kinase, using ATP. Thus more glucose residues can be attached as in Step 1.
71

The net reaction at this stage is:
Glucose + (Glucose)n + 2ATP à (Glucose) n+1 + 2ADP +2 Pi
Glycogen synthase continues step-wise addition of more glucose residues on all linear chains of the pre-existing “primer”. Physical proximity of glycogen synthase to the enlarging molecule facilitates this attachment.
Step 3: Branching of linear chains
Fig 5.5.20. Schematic diagram of glycogenesis, showing detachment of an oligosaccharide unit from a newlysynthesized linear chain and re-attachment by an 1:6 α-glycosidic bond to form a branch-point.
(Source: Nelson and Cox, 2005, p 569 fig 15-9)
After a linear chain of at least 11-13 glucose residues has been formed, a terminal oligosaccharide unit of 6-7 residues is detached and transferred to a more internal position on the same or a nearby chain. The attachment is by an 1:6 α-glycosidic bond, thus creating a branch point. The enzyme catalyzing this reaction is amylo 1:4à 1:6 transglycosylase or “branching” enzyme. The new branch point is created at least 4 glucosyl residues away from any pre-existing branch point. Glycogen synthase can now continue to add more glucosyl residues by 1:4 α-glycosidic bonds to two non-reducing ends.
The final size of the glycogen molecule is attained by continued linear increase with 1:4 α-glycosidic bonds and branching with 1:6 α-glycosidic bonds.
B. De novo synthesis of glycogen
Glycogenin is a protein “primer which initiates synthesis of a new glycogen molecule. It is a 37 kDa, self-glycosylating protein that first attaches a glucosyl residue from UDPG to the hydroxyl group of a specific Tyrosine residue in its own peptide chain. Glycogenin then continues its glucosyltransferase activity till a linear chain of 8 glucosyl residues, joined by 1:4 α-glycosidic bonds, is obtained. The “primed” glycogenin can now be acted on by glycogen synthase and the “branching” enzyme to obtain the final glycogen particle.
72

Fig 5.5.21. De novo synthesis of glycogen: a Tyrosine residue in the protein glycogenin (represented by the blueoval) attaches glucosyl residues borne by UDP. Subsequently glycogen synthase and the branching
enzyme help to produce the final product, glycogen (green oval).
Fig 5.5.22. Initial interaction between a molecule of UDP-Glucose and Tyrosine residue of glycogenin(Source: Nelson and Cox, 2005, p 570 fig 15-11)
73

Fig 5.5.23. Ribbon model of glycogenin: The red ball-and-stick structure represents the substrate, UDP-Glucose.(Source: Nelson and Cox, 2005, p 569 fig 15-10)
Glycogen synthase is catalytically active only as long as it is in contact with glycogenin; this restricts the size of the final glycogen molecule REGULATION OF GLYCOGENESIS Glycogen synthase (GS) is the target enzyme for regulation of glycogenesis. The enzyme can exist in two forms (cf phosphorylase):
i. Glycogen synthase ‘a’ – non-phosphorylated and activeii. Glycogen synthase ‘b’ – phosphorylated and relatively inactive
Notice that glycogen synthase is activated by dephosphorylation and inhibited by phosphorylation. This is in contrast to. phosphorylase.
The mechanisms of regulation are both hormonal and allosteric, and operate in response to blood and cellular levels of glucose:
Hormonal – reversible phosphorylation of glycogen synthase is the key to its control (cf phosphorylase). The effective hormones are insulin and epinephrine/glucagon.
Allosteric – by Glc 6-P, Ca2+ and possibly glycogen itself
74

Fig 5.5.24. Cascade mechanism for activation/inactivation of glycogen synthase. Refer to the text for details.(Source: Murray et al, 2003, p 150 fig 18-7)
GS is unique in that it can be phosphorylated i.e. inactivated (GSa à GSb) on several serine residues by at least eleven different kinases! The most important among them is glycogen synthase kinase-3 (GSK3), which strongly inhibits glycogen synthase by phosphorylating three Ser residues near the carboxy-terminal end of the enzyme. GSK3 acts after prior “priming” of GS by another protein kinase, casein kinase II.
The kinases that phosphorylate GSa, are in turn regulated by small local molecules like cAMP, Ca2+ and DAG (diacylglycerol). High glycogen in tissues decreases GSa but the mechanism is not understood.
75

Fig 5.5.25. Phosphorylation of glycogen synthase by GSK3 and its dephosphorylation by PP-1. The effect ofhormones on these two enzymes is also shown (Source: Nelson and Cox, 2005, p 586 fig 15-27)
In the liver, GS is dephosphorylated i.e. activated (GSb à GSa), by protein phosphatase-1 (PP-1), which removes the same three phosphoryl groups attached by GSK3. The catalytic activity of PP-1 is facilitated by allosteric binding of Glc 6-P. Association with a glycogen-targeting protein, GM, brings PP-1 into close proximity with glycogen synthase and helps in catalysis. GM can be phosphorylated in two different sites (1 and 2), and its action depends on which of these sites has been phosphorylated.
In the muscle, a different phosphatase performs this function of dephosphorylating and activating glycogen synthase.
Insulin stimulates glycogenesis by promoting dephosphorylation of GS in two ways:
• binds to a membrane receptor, tyrosine kinase, and triggers a cascade involving protein kinase B (PKB) to phosphorylate and inactivate GSK3
76

Fig 5.5.26. Mechanism of insulin-induced activation of GSK3 and consequent inactivation of glycogen synthase.(Source: Nelson and Cox, 2005, p 587 fig15-29)
• acts through an insulin-sensitive kinase to phosphorylate GM at site 1 so that it associates with the glycogen particle and activates PP-1; subsequently PP-1 dephosphorylates and activates glycogen synthase
Fig 5.5.27. Association of GM with enzymes in the glycogen particle: insulin (1) promotes association whileepinephrine (2) causes dissociation of GM and PP-1 (Source: Nelson and Cox, 2005, p588 fig 15-30 )
77

Epinephrine/Glucagon inhibits glycogen synthesis by favoring phosphorylation of GS in two ways:
• binds to a β-adrenergic membrane receptor to initiate a cAMP-mediated cascade that stimulates protein kinase (PKA) (cf. phosphorylase regulation) (see Fig 5.5.22.). Subsequently, PKA inactivates GS by:
phosphorylating GSa phosphorylating inhibitor-1, which in turn inhibits PP-1
phosphorylating GM at sites 1 and 2, so that PP-1 dissociates from the glycogen particle and GS remains inactivated
• binds to an α-adrenergic membrane receptor, triggering release of IP3, DAG (diacylglycerol) and Ca2+, which inhibit GS. DAG, together with Ca2+, activates protein kinase C to phosphorylate and inactivate glycogen synthase
78

Fig 5.5.28. Inhibition of glycogen synthase by IP3, diacylglycerol (DG) and Ca2+ in a hepatocyte. Note theantagonistic action of epinephrine and glucagon in glycogen metabolism.
(Source: Voet and Voet, 1995, p 508 fig 17-22)
GLYCOGEN STORAGE DISEASESThe hereditary lack of any of the enzymes of glycogen metabolism may result in deposition of an abnormal type or quantity of glycogen in tissues. These disorders called “glycogenoses” may have serious consequences on health and even survival.
79

TABLE 5.5.1 GLYCOGEN STORAGE DISEASES
(Source: Murray et al, 2003, p 152 18-2)
Section 5.5.C
RECIPROCAL REGULATION OF GLYCOGENESIS AND GLYCOGENOLYSISSynthesis and breakdown of glycogen are co-ordinated in such a way that when one is stimulated the other is inhibited. In this way steady levels of glucose are maintained both within the cell as well as in the body.
Regulatory mechanisms in glycogenolysis and glycogenesis respond to:
• Blood levels of glucose – which depends on the nutritional/metabolic state
• Muscular activity – which may suddenly demand energy fuel several hundred times that of the resting level
A balance in the activities of the two main enzymes viz. glycogen phosphorylase and glycogen synthase, is crucial in regulation of glycogen metabolism. From the preceding sub-sections you must have already realized that the actual controlling factors for glycogen synthase and phosphorylase are almost the same. It is therefore reasonable to assume that if a factor stimulates glycogenesis it should inhibit glycogenolysis synchronously and vice-versa.
In order to understand the reciprocal regulation of glycogenolysis and glycogenesis, it is useful to bear some fundamentals in mind:
• sites of glycogen metabolism are muscle and liver• glycogen provides glucose as energy fuel when energy state of cell is low (i.e.
[ATP]:[AMP]↓)
• surplus glucose needs to be stored as glycogen
80

• regulation of the pathways is by reversible covalent modification (phosphorylation) and allosteric modulation of key enzymes
• key regulatory enzymes are glycogen phosphorylase and glycogen synthase
• enzymes common to both pathways are phosphorylase kinase A and protein phosphatase-1
• key hormones are epinephrine, glucagon and insulin; their secretion depends on the [blood glucose]
• second messengers in hormone action are cAMP, IP3, and DAG
• enzyme cascades which amplify the primary signal are mediated by cAMP and phosphoinositide
• other cellular molecules linked to both pathways are glucose, Ca2+, AMP and ATP
Recall too the salient features in regulation of PL and GS:
• There is a basic difference in the effect of phosphorylation on PL and GS. Phosphorylation activates PL and inactivates GS
• PKA is the key enzyme in phosphorylation of PL and GS; it favors glycogenolysis and inhibits glycogenesis
• PP-1 is the main enzyme in dephosphorylation of PL and GS; it favors glycogenesis and inhibits glycogenolysis
• Cyclic AMP-mediated cascade simultaneously stimulates PKA and inhibits PP-1
• Epinephrine and insulin act on both muscle and liver; glucagon action is only on liver
81

Fig 5.5.29. Reciprocal regulation of glycogenolysis and glycogenesis. See text for details.
(Source: Murray et al, 2003, p 151 fig 18-8)
We can now summarise the reciprocal regulation of glycogenolysis and glycogenesis as follows:
1. Epinephrine/Glucagon stimulate glycogenolysis but simultaneously suppress glycogenesis:
Epinephrine/Glucagon à bound to β receptor on cell membrane à ↑ [cAMP] à activates PKA à phosphorylation promoted à PL activated; GS inhibited
Active PKA à inactivates PP-1 à dephosphorylation preventedà PL active; GS inactive
Epinephrine à bound to α receptor on cell membrane à phospholipase C active à ↑ [IP3] à cytosolic
↑ [Ca2+] à activates phosphorylase kinase à PL active
Phospholipase C activeà ↑ ([DAG] +↑ [Ca2+]) à activate protein kinase C à phosphorylation favored à GS inactive
2. Insulin stimulates glycogenesis but simultaneously suppresses glycogenolysis:
Insulin à ↑Glucose entry à ↑ [Glc 6-P]à inhibits phosphorylase kinase and activates PP-1à dephospohrylation favored à GS active; PL inactive
Insulin à inactivates GSK3 à dephosphorylation promotedà GS active
Insulin à activates PP-1 à dephosphorylation promoted à GS active; PL inactive
3. [Ca2+] stimulates glycogenolysis and simultaneously suppresses glycogenesis:
Muscle: the release of Ca2+ is the signal for muscle contraction and it simultaneously stimulates glycogenolysis to provide glucose as energy fuel
Neural/electrical stimulation of muscle à cytosolic ↑ [Ca2+] à stimulates phosphorylase kinase and à phosphorylation promoted à PL activated; GS inactive
Liver: Vasopressin, epinephrine etc.à ↑ [IP3] à cytosolic ↑ [Ca2+] à phosphorylation promoted à PL activated; GS inactive
4. [Glucose]: increased availability of glucose favors glycogenesis:
• ↑ [Glc 6-P] à allosteric binding to PL b à dephosphorylation favored à PL inactive
• ↑ [Glucose]à allosteric binding to PL a à dephosphorylation by PP-1 à GS active; PL inactive
{Index: ↑ = increase; ↓ = decrease; GS = glycogen synthase; PL= phosphorylase; PKA = protein kinase A; PP-1 = protein phosphatase -1}
82

SUMMARY 5.5: GLYCOGEN METABOLISMGlycogen metabolism occurs primarily in the liver and muscle. It is constituted by two separate pathways viz. glycogenolysis and glycogenesis.
Glycogenolysis releases glucose from the glycogen stores in the liver for provision to extrahepatic tissues when blood glucose is low. Glycogenolysis in muscle provides glucose for its own immediate energy needs. Cyclic AMP-linked enzyme cascade systems ensure an amplified response to the hormonal signals which trigger glycogenolysis. Glycogenesis synthesizes glycogen from glucose for storage purposes when blood glucose is high. A protein, glycogenin, is essential for de novo synthesis of glycogen
Both processes are strictly regulated so that they do not occur simultaneously.
Chapter 5 Section 6GLUCONEOGENESIS
Gluconeogenesis is the synthesis of glucose from non-carbohydrate precursors. There is always a basal requirement of glucose per se in the body even when fats are available to meet most of the body’s needs for energy.
Tissues like the brain and RBC use glucose as primary energy fuel and need a continuous supply. Skeletal muscle performing strenuous exercise, needs glucose for anaerobic glycolysis. Glucose is also a precursor for the synthesis of triglyceride in adipose tissue and lactose in the mammary glands.
It is estimated that the average daily requirement of glucose in a typical adult is 160 gms, of which the brain utilizes 120 gms! The available glucose in the blood and from glycogen reserves is sufficient to meet our glucose needs only for a day. Hence a source of glucose is essential, particularly during a long period of starvation or during sudden and intense muscular activity.
At such times the liver (and to a much lesser extent, the renal cortex) again comes to the rescue. It carries out gluconeogenesis and converts pyruvate to glucose by reversing several of the steps of glycolysis. Additionally, the process also serves to clear metabolic products of other tissues e.g. lactate (muscle, RBC) and glycerol (adipose tissue). The main precursors for gluconeogenesis are 3-C compounds like lactate, propionate, glycerol and alanine. The energy required for gluconeogenesis is provided by oxidation of fatty acids.
Section 5.6APATHWAY OF GLUCONEOGENESIS
Gluconeogenesis, which converts pyruvate to glucose, shares several common steps with glycolysis, which converts glucose to pyruvate. However, a simple reversal of glycolysis does not enable gluconeogenesis, since the thermodynamic equilibrium of glycolysis strongly favors conversion of glucose to pyruvate. The energy barriers preventing a simple reversal are due to the three irreversible reactions of glycolysis (refer Section 1) viz.:
• Glucose + ATP à Glucose 6-P + ADP (catalyzed by hexokinase/glucokinse)• Fructose 6-P + ATP à Fructose 1,6 BP + ADP (catalyzed by phosphofructokinase-1)• Phosphoenolpyruvate + ADP à Pyruvate + ATP (catalyzed by pyruvate kinase)
The energetically unfavorable reversal of glycolysis is converted to a favorable one with the help of four “gluconeogenic” enzymes viz pyruvate carboxylase, phosphoenolpyruvate
83

carboxykinase, fructose 1,6-bisphosphatase-1 and glucose 6-phosphatase. Six high-energy phosphate bonds from ATP and GTP are also utilized for every molecule of glucose synthesized from pyruvate.
Fig 5.6.1. Overview of steps in the conversion of pyruvate to glucose.
(Adapted from: Hames and Hooper, 2000, p 291 fig 1)
The three irreversible reactions of glycolysis are circumvented in the following way to enable gluconeogenesis:
84

Reaction 1: Pyruvate à Phosphoenolpyruvate This reaction has two main steps, linked by an intermediate metabolite, OAA. The 1st step occurs in the mitochondrion and is catalyzed by pyruvate carboxylase (PC). Pyruvate produced in the cytosol, enters the mitochondrion using a pyruvate transporter, and is carboxylated by PC to yield oxalacetate (OAA).
The enzyme is a tetramer of 4 identical subunits, each of which has biotin as a co-factor to transfer activated CO2. The enzyme requires Mg2+.
Fig 5.6.2. Schematic representation of the domain structure of pyruvate carboxylase.(Source: Berg et al, 2002, p 680 fig 16.25)
The ATP-binding domain of the enzyme transfers COO- group derived from bicarbonate- to its biotin-binding domain. COO- is attached to pyruvate in the central domain. The overall reaction here is as follows:
Enz-biotin +CO2 +ATP à Enz-biotin-COO- + ADP + Pi
Enz-biotin-COO- + Pyruvate à Enz-biotin + OAA
Fig 5.6.3. Ball-and-stick model of carboxy-biotin (C atoms = black; O atoms = pink; H atoms = white; N atoms =blue; S atoms = yellow) Biotin is attached through a specific Lysine residue to a long flexible arm of
pyruvate carboxylase (Source: Berg et al, 2002, fig 16.27)
In the 2nd step, PEP-carboxykinase (PEP-CK) simultaneously decarboxylates and phosphorylates OAA to produce phosphoenolpyruvate (PEP). This enzyme also requires Mg2+.
The ease in conversion of OAA to PEP depends on the location of PEP-CK within the cell. Depending on the species, PEP-CK is present in the cytosol and/or mitochondrion. If the enzyme is in the mitochondrion (e.g. rabbit), OAA can be directly converted to PEP which then goes out into the cytosol for subsequent reactions. In humans, PEP-CK is more or less equally distributed between the two compartments, and the activity of the mitochondrial isozyme is predominant when the gluconeogenic precursor is lactate.
85

However, if PEP-CK is in the cytosol (e.g.rat), the malate shuttle (refer Section1) is used to transport OAA across the mitochondrial membrane to the cytosol for subsequent conversion to phosphoenolpyruvate.
Fig 5.6.4. The two routes for conversion of pyruvate to phophoenolpyruvate: the location of the enzyme PEPcarboxykinase determines whether the formation of PEP is in the cytosol or in the mitochondrion.
(Source: Nelson and Cox, 2005, p 547 fig14-19)
Cytosolic and mitochondrial isozymes of malate dehydrogenase (MDH) are used in the malate shuttle. OAA is first reduced to malate by an NADH-linked, mitochondrial MDH. Malate crosses the inner mitochondrial membrane and is re-oxidised to OAA by cytosolic MDH.
2CH
-C OO
HCH O
C OO - C OO -2CH
-C OO
C O=
a etam les ogenardd he y
N H.A D +HN A D+
malate oxaloacetate
The malate shuttle thus generates cytosolic NADH required to reverse the glyceraldehyde 3-P dehydrogenase reaction of glycolysis, so that glucose can be synthesized.
Transaminases also enable a transfer of OAA to the cytosol, this time in the form of aspartate.
Overall Reaction
PYRUVATE + ATP + GTP + HCO3- à PEP + ADP + GDP + Pi + CO2
86

Notice that two high-energy phosphates have been used. Though ∆G’o is 0.9 kJ/mol for Reaction 1, the actual ∆G under cellular conditions is -25 kJ/mol and this makes the reaction irreversible.
Reaction 2: Fructose 1,6-bisphosphate à Fructose 6-phosphate
6C
H
O 2C HH O
HOH
HO H
H O
P2H O1
H
HO H
H O
P6
2C H O
H
O 2C H O
HO
PH 2O P i
bisphosphatasefructose ' 6 -1
fructose 1,6-bisphosphate fructose 6-phosphate
∆G’o = -16.3kJ/mol
The phosphate group at C-1 of fructose 1,6-bisphosphate (Fru 1,6-BP) is removed hydrolytically by fructose 1,6-bisphosphatase-1 (FBPase-1) in an exergonic reaction that yields Fru 6-P. This key enzyme is present in the liver and kidney but not in adipose tissue. It is an allosteric enzyme with ATP as positive and AMP as negative modulators.
Reaction 3: Glucose 6-phosphate à Glucose
H 2O P i
phosphataseglucose 6 -H
H
HO
H
O
H
HHO
O
2C H O
H
6H
HO
H
H
HO
H
O
H
HHO
HO
O
2C H O
H
P6
glucose 6-phosphate glucose ∆G’o = - 13.8 kJ/mol
Glucose 6-phosphatase (Glc 6-Pase) hydrolyzes glucose 6-phosphate (Glc 6-P) to glucose in the lumen of the ER and releases glucose and Pi (as explained in glycogenolysis). The enzyme is present in the liver, kidney and intestine but not in muscle and adipose tissue. Hence the liver is the chief supplier of glucose formed by gluconeogenesis to the blood.
All the other reactions of gluconeogenesis are common with glycolysis and occur by a simple reversal of the glycolytic reactions. We can now link all the reactions and view the composite picture of the gluconeogenic pathway.
87

Fig 5.6.5. A composite view of the pathway of gluconeogenesis and its relationship to glycolysis.(Source: Nelson and Cox, 2003, p 544 fig 14-16)
OVERALL REACTION OF GLUCONEOGENESIS:
2 Pyruvate + 4 ATP + 2 GTP + 2 NADH + 2 H+ + 4 H2O à GLUCOSE + 4 ADP + 2 GDP + 6 Pi + 2 NAD+
88

MAJOR PRECURSORS OF GLUCONEOGENESIS
1. Lactate:
Approximately 80% of lactate produced by anaerobic glycolysis in the muscle and other tissues is converted to glucose by gluconeogenesis in the liver. Reversal of the lactate dehydrogenase reaction of anaerobic glycolysis converts lactate to pyruvate and funnels it into gluconeogenesis.
C OO -
C H3
C O=
N H.A D +HN A D+
lac et taes ogenardd he y
HH O
-
C H3
C OO
C
lactate pyruvate
The processing of lactate between the muscle and liver is known as the Cori’s cycle. Lactate from the muscle is carried by blood to the liver where it undergoes gluconeogenesis. The glucose produced is transported back to the muscle for glycolysis. Tissue-specific distribution of the isozymes of LDH enables ready conversion of lactate to pyruvate by the hepatic cells.
Fig 5.6.6. Representations of the Cori’s cycle and the glucose-alanine cycle between muscle and liver. The Cori’scycle processes lactate while the glucose-alanine cycle processes alanine.
(Source: Murray et al, 2003, p 159 fig 22-13)
2. Alanine:
During starvation, slow breakdown of muscle produces glucogenic amino acids among which alanine is predominant. Alanine is also released into the hepatic portal vein during protein digestion in the GIT.
89

The blood transports Ala from muscle to the liver where transamination converts it to pyruvate for gluconeogenesis. The glucose formed is transferred back to the muscle as energy fuel. The glucose-alanine cycle thus results in a net transfer of Nitrogen from muscle to liver, and of energy from liver to muscle.
The TCA cycle also provides a route for passage of other “glucogenic” amino acids into the gluconeogenic pathway; Subsequent transfer to cytosol for gluconeogenesis is via malate. The major intermediates that link the amino acids to gluconeogenesis are:
PYRUVATE - Ala, Cys, Gly, Ser, Threo, Try
α-KETOGLUTARATE - Arg, Glu, Gln, His, Pro
SUCCINYL CoA - Ileu, Met, Threo, Val
FUMARATE - Phe, Tyr
OAA - Asp, Asn
3. Glycerol: Glycerol is a product of lipolysis in adipose tissue, both from stored triglycerides and from lipoprotein complexes cleaved at the level of the capillary walls. Free glycerol diffuses out into the blood and is taken up by the liver and kidney.
Fig 5.6.7. Conversion of glycerol to the glycolytic intermediate dihydroxyacetone phosphate, which can entergluconeogenesis as shown in Fig 5.6.5. (Source: Murray et al, 2003, p 198 fig 24-2)
Glycerol is first phosphorylated to glycerol 3-P by glycerokinase, an enzyme present mainly in the liver and kidney but not in adipose tissue. This is followed by dehydrogenation to dihydroxyacetone phosphate, which now makes a lateral entry into the pathway of gluconeogenesis.
4. Propionate:
Propionate is a product of lipid digestion in ruminants, and of β-oxidation of fatty acids (with an odd number of carbon atoms). Propionate is activated to propionyl CoA by acyl-CoA synthetase and then carboxylated to a 4-C intermediate, methylmalonyl CoA. This compound can be isomerised to succinyl CoA, an intermediate of the TCA cycle. Subsequent entry into gluconeogenesis is via malate.
90

Fig 5.6.8. Route for conversion of propionate to succinyl-CoA which enters the gluconeogenic pathway via malate(Source: Murray et al, 2003, p155 fig 19-2)
There is no net conversion of fatty acids to glucose in mammals even though oxidation of fatty acids directly provides acetyl-CoA to the TCA cycle. The PDH reaction, which converts pyruvate to acetyl-CoA, cannot be reversed by any “by-pass” step. The enzymes that release pyruvate from citrate, viz. “malic” enzyme and citrate lyase, are more involved in lipogenesis than in gluconeogenesis.
REGULATION OF GLUCONEOGENESISThe rate of gluconeogenesis depends on the activities of its key enzymes and the availability of its precursors.
The key regulatory enzymes in gluconeogenesis are:
• pyruvate carboxylase
• phosphoenolpyruvate carboxykinase
• fructose 1,6-bisphosphatase-1
• glucose 6-phosphatase.
The activities of these enzymes are low when blood glucose is high (as in carbohydrate-feeding) and high when blood glucose is low (as in starvation and diabetes). Their regulation of these enzymes is by both allosteric and hormonal mechanisms.
Acetyl-CoA is an allosteric activator of pyruvate carboxylase, The concentration of acetyl CoA increases on consumption of a high fat diet (owing to increased β-oxidation of fatty acids); hence such a nutritional state favors gluconeogenesis.
Citrate, which is a product of the condensation of acetyl-CoA with OAA, stimulates FBPase-1 allosterically.
ADP and AMP increase in concentration when the energy state of the cell is low and this is not conducive to gluconeogenesis. ADP inhibits both pyruvate carboxylase and PEP-CK, while AMP and fructose 2,6-bisphosphate inhibit FBPase-1.
The hormones, glucagon, epinephrine and glucocorticoids, are inducers of the synthesis of all the gluconeogenic enzymes, while insulin is a repressor.
91

The availability of precursors also affects gluconeogenesis. Conditions in extrahepatic tissues that increase the production of lactate and alanine are conducive to gluconeogenesis in the liver. A high rate of anaerobic glycolysis in active muscle increases lactate production, while starvation increases breakdown of muscle proteins to release alanine. High levels of Ala also inhibit pyruvate kinase in the liver so that glycolysis is decreased. Glucagon increases lipolysis in adipose tissue and makes glycerol available for gluconeogenesis while insulin has the opposite effect.
Ethanol inhibits gluconeogenesis. The oxidation of ethanol in the liver increases [NADH] and shifts the LDH/MDH reactions to favor lactate/malate over pyruvate/OAA respectively. It is therefore unwise to consume liquor on an empty stomach!
Section 5.6B
RECIPROCAL REGULATION OF GLYCOLYSIS AND GLUCONEOGENESIS
The hepatic cells have a triple access to glucose supply viz from the blood, by glycogenolysis and by gluconeogenesis. Since the liver provides glucose as energy fuel to other tissues in preference to its own self, a tight regulation is required on its ability to degrade glucose by glycolysis and synthesize glucose by gluconeogenesis. At any point in time, the pathway favored depends on the levels of blood glucose and on the energy state of the hepatic cells. Conditions that favor gluconeogensis concomittantly suppress glycolysis, and vice- versa.
Both pathways have many common and reversible steps. Hence, regulation is excercised on the enzymes catalyzing those reactions which are distinct for each pathway.
The key enzymes for glycolysis are pyruvate kinase (PK), phosphofructokinase-1 (PFK-1) and glucokinase/hexokinase (GK/HK). The key enzymes for gluconeogenesis are pyruvate carboxylase (PC), phosphoenolpyruvate carboxykinase (PEP-CK), fructose 1,6-bisphosphatase (FBPase-1) and glucose 6-phosphatase (Glu 6-Pase). They are regulated reciprocally by allosteric or hormonal control of their activity or transcriptional control of their quantity.
(It would be advisable here to revise the regulatory mechanisms explained for glycolysis in Section 1 of this chapter. In the discussion below, we have used the color blue for glycolytic enzymes and orange for gluconeogenic enzymes).
Allosteric regulation
Concentrations of critical local molecules cause allosteric modulation of the activities of PFK-1 vs FBPase-1 and PK vs PC and they play a primary role in determining whether glycolysis or gluconeogensis will take place.
The allosteric modulators affect the pathways as follows:
a. [ATP]/[AMP]When the energy state of the cell is low, [AMP] is high and the synthesis of ATP is required. Since AMP activates PFK-1 and inhibits FBPase-1, and ADP inhibits PC, hence glycolysis is favored and gluconeogenesis is suppressed to make more ATP available to the cell.
Conversely, when the energy state of the cell is high, increased levels of ATP inhibit PFK-1 and PK, while low [AMP] does not inhibit FBPase-1; hence gluconeogenesis is favored over glycolysis. During processes that consume energy, a small change in [ATP] causes a large change in [AMP]. This enables PFK-1 to respond even to small changes in the energy status of the cell and thereby control glycolysis.
92

• •
Fig 5.6.9. Allosteric modulators of the glycolytic and gluconegenic enzymes involved in reciprocal regulationof the two pathways. (Source: Berg et al, 2002, fig 16.30)
b. Acetyl-CoAIncreased β-oxidation of fatty acids occurs under conditions of starvation, high-fat diet or diabetes. The consequent increase in [acetyl-CoA] activates both PC and FBPase-1 allosterically, stimulating gluconeogenesis but suppressing glycolysis:
• ↑ β-oxidation of fatty acids à ↑ [acetyl-CoA] à ↑ PC activity à ↑ OAA formation à ↑ [citrate] à stimulates FBPase-1 activity à gluconeogeneis ↑
• ↑ [citrate] à inhibits PFK-1 à glycolysis ↓
Increased [acetyl-CoA] provides more ATP as energy to facilitate gluconeogenesis, but the same high cytosolic levels of ATP inhibit PFK-1 and also PK (by decreased formation of Fru 1,6 BP) to suppress glycolysis. High [acetyl -CoA] also inhibits PDH, reducing pyruvate oxidation i.e. the metabolic fate of pyruvate changes in the liver and kidney on transition from “well-fed” to starved state.
c. Fructose 2,6-bisphosphateFru 2,6-BP is the most potent allosteric effector of PFK-1 and inhibitor of FBPase-1 in liver. It relieves inhibition of PFK-1 by ATP and increases affinity for Fru 6-P. It inhibits FBPase-1 by increasing Km for Fru 1,6-BP.
93

Fig 5.6.10. Reciprocal regulation of glycolysis and gluconeogenesis by Fructose 2,6-bisphosphate .(Source: Nelson and Cox, 2003, p 582 fig 15-23)
The concentration of Fru 2,6-BP in the cell depends on the activity of the bifunctional enzyme, (PFK-2 + FBPase-2) which we encountered earlier in the regulation of glycolysis.
When [blood glucose] is highà ↑ [Fru 6-P]à inhibits FBPase-2 à ↑ [Fru 2,6-BP] à stimulates PFK-1 and inhibits FBPase-1 à hence glycolysis ↑ and gluconeogenesis ↓
The dominance of kinase vs phosphatase activity of the bifunctional enzyme depends on allosteric and hormonal factors.
d. Glucose 6-phosphateAccumulation of glucose 6-P in cells (by decreased activity of PFK-1) causes allosteric inhibition of hexokinase and decreased uptake of glucose in extrahepatic tissues like muscle. The situation is different in the liver where. glucokinase is inhibited by reversible binding of a regulatory protein specific to the liver (refer Fig 5.1.16).
When blood glucose is high, efficiency of GLUT2 transporter ensures that cytosolic glucose levels in the hepatic cells equilibrate with blood levels, glucokinase is freed from inhibition, and Glc 6-P continues to be formed. However, if [blood glucose] falls below optimal levels, Fru 6-P causes binding of the regulatory protein to glucokinase and formation of Glc 6-P is inhibited. This ensures that liver does not compete with other tissues for glucose.
2. Hormonal regulationHormones like glucagon, epinephrine and insulin control the activity of the key enzymes either by covalently modifying them or inducing or repressing their synthesis
GLUCAGON covalently modifies PKA and sets off a chain of reactions that finally increases gluconeogenesis:
On starvation à ↓ [blood glucose] à GLUCAGON secretion ↑ à triggers cAMP-dependent enzyme cascade in hepatic cell à activates PKA à activates FBPase-2 à ↓ [Fru 2,6-BP] à FBPase-1 not inhibited and PFK-1 not stimulatedà hence gluconeogenesis ↑ and glycolysis ↓
The effects of INSULIN are opposite to those of glucagon but the mechanism is not well-defined:
In well-fed state à ↑ [blood glucose] à INSULIN released --à ↑ [Fru 2,6-BP] à strongly stimulates PFK-1; FBPase-1 inhibited à hence glycolysis ↑ and gluconeogenesis ↓
Insulin, which rises on feeding, increases the synthesis of all key enzymes of glycolysis. On the other hand glucagon, epinephrine and glucocorticoids, which rise on starvation, increase the synthesis of gluconeogenic enzymes. A high glucagon/insulin ratio in the blood also increases synthesis of transaminases that in turn affect the availability of gluconeogenic precursors. Both the hormones act via separate signal cascades to affect transcription.
94

SUMMARY 5.6: GLUCONEOGENSISGluconeogenesis is an anabolic process which synthesizes glucose from non-carbohydrate precursors like lactate, alanine, glycerol and pyruvate. The process occurs in the liver when levels of blood glucose are low. Its purpose is to provide glucose as energy fuel to tissue like the RBC where continuous glucose supply is critical.
Gluconeogenesis is essentially a reversal of the steps of glycolysis, with by-pass enzymatic reactions circumventing three energy barriers that prevent easy reversal.
Gluconeogenesis and glycolysis are reciprocally regulated by allosteric and hormonal factors,
Chapter 5 Section 7REGULATION OF BLOOD GLUCOSE
The maintenance of stable levels of blood glucose is an excellent example of homeostasis in our body. The elucidation of the mechanisms of glucose metabolism that enable this steady state, has been an outstanding achievement in biochemistry. The doggedness and brilliant analytical skills with which scientists have worked to understand the pathways and their regulations, are worthy of respect and admiration. No wonder so many of them (Warburg, Meyerhoff, Krebs, the Coris, Sutherland…the list goes on) have been awarded the Nobel Prize!
Fig 5.7.1. Sources of blood glucose (dietary source of glucose has not been shown)(Source: Vander et al, 2001, p 596 fig 18-2)
The sources of glucose in the blood are dietary intake, and hepatic glycogenolysis and gluconeogenesis. All tissues take in glucose from the blood, though the extent to which they
95

depend exclusively on glucose as energy fuel are different. As mentioned earlier, the brain and RBC need continuous and adequate supply of glucose.
The concentration of blood glucose varies before and after meals. In a normal adult, blood glucose levels in the post- absorptive state are maintained between 4.5-5.5 mmol/L. However, a carbohydrate meal can increase these levels to 6.5-7.2 mmol/L (hyperglycemia), while starvation can decrease it to 3.3-3.9 mmol/L (hypoglycemia). Hyperglycemia may also be due to metabolic disorders like diabetes mellitus. Hypoglycemia may be caused by vigorous muscle excercise, pregnancy, or drugs. A sudden drop in the concentration of blood glucose causes convulsions and may be fatal, but a more gradual decrease can enable metabolic adaptations to some extent.
The primary organ in maintaining stable levels of glucose in the blood is the liver. At normal levels of blood glucose, the liver is a net producer of glucose. We have already seen that hepatic glycogenolysis and gluconeogenesis release glucose into the blood, while glycogenesis stores excess glucose as glycogen. As levels of blood glucose rise (as in hepatic portal vein after a meal) the liver switches its enzymatic machinery from production to uptake of glucose. It helps that, unlike extrahepatic tissues, the liver has the requisite glucose transporter for rapid uptake of glucose from the blood when the levels are on the rise. When blood glucose is low, the liver shifts its own metabolism from utilization of glucose for energy to the oxidation of fatty acids. Under conditions of hypoglycemia, the increased use of fatty acids and ketone bodies as energy fuels, also has a “sparing” effect on blood glucose essential to the RBC and neural tissues.
The ability of the liver to adjust its glucose metabolism with the levels of blood glucose, is largely due to the hormones insulin and glucagon. Both hormones are produced by the pancreas; the α-cells of the islets of Langerhans secrete glucagon while the β-cells secrete insulin.
Fig 5.7.2. Relation between the levels of plasma glucose and the secretion of glucagon and insulin.(Source: Vander et al, 2001, p 604 fig 18- 9)
96

Low blood glucose shifts the ratio of [insulin]/[glucagon] in the blood in favor of glucagon, while high blood glucose favors insulin over glucagon. We have already learnt how glucagon stimulates hepatic glycogenolysis and gluconeogenesis in order to boost blood glucose levels. On the other hand, the rise in [insulin] parallels that of [glucose] in the blood, and stimulates hepatic glycogenesis and glycolysis. Additionally, insulin increases entry of glucose into extrahepatic tissues for glycolysis, into muscle cells for glycogenesis, and into adipose tissue for triglyceride synthesis. All these events tend to lower [blood glucose].
Fig 5.7.3. Blood levels of glucose, glucagon and insulin after moderate exercise(Source: Vander et al, 2001 p 607 fig 18-11)
Fig 5.7.4. The activities of hepatic glycogen phosphorylase and glycogen synthase in the liver after infusionof glucose (Source: Berg et al, 2002, fig21.21)
The adrenal catecholamines and glucocorticoids tend to raise levels of blood glucose when there is increased demand for glucose in muscle and other tissues. Epinephrine is secreted by the adrenal medulla, and also by the sympathetic nerve endings, in response to stressful stimuli like fear, excitement, hemorrhage and hypoglycemia. This causes increased glycogenolysis in both muscle and liver.
97

Fig 5.7.5. Interaction between the levels of plasma glucose and the secretion of epinephrine(Source: Vander et al, 2001 p 602 fig 18-10)
Cortisol from the adrenal cortex is permissive to gluconeogenesis. Adenohypophyeal hormones like STH and ACTH are also anti-insulinic in action.
Fig 5.1.6. Comparison of the blood levels of glucose in normal and diabetic
individuals at different time intervalsin a glucose tolerance test . (Source: Murray et al, 2003, p,161 fig19-6)
By now it would be apparent to you that insulin is essential for glucose entry into tissues, as
well as for its storage as glycogen in the liver. The deficiency of insulin causes diabetes mellitus, a disorder with devastating effects throughout the body if left undetected and untreated. High blood levels of glucose between meals and low readings in a “glucose tolerance” test are indicative of the disorder. Drugs are used to stimulate insulin secretion in Type 2 diabetes (NIDDM i.e. non-insulin dependent diabetes mellitus), while insulin per se has to be administered in Type 1 diabetes (IDDM i.e. insulin dependent diabetes mellitus).
98

SUMMARYCarbohydrate metabolism is constituted by anabolic, catabolic and amphibolic pathways, most of which deal with glucose or its metabolic products.
Glycolysis is a major catabolic pathway of glucose which occurs in the cytosol. It provides energy to cells under both aerobic and anarobic conditions. Glucose is degraded to pyruvate, which results in a small yield of ATP under anaerobic conditions, but a much larger yield when processed aerobically. Pyruvate is reduced to lactate under anaerobic conditions, but is oxidatively decarboxylated to acetyl-CoA under aerobic conditions. NADH is also produced in glycolysis. Shuttle systems enable transfer of reduced equivalents to the mitochondrion.
The citric acid cycle is a major amphibolic pathway which occurs in the mitochondrion and accounts for the final oxidation of carbohydrate, lipid and protein. Acetyl-CoA, a common end-product in intermediary metabolism, condenses with oxalacetate and enters the cycle as citrate. In every turn of the cycle, a series of dehydrogenases degrade a citrate molecule, oxidizing two carbon atoms to carbon dioxide and reducing the co-enzymes NAD+ and FAD. OAA is regenerated to continue the cycle. The reduced co-enzymes yield ATP when passed through the electron transport chain.
The hexose monophosphate pathway partially oxidizes glucose in the cytosol. Its main purpose is to reduce NADP+ to NADPH.H+ for fatty acid synthesis in tissues. It also provides ribose for nucleic acid synthesis but does not generate ATP.
Glycogen metabolism occurs primarily in the liver and muscle. It is constituted by two separate pathways viz. glycogenolysis and glycogenesis. Glycogenolysis releases glucose from the glycogen stores in the liver for provision to extrahepatic tissues when blood glucose is low. Glycogenolysis in muscle provides glucose for its immediate energy needs. Glycogenesis synthesizes glycogen from glucose for storage purposes when blood glucose is high. Both processes are strictly regulated so that they do not occur simultaneously.
Gluconeogenesis is an anabolic process in the liver which synthesizes glucose from non-carbohydrate precursors like lactate, alanine, glycerol and pyruvate. The process occurs when levels of blood glucose are low and serves to provide glucose as energy fuel to tissue like the RBC where its requirement is critical. The process is essentially a reversal of the steps of glycolysis, with by-pass enzymatic reactions circumventing those energy barriers that prevent easy reversal. Gluconeogenesis and glycolysis are reciprocally regulated.
The pathways of glucose metabolism are well regulated so that blood levels of glucose are maintained at a steady state.
SUMMARY 5.7: REGULATION OF BLOOD GLUCOSE
All the pathways of glucose metabolism are well regulated to maintain the blood levels of glucose at a steady state.
Dietary and hormonal factors determine the levels of glucose in the blood. The glucose tolerance test enables an assessment of the ability of the body to regulate glucose levels. Hyperglycemia and hypoglycemia are both harmful to the body.
99

Credits for illustrations in Chapter 5
1. Murray, R.K., Granner, D.K., Mayes, P. A. and Rodwell, V.W.: Harper’s Illustrated Biochemistry, 26th edition,
2. International edition, 2003, The McGraw-Hill Companies Inc.
3. Nelson, D.L. and Cox, M.M.: Lehninger’s Principles of Biochemistry, 4th edition, 2005, W.H. Freeman and Co.
4. Voet, D. and Voet, J.G.: Biochemistry, 2nd edition, 1995, John Wiley and Sons, Inc.
5. Berg, J.M., Tymoczko, J.L. and Stryer, L.: Biochemistry, 5th edition, 2002, W.H. Freeman and Co.
6. Lodish, H, Berk, A., Matsudaira, P., Kaiser, C.A., Kreizer, M., Scott, M. and Darnell, J.: Molecular Cell Biology,
7. 5th edition, 2003, W.H. Freeman and Co.
8. Vander, A., Sherman, J. and Luciano, D.: Human Physiology: The Mechanisms of Body Function, 8th edition,
9. 2001, International edition, The McGraw-Hill Companies Inc.
10. Boyer, R.: Concepts in Biochemistry, 1999, Brooks/Cole Publishing Company
11. Hames, B.D. and Hooper, N.M.: Instant Notes Biochemistry, 2nd edition, 2000, BIOS Scientific Publishers Ltd.
100