Biological Characteristics and Fishery Assessment of...
12
16 Marine Fisheries Review Introduction The Alaska plaice, Pleuronectes quadrituberculatus (Fig. 1), is a right- eyed flounder, family Pleuronectidae, and one of four shallow-water flatfishes, along with the yellowfin sole, Pleuro- nectes asper; rock sole, Pleuronectes bilineatus; and flathead sole, Hippo- glossoides elassodon, commonly found in the eastern Bering Sea. They inhabit continental shelf waters of the North Pacific Ocean ranging from the Gulf of Biological Characteristics and Fishery Assessment of Alaska Plaice, Pleuronectes quadrituberculatus, in the Eastern Bering Sea CHANG IK ZHANG, THOMAS K. WILDERBUER, and GARY E. WALTERS Chang Zhang is wih the Pukyong National Uni- versity, Daeyeon-dong, Nam-gu, Pusan 608-737, Korea. Email: [email protected]. Tho- mas Wilderbuer and Gary Walters are with the Alaska Fisheries Science Center, National Marine Fisheries Service, NOAA, 7600 Sand Point Way NE, BIN C15700, Seattle, WA 98115-0070. ABSTRACT—Alaska plaice, Pleuronectes quadrituberculatus, is one of the major flat- fishes in the eastern Bering Sea ecosystem and is most highly concentrated in the shal- low continental shelf of the eastern Bering Sea. Annual commercial catches have ranged from less than 1,000 metric tons (t) in 1963 to 62,000 t in 1988. Alaska plaice is a relatively large flatfish averaging about 32 cm in length and 390 g in weight in com- mercial catches. They are distributed from nearshore waters to a depth of about 100 m in the eastern Bering Sea during summer, but move to deeper continental shelf waters in winter to escape sea ice and cold water temperatures. Being a long-lived species (>30 years), they have a relatively low natu- ral mortality rate estimated at 0.20. Maturing at about age 7, Alaska plaice spawn from April through June on hard sandy substrates of the shelf region, prima- rily around the 100 m isobath. Prey items primarily include polychaetes and other marine worms. In comparison with other flatfish, Alaska plaice and rock sole, Pleuro- nectes bilineatus, have similar diets but dif- ferent habitat preferences with separate areas of peak population density which may minimize interspecific competition. Yellow- fin sole, Pleuronectes asper, while sharing similar habitat, differs from these two spe- cies because of the variety of prey items in its diet. Competition for food resources among the three species appears to be low. The resource has experienced light ex- ploitation since 1963 and is currently in good condition. Based on the results of de- mersal trawl surveys and age-structured analyses, the exploitable biomass increased from 1971 through the mid-1980’s before decreasing to the 1997 level of 500,000 t. The recommended 1998 harvest level, Al- lowable Biological Catch, was calculated from the Baranov catch equation based on the F MSY harvest level and the projected 1997 biomass, resulting in a commercial harvest of 69,000 t, or about 16% of the estimated exploitable biomass. Alaska to the Bering and Chukchi Seas and in Asian waters as far south as the Sea of Japan (Fig. 2) (Pertseva-Ostrou- mova, 1961; Quast and Hall, 1972). The Alaska plaice is a relatively large flounder, with an average length taken in commercial catches of 32 cm (12.6 inches) while the average weight caught is 390 g (0.86 lb.). This corresponds to an age of 7 or 8 years. Moiseev (1953) reported a maximum length of 60 cm (23.6 inches), and ages in excess of 30 years have been determined for fish collected from NMFS Alaska Fisheries Science Center (AFSC) surveys (data on file, AFSC). In this paper, we examine available information on Alaska plaice to provide 1) a detailed description of the life his- tory characteristics of eastern Bering Sea Alaska plaice, including growth and mortality, age at maturation and spawn- ing, and feeding habits and ecological interactions; 2) the history of its exploi- tation and trends in estimated abun- dance; 3) the current condition of the resource and 4) projections of future biomass under various harvest levels. Materials and Methods Information Sources Information for this paper came from both a review of the available literature on the biology of Alaska plaice and from analyses of research and fishing data. Information from the literature was primarily used to describe the dis- tribution and such life history param- eters as age and growth, age at matura- tion and spawning, fecundity, feeding habits, and ecological interactions with other species. Data from AFSC trawl surveys and the fishery were analyzed to describe size composition, size and age at maturity, fecundity at length re- lationships, abundance and biomass by year and age, and annual recruitment. Assessment Methods Resource Assessment Surveys Since 1971, the AFSC has conducted summer bottom-trawl surveys in the eastern Bering Sea to estimate abun- dance and study the biology of impor- tant fish and invertebrate species. In 1975, and annually since 1979, these surveys have covered the major portion
Transcript of Biological Characteristics and Fishery Assessment of...

16 Marine Fisheries Review
Introduction
The Alaska plaice, Pleuronectesquadrituberculatus (Fig. 1), is a right-eyed flounder, family Pleuronectidae,and one of four shallow-water flatfishes,along with the yellowfin sole, Pleuro-nectes asper; rock sole, Pleuronectesbilineatus; and flathead sole, Hippo-glossoides elassodon, commonly foundin the eastern Bering Sea. They inhabitcontinental shelf waters of the NorthPacific Ocean ranging from the Gulf of
Biological Characteristics and Fishery Assessment of Alaska Plaice,Pleuronectes quadrituberculatus , in the Eastern Bering Sea
CHANG IK ZHANG, THOMAS K. WILDERBUER, and GARY E. WALTERS
Chang Zhang is wih the Pukyong National Uni-versity, Daeyeon-dong, Nam-gu, Pusan 608-737,Korea. Email: [email protected]. Tho-mas Wilderbuer and Gary Walters are with theAlaska Fisheries Science Center, National MarineFisheries Service, NOAA, 7600 Sand Point WayNE, BIN C15700, Seattle, WA 98115-0070.
ABSTRACT—Alaska plaice, Pleuronectesquadrituberculatus, is one of the major flat-fishes in the eastern Bering Sea ecosystemand is most highly concentrated in the shal-low continental shelf of the eastern BeringSea. Annual commercial catches haveranged from less than 1,000 metric tons (t)in 1963 to 62,000 t in 1988. Alaska plaiceis a relatively large flatfish averaging about32 cm in length and 390 g in weight in com-mercial catches. They are distributed fromnearshore waters to a depth of about 100 min the eastern Bering Sea during summer,but move to deeper continental shelf watersin winter to escape sea ice and cold watertemperatures. Being a long-lived species(>30 years), they have a relatively low natu-ral mortality rate estimated at 0.20.
Maturing at about age 7, Alaska plaicespawn from April through June on hardsandy substrates of the shelf region, prima-rily around the 100 m isobath. Prey itemsprimarily include polychaetes and othermarine worms. In comparison with other
flatfish, Alaska plaice and rock sole, Pleuro-nectes bilineatus, have similar diets but dif-ferent habitat preferences with separateareas of peak population density which mayminimize interspecific competition. Yellow-fin sole, Pleuronectes asper, while sharingsimilar habitat, differs from these two spe-cies because of the variety of prey items inits diet. Competition for food resourcesamong the three species appears to be low.
The resource has experienced light ex-ploitation since 1963 and is currently ingood condition. Based on the results of de-mersal trawl surveys and age-structuredanalyses, the exploitable biomass increasedfrom 1971 through the mid-1980’s beforedecreasing to the 1997 level of 500,000 t.The recommended 1998 harvest level, Al-lowable Biological Catch, was calculatedfrom the Baranov catch equation based onthe FMSY harvest level and the projected1997 biomass, resulting in a commercialharvest of 69,000 t, or about 16% of theestimated exploitable biomass.
Alaska to the Bering and Chukchi Seasand in Asian waters as far south as theSea of Japan (Fig. 2) (Pertseva-Ostrou-mova, 1961; Quast and Hall, 1972).
The Alaska plaice is a relatively largeflounder, with an average length takenin commercial catches of 32 cm (12.6inches) while the average weight caughtis 390 g (0.86 lb.). This corresponds toan age of 7 or 8 years. Moiseev (1953)reported a maximum length of 60 cm(23.6 inches), and ages in excess of 30years have been determined for fishcollected from NMFS Alaska FisheriesScience Center (AFSC) surveys (dataon file, AFSC).
In this paper, we examine availableinformation on Alaska plaice to provide
1) a detailed description of the life his-tory characteristics of eastern BeringSea Alaska plaice, including growth andmortality, age at maturation and spawn-ing, and feeding habits and ecologicalinteractions; 2) the history of its exploi-tation and trends in estimated abun-dance; 3) the current condition of theresource and 4) projections of futurebiomass under various harvest levels.
Materials and Methods
Information Sources
Information for this paper came fromboth a review of the available literatureon the biology of Alaska plaice andfrom analyses of research and fishingdata. Information from the literaturewas primarily used to describe the dis-tribution and such life history param-eters as age and growth, age at matura-tion and spawning, fecundity, feedinghabits, and ecological interactions withother species. Data from AFSC trawlsurveys and the fishery were analyzedto describe size composition, size andage at maturity, fecundity at length re-lationships, abundance and biomass byyear and age, and annual recruitment.
Assessment Methods
Resource Assessment Surveys
Since 1971, the AFSC has conductedsummer bottom-trawl surveys in theeastern Bering Sea to estimate abun-dance and study the biology of impor-tant fish and invertebrate species. In1975, and annually since 1979, thesesurveys have covered the major portion

60(4), 1998 17
Figure 1.—The Alaska plaice, Pleuronectes quadrituberculatus.
Figure 2.—Overall distribution of Alaska plaice, Pleuronectes quadrituberculatus.
of the continental shelf to lat. 61°N(465,000 km2). The depth range coveredby the standard survey extends fromabout 10 m near the mainland to about
200 m at the shelf break (subareas 1–6in Fig. 3). Although the survey’s pri-mary role is to provide fishery-indepen-dent abundance estimates for manage-
ment purposes, they also provide awealth of biological information on themultispecies complex of fishes that in-habits the eastern Bering Sea.

18 Marine Fisheries Review
Figure 3.—Summer distribution and relative abundance in kg/ha of Alaska pla-ice from the 1997 eastern Bering Sea bottom trawl survey. Depth contours andstatistical subareas are indicated.
The standard survey area on the shelfis divided into a grid with 37 × 37 kmblocks (20 × 20 n.mi.) containing a sam-pling location at the center of each gridblock. In areas of special interest, thecorners of the blocks have also beensampled. The sampling gear is a stan-dard AFSC eastern otter trawl with a25.3 m headrope and 34.1 m footrope.Otter doors are 1.8 × 2.7 m and weighabout 800 kg each. At each samplingsite the trawl is towed for 0.5 h at aspeed of 5.6 km/h. The operating widthbetween the wings varied from about10 to 18 m as a function of the amountof trawl warp payed out and thereforeindirectly as a function of depth. Theoperating trawl height varied from 2 to 3m as determined from net mensuration.Due to the relatively flat, unobstructedbottom on the shelf, the trawl is operatedwithout roller gear. To improve the catchesof invertebrates, the trawl was rigged todig slightly into the bottom.
Estimates of biomass and populationare made using the “area swept” methoddescribed by Wakabayashi et al. (1985).The mean catch per unit of effort(CPUE) of a group of tows of knownarea swept is expanded to estimate thebiomass within the total area of a stra-tum (Armistead and Nichol, 1993). Thearea swept is considered to be the prod-uct of the operating net width between
the wings and the distance fished. Thepotential herding effect of the doors anddandylines is unknown for Alaska pla-ice, as is escapement under the footrope.
Age-structured Analyses
Biomass-based cohort analysis, afterZhang and Sullivan (1988), were ap-plied to Alaska plaice catch at age datafrom 1971 to 1995 by Wilderbuer andZhang (In press). This method assumesknife-edge recruitment with equal avail-ability for all recruited ages and con-stant natural mortality over all ages andyears. The input terminal fishing mor-tality values were estimated using thefollowing formula:
FC
B9595
95
= ,
where B95 is the 1995 trawl survey bio-mass estimate, and C95 is the 1995 catchin weight. The second run of the analy-sis was conducted using the tuned ter-minal fishing mortality values, whichwere tuned to different ratios of meanfishing mortalities by age and by year.
Wilderbuer and Zhang (In press) alsoincorporated age composition informa-tion from a variety of sources into astock synthesis model (Methot, 1990)for Alaska plaice. Stock synthesis func-tions by simulating the dynamics of the
population and the process by which thepopulation is observed. The simulationincorporates bias and imprecision in theobservations and is used to predict ex-pected values for the observations. Theexpected values are compared to theactual observations (data) from the sur-veys and fisheries.
The biomass-based approach to theproduction model (Zhang, 1987; Zhanget al., 1991) was also utilized to ana-lyze biomass and fishing mortality andto provide estimates of the importantmanagement parameters MSY, BMSYand FMSY . The model was used toproject the future biomass of the Alaskaplaice stock and catch under various Flevels, including the current F level.
Optimal Fishing Mortalityand Age at First Capture
Yield per recruit analysis was per-formed using the Beverton and Holt(1957) model to estimate the optimalfishing mortality and age at first cap-ture. Age at first capture (tc) was variedfrom 1.0 to 10.0 and the annual instan-taneous rate of fishing mortality wasvaried from 0.01 to 0.30.
History of Exploitation
Groundfish species in the easternBering Sea were first exploited com-mercially by Japan, initially by explor-atory vessels in 1930 and then by amothership-catcher boat operation inBristol Bay in 1933–37 and 1940–41(Forrester et al., 1978). From 1933 to1937, walleye pollock, Theragarachalcogramma, and various flounders(family Pleuronectidae) were reduced tofish meal, and annual Japanese catchespeaked at 43,000 metric tons (t). During1940–41, the fishery targeted on yellow-fin sole, Pleuronectes asper, for humanconsumption, and catches ranged from9,600 to 12,000 t (Forrester et al., 1978).
After World War II, Japanese distant-water fleets resumed operations in theeastern Bering Sea, with mothershipsand independent trawlers targeting yel-lowfin sole in 1954. In 1958 theU.S.S.R. also entered the fishery, fol-lowed by other nations in later years.
Catch statistics for Alaska plaice can-not be precise for the earlier years be-cause the species was often included in

60(4), 1998 19
Table 1.—Annual catches of Alaska plaice in metric tons (t) by fishing nation in the eastern Bering Sea, 1963–97.
Catch (t)
Year Japan U.S.S.R. ROK Other Joint Venture Domestic U.S. Total
1963 233 746 0 0 0 0 9791964 808 1,085 0 0 0 0 1,8931965 484 516 0 0 0 0 1,0001966 2,054 2,579 0 0 0 0 4,6331967 1,339 2,513 0 0 0 0 3,8521968 1,233 1,396 0 0 0 0 2,6291969 3,127 3,815 0 0 0 0 6,9421970 1,356 2,125 0 0 0 0 3,4811971 533 490 0 0 0 0 1,0231972 191 139 0 0 0 0 3301973 1,136 40 0 0 0 0 1,1761974 2,168 220 0 0 0 0 2,3881975 2,408 84 0 0 0 0 2,4921976 3,518 102 0 0 0 0 3,6201977 2,589 0 0 0 0 0 2,5891978 5,204 5,216 0 0 0 0 10,4201979 3,767 9,896 9 0 0 0 13,6721980 3,810 0 2,978 120 0 0 6,9081981 7,298 0 1,315 40 0 0 8,6531982 5,451 0 1,144 216 0 0 6,8111983 5,790 0 3,126 1,850 0 0 10,7661984 10,405 1,573 4,012 2,992 0 0 18,9821985 5,702 265 4,833 14,088 0 0 24,88819861 46,519 0 0 46,51919871 18,567 0 0 18,5671988 0 0 0 0 61,638 0 61,6381989 0 0 0 0 13,883 0 13,8831990 0 0 0 0 6,080 0 6,0801991 0 0 0 0 0 18,029 18,0291992 0 0 0 0 0 18,895 18,8951993 0 0 0 0 0 14,536 14,5361994 0 0 0 0 0 9,277 9,2771995 0 0 0 0 0 13,343 13,3431996 0 0 0 0 0 16,106 16,1061997 0 0 0 0 0 19,829 19,829
1Catch of Alaska plaice by nation is presently unavailable.
the “other flatfish” category. Catchcomposition data improved in lateryears, particularly after implementationof the Magnuson Fishery Conservationand Management Act of 1976 (MFCMA)which established the foreign fisheryobserver program. The Alaska plaicecatch (Table 1) was low until the resump-tion of the U.S.S.R. fishery in 1978 andonset of the harvests by the Republic ofKorea and other nations in 1980.
Alaska plaice share similar habitatsand distributions with yellowfin soleand are taken as bycatch with that spe-cies. Yellowfin sole were intensely har-vested by distant-water fleets from Ja-pan and the U.S.S.R. in the early 1960’swith a peak catch of 554,000 t in 1961.High exploitation during the 4-year pe-riod from 1959 to 1962 caused thepopulation to decline which was re-flected in the reduced harvest over thefollowing two decades (Wilderbuer etal., 1992). From 1963 to 1971, however,yellowfin sole annual catches still av-eraged 117,800 t. Given the similarityof the distributions, the yellowfin solefishery probably removed a significantportion of the Alaska plaice populationthrough bycatch. Catches for the period1963–71 in Table 1, therefore, are likelyunderestimated.
After the cessation of foreign fishingin 1987, the Alaska plaice harvestpeaked at over 61,000 t during U.S.joint-venture fisheries in 1988. Catchestherafter have been made by the U.S.domestic fishery, with an annual aver-age of 14,800 t. Based on results of co-hort analysis and stock synthesis analy-sis, the stock has been lightly harvested,with an average exploitation rate of lessthan 5% since 1971 (Wilderbuer andZhang, In press).
Biological Characteristics
Distribution and Migration
The summer distribution of Alaskaplaice in the eastern Bering Sea is al-most entirely restricted to depths of lessthan 110 m, with major concentrationsbetween 40 and 100 m on the centraland northern Bering Sea shelf (Fig. 3).Fish >25 cm predominate in the sampledpopulation between 20 and 110 m.Larger fish generally prefer such deeper
waters (Bakkala et al., 1985), while ju-veniles (< 20 cm) occupy shallowercoastal waters (Wakabayashi, 1972).This difference in depth preference pro-vides a buffer between the juvenile andadult populations. Annual AFSC trawlsurveys also indicate a summertimesexual segregation: female catch ratesare greatest at depths > 60 m, while thehighest catch rates for males occur at45–55 m depths.
Fadeev (1965) suggests that Alaskaplaice live year round on the shelf andmove seasonally within its limits. Wa-ter temperatures may influence the sea-sonal movements and subsequent distri-bution on the shelf. Alaska plaice main-tain a more westerly wintertime distribu-tion (Fig. 4), possibly to avoid the coldbottom water temperatures that exist overthe eastern Bering Sea shelf during win-ter. However, the extent of ice coveragemay be limiting the distribution of fish-ing effort which is used to discern thewintertime distribution; restricting ourknowledge of their seasonal distribution.
Alaska plaice are rarely encounteredon the slope during the winter. They
may reach the outer shelf in winter to-gether with yellowfin sole, as was ob-served during spring 1976, but they gen-erally prefer shallow water. Althoughthis species distribution overlaps withrock sole, Pleuronectes bilineata, andyellowfin sole, the center of abundanceof Alaska plaice is located to the northof the other species.
Early Life History
The eggs and larvae of Alaska plaiceare pelagic and transparent, with eggdiameter ranging from 1.9 to 2.05 mm(Musienko, 1963; Waldron, 1981; Mata-rese et al., 1989). Pertseva-Ostroumova(1961) described the embryonic and lar-val development of Alaska plaice fromthe west coast of Kamchatka and re-ported that artificially fertilized eggs,incubated at an average temperature of6°C, hatched in 15.5–18 days. Eggsdeveloping under natural conditions(–1.5°–6.7°C) may have a longer incu-bation period.
Little is known about the distributionof Alaska plaice eggs. The available datasuggests the eggs are widely distributed

20 Marine Fisheries Review
Figure 4.—Winter distribution of Alaska plaice determined from fishery sam-pling, 1978–96.
over the continental shelf of the BeringSea and have been found in varyingdensities and spatial concentrationsamong the years sampled (Table 2).Spawning is believed to occur duringMarch–April, and eggs are found fromApril to early summer.
Upon hatching, Alaska plaice larvaeare apparently more developed thanother flounders. The larvae are rela-tively large at hatching (5.85 mm) andhave advanced body differentiation andeye pigmentation, which may be an ad-aptation to development at high lati-tudes and low temperatures (Pertseva-Ostroumova, 1961). Small larvae aremainly found in the surface layer, al-though they occasionally are caught asdeep as 120 m. The yolk sac, rangingfrom 0.68 to 1.5 mm long and 0.32 to0.60 mm high, is absorbed when thelarvae are about 6.0–7.5 mm in length.Although the length at which metamor-phosis occurs is unknown, young lar-vae of Alaska plaice appear to becomedemersal at a length of about 13–17 mm(Pertseva-Ostroumova 1961).
Growth and Mortality
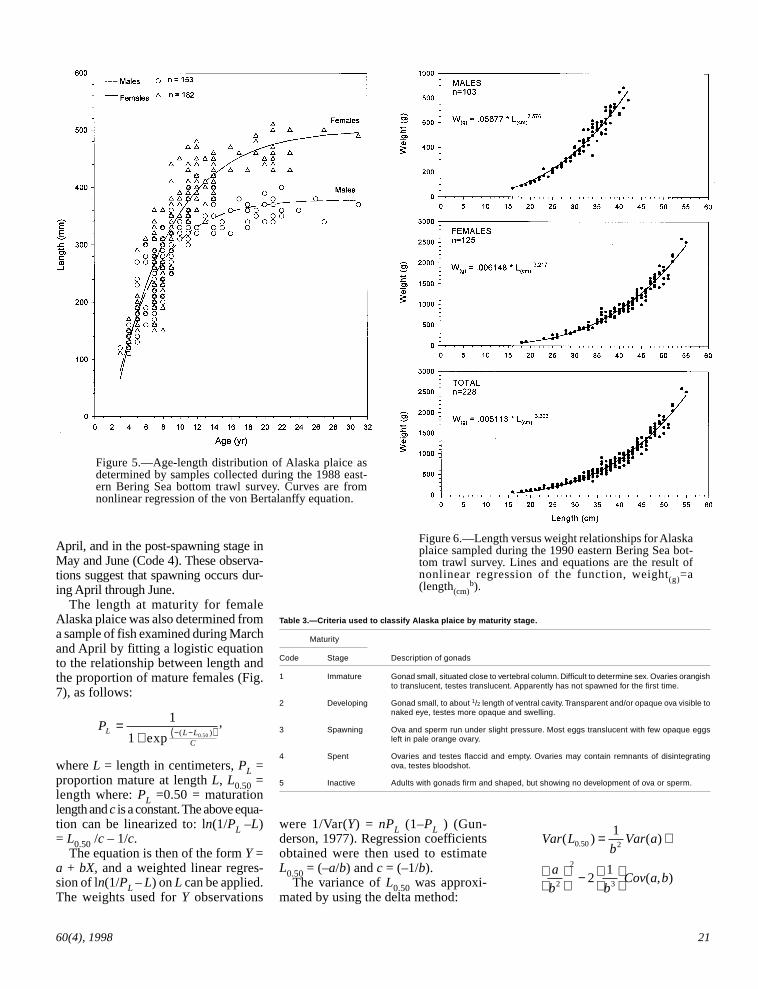
Alaska plaice is a slow-growing long-lived species, typical of eastern BeringSea shelf flatfish. Age and growth stud-ies have been conducted by Mosher(1954), Weber and Shippen (1975),Bakkala et al. (1985), and Zhang(1987), based on an examination ofotoliths. Male and female fish have beenaged up to 31 years, and ages greaterthan 25 are not uncommon for fish intrawl survey catches. Length-at-age issimilar for males and females untilabout ages 8–10 (30–32 cm) when malegrowth slows with the onset of sexualmaturity (Fig. 5). It is not knownwhether differential growth by geo-graphic region occurs on the eastern
Table 2.—Summary of Alaska plaice egg distribution information from results of ichthyoplankton surveys conducted in the eastern Bering Sea.
Authority Time period Method Findings
Waldron and Favorite (1977) April–May 1976 Bongo and neuston nets
Waldron and Vinter1 (1978) May 1977 Bongo and neuston nets
Waldron (1981) 1955–79 Bongo and neuston nets
1 Waldron, K. D., and B. M. Vinter. 1978. Ichthyoplankton of the eastern Bering Sea. U.S. Dep. Commer., NOAA, Natl. Mar. Fish. Serv., Seattle, Wash., NWFC Processed Rep., 88 p.
Eggs widely distributed with centers of abundance near the outer Alaska Peninsula,east of the Pribilof Islands, outer Bristol Bay and northwest of the Pribilof Islands
Eggs comprised 28% of bongo samples and 72% of the neuston net samples at 64locations. Eggs had a wide distribution over the Bering Sea shelf.
Eggs were widely distributed from lat. 55°N off Unimak Island to lat. 59.5°N nearNunivak Island and from long. 159°W in Bristol Bay to long. 175°W near the shelfedge.
Bering Sea shelf. Parameters for the vonBertalanffy equation from age struc-tures collected in 1988 are as follows:
L∞ (mm) t0 K
Males 379.2 1.83 0.204Females 501.7 2.09 0.156
Values of K are low for both sexes, in-dicative of slow growth. It is expected thatthe natural mortality rate (M) of such aslow-growing, long-lived species wouldalso be relatively low. Estimates of Mrange from 0.195 to 0.22 for Alaska pla-ice (Wilderbuer and Zhang, In press).Natural mortality is likely close to 0.2,which is the value used in age-structuredmodeling of the eastern Bering Sea popu-lation (Wilderbuer and Walters, 1997).
The length-weight relationships formales and females from the 1990 sur-vey are shown in Figure 6. The param-
eters for the relationship, weight ingrams = a(length in cm)b are:
a b
Males .05677 2.576Females .006148 3.217
Although the length-weight relation-ships for males and females are simi-lar, Zhang (1987), using data collectedduring the 1975 AFSC survey, reportedthat large females (> 26 cm) were up to7% heavier than males of the same size.
Maturation and Spawning
During 1986–87, female Alaska plaicetaken by the commercial fishery wereclassified as to maturity state by U.S. ob-servers using the criteria presented inTable 3. Most of the females examinedwere in the developing stage (Code 2) inMarch, in the spawning stage (Code 3) in
60(4), 1998 21
Figure 5.—Age-length distribution of Alaska plaice asdetermined by samples collected during the 1988 east-ern Bering Sea bottom trawl survey. Curves are fromnonlinear regression of the von Bertalanffy equation.
Figure 6.—Length versus weight relationships for Alaskaplaice sampled during the 1990 eastern Bering Sea bot-tom trawl survey. Lines and equations are the result ofnonlinear regression of the function, weight(g)=a(length(cm)
b).
Table 3.—Criteria used to classify Alaska plaice by maturity stage.
Maturity
Code Stage Description of gonads
1 Immature Gonad small, situated close to vertebral column. Difficult to determine sex. Ovaries orangishto translucent, testes translucent. Apparently has not spawned for the first time.
2 Developing Gonad small, to about 1/2 length of ventral cavity. Transparent and/or opaque ova visible tonaked eye, testes more opaque and swelling.
3 Spawning Ova and sperm run under slight pressure. Most eggs translucent with few opaque eggsleft in pale orange ovary.
4 Spent Ovaries and testes flaccid and empty. Ovaries may contain remnants of disintegratingova, testes bloodshot.
5 Inactive Adults with gonads firm and shaped, but showing no development of ova or sperm.
April, and in the post-spawning stage inMay and June (Code 4). These observa-tions suggest that spawning occurs dur-ing April through June.
The length at maturity for femaleAlaska plaice was also determined froma sample of fish examined during Marchand April by fitting a logistic equationto the relationship between length andthe proportion of mature females (Fig.7), as follows:
PL L LC
=+ − −( )
1
1 0 50exp,
( ).
where L = length in centimeters, PL =proportion mature at length L, L0.50 =length where: PL =0.50 = maturationlength and c is a constant. The above equa-tion can be linearized to: ln(1/PL –L)= L0.50 /c – 1/c.
The equation is then of the form Y =a + bX, and a weighted linear regres-sion of ln(1/PL – L) on L can be applied.The weights used for Y observations
were 1/Var(Y) = nPL (1–PL ) (Gun-derson, 1977). Regression coefficientsobtained were then used to estimateL0.50 = (–a/b) and c = (–1/b).
The variance of L0.50 was approxi-mated by using the delta method:
Var Lb
Var a
a
b bCov a b
( ) ( )
( , )
.0 50 2
2
2
3
1
21
= +
−

22 Marine Fisheries Review
Figure 7.—Length-maturity relationship of Alaska plaicein the eastern Bering Sea, based on data collected by U.S.observers from the fishery.
The parameter estimates for the pro-portion mature at length, predictedlength at 50% maturity L(0.50) andstandard errors for L0.50 are presentedin Table 4. The estimated L0.50 was 32cm from collections made in March and28 cm from April. The combined valuewas 31 cm, which corresponds to an ageof 6 to 7 years. Pertseva-Ostroumova(1961) reports that Alaska plaice fromAsian waters reach sexual maturity at4–6 years corresponding to a length of20–21 cm. This may indicate a smallersize at maturity in Asian waters than inthe eastern Bering Sea. However, it isdifficult to suggest the existence of dif-ferences in age at maturity by area, sincethere is a large temporal difference inthe collection times of the two samples.
Fecundity estimates (Fadeev, 1965)from the southeastern Bering Sea indi-cate female fish produce an average of56,000 eggs at lengths of 28–30 cm, and313,000 eggs at lengths of 48–50 cm(Table 5). Fertilization is external.Spawning of Alaska plaice is reportedto occur over a 2–3 month period dur-ing the spring on hard sandy substratesof the shelf region, primarily around the100 m isobath within a range of 75–150
Table 4.—Estimates of parameters for the logistic equa-tion of the relationship between length and the pro-portion of mature female Alaska plaice in the easternBering Sea. Predicted length at maturity ( L0.50) and thestandard error for L0.50 are also shown.
Sample Proportion L0.50 S.E. L0.50month mature (cm) (cm)
March 0.5379 31.9985 0.2827April 0.4418 27.9005 7.3571Combined 0.4300 30.8013 0.3012
Table 5.—Fecundity of Alaska plaice in the southeast-ern Bering Sea from a sample of 47 fish (Fadeev, 1965).
Length (cm) Fecundity (× 1,000)
28.1–30.0 56.330.1–32.0 93.234.1–36.0 127.236.1–38.0 159.538.1–40.0 161.840.1–42.0 183.042.1–44.0 268.544.1–46.0 280.846.1–48.0 289.348.1–50.0 312.6
1 Waldron, K. D., and B. M. Vinter. 1978.Ichthyoplankton of the eastern Bering Sea. U.S.Dep. Commer., NOAA, Natl. Mar. Fish. Serv.,Seattle, Wash., NWAFC Processed Rep. (unnum-bered: Final Rep. (RU 380)), 88 p.
m (Pertseva-Ostroumova, 1961). Theannual spawning period may vary bothtemporally and spatially due to thevariations in hydrological conditions. Inthe Bering Sea, Musienko (1970) re-ported that spawning apparently startsin early spring immediately after the icemelts (early May) and continues untilmid-June. He also found that peakspawning in this region occurs at watertemperatures ranging from –1.53° to4.11°C and salinities ranging from29.8‰ to 34‰ on the seafloor and 32‰to 32.8‰ at the surface. Alaska Fisher-ies Science Center observations on theduration and timing of spawning gen-erally agree with those of Pertseva-Ostroumova (1961) and Musienko(1970), although the AFSC data suggestthat peak spawning may occur in April.
Observations from egg and larvalsurveys, however, indicate spawningmay occur as late as June (Waldron andVinter1). This variation in the time ofspawning may result from variations in
hydrographic conditions as suggestedby Pertseva-Ostroumova (1961).
Alaska plaice do not aggregate forspawning but spawn over a wide area ofthe middle shelf. Northeasterly surfacecurrents move the eggs to shallower wa-ters of Bristol Bay and other coastal ar-eas of the Alaska mainland where youngplaice apparently live until they grow toabout 20 cm in length. Eggs may also driftfrom the eastern Bering Sea to theChukchi Sea through the Bering Strait. Astrong current runs northward from theBering Sea through the Bering Strait andinto the southeastern Chukchi Sea (Pruterand Alverson, 1962). Current speeds of0.25–0.50 m/sec have been reported fromthe surface to within a few meters of thebottom in the eastern Chukchi Sea andalong the Alaska coast during summer(Fleming et al.2). Alaska plaice length fre-quency distributions collected from theChukchi Sea in 1977, were comprisedmostly of juveniles ranging from 10 to20 cm in length although some were aslarge as 40 cm (12 years) (Wolotira et al.3).
2 Fleming, R. H. 1959. Oceanographic survey ofthe Chukchi Sea 1 August to 2 September 1959.Preliminary report of Brown Bear cruise No. 268.Univ. Wash., Dep. Oceanogr., Seattle, Mimeogr.Rep. 59-30:1-14.3 Wolotira, R. J., Jr., T. M. Sample, and M. Morin,Jr. 1977. Demersal fish and shellfish resourcesof Norton Sound, the southeastern Chukchi Sea,and adjacent waters in the baseline year 1976. U.S.Dep. Commer., NOAA, Natl. Mar. Fish. Serv.,NWAFC Processed Rep. (unnumbered), 292 p.

60(4), 1998 23
Feeding and Ecological Interactions
Food habits of Alaska plaice in theeastern Bering Sea have been studiedby Moiseev (1953), Skalkin (1963),Mineva (1964), Feder (1977, 1978),Zhang (1987, 1988), Lang (1992), Langet al. (1995), and Allen (19844,5).Skalkin (1963), Zhang (1987, 1988),Lang (1992), Lang et al. (1995), andAllen4 also studied trophic interactionsamong Alaska plaice, yellowfin sole, androck sole which share a similar habitat andhave overlapping distributions.
According to Zhang (1987), thestomach fullness of Alaska plaice waslowest after midnight (0300 to 0600 h),suggesting that feeding does not occurat night. Stomach fullness was greatestin the afternoon (1500 to 1800 h) indi-cating that feeding seems to be activeduring daytime, primarily on polycha-etes and amphipods regardless of sexand size.
Table 6 shows prey items of Alaskaplaice in the Bering Sea. Skalkin (1963)found that the major food items ofAlaska plaice in the southeastern BeringSea were benthic crustaceans, mollusks,and polychaetes. All three major foodtypes were not found to occur in stom-ach contents at the same time. Rather, thediet often consisted of polychaetes andmollusks or only one of the three groups.
Mineva (1964) examined 190 stom-achs of Alaska plaice in the eastern
4 Allen, M. J. 1984. Functional organization ofdemersal fish communities of the eastern BeringSea. Unpubl. manuscr. on file at U.S. Dep.Commer., NOAA, Natl. Mar. Fish. Serv., North-west Alaska Fish. Cent., 7600 Sand Point Way,N.E. Seattle, WA 98115.5 Allen, M. J. 1984. Niche segregation ofnearshore soft-bottom fishes in a subarctic,warm-temperature, and tropical environment.Unpubl. manuscr. On file at U.S. Dep. Commer.,NOAA, Natl. Mar. Fish. Serv., Northwest AlaskaFish. Cent., 7600 Sand Point Way, N.E. Seattle,WA 98115.
Table 6.—Prey diets of Alaska plaice in the Bering Sea.
Authority Bering Sea area Major food items
Skalkin (1963) Southeastern Benthic crustaceans, mollusks, polychaetes
Mineva (1964) Eastern Bivalves, gastropods, polychaetes
Feder (1977, 1978) Eastern Polychaetes, bivalves, amphipods, nemerteans
Allen1 (1984) Southeastern Benthopelagic, epifaunal, sessil infaunal preys
Zhang (1987) Eastern Polychaetes, amphipods, Echiura, Sipuncula
Lang (1992) Eastern Polychaetes, amphipods, bivalves, decapods
1Text footnote 4.
Bering Sea and found the followingimportant prey items: bivalves such asYoldia hyperborea, Y. johanni, andMacoma calcarea; gastropods such asCylichna alba; polychaetes such asSternaspia scutata, and Scalibregmasp.; Nephtydae; Terebellidae; amphi-pods; and ophiuroids. Other Bering Seastudies (Feder, 1977, 1978) also foundpolychaetes, bivalves, amphipods, andnemerteans to be major food items forAlaska plaice. Allen4 examined thestomach contents of Alaska plaice onthe southeastern Bering Sea shelf in 1982,and found benthopelagic, epifaunal, andsessil infaunal prey in the stomachs.
Lang (1992) intensively studied thefood habits of Alaska plaice from asample of 513 stomachs, 64 of whichwere empty and 449 contained food. Hefound that polychaeta prey was the mostcommonly occurring prey group, how-ever, gammarid amphipods were alsoquite common. The other prey itemswere bivalves, marine worms, decapodsand echinoderms (Table 7).
Zhang (1987) found that the patternof food consumption by size group wasvery similar, with the most importantprey being polychaetes (75.2% for fish>30 cm and 63.3% for fish <30 cm).The next most important items wereamphipods (6.7%) and Echiura (5.7%)for the >30 cm group, and Sipuncula(21.7%) and amphipods (11.6%) for the<30 cm group. Fish were only found inthe stomachs of the >30 cm group, usu-ally in small amounts.
To examine diet overlap amongAlaska plaice, yellowfin sole, and rocksole, Zhang (1987) used Schoener’s(1970) index of dietary overlap to com-pare the similarity of their diets for twotaxonomic levels of prey (the lowesttaxonomic level and the phylum level,Table 8). The analysis indicated that dietoverlap between the three species was
Table 8.—Results of Schoener’s index of diet overlap(Schoener, 1970) between Alaska plaice, yellowfin sole,and rock sole of the eastern Bering Sea. Values werecalculated for the lowest possible prey taxonomic leveland at the phylum level.
Species Yellowfin sole Rock sole
Lowest taxonomic levelAlaska plaice 0.127 0.299Yellowfin sole 0.154
Phylum levelAlaska plaice 0.313 0.787Yellowfin sole 0.517
Table 7.—Polled prey diet and Index of Relative Im-portance (IRI) of Alaska plaice in the eastern BeringSea (Lang 1992).
Frequencyof occurrence Numbers Weight
Prey taxa (%) (%) (%) IRI
Polychaeta 90.4 25.6 60.9 78.2
Bivalvia 37.0 5.5 5.8 4.2
Amphipoda(Gammarida) 70.2 50.0 3.1 37.2
Decapoda 4.7 0.3 0.2 0.02
Marine worms 47.7 11.3 29.0 19.2
Echinodermata 12.7 1.0 0.2 0.2
Fish 1.1 0.05 0.1 0.002
Miscellaneous 25.4 6.3 0.7 1.8
less than 0.3 for the lowest taxonomiclevel but as high as 0.8 at the phylumlevel. The highest values were obtainedin comparisons between Alaska plaiceand rock sole (C(x,y) = 0.299 at the low-est possible taxonomic level but wasrelatively high (C(x,y) = 0.787) at thephylum level). The most importantcommon prey of the two species waspolychaetes but the prey species of sec-ondary importance differed; Echiura forAlaska plaice and amphipods, Echiuraand Echinodermata for rock sole. Thediet of yellowfin sole was different fromthese two species with amphipods andEchinodermata as the most importantprey item. Overall, there was less over-lap in the diet between Alaska plaiceand yellowfin sole than between rocksole and yellowfin sole.
Skalkin (1963) stated that the degreeof food similarity between Alaska pla-ice and yellowfin sole caught in thesame trawl was more than 50%. He alsofound an unusually high degree of foodsimilarity between Alaska plaice androck sole due to the consumption ofpolychaetes. Allen5 hypothesized that,on the ecological segregation amongspecies of fish, competitive species havethe same spatial distribution (habitat)

24 Marine Fisheries Review
and foraging behavior (niche), whilenoncompetitive species have either dif-ferent feeding behavior or spatial dis-tribution. Evidence presented for thethree flatfish species considered herewould tend to support the hypothesisthat these species are not competitive.Schoener’s index of diet overlap washighest between Alaska plaice and rock
Figure 8a.—Comparison of the distribution and abundance for Alaska plaice (white) and rock sole (dark) from the 1996trawl survey.
Figure 8b.—Comparison of the distribution and abundance for Alaska plaice (white) and yellowfin sole (dark) from the1996 trawl survey.
sole which have the most dissimilar dis-tribution and lowest for Alaska plaiceand yellowfin sole which have similardistributions.
Lang et al. (1995) also examined foodhabits of the three congeneric flatfishesin the eastern Bering Sea and deter-mined that Alaska plaice exhibited thenarrowest diet selection, consisting pri-
marily of polychaetes and other worms.This supports Zhang’s hypothesis(Zhang, 1987) that the diets of Alaskaplaice and rock sole are similar due totheir reliance upon polychaetes, whileyellowfin sole differed from the twospecies due to the variety of prey items,and their areas of highest abundance arespatially separate (Fig. 8). Thus, com-

60(4), 1998 25
petition for similar prey items amongspecies appeared low. In conclusion,food competition seems to be negligibleamong the shallow-water flatfish spe-cies inhabiting the eastern Bering Seadue to differences in food spectra orspatial distribution. We hypothesize thatthe abundance and distribution ofAlaska plaice may be less than that ofyellowfin sole, because Alaska plaiceare more specialized in terms of theirfood habits.
Fluctuations in Abundance
Annual Changes inPopulation Biomass
The annual estimates of biomassfrom two age-structured models (Fig.9) indicate a continuous increase inabundance from 1971 through the mid-1980’s and a declining level of abun-dance thereafter (Wilderbuer andZhang, In press). The stock synthesismodel estimates indicate that the popu-lation biomass increased steadily from1971, peaking in 1984 at over 947,000t. The population has been in declinesince, and the biomass is currently esti-mated to be only 50% of the peak level.The biomass-based approach to cohortanalysis similarly estimates a prolongedperiod of increasing biomass since 1971peaking in 1988 at 850,000 t and de-clining thereafter to 50% of the maxi-mum level by 1995. Compared to thebiomass-based cohort analysis model,synthesis estimates suggest a higher bio-mass from 1971 to 1987. The two mod-els show close agreement for 1987–93.
The annual bottom trawl survey es-timates indicate an increase in biomassfrom 1975 through 1984 and a stabletrend during 1985–97 at levels rangingfrom 515,000 t to 700,000 t (Table 9).Due to the large amount of variabilityassociated with the trawl survey pointestimates, the trawl surveys do not de-tect the declining trend in the populationbiomass since the mid-1980’s estimatedby the two age-structured models.
Recruitment Strengths
Estimates of age 6 recruitment fromthe two age-structured models corrobo-rate the observed population increaseand subsequent decline during a period
Figure 9.—Biomass estimates for eastern Bering Sea Alaska plaice from biom-ass-based cohort analysis, stock synthesis, and annual bottom trawl surveys.
Figure 10.—Year-class strength at age 6 for Alaska plaice as estimated by bio-mass-based cohort analysis and stock synthesis.
Table 9.—Estimated biomass and 95% confidence in-tervals of Alaska plaice from U.S. bottom trawl surveysin 1975 and 1979–97.
Year Biomass (t) 95% Confidence intervals
1975 103,500 82,989–124,1051979 277,200 191,893–362,5041980 354,000 288,224–423,7061981 535,800 409,912–661,7421982 715,400 587,034–843,7831983 743,000 614,060–871,8871984 789,200 560,625–1,017,7351985 580,000 457,966–701,9901986 553,900 383,587–724,2121987 564,400 409,133–719,5721988 699,400 309,641–1,089,1391989 534,000 372,787–695,1831990 522,800 386,807–658,7751991 529,100 393,436–664,7031992 530,400 378,004–682,8711993 515,200 377,428–652,9541994 623,100 479,130–767,0281995 552,300 380,524–724,0601996 529,300 344,200–714,4001997 643,400 498,000–788,300
of light exploitation (Fig. 10). Estimatessince 1989 suggest a lack of good re-cruitment relative to the consistentlystrong recruitment estimated from the
1970’s and 1980’s which provided thepopulation increase. Synthesis modelrecruitment estimates from the 1971–77 period were higher than those fromthe biomass-based model, resulting inthe higher biomass estimates observedin the 1970’s and early 1980’s (Fig. 9).The population has declined as the largeyear classes, which recruited at age 6prior to 1988, are now older than theage where they maximize their cohortbiomass. The lack of recruitment to thefishable biomass in subsequent years hascontributed to the population decline.
Current Managementand Estimation of Yield
Maximum Sustainable Yield
Estimates of MSY are 54,300 t basedon the biomass-based productionmodel. The stock biomass that wouldprovide this long-term yield (BMSY) is

26 Marine Fisheries Review
Figure 11.—Projections of estimated biomass for Alaska plaice from 1995 to2014 using Zhang’s difference equation under different harvest strategies.
estimated at 280,000 t, well below thecurrent biomass estimate of over400,000 t. The instantaneous rate offishing mortality for MSY (FMSY) wasestimated at 0.194, much higher than theaverage F of less than 0.05 since 1971.
ABC for 1998
Alaska plaice of the eastern BeringSea are managed under the jurisdictionof the North Pacific Fishery Manage-ment Council (NPFMC). Each year theNPFMC determines the total allowablecatch (catch quota) for each manage-ment species derived from the Accept-able Biological Catch (ABC). The ABCcurrently used is based on Amendment44 to the fisheries management plansfor the Bering Sea/Aleutian Islands re-gion and the Gulf of Alaska. These regu-lations set ABC commensurate upon theamount of reliable information avail-able for the current biomass, the man-agement parameters BMSY, FMSY, F0.30,and F0.40 and the relationship betweenthe current biomass and BMSY (Clark,1991).
The ABC for the 1998 fishing sea-son, according to present managementguidelines, can be calculated with thefollowing considerations. Since reliableestimates of initial 1998 biomass, BMSY,FMSY, F0.35, and F0.40 exist and the stocksize at the beginning of 1998 is pro-jected to be about 430,000 t (which isabove BMSY) using F levels for 1996 and
1997 of 0.05, ABC can be calculated asfollows:
ABC F BZ
eMSYz= − −
98
11( ),
where B98 is the initial 1998 biomassestimated by the projection of the bio-mass-based approach to the productionmodel, FMSY = 0.194, and natural mor-tality = 0.2. This results in an ABC =68,900 t which is higher than MSY(54,300 t) since the stock condition ispresently above BMSY.
Biomass Projections
Alaska plaice biomass through the year2025 was projected using the biomass-based approach to the production modelfor six different F regimes ranging from0.05–0.30 (Fig. 11). Under the optimumF level (FMSY = 0.194) the biomass wasprojected to remain stable at 280,000 t(BMSY). Biomass levels as low as200,000 t could be reached within 7years at a fishing mortality of 0.30 inthe projection. If future harvest levelsremain at current levels, the stock bio-mass should vary with recruitment suc-cess, as in past years.
Literature CitedArmistead, C. E., and D. G. Nichol. 1993. 1990
bottom trawl survey of the eastern Bering Seacontinental shelf. U.S. Dep. Commer., NOAATech Memo. NMFS-AFSC-7, 190 p.
Bakkala, R. G., K. Wakabayashi, and T. M.Sample. 1985. Results of the demersal trawlsurveys. In R. G. Bakkala and K. Wakabayashi
(Editors), Results of cooperative U.S.- Japangroundfish investigations in the Bering Seaduring May–August 1979. Int. N. Pac. Fish.Comm. Bull. 44:39–191.
Beverton, R. J. H., and S. J. Holt. 1957. On thedynamics of exploited fish populations. Fish.Invest. Ser. II, vol. 19, 533 p.
Clark, W. G. 1991. Groundfish exploitation ratesbased on life history parameters. Can. J. Fish.Aquat. Sci. 48:734–750.
Fadeev, N. S. 1965. Comparative outline of thebiology of flatfishes in the southeastern partof the eastern Bering Sea and condition of theirresources. Tr. Vses. Nauchno-issled. Inst. Morsk.Rybn. Khoz. Morsk. Rybn. Knoz. Okeanogr.53:121–138. Transl. In Sov. Fish. Invest. North-east Pac. Pt. IV, p.112–129. Isr. Program Sci.Transl., 1968. Avail. from Natl. Tech. Inf. Serv.,Springfield, Va. as TT67-51206.
Feder, H. M. 1977. The distribution, abundance,diversity, and biology of benthic organismsin the Gulf of Alaska and the Bering Sea. InEnvironmental assessment of the Alaskancontinental shelf.: Dep. Commer., NOAA.,Environ. Res. Lab., Boulder, Colo., Annu.Rep. 8:366–712.
_______ . 1978. Distribution, abundance, com-munity structure and trophic relationships ofthe nearshore benthos of the Kodiak shelf,Cook Inlet, northeast Gulf of Alaska and theBering Sea. In Environmental Assessment ofthe Alaskan Continental Shelf. Annu. Rep.4:416–730. Dep. Commer., NOAA., Environ.Res. Lab., Boulder, Colo.
Forrester, C. R., A. J. Beardsley, and Y. Takahashi.1978. Groundfish, shrimp, and herring fish-eries in the Bering Sea and Northeast Pacific-historical catch statistics through 1970. Int.N. Pac. Fish. Comm. Bull 37, 147 p.
Gunderson, D. R. 1977. Population biology ofPacific ocean perch, Sebastes alutus, stocksin the Washington-Queen Charlotte Soundregion, and their response to fishing. Fish.Bull. 75:369–403.
Lang, G. M. 1992. Food habits of three conge-neric flatfishes, yellowfin sole Pleuronectesasper, rock sole, Pleuronectes bilineatus, andAlaska plaice, Pleuronectes quadrituberculatus,in the eastern Bering Sea, 1984–88. M.S. the-sis, Univ. Wash., Seattle, 125 p.
_______ , P. A. Livingston, and B. S. Miller.1995. Food habits of three congeneric flat-fishes: yellowfin sole (Pleuronectes asper),rock sole (P. bilineatus), and Alaska plaice (P.quadrituberculatus) in the Eastern Bering Sea.In Proceedings of the International Symposiumon North Pacific Flatfish, p. 225–245. Univ.Alaska Sea Grant College Program Rep. 95-04.
Matarese, A. C., A. W. Kendall, Jr., D. M. Blood,and B. M. Vinter 1989. Laboratory guide toearly life history stages of northeast PacificFishes. Dep. Commer., NOAA Tech. Rep.NMFS 80, 652 p.
Methot, R. D. 1990. Synthesis model: An adapt-able framework for analysis of diverse stockassessment data. Int. North Pac. Fish. Comm.Bull. 50:259–277.
Mineva, T. A. 1964. On the biology of some flat-fishes in the eastern Bering Sea. Tr. Vses.Nauchno-issled. Inst. Morsk. Rybn. Khoz.Okeanogr. 49 (Izv. Tikhookean. Naucho-issled. Inst. Morsk. Rybn. Khoz. Ikeanogr.51:215–224.) Transl. In Sov. Fish. Invest.Northeast Pac. pt II: 227–235. Isr. ProgramSci. Transl., 1968. Avail. from Natl. Tech. Inf.Serv., Springfield, Va., as TT67-512044.
Moiseev, P. A. 1953. Cod and flounders of far east-ern seas. Izv. Tikookean. Nauchno-issled. Inst.

60(4), 1998 27
Morsk. Rybn. Khoz. Okeanogr. 37:129–137.(Transl. by Fish. Res. Board Can., Transl. Ser. 94).
Mosher, K. R. 1954. Use of otoliths for deter-mining the age of several fishes from theBering Sea. J. Int. Explor. Cons. Mer 19(3):337–344.
Musienko, L. N. 1963. Ichthyoplankton of theBering Sea (data of the Bering Sea expedi-tion of 1958–59). Tr. Vses. Nauchno-issled.Inst. Morsk. Rybn. Khoz. Okeanogr. 48 (Izv.Tikhookean. Nauchno-isslled. Inst. Morsk.Rybn. Khoz. Okeanogr. 50:239–269.) Transl.In Sov. Fish. Invest. Northeast Pac., pt. I:251–286. Isr. Program Sci. Transl., 1968. Avail.from Natl. Tech. Inf. Serv., Springfield, Va.,as TT67-51203.
_______ . 1970. Reproduction and developmentof Bering Sea fishes. Tr. Vses. Nachno-issled.Inst. Morsk. Rybn. Khoz. Okeanogr. 70 (Izv.Tikhookean. Nauchno-issled. Inst. Morsk.Rybn. Khoz. Okeanogr. 72:166–224.) Transl.In Sov. Fish. Invest. Northeast Pac., pt.V:161–224. Isr. Program Sci. Transl., 1972. Avail.from Natl. Tech. Inf. Serv., Springfield, Va.,as TT71-50127.
Pertseva-Ostroumova, T. A. 1961. The reproduc-tion and development of far eastern flounders.Akad. Nauk SSSR Inst. Okeanologii, 484 p.(Transl. by Fish. Res. Bd. Can., 1967, Transl.Ser. 856, 1,003 p.)
Pruter, A. T., and D. L. Alverson. 1962. Abun-dance, distribution, and growth of floundersin the south-eastern Chukchi Sea. J. Cons.Cons. Int. Explor. Mer 18(1):81–99.
Quast, J. C., and E. L. Hall. 1972. List of fishesof Alaska and adjacent waters with a guide tosome of their literature. : Dep. Commer.,NOAA Tech. Rep. NMFS SSRF-658, 48 p.
Schoener, T. W. 1970. Non-synchronous spatialoverlap of lizards in patch habitats. Ecology51:408–418.
Skalkin, V. A. 1963. Diet of flatfishes in thesoutheastern Bering Sea. Tr. Vses. Nauchno-issled. Inst. Morsk. Rybn. Khoz. Okeanogr.48 (Izv. Tikhookean. Nauchno-issled. Inst.Morsk. Rybn. Khoz. Okeanogr. 50:151–166.)Transl. In Sov. Fish. Invest. Northeast Pac.,pt. I:235–250. Isr. Program Sci. Transl., 1968.Avail. from Natl. Tech. Inf. Serv., Springfield,Va., as TT67-51203.
Wakabayashi, K. 1972. Report on the biologicalresearch of ground fish in the Bering Sea andthe Northeastern Pacific by Tanshu Maru in1971. Far Seas Fish. Res. Lab., Shimizu 424,Japan, 240 p.
_______ , R. G. Bakkala, and M. S. Alton. 1985.Methods of the Japan demersal trawl surveys.In R. G. Bakkala and K. Wakabayashi (Edi-tors), Results of cooperative :- Japan ground-fish investigations in the Bering Sea duringMay–August 1979, p. 7–29. Int. N. Pac. Fish.Comm. Bull. 44.
Waldron, K. D. 1981. Ichthyoplankton. In D. W.Hood and J. A. Calder (Editors), The easternBering Sea shelf: Oceanography and re-sources, vol. 1, p. 471–493. Dep. Commer.,NOAA, Off. Mar. Pollut. Assess., Wash., D.C.
_______ and F. Favorite. 1977. Ichthyoplanktonof the eastern Bering Sea. In Environmentalassessment of the Alaskan continental shelf,Annual reports of principal investigators forthe year ending March 1977, vol. IX. Recep-tors-fish, littoral, benthos, p. 628–682. Dep.Commer., NOAA, and Dep. Inter., Bur. LandManage.
Weber, D. D., and H. H. Shippen. 1975. Age-
length-weight and distribution of Alaska pla-ice, rock sole, and yellowfin sole collectedfrom the southeastern Bering Sea in 1961.Fish. Bull. 73:919–924.
Wilderbuer, T. K., R. G. Bakkala, and G. E.Walters. 1992. Yellowfin sole, Pleuronectesasper, of the eastern Bering Sea: biologicalcharacteristics, history of exploitation, andmanagement. Mar. Fish. Rev. 54(4):1–18.
_______ and G. E. Walters. 1997. Other flatfish.In Stock assessment and fishery evaluationreport for the groundfish resources of theBering Sea/Aleutian Islands regions as pro-jected for 1998. Chapt. 8, p. 297–322. N. Pac.Fish. Manage. Counc., P.O. Box 103136, An-chorage, AK 99510.
_______ and C. I. Zhang. In Press. Evaluationof the population dynamics and yield charac-teristics of Alaska plaice (Pleuronectesquadrituberculatus) in the eastern Bering Seaincorporating results of an age-structuredanalysis. Fish. Res.
Zhang, C. I. 1987. Biology and population dy-namics of Alaska plaice, Pleuronectesquadrituberculatus, in the eastern Bering Sea.Univ. Wash., Seattle, Ph.D. dissert. 225 p.
_______ . 1988. Food habits and ecological in-teractions of Alaska plaice, Pleuronectes quad-rituberculatus, with other flatfish species inthe eastern Bering Sea. Bull. Kor. Fish. Soc.21(3):150–160.
_______ , D. R. Gunderson, and P. J. Sullivan.1991. Using data on biomass and fishing mor-tality in stock production modeling of flatfish.Neth. J. Sea Res. 27(3/4):459–467.
_______ and P. J. Sullivan. 1988. Biomass-basedcohort analysis that incorporates growth.Trans. Am. Fish. Soc. 117:180–189.