BIOINFORMATICS Datamining - Gerstein Labbioinfo.mbb.yale.edu/mbb452a/2002/datamine.pdf · 1 1 (c)...
37
BIOINFORMATICS Datamining Mark Gerstein, Yale University bioinfo.mbb.yale.edu/mbb452a 2 (c) Mark Gerstein, 1999, Yale, bioinfo.mbb.yale.edu Large-scale Datamining • Gene Expression ◊ Representing Data in a Grid ◊ Description of function prediction in abstract context • Unsupervised Learning ◊ clustering & k-means ◊ Local clustering • Supervised Learning ◊ Discriminants & Decision Tree ◊ Bayesian Nets • Function Prediction EX ◊ Simple Bayesian Approach for Localization Prediction
Transcript of BIOINFORMATICS Datamining - Gerstein Labbioinfo.mbb.yale.edu/mbb452a/2002/datamine.pdf · 1 1 (c)...
1
1(c
) Mar
k G
erst
ein,
199
9, Y
ale,
bio
info
.mbb
.yal
e.ed
u
BIOINFORMATICSDatamining
Mark Gerstein, Yale Universitybioinfo.mbb.yale.edu/mbb452a
2(c
) Mar
k G
erst
ein,
199
9, Y
ale,
bio
info
.mbb
.yal
e.ed
u
Large-scale Datamining
• Gene Expression◊ Representing Data in a Grid◊ Description of function prediction in abstract context
• Unsupervised Learning◊ clustering & k-means◊ Local clustering
• Supervised Learning◊ Discriminants & Decision Tree◊ Bayesian Nets
• Function Prediction EX◊ Simple Bayesian Approach for Localization Prediction
2
3(c
) Mar
k G
erst
ein,
199
9, Y
ale,
bio
info
.mbb
.yal
e.ed
u
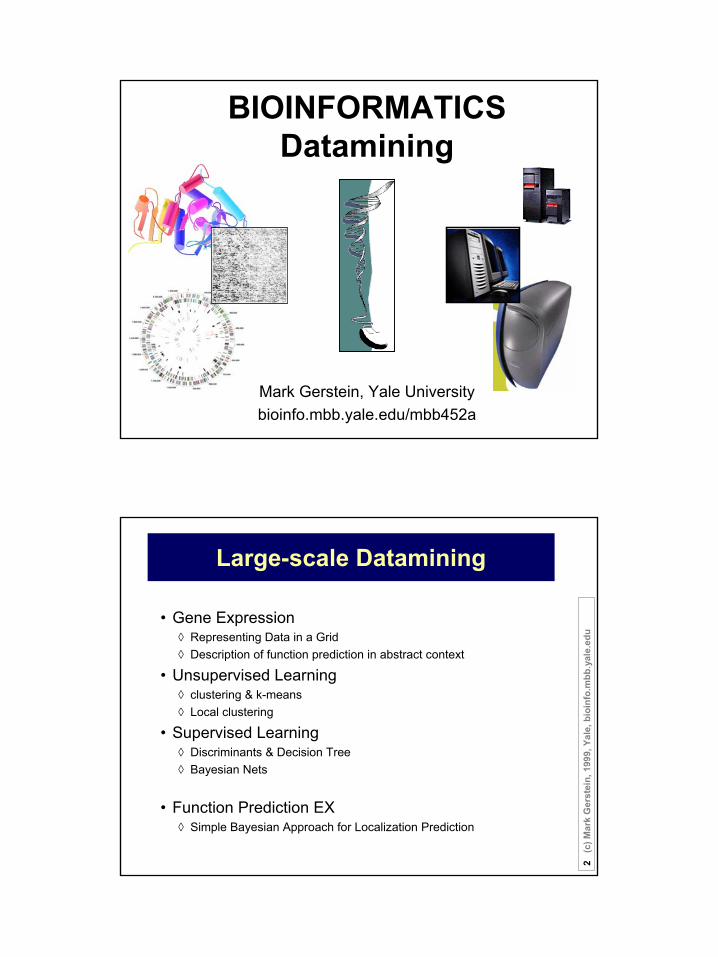
2nd gen.,Proteome
Chips (Snyder)
The recent advent and subsequent onslaught of microarray data
1st generation,Expression
Arrays (Brown)
4(c
) Mar
k G
erst
ein,
199
9, Y
ale,
bio
info
.mbb
.yal
e.ed
u
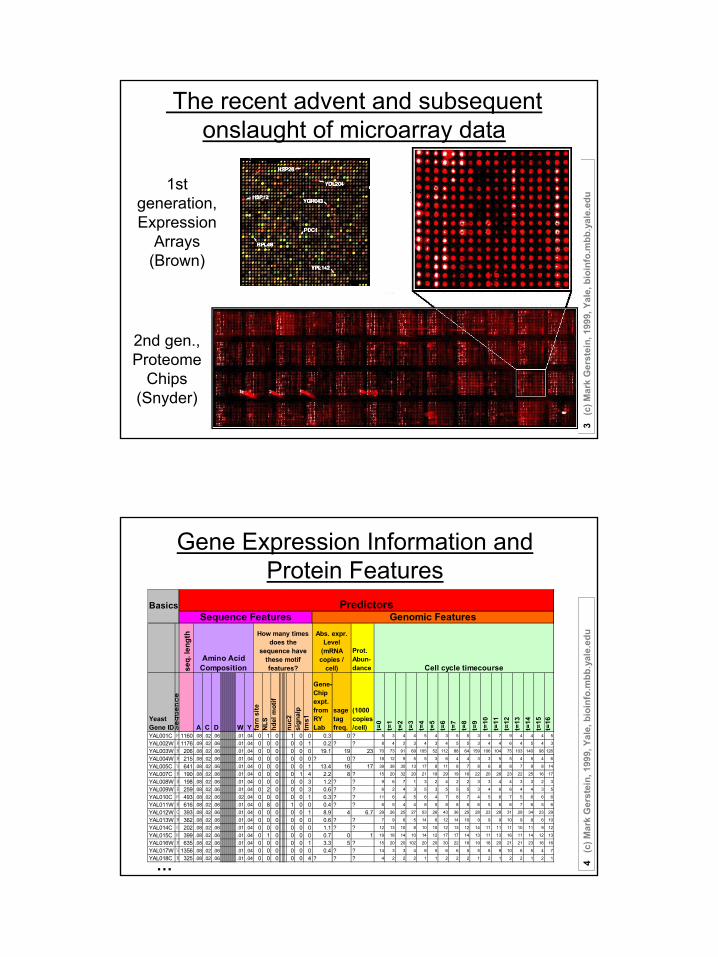
Gene Expression Information and Protein Features
seq.
leng
th
Prot. Abun-dance
Yeast Gene ID S
equence
A C DEFGHIKLMNPQRSTVW Y farn
site
NLS
hdel
mot
if
nuc2
sign
alp
tms1
Gene-Chip expt. from RY Lab
sage tag freq.
(1000 copies /cell) t=
0t=
1t=
2t=
3t=
4t=
5t=
6t=
7t=
8t=
9t=
10t=
11t=
12t=
13t=
14t=
15t=
16
YAL001C M1160 .08 .02 .06 .01 .04 0 1 0 1 0 0 0.3 0 ? 5 3 4 4 5 4 3 5 5 3 5 7 9 4 4 4 5
YAL002W K1176 .09 .02 .06 .01 .04 0 0 0 0 0 1 0.2 ? ? 8 4 2 3 4 3 4 5 5 3 4 4 6 4 5 4 3
YAL003W K 206 .08 .02 .06 .01 .04 0 0 0 0 0 0 19.1 19 23 70 73 91 69 105 52 112 88 64 159 106 104 75 103 140 98 126
YAL004W R 215 .08 .02 .06 .01 .04 0 0 0 0 0 0 ? 0 ? 18 12 9 5 5 3 6 4 4 3 3 5 5 4 5 4 6
YAL005C V 641 .08 .02 .06 .01 .04 0 0 0 0 0 1 13.4 16 17 39 38 30 13 17 8 11 8 7 8 6 8 8 7 9 8 14
YAL007C K 190 .08 .02 .06 .01 .04 0 0 0 0 1 4 2.2 8 ? 15 20 32 20 21 19 29 19 16 22 20 26 23 22 25 16 17
YAL008W H 198 .08 .02 .06 .01 .04 0 0 0 0 0 3 1.2 ? ? 9 6 7 1 3 2 4 2 2 3 3 4 4 3 3 2 3
YAL009W P 259 .08 .02 .06 .01 .04 0 2 0 0 0 3 0.6 ? ? 6 2 4 3 5 3 5 5 5 3 4 6 6 4 4 3 5
YAL010C M 493 .08 .02 .06 .02 .04 0 0 0 0 0 1 0.3 ? ? 11 6 4 5 6 4 7 8 7 4 5 6 7 5 6 6 6
YAL011W K 616 .08 .02 .06 .01 .04 0 8 0 1 0 0 0.4 ? ? 6 5 4 4 8 5 8 8 6 6 5 6 6 7 6 5 6
YAL012W G 393 .08 .02 .06 .01 .04 0 0 0 0 0 1 8.9 4 6.7 29 26 25 27 53 26 43 36 25 28 23 28 31 29 34 23 29
YAL013W R 362 .08 .02 .06 .01 .04 0 0 0 0 0 0 0.6 ? ? 7 9 6 5 14 6 12 14 10 9 9 9 10 9 8 6 10
YAL014C G 202 .08 .02 .06 .01 .04 0 0 0 0 0 0 1.1 ? ? 12 13 10 8 10 10 12 13 12 14 11 11 11 10 11 9 12
YAL015C M 399 .08 .02 .06 .01 .04 0 1 0 0 0 0 0.7 0 1 19 18 14 10 14 12 17 17 14 13 11 13 16 11 14 12 13
YAL016W K 635 .08 .02 .06 .01 .04 0 0 0 0 0 1 3.3 5 ? 15 20 20 102 20 20 30 22 18 19 18 20 21 21 23 16 16
YAL017W V1356 .08 .02 .06 .01 .04 0 0 0 0 0 0 0.4 ? ? 14 3 3 4 8 5 6 6 5 5 8 9 10 6 5 4 7
YAL018C K 325 .08 .02 .06 .01 .04 0 0 0 0 0 4 ? ? ? 4 2 2 2 1 1 2 2 2 1 2 1 2 2 1 2 1
Cell cycle timecourse
Genomic FeaturesPredictors
Sequence FeaturesAbs. expr.
Level (mRNA copies /
cell)
How many times does the
sequence have these motif features?
Basics
Amino Acid Composition
…
3
5(c
) Mar
k G
erst
ein,
199
9, Y
ale,
bio
info
.mbb
.yal
e.ed
u
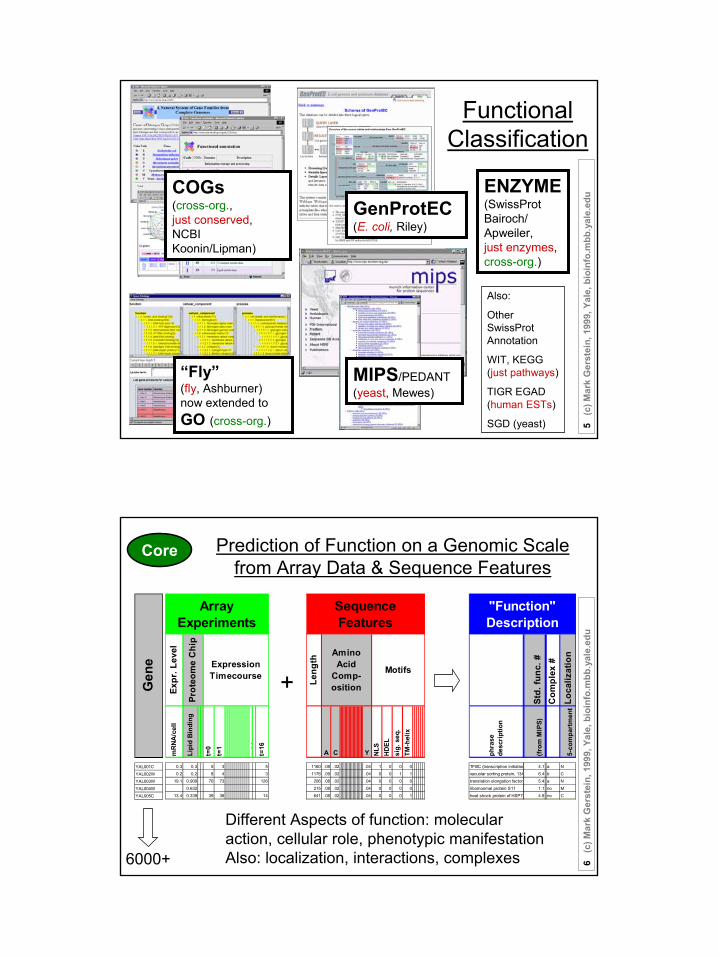
Functional Classification
GenProtEC(E. coli, Riley)
MIPS/PEDANT(yeast, Mewes)
“Fly” (fly, Ashburner)now extended to GO (cross-org.)
ENZYME(SwissProt Bairoch/Apweiler,just enzymes, cross-org.)
Also:
Other SwissProt Annotation
WIT, KEGG (just pathways)
TIGR EGAD (human ESTs)
SGD (yeast)
COGs(cross-org., just conserved, NCBI Koonin/Lipman)
6(c
) Mar
k G
erst
ein,
199
9, Y
ale,
bio
info
.mbb
.yal
e.ed
u
Prediction of Function on a Genomic Scale from Array Data & Sequence Features
Leng
th
A C WY NLS
HDEL
si
g. s
eq.
TM-h
elix
1160 .08 .02 .04 1 0 0 01176 .09 .02 .04 0 0 1 1206 .08 .02 .04 0 0 0 0
215 .08 .02 .04 0 0 0 0641 .08 .02 .04 0 0 0 1
Sequence Features
Amino Acid
Comp-osition
Motifs
+
Std.
func
. #C
ompl
ex #
Loca
lizat
ion
phra
se
desc
riptio
n
(from
MIP
S)
5-co
mpa
rtm
ent
TFIIIC (transcription initiation 4.1 a Nvacuolar sorting protein, 134 6.4 b Ctranslation elongation factor 5.4 a N
ribomosmal protein S11 1.1 no Mheat shock protein of HSP70 4.8 no C
"Function" Description
YAL001CYAL002WYAL003WYAL004WYAL005C
Gen
e
Expr
. Lev
elm
RNA/
cell
Lipi
d Bi
ndin
g
t=0
t=1
t14
t15
t=16
0.3 0.3 5 3 50.2 0.2 8 4 3
19.1 0.909 70 73 126
0.63213.4 0.339 39 38 14
Array Experiments
Expression Timecourse
Prot
eom
e C
hip
6000+
Different Aspects of function: molecular action, cellular role, phenotypic manifestationAlso: localization, interactions, complexes
Core
4
7(c
) Mar
k G
erst
ein,
199
9, Y
ale,
bio
info
.mbb
.yal
e.ed
u
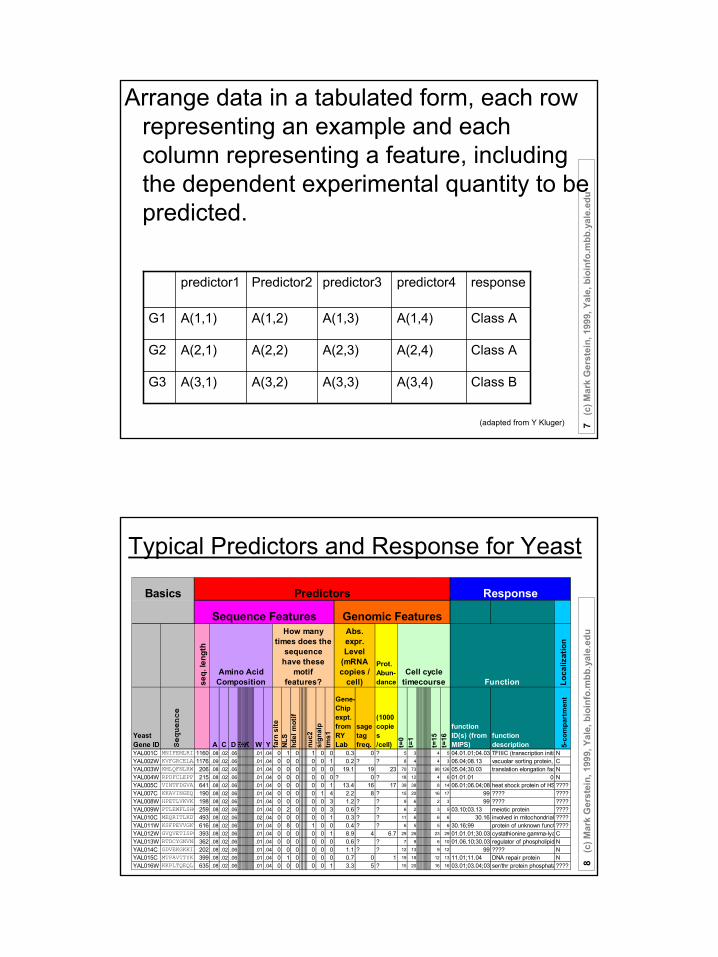
Arrange data in a tabulated form, each row representing an example and each column representing a feature, including the dependent experimental quantity to be predicted.
Class BA(3,4)A(3,3)A(3,2)A(3,1)G3
Class AA(2,4)A(2,3)A(2,2)A(2,1)G2
Class AA(1,4)A(1,3)A(1,2)A(1,1)G1
responsepredictor4predictor3Predictor2predictor1
(adapted from Y Kluger)
8(c
) Mar
k G
erst
ein,
199
9, Y
ale,
bio
info
.mbb
.yal
e.ed
u
Typical Predictors and Response for Yeast
seq.
leng
th
Prot. Abun-dance Lo
caliz
atio
n
Yeast Gene ID S
equence
A C DEFGHIKLMNPQRSTVW Y farn
site
NLS
hdel
mot
if
nuc2
sign
alp
tms1
Gene-Chip expt. from RY Lab
sage tag freq.
(1000 copies /cell) t=
0t=
1
t=15
t=16
function ID(s) (from MIPS)
function description 5-
com
part
men
t
YAL001C MNIFEMLRID1160 .08 .02 .06 .01 .04 0 1 0 1 0 0 0.3 0 ? 5 3 4 5 04.01.01;04.03.TFIIIC (transcription initiaNYAL002W KVFGRCELAA1176 .09 .02 .06 .01 .04 0 0 0 0 0 1 0.2 ? ? 8 4 4 3 06.04;08.13 vacuolar sorting protein, CYAL003W KMLQFNLRWP 206 .08 .02 .06 .01 .04 0 0 0 0 0 0 19.1 19 23 70 73 98 126 05.04;30.03 translation elongation fac NYAL004W RPDFCLEPPY 215 .08 .02 .06 .01 .04 0 0 0 0 0 0 ? 0 ? 18 12 4 6 01.01.01 0 NYAL005C VINTFDGVAD 641 .08 .02 .06 .01 .04 0 0 0 0 0 1 13.4 16 17 39 38 8 14 06.01;06.04;08.heat shock protein of HS ????YAL007C KKAVINGEQI 190 .08 .02 .06 .01 .04 0 0 0 0 1 4 2.2 8 ? 15 20 16 17 99 ???? ????YAL008W HPETLVKVKD 198 .08 .02 .06 .01 .04 0 0 0 0 0 3 1.2 ? ? 9 6 2 3 99 ???? ????YAL009W PTLEWFLSHC 259 .08 .02 .06 .01 .04 0 2 0 0 0 3 0.6 ? ? 6 2 3 5 03.10;03.13 meiotic protein ????YAL010C MEQRITLKDY 493 .08 .02 .06 .02 .04 0 0 0 0 0 1 0.3 ? ? 11 6 6 6 30.16 involved in mitochondrial ????YAL011W KSFPEVVGKT 616 .08 .02 .06 .01 .04 0 8 0 1 0 0 0.4 ? ? 6 5 5 6 30.16;99 protein of unknown funct ????YAL012W GVQVETISPG 393 .08 .02 .06 .01 .04 0 0 0 0 0 1 8.9 4 6.7 29 26 23 29 01.01.01;30.03 cystathionine gamma-lyaCYAL013W RTDCYGNVNR 362 .08 .02 .06 .01 .04 0 0 0 0 0 0 0.6 ? ? 7 9 6 10 01.06.10;30.03 regulator of phospholipid NYAL014C GDVEKGKKIF 202 .08 .02 .06 .01 .04 0 0 0 0 0 0 1.1 ? ? 12 13 9 12 99 ???? NYAL015C MTPAVTTYKL 399 .08 .02 .06 .01 .04 0 1 0 0 0 0 0.7 0 1 19 18 12 13 11.01;11.04 DNA repair protein NYAL016W KKPLTQEQLE 635 .08 .02 .06 .01 .04 0 0 0 0 0 1 3.3 5 ? 15 20 16 16 03.01;03.04;03.ser/thr protein phosphata????
How many times does the
sequence have these
motif features?
Amino Acid Composition
Basics
Cell cycle timecourse
Genomic Features
Predictors
Function
Sequence Features
Response
Abs. expr. Level
(mRNA copies /
cell)
5
9(c
) Mar
k G
erst
ein,
199
9, Y
ale,
bio
info
.mbb
.yal
e.ed
u
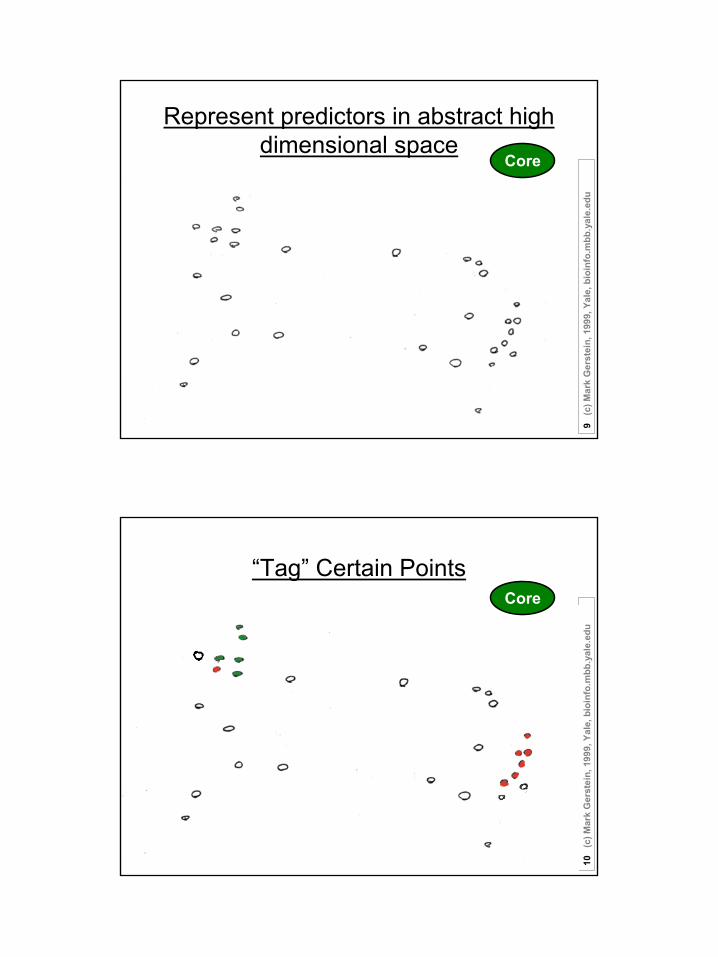
Represent predictors in abstract high dimensional space
Core
10(c
) Mar
k G
erst
ein,
199
9, Y
ale,
bio
info
.mbb
.yal
e.ed
u“Tag” Certain Points
Core

6
11(c
) Mar
k G
erst
ein,
199
9, Y
ale,
bio
info
.mbb
.yal
e.ed
u
Abstract high-dimensional space representation
12(c
) Mar
k G
erst
ein,
199
9, Y
ale,
bio
info
.mbb
.yal
e.ed
u
Large-scale Datamining
• Gene Expression◊ Representing Data in a Grid◊ Description of function prediction in abstract context
• Unsupervised Learning◊ clustering & k-means◊ Local clustering
• Supervised Learning◊ Discriminants & Decision Tree◊ Bayesian Nets
• Function Prediction EX◊ Simple Bayesian Approach for Localization Prediction

7
13(c
) Mar
k G
erst
ein,
199
9, Y
ale,
bio
info
.mbb
.yal
e.ed
u
“cluster” predictorsCore
14(c
) Mar
k G
erst
ein,
199
9, Y
ale,
bio
info
.mbb
.yal
e.ed
uUse clusters to predict Response
Core
8
15(c
) Mar
k G
erst
ein,
199
9, Y
ale,
bio
info
.mbb
.yal
e.ed
u
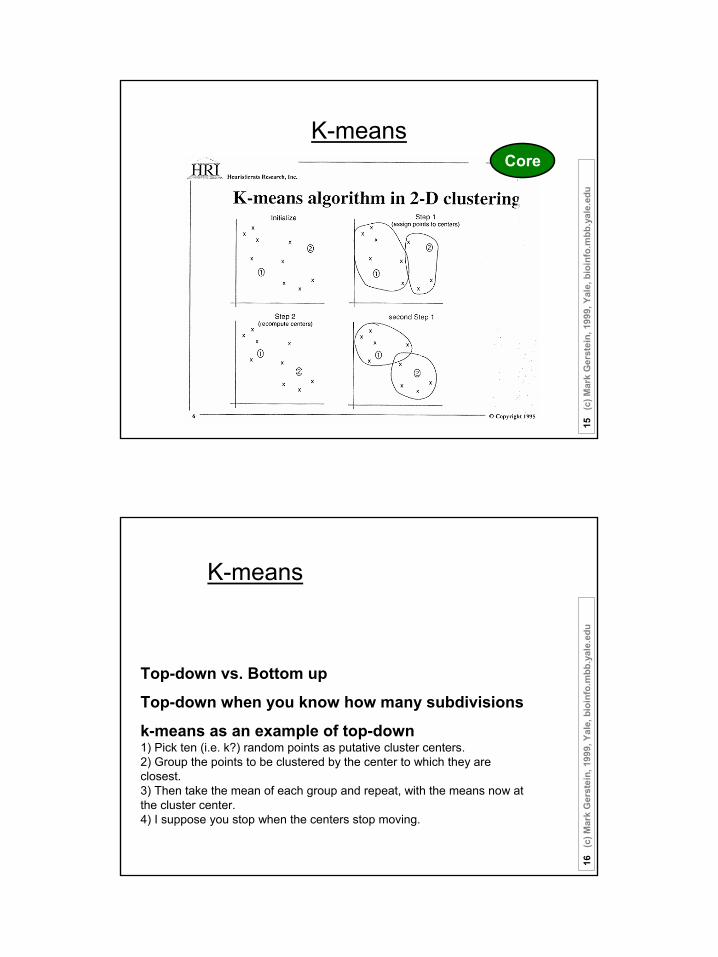
K-meansCore
16(c
) Mar
k G
erst
ein,
199
9, Y
ale,
bio
info
.mbb
.yal
e.ed
uK-means
Top-down vs. Bottom up
Top-down when you know how many subdivisions
k-means as an example of top-down1) Pick ten (i.e. k?) random points as putative cluster centers.2) Group the points to be clustered by the center to which they areclosest. 3) Then take the mean of each group and repeat, with the means now atthe cluster center.4) I suppose you stop when the centers stop moving.

9
17(c
) Mar
k G
erst
ein,
199
9, Y
ale,
bio
info
.mbb
.yal
e.ed
u
Bottom up clustering Core
18(c
) Mar
k G
erst
ein,
199
9, Y
ale,
bio
info
.mbb
.yal
e.ed
u
Large-scale Datamining
• Gene Expression◊ Representing Data in a Grid◊ Description of function prediction in abstract context
• Unsupervised Learning◊ clustering & k-means◊ Local clustering
• Supervised Learning◊ Discriminants & Decision Tree◊ Bayesian Nets
• Function Prediction EX◊ Simple Bayesian Approach for Localization Prediction

10
19(c
) Mar
k G
erst
ein,
199
9, Y
ale,
bio
info
.mbb
.yal
e.ed
u
Clusteringthe
yeast cell cycle to uncover
interacting proteins
-2
-1
0
1
2
3
4
0 4 8 12 16
RPL19B
TFIIIC
Microarray timecourse of 1 ribosomal protein
mR
NA
expr
essi
on le
vel (
ratio
)
Time->
[Brown, Davis]Extra
20(c
) Mar
k G
erst
ein,
199
9, Y
ale,
bio
info
.mbb
.yal
e.ed
u
Clusteringthe
yeast cell cycle to uncover
interacting proteins
-2
-1
0
1
2
3
4
0 4 8 12 16
RPL19B
TFIIIC
Random relationship from ~18M
mR
NA
expr
essi
on le
vel (
ratio
)
Time->
Extra

11
21(c
) Mar
k G
erst
ein,
199
9, Y
ale,
bio
info
.mbb
.yal
e.ed
u
Clusteringthe
yeast cell cycle to uncover
interacting proteins
-2
-1
0
1
2
3
4
0 4 8 12 16
RPL19B
RPS6B
Close relationship from 18M (2 Interacting Ribosomal Proteins)
mR
NA
expr
essi
on le
vel (
ratio
)
Time->
[Botstein; Church, Vidal]Extra
22(c
) Mar
k G
erst
ein,
199
9, Y
ale,
bio
info
.mbb
.yal
e.ed
u
Clusteringthe
yeast cell cycle to uncover
interacting proteins
-2
-1
0
1
2
3
4
0 4 8 12 16
RPL19B
RPS6B
RPP1A
RPL15A
?????
Predict Functional Interaction of Unknown Member of Cluster
mR
NA
expr
essi
on le
vel (
ratio
)
Time->
Extra
12
23(c
) Mar
k G
erst
ein,
199
9, Y
ale,
bio
info
.mbb
.yal
e.ed
u
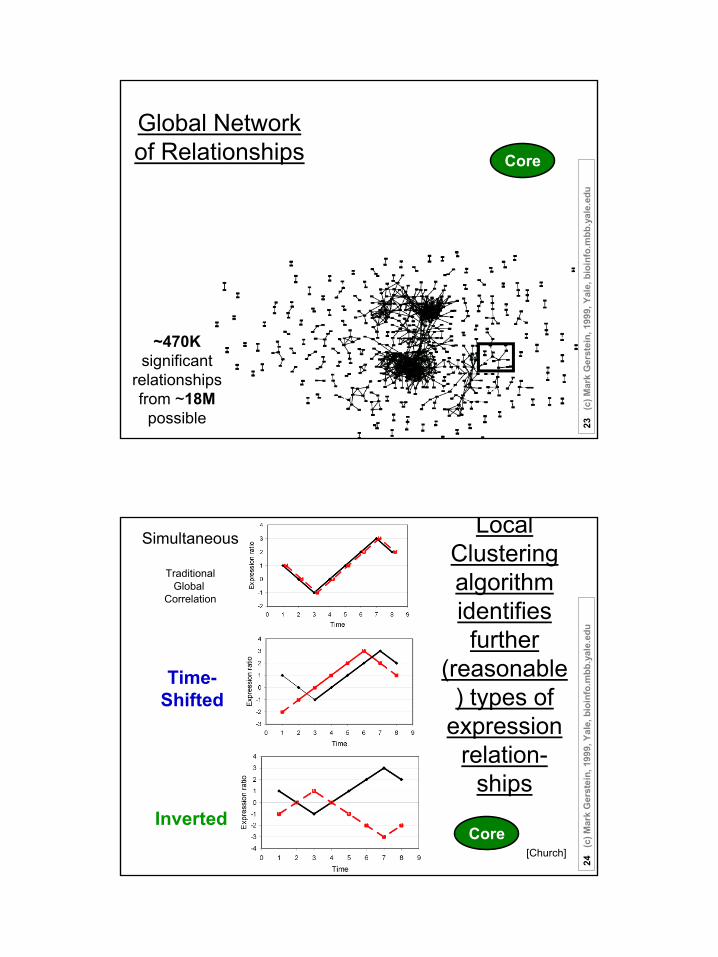
Global Network of Relationships
~470K significant
relationshipsfrom ~18M
possible
Core
24(c
) Mar
k G
erst
ein,
199
9, Y
ale,
bio
info
.mbb
.yal
e.ed
u
Local Clustering algorithm identifies further
(reasonable) types of
expression relation-
ships
Simultaneous
TraditionalGlobal
Correlation
Inverted
Time-Shifted
[Church]Core

13
25(c
) Mar
k G
erst
ein,
199
9, Y
ale,
bio
info
.mbb
.yal
e.ed
u
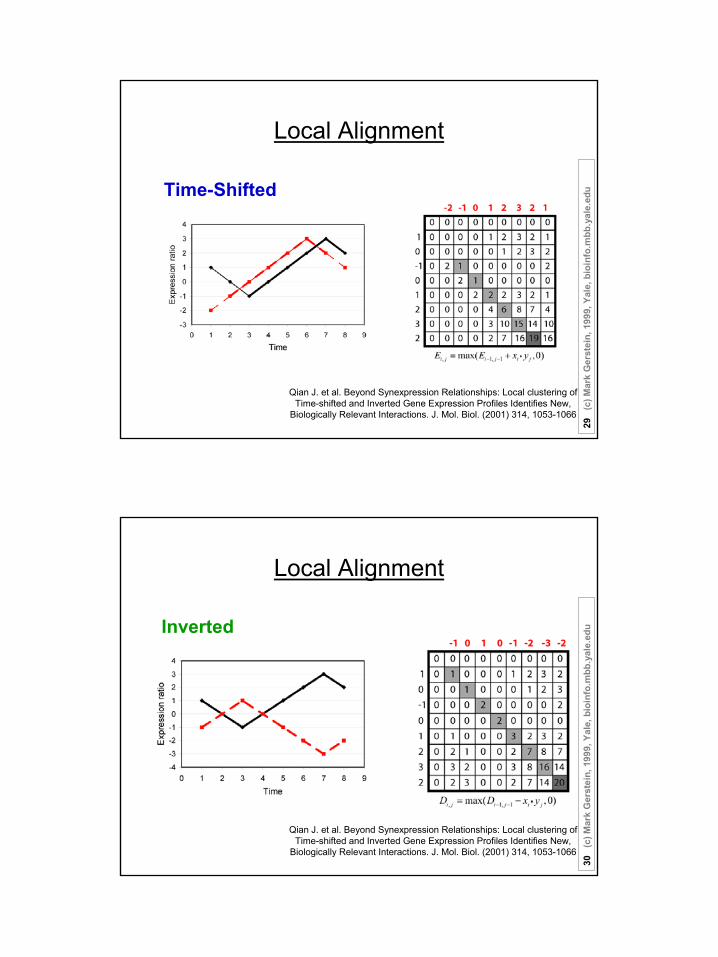
Local Alignment
Suppose there are n (1, 2, …, n) time points:
The expression ratio is normalized in “Z-score” fashion;
Score matrix: Si,j = S(xi,yj) = xi • yj ;
Qian J. et al. Beyond Synexpression Relationships: Local clustering of Time-shifted and Inverted Gene Expression Profiles Identifies New,
Biologically Relevant Interactions. J. Mol. Biol. (2001) 314, 1053-1066
26(c
) Mar
k G
erst
ein,
199
9, Y
ale,
bio
info
.mbb
.yal
e.ed
uLocal Alignment
Suppose there are n (1, 2, …, n) time points:
Sum matrices Ei,j and Di,j :
Ei,j = max(Ei-1,j-1 + Si,j , 0);
Di,j = max(Di-1,j-1 - Si,j , 0);
Match Score = max(Ei,j , Di,j )
Qian J. et al. Beyond Synexpression Relationships: Local clustering of Time-shifted and Inverted Gene Expression Profiles Identifies New,
Biologically Relevant Interactions. J. Mol. Biol. (2001) 314, 1053-1066

14
27(c
) Mar
k G
erst
ein,
199
9, Y
ale,
bio
info
.mbb
.yal
e.ed
u
Local Alignment
Qian J. et al. Beyond Synexpression Relationships: Local clustering of Time-shifted and Inverted Gene Expression Profiles Identifies New,
Biologically Relevant Interactions. J. Mol. Biol. (2001) 314, 1053-1066
Simultaneous
28(c
) Mar
k G
erst
ein,
199
9, Y
ale,
bio
info
.mbb
.yal
e.ed
uLocal Alignment
Qian J. et al. Beyond Synexpression Relationships: Local clustering of Time-shifted and Inverted Gene Expression Profiles Identifies New,
Biologically Relevant Interactions. J. Mol. Biol. (2001) 314, 1053-1066
Simultaneous
15
29(c
) Mar
k G
erst
ein,
199
9, Y
ale,
bio
info
.mbb
.yal
e.ed
u
Local Alignment
Qian J. et al. Beyond Synexpression Relationships: Local clustering of Time-shifted and Inverted Gene Expression Profiles Identifies New,
Biologically Relevant Interactions. J. Mol. Biol. (2001) 314, 1053-1066
Time-Shifted
30(c
) Mar
k G
erst
ein,
199
9, Y
ale,
bio
info
.mbb
.yal
e.ed
uLocal Alignment
Qian J. et al. Beyond Synexpression Relationships: Local clustering of Time-shifted and Inverted Gene Expression Profiles Identifies New,
Biologically Relevant Interactions. J. Mol. Biol. (2001) 314, 1053-1066
Inverted

16
31(c
) Mar
k G
erst
ein,
199
9, Y
ale,
bio
info
.mbb
.yal
e.ed
u
Global (NW) vs Local (SW)Alignments
TTGACACCCTCCCAATTGTA...|||| || |
.....ACCCCAGGCTTTACACAT123444444456667
T T G A C A C C...| | - | | | | -T T T A C A C A...1 2 1 2 3 4 5 40 0 4 4 4 4 4 8
Match Score = +1Gap-Opening=-1.2, Gap-Extension=-.03for local alignment Mismatch = -0.6
Adapted from D J States & M S Boguski, "Similarity and Homology," Chapter 3 from Gribskov, M. and Devereux, J. (1992). Sequence Analysis Primer. New York, Oxford University Press. (Page 133)
mismatch
32(c
) Mar
k G
erst
ein,
199
9, Y
ale,
bio
info
.mbb
.yal
e.ed
u
Statistical Scoring

17
33(c
) Mar
k G
erst
ein,
199
9, Y
ale,
bio
info
.mbb
.yal
e.ed
u
-2
-1
0
1
2
3
4
0 4 8 12 16
ARC35
ARP3
Examples time-shifted relationships
Suggestive
ARP3 : in actinremodelling cplx.
ARC35 : in same cplx. (required late in cell cycle)
Time
Expr
. Rat
io
-4
-3
-2
-1
0
1
2
0 4 8 12 16
J0544ATP11MRPL17MRPL19YDR116C
Predicted
J0544 : unknownfunction
MRPL19: mito.ribosome Extra
34(c
) Mar
k G
erst
ein,
199
9, Y
ale,
bio
info
.mbb
.yal
e.ed
u
-2
-1
0
1
2
3
4
0 4 8 12 16
ARC35
ARP3
Examples time-shifted relationships
Suggestive
ARP3 : in actinremodelling cplx.
ARC35 : in same cplx. (required late in cell cycle)
Time
Expr
. Rat
io
-4
-3
-2
-1
0
1
2
0 4 8 12 16
J0544ATP11MRPL17MRPL19YDR116C
Predicted
J0544 : unknownfunction
MRPL19: mito.ribosome Extra
18
35(c
) Mar
k G
erst
ein,
199
9, Y
ale,
bio
info
.mbb
.yal
e.ed
u
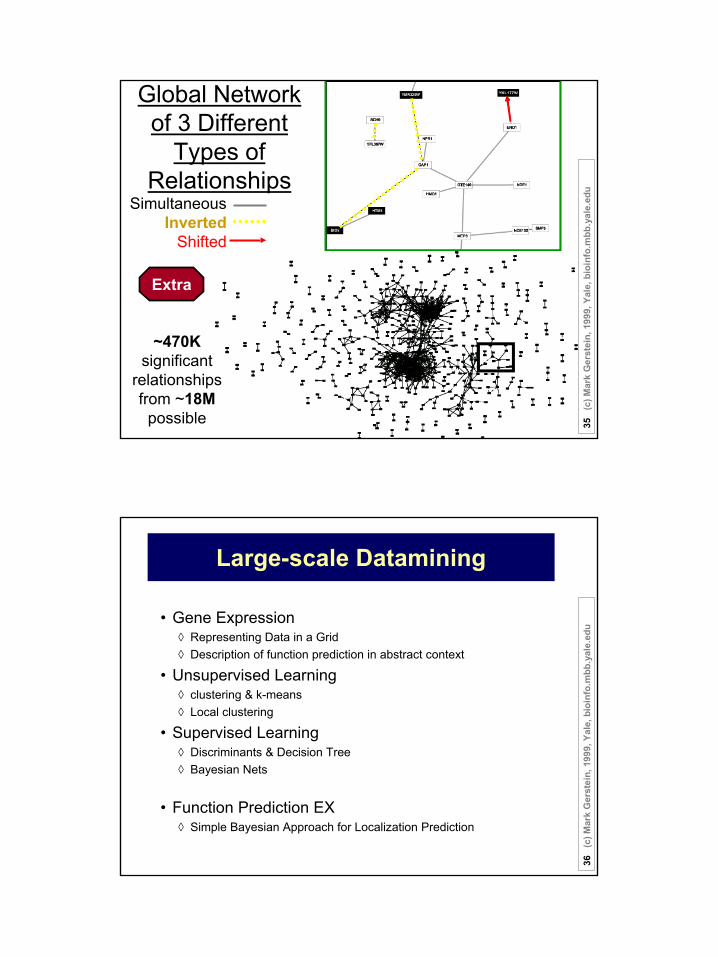
Global Network of 3 Different
Types of Relationships
SimultaneousInverted
Shifted
~470K significant
relationshipsfrom ~18M
possible
Extra
36(c
) Mar
k G
erst
ein,
199
9, Y
ale,
bio
info
.mbb
.yal
e.ed
u
Large-scale Datamining
• Gene Expression◊ Representing Data in a Grid◊ Description of function prediction in abstract context
• Unsupervised Learning◊ clustering & k-means◊ Local clustering
• Supervised Learning◊ Discriminants & Decision Tree◊ Bayesian Nets
• Function Prediction EX◊ Simple Bayesian Approach for Localization Prediction

19
37(c
) Mar
k G
erst
ein,
199
9, Y
ale,
bio
info
.mbb
.yal
e.ed
u
“Tag” Certain PointsCore
38(c
) Mar
k G
erst
ein,
199
9, Y
ale,
bio
info
.mbb
.yal
e.ed
u
Find a Division to Separate Tagged PointsCore

20
39(c
) Mar
k G
erst
ein,
199
9, Y
ale,
bio
info
.mbb
.yal
e.ed
u
Extrapolate to Untagged PointsCore
40(c
) Mar
k G
erst
ein,
199
9, Y
ale,
bio
info
.mbb
.yal
e.ed
uDiscriminant to Position Plane
Core

21
41(c
) Mar
k G
erst
ein,
199
9, Y
ale,
bio
info
.mbb
.yal
e.ed
u
Fisher discriminant analysis• Use the training set to reveal the structure of class distribution
by seeking a linear combination • y = w1x1 + w2x2 + ... + wnxn which maximizes the ratio of the
separation of the class means to the sum of each class variance (within class variance). This linear combination is called the first linear discriminant or first canonical variate. Classification of a future case is then determined by choosing the nearest class in the space of the first linear discriminant and significant subsequent discriminants, which maximally separate the class means and are constrained to be uncorrelated with previous ones.
42(c
) Mar
k G
erst
ein,
199
9, Y
ale,
bio
info
.mbb
.yal
e.ed
uFischer’s Discriminant
(Adapted from ???)

22
43(c
) Mar
k G
erst
ein,
199
9, Y
ale,
bio
info
.mbb
.yal
e.ed
u
Fisher cont.
ii mwm ρρ⋅= 22 )(∑
∈
−=iYy
ii mys
)( 211 mmSw W
ρρρ−= −Solution of 1st
variate
44(c
) Mar
k G
erst
ein,
199
9, Y
ale,
bio
info
.mbb
.yal
e.ed
u
Find a Division to Separate Tagged PointsCore
23
45(c
) Mar
k G
erst
ein,
199
9, Y
ale,
bio
info
.mbb
.yal
e.ed
u
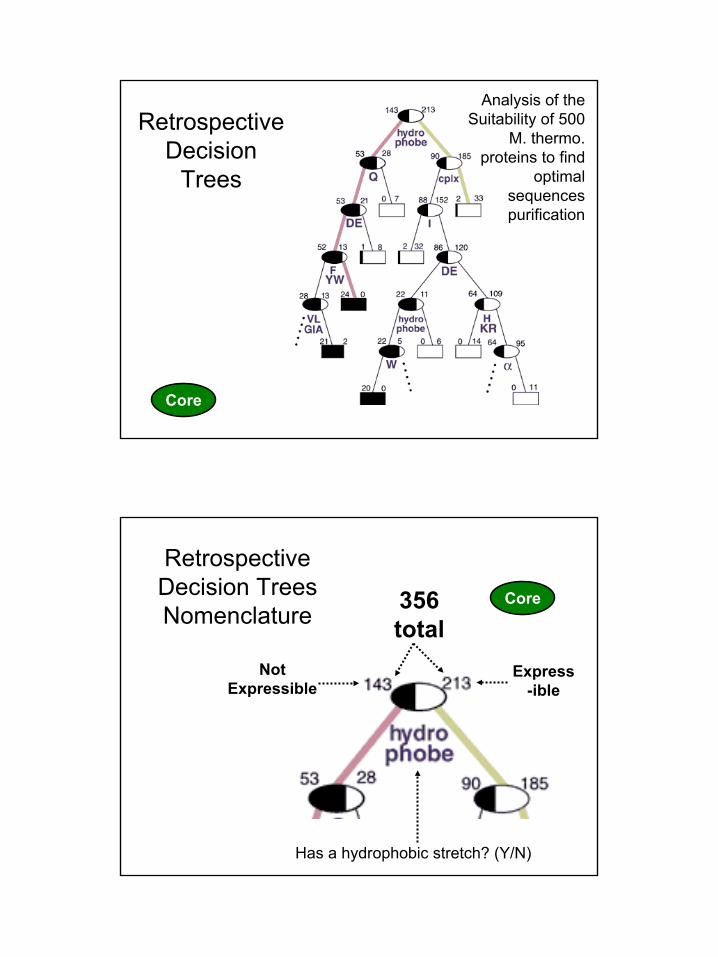
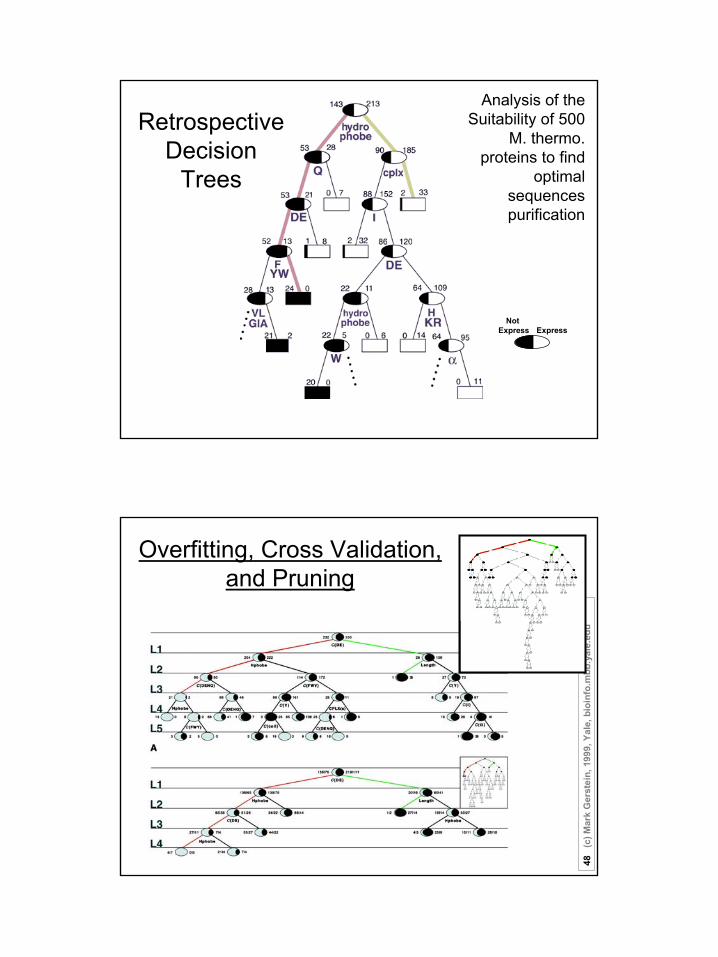
Analysis of the Suitability of 500
M. thermo. proteins to find
optimal sequences purification
Retrospective Decision
Trees
Core
46(c
) Mar
k G
erst
ein,
199
9, Y
ale,
bio
info
.mbb
.yal
e.ed
u
Express-ible
Not Expressible
Retrospective Decision TreesNomenclature 356
total
Has a hydrophobic stretch? (Y/N)
Core
24
47(c
) Mar
k G
erst
ein,
199
9, Y
ale,
bio
info
.mbb
.yal
e.ed
u
Analysis of the Suitability of 500
M. thermo. proteins to find
optimal sequences purification
ExpressNot
Express
Retrospective Decision
Trees
48(c
) Mar
k G
erst
ein,
199
9, Y
ale,
bio
info
.mbb
.yal
e.ed
u
Overfitting, Cross Validation, and Pruning

25
49(c
) Mar
k G
erst
ein,
199
9, Y
ale,
bio
info
.mbb
.yal
e.ed
u
Decision Trees• can handle data that is not linearly separable. • A decision tree is an upside down tree in which each branch node represents a choice between a number of alternatives, and
each leaf node represents a classification or decision. One classifies instances by sorting them down the tree from the root to some leaf nodes. To classify an instance the tree calls first for a test at the root node, testing the feature indicated on this node and choosing the next node connected to the root branch where the outcome agrees with the value of the feature of that instance. Thereafter a second test on another feature is made on the next node. This process is then repeated until a leaf of the tree is reached.
• Growing the tree, based on a training set, requires strategies for (a) splitting the nodes and (b) pruning the tree. Maximizing the decrease in average impurity is a common criterion for splitting. In a problem with noisy data (where distribution of observations from the classes overlap) growing the tree will usually over-fit the training set. The strategy in most of the cost-complexity pruning algorithms is to choose the smallest tree whose error rate performance is close to the minimal error rate of the over-fit larger tree. More specifically, growing the trees is based on splitting the node that maximizes the reduction in deviance (or any other impurity-measure of the distribution at a node) over all allowed binary splits of all terminal nodes. Splits are not chosen based on misclassification rate .A binary split for a continuous feature variable v is of the form v<threshold versus v>thresholdand for a “descriptive” factor it divides the factor’s levels into two classes. Decision tree-models have been successfully applied in a broad range of domains. Their popularity arises from the following: Decision trees are easy to interpret and use when the predictors are a mix of numeric and nonnumeric (factor) variables. They are invariant to scaling or re-expression of numeric variables. Compared with linear and additive models they are effective in treating missing values and capturing non-additive behavior. They can also be used to predict nonnumeric dependent variables with more than two levels. In addition, decision-tree models are useful to devise prediction rules, screen the variables and summarize the multivariate data set in a comprehensive fashion. We also note that ANN and decision tree learning often have comparable prediction accuracy [Mitchell p. 85] and SVM algorithms are slower compared with decision tree. These facts suggest that the decision tree method should be one of our top candidates to “data-mine” proteomics datasets. C4.5 and CART are among the most popular decision tree algorithms.
Optional: not needed for Quiz (adapted from Y Kluger)
50(c
) Mar
k G
erst
ein,
199
9, Y
ale,
bio
info
.mbb
.yal
e.ed
uEffect of Scaling
(adapted from ref?)

26
51(c
) Mar
k G
erst
ein,
199
9, Y
ale,
bio
info
.mbb
.yal
e.ed
u
End of class 2002,12.01 (Bioinfo-13)
[started at beg. of datamining]
52(c
) Mar
k G
erst
ein,
199
9, Y
ale,
bio
info
.mbb
.yal
e.ed
u
Large-scale Datamining
• Gene Expression◊ Representing Data in a Grid◊ Description of function prediction in abstract context
• Unsupervised Learning◊ clustering & k-means◊ Local clustering
• Supervised Learning◊ Discriminants & Decision Tree◊ Bayesian Nets
• Function Prediction EX◊ Simple Bayesian Approach for Localization Prediction

27
53(c
) Mar
k G
erst
ein,
199
9, Y
ale,
bio
info
.mbb
.yal
e.ed
u
Represent predictors in abstract high dimensional space
54(c
) Mar
k G
erst
ein,
199
9, Y
ale,
bio
info
.mbb
.yal
e.ed
uTagged Data
28
55(c
) Mar
k G
erst
ein,
199
9, Y
ale,
bio
info
.mbb
.yal
e.ed
u
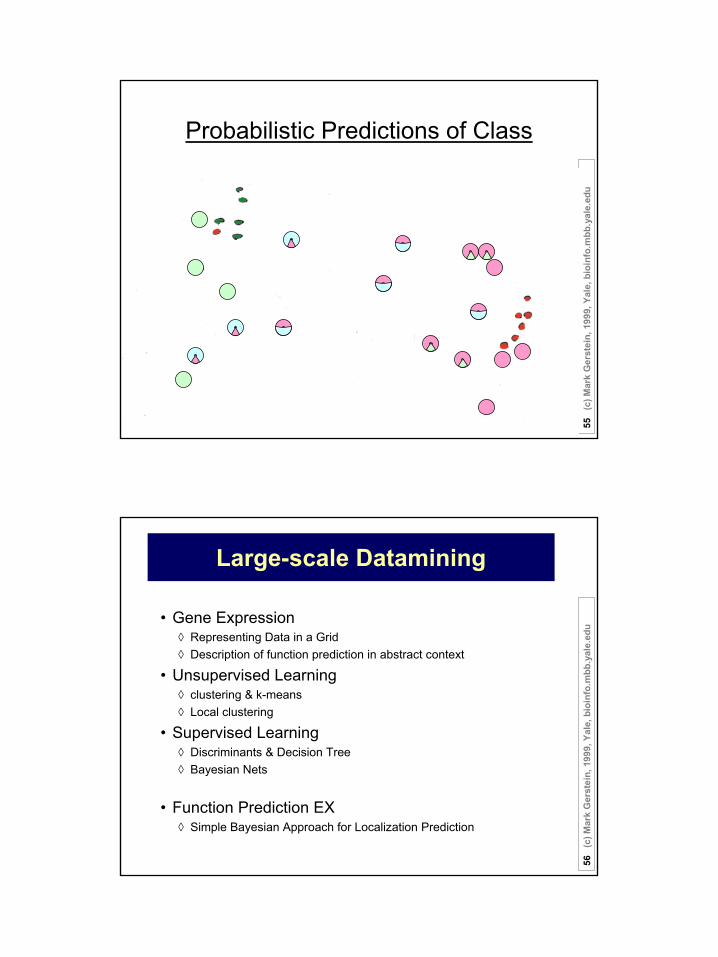
Probabilistic Predictions of Class
56(c
) Mar
k G
erst
ein,
199
9, Y
ale,
bio
info
.mbb
.yal
e.ed
u
Large-scale Datamining
• Gene Expression◊ Representing Data in a Grid◊ Description of function prediction in abstract context
• Unsupervised Learning◊ clustering & k-means◊ Local clustering
• Supervised Learning◊ Discriminants & Decision Tree◊ Bayesian Nets
• Function Prediction EX◊ Simple Bayesian Approach for Localization Prediction
29
57(c
) Mar
k G
erst
ein,
199
9, Y
ale,
bio
info
.mbb
.yal
e.ed
u
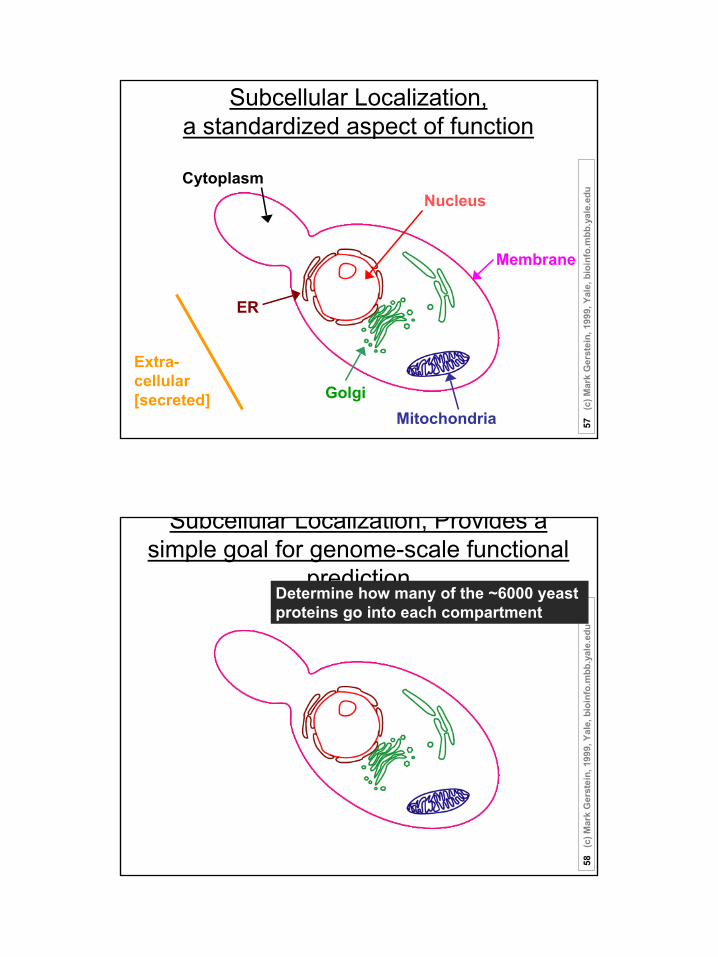
Subcellular Localization, a standardized aspect of function
Nucleus
Membrane
Extra-cellular[secreted]
ER
Cytoplasm
MitochondriaGolgi
58(c
) Mar
k G
erst
ein,
199
9, Y
ale,
bio
info
.mbb
.yal
e.ed
u
Subcellular Localization, Provides a simple goal for genome-scale functional
predictionDetermine how many of the ~6000 yeast proteins go into each compartment
30
59(c
) Mar
k G
erst
ein,
199
9, Y
ale,
bio
info
.mbb
.yal
e.ed
u
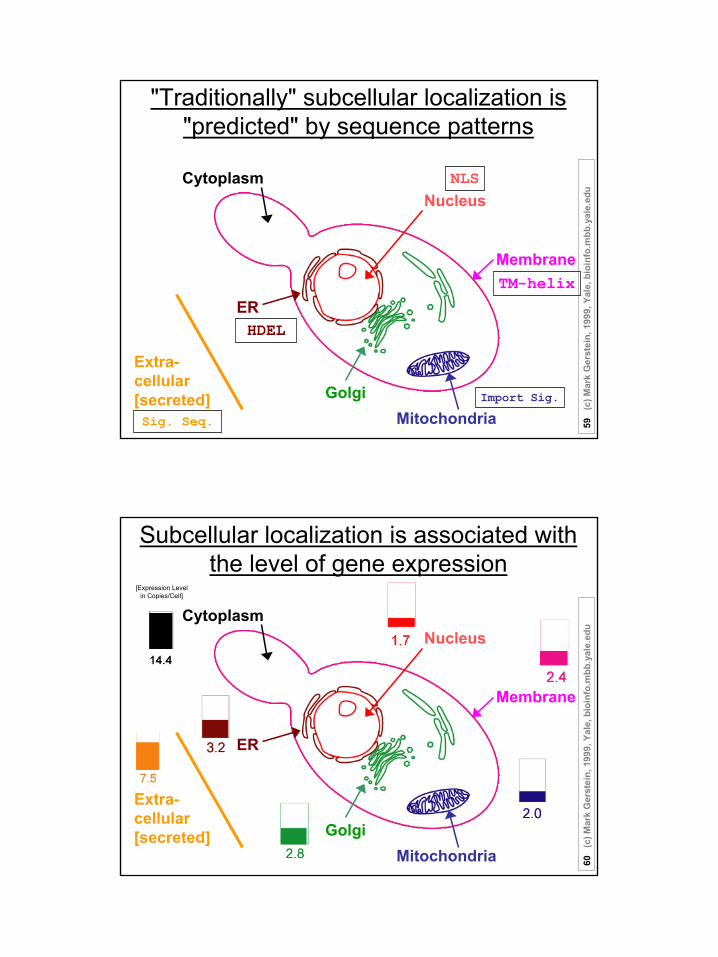
"Traditionally" subcellular localization is "predicted" by sequence patterns
NLS
TM-helix
Sig. Seq.
HDEL
Nucleus
Membrane
Extra-cellular[secreted]
ER
Cytoplasm
MitochondriaGolgi Import Sig.
60(c
) Mar
k G
erst
ein,
199
9, Y
ale,
bio
info
.mbb
.yal
e.ed
u
Subcellular localization is associated with the level of gene expression
Nucleus
Membrane
Extra-cellular[secreted]
ER
Cytoplasm
MitochondriaGolgi
[Expression Level in Copies/Cell]
31
61(c
) Mar
k G
erst
ein,
199
9, Y
ale,
bio
info
.mbb
.yal
e.ed
u
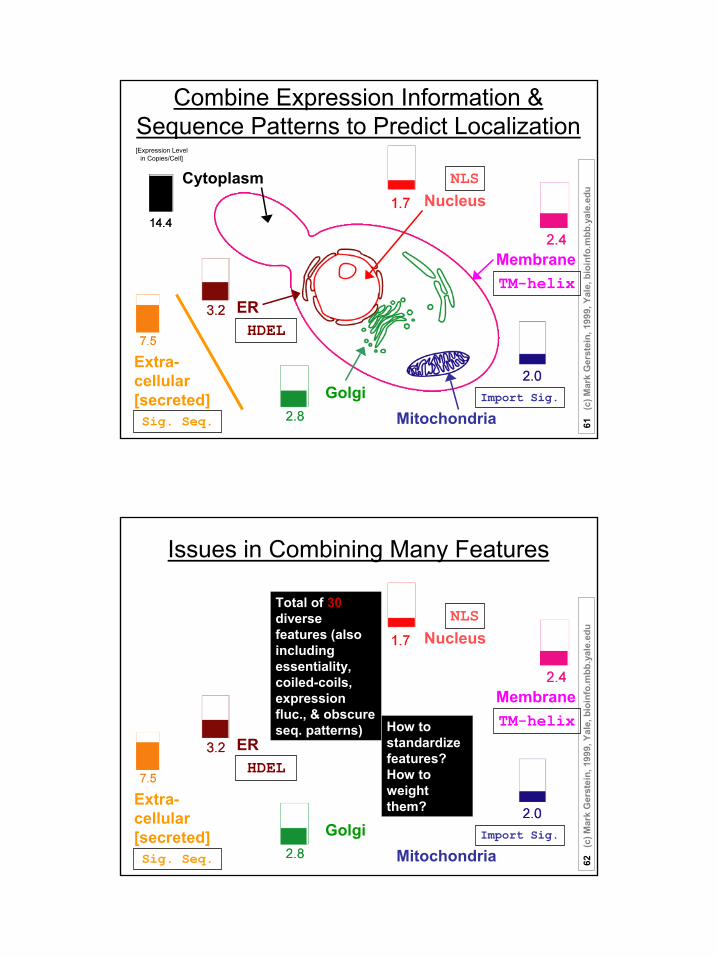
Combine Expression Information & Sequence Patterns to Predict Localization
NLS
TM-helix
Sig. Seq.
HDEL
Nucleus
Membrane
Extra-cellular[secreted]
ER
Cytoplasm
MitochondriaGolgi Import Sig.
[Expression Level in Copies/Cell]
62(c
) Mar
k G
erst
ein,
199
9, Y
ale,
bio
info
.mbb
.yal
e.ed
u
Issues in Combining Many Features
NLS
TM-helix
Sig. Seq.
HDEL
Nucleus
Membrane
Extra-cellular[secreted]
ER
MitochondriaGolgi Import Sig.
Total of 30diverse features (also including essentiality, coiled-coils, expression fluc., & obscure seq. patterns) How to
standardize features?How to weight them?
32
63(c
) Mar
k G
erst
ein,
199
9, Y
ale,
bio
info
.mbb
.yal
e.ed
u
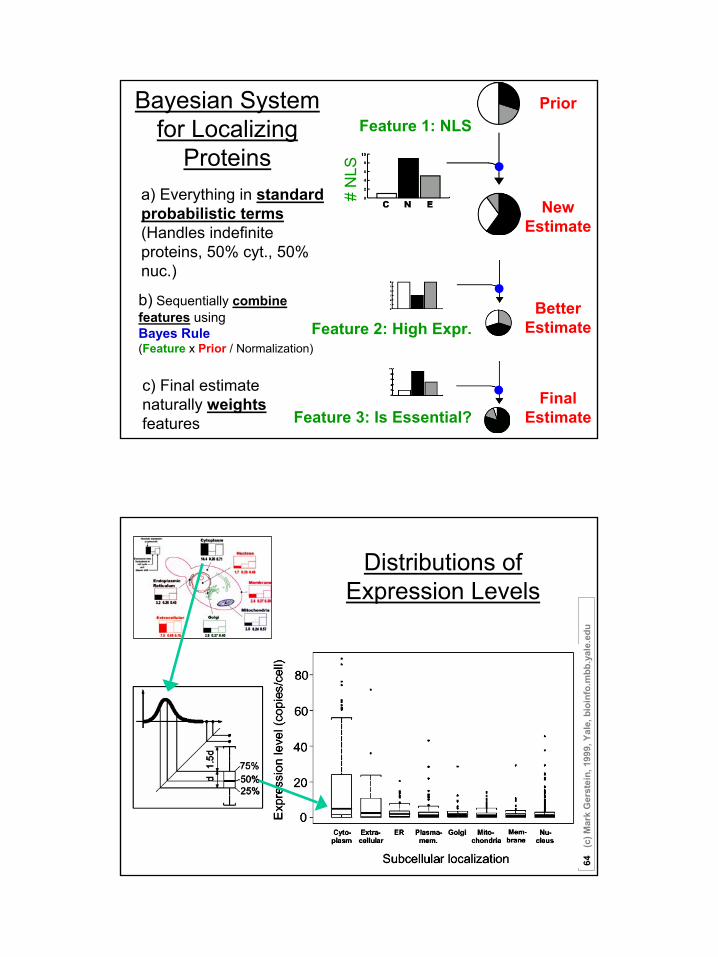
Feature 1: NLS
# N
LS
a) Everything in standard probabilistic terms(Handles indefinite proteins, 50% cyt., 50% nuc.)
Bayesian System for Localizing
Proteins
Prior
New Estimate
Feature 2: High Expr.Better
Estimate
Feature 3: Is Essential?
b) Sequentially combine features using Bayes Rule (Feature x Prior / Normalization)
FinalEstimate
c) Final estimate naturally weights features
64(c
) Mar
k G
erst
ein,
199
9, Y
ale,
bio
info
.mbb
.yal
e.ed
u
Distributions of Expression Levels
33
65(c
) Mar
k G
erst
ein,
199
9, Y
ale,
bio
info
.mbb
.yal
e.ed
u
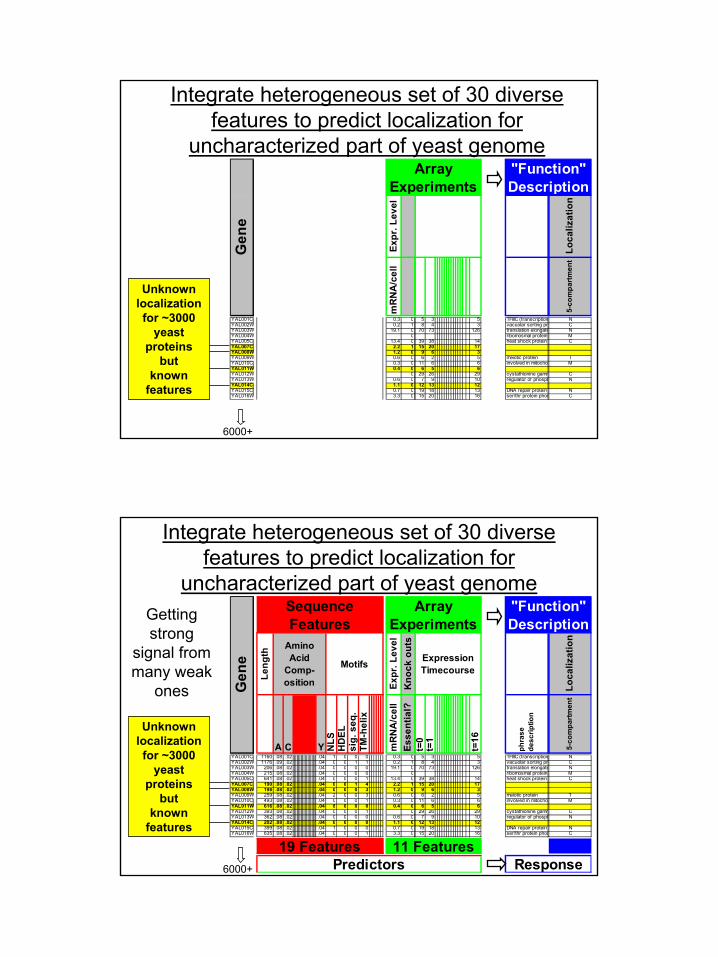
Integrate heterogeneous set of 30 diverse features to predict localization for
uncharacterized part of yeast genome
6000+
Unknownlocalization for ~3000
yeast proteins
butknown
featuresEx
pr. L
evel
Loca
lizat
ion
mRN
A/c
ell
5-co
mpa
rtmen
t
YAL001C 0.3 0 5 3 5 TFIIIC (transcription NYAL002W 0.2 1 8 4 3 vacuolar sorting pr CYAL003W 19.1 0 70 73 126 translation elongatio NYAL004W 0 ribomosmal protein MYAL005C 13.4 0 39 38 14 heat shock protein CYAL007C 2.2 1 15 20 17YAL008W 1.2 0 9 6 3YAL009W 0.6 0 6 2 5 meiotic protein TYAL010C 0.3 0 11 6 6 involved in mitocho MYAL011W 0.4 0 6 5 6YAL012W 0 29 26 29 cystathionine gamm CYAL013W 0.6 0 7 9 10 regulator of phosph NYAL014C 1.1 0 12 13 12YAL015C 0.7 0 19 18 13 DNA repair protein NYAL016W 3.3 0 15 20 16 ser/thr protein phos C
Gen
e
Array Experiments
"Function" Description
66(c
) Mar
k G
erst
ein,
199
9, Y
ale,
bio
info
.mbb
.yal
e.ed
u
Integrate heterogeneous set of 30 diverse features to predict localization for
uncharacterized part of yeast genome
6000+
Unknownlocalization for ~3000
yeast proteins
butknown
features
Leng
th
Expr
. Lev
el
Loca
lizat
ion
A C WY NLS
H
DEL
si
g. s
eq.
TM-h
elix
mRN
A/c
ell
Esse
ntia
l?t=
0t=
1
t=16
phra
se
desc
riptio
n
5-co
mpa
rtmen
t
YAL001C 1160 .08 .02 .04 1 0 0 0 0.3 0 5 3 5 TFIIIC (transcription NYAL002W 1176 .09 .02 .04 0 0 1 1 0.2 1 8 4 3 vacuolar sorting pr CYAL003W 206 .08 .02 .04 0 0 0 0 19.1 0 70 73 126 translation elongatio NYAL004W 215 .08 .02 .04 0 0 0 0 0 ribomosmal protein MYAL005C 641 .08 .02 .04 0 0 0 1 13.4 0 39 38 14 heat shock protein CYAL007C 190 .08 .02 .04 0 0 1 4 2.2 1 15 20 17YAL008W 198 .08 .02 .04 0 0 0 3 1.2 0 9 6 3YAL009W 259 .08 .02 .04 2 0 0 3 0.6 0 6 2 5 meiotic protein TYAL010C 493 .08 .02 .04 0 0 0 1 0.3 0 11 6 6 involved in mitocho MYAL011W 616 .08 .02 .04 8 0 0 0 0.4 0 6 5 6YAL012W 393 .08 .02 .04 0 0 0 1 0 29 26 29 cystathionine gamm CYAL013W 362 .08 .02 .04 0 0 0 0 0.6 0 7 9 10 regulator of phosph NYAL014C 202 .08 .02 .04 0 0 0 0 1.1 0 12 13 12YAL015C 399 .08 .02 .04 1 0 0 0 0.7 0 19 18 13 DNA repair protein NYAL016W 635 .08 .02 .04 0 0 0 1 3.3 0 15 20 16 ser/thr protein phos C
Gen
e
Array Experiments
"Function" Description
Sequence Features
Amino Acid
Comp-osition
Expression Timecourse
Kno
ck o
uts
Motifs
Predictors Response19 Features 11 Features
Getting strong
signal from many weak
ones

34
67(c
) Mar
k G
erst
ein,
199
9, Y
ale,
bio
info
.mbb
.yal
e.ed
u
Bayesian System for Localizing Proteins:
Prior
Simplified Cell: 3 (5) compartment
Prior probability distribution for a protein to be in each compartment
68(c
) Mar
k G
erst
ein,
199
9, Y
ale,
bio
info
.mbb
.yal
e.ed
u
Bayesian System for Localizing Proteins:Features
Training Data: 1342 proteins with known localizations
Tabulate occurrence of feature across comparmentsin training data for all 30 features
# N
LS
35
69(c
) Mar
k G
erst
ein,
199
9, Y
ale,
bio
info
.mbb
.yal
e.ed
u
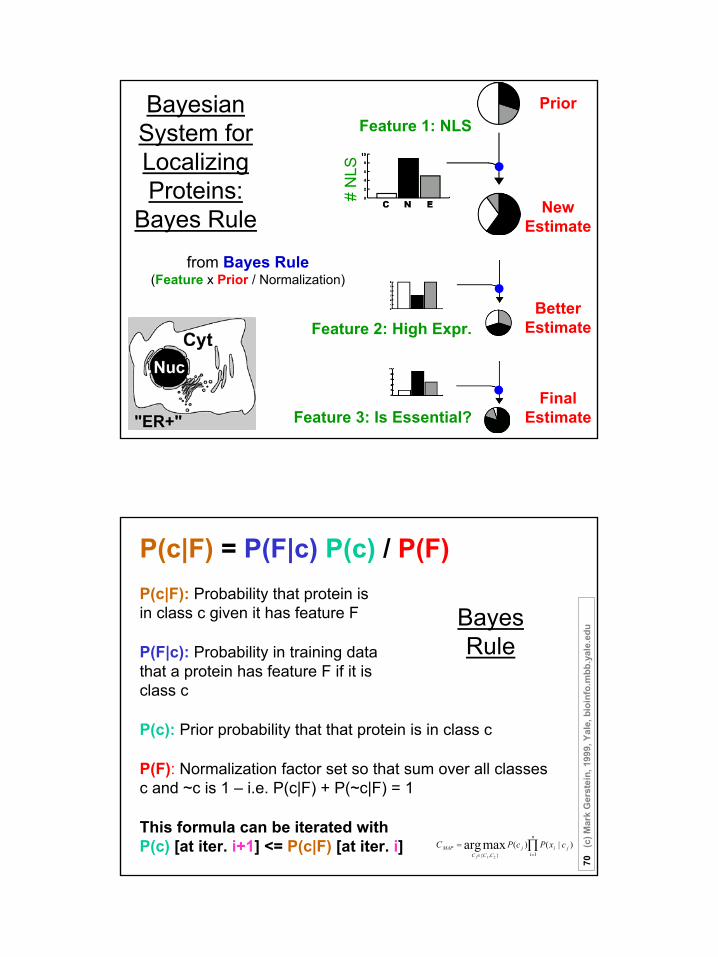
Bayesian System for Localizing Proteins:
Bayes Rule
PriorFeature 1: NLS
# N
LS
from Bayes Rule(Feature x Prior / Normalization)
New Estimate
Feature 2: High Expr.Better
Estimate
Feature 3: Is Essential?Final
Estimate
70(c
) Mar
k G
erst
ein,
199
9, Y
ale,
bio
info
.mbb
.yal
e.ed
uBayesRule
P(c|F) = P(F|c) P(c) / P(F)
∏=∈
=n
ijij
CCCMAP cxPcPC
j 1},{
)|()(maxarg21
P(c|F): Probability that protein is in class c given it has feature F
P(F|c): Probability in training data that a protein has feature F if it is class c
P(c): Prior probability that that protein is in class c
P(F): Normalization factor set so that sum over all classes c and ~c is 1 – i.e. P(c|F) + P(~c|F) = 1
This formula can be iterated with P(c) [at iter. i+1] <= P(c|F) [at iter. i]
36
71(c
) Mar
k G
erst
ein,
199
9, Y
ale,
bio
info
.mbb
.yal
e.ed
u
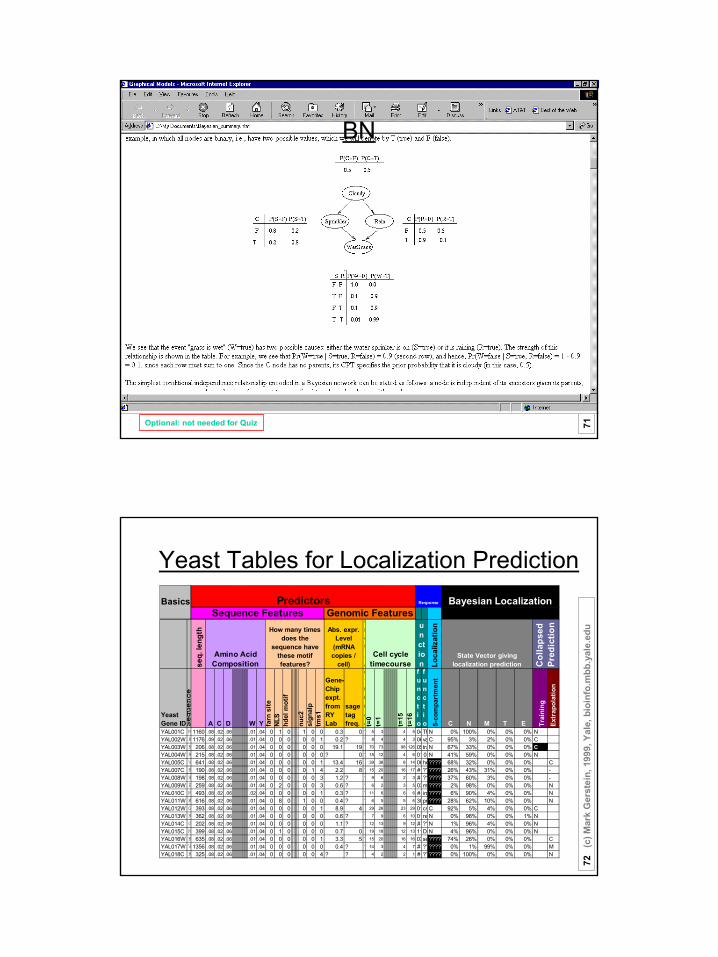
BN
Optional: not needed for Quiz
72(c
) Mar
k G
erst
ein,
199
9, Y
ale,
bio
info
.mbb
.yal
e.ed
u
Yeast Tables for Localization Prediction
seq.
leng
th
Prot.A Lo
caliz
atio
n
Yeast Gene ID S
equence
A C DEFGHIKLMNPQRSTVW Y farn
site
NLS
hdel
mot
if
nuc2
sign
alp
tms1
Gene-Chip expt. from RY Lab
sage tag freq.
(1000co t=
0t=
1
t=15
t=16
functio
functio 5-
com
part
men
t
C N M T E Trai
ning
Extr
apol
atio
n
YAL001C M1160 .08 .02 .06 .01 .04 0 1 0 1 0 0 0.3 0 ? 5 3 4 5 04TFN 0% 100% 0% 0% 0% NYAL002W K1176 .09 .02 .06 .01 .04 0 0 0 0 0 1 0.2 ? ? 8 4 4 3 06vaC 95% 3% 2% 0% 0% CYAL003W K 206 .08 .02 .06 .01 .04 0 0 0 0 0 0 19.1 19 70 73 98 126 05traN 67% 33% 0% 0% 0% CYAL004W R 215 .08 .02 .06 .01 .04 0 0 0 0 0 0 ? 0 ? 18 12 4 6 010 N 41% 59% 0% 0% 0% NYAL005C V 641 .08 .02 .06 .01 .04 0 0 0 0 0 1 13.4 16 39 38 8 14 06he???? 68% 32% 0% 0% 0% CYAL007C K 190 .08 .02 .06 .01 .04 0 0 0 0 1 4 2.2 8 ? 15 20 16 17 # ?????? 26% 43% 31% 0% 0% -YAL008W H 198 .08 .02 .06 .01 .04 0 0 0 0 0 3 1.2 ? ? 9 6 2 3 # ?????? 37% 60% 3% 0% 0% -YAL009W P 259 .08 .02 .06 .01 .04 0 2 0 0 0 3 0.6 ? ? 6 2 3 5 03me???? 2% 98% 0% 0% 0% NYAL010C M 493 .08 .02 .06 .02 .04 0 0 0 0 0 1 0.3 ? ? 11 6 6 6 # inv???? 6% 90% 4% 0% 0% NYAL011W K 616 .08 .02 .06 .01 .04 0 8 0 1 0 0 0.4 ? ? 6 5 5 6 30pr ???? 28% 62% 10% 0% 0% NYAL012W G 393 .08 .02 .06 .01 .04 0 0 0 0 0 1 8.9 4 29 26 23 29 01cyC 92% 5% 4% 0% 0% CYAL013W R 362 .08 .02 .06 .01 .04 0 0 0 0 0 0 0.6 ? ? 7 9 6 10 01re N 0% 98% 0% 0% 1% NYAL014C G 202 .08 .02 .06 .01 .04 0 0 0 0 0 0 1.1 ? ? 12 13 9 12 # ??N 1% 96% 4% 0% 0% NYAL015C M 399 .08 .02 .06 .01 .04 0 1 0 0 0 0 0.7 0 19 18 12 13 11DNN 4% 96% 0% 0% 0% NYAL016W K 635 .08 .02 .06 .01 .04 0 0 0 0 0 1 3.3 5 ? 15 20 16 16 03se???? 74% 26% 0% 0% 0% CYAL017W V1356 .08 .02 .06 .01 .04 0 0 0 0 0 0 0.4 ? ? 14 3 4 7 # ?????? 0% 1% 99% 0% 0% MYAL018C K 325 .08 .02 .06 .01 .04 0 0 0 0 0 4 ? ? ? 4 2 2 1 # ?????? 0% 100% 0% 0% 0% N
Cell cycle timecourse
Genomic FeaturesPredictors
unction
Sequence FeaturesResponse
Abs. expr. Level
(mRNA copies /
cell)State Vector giving
localization prediction
How many times does the
sequence have these motif features?
Basics
Col
laps
ed
Pred
ictio
n
Bayesian Localization
Amino Acid Composition
37
73(c
) Mar
k G
erst
ein,
199
9, Y
ale,
bio
info
.mbb
.yal
e.ed
u
Large-scale Datamining
• Gene Expression◊ Representing Data in a Grid◊ Description of function prediction in abstract context
• Unsupervised Learning◊ clustering & k-means◊ Local clustering
• Supervised Learning◊ Discriminants & Decision Tree◊ Bayesian Nets
• Function Prediction EX◊ Simple Bayesian Approach for Localization Prediction