Bioinformatics 2007 Dyer i159 66
8
Vol. 23 ISMB/ECCB 2007, pages i159–i166 BIOINFOR MATICS doi:10.1093/ bioinformatics /btm208 Computational prediction of host-pathogen protein–protein interactions Matthew D. Dyer 1,2, * , T. M. Murali 3 and Bruno W. Sobral 2 1 Genetics, Bioinformatics and Computational Biology Program, 2 Virginia Bioinformatics Institute and 3 Department of Computer Science, Virginia Polytechnic Institute and State University, Blacksburg, VA 24061, USA ABSTRACT Motivation: Infectious diseases such as malaria result in millions of deaths each year. An important aspect of any host-pathogen system is the mechani sm by whi ch a pat hog en can infec t its host . One method of infection is via protein–protein interactions (PPIs) where pathogen proteins target host proteins. Developing computational methods that identify which PPIs enable a pathogen to infect a host has great implications in identifying potential targets for therapeutics . Results: We present a method that integrates known intra-species PPIs with protein-domain profiles to predict PPIs between host and pathogen proteins. Given a set of intra-species PPIs, we identify the functional domains in each of the interacting proteins. For every pair of func tional doma ins, we use Bayesian statis tics to asses s the probability that two proteins with that pair of domains will interact. We apply our method to the Homo sapiens – Plasmodium falciparum host -pat hogen system. Our syst em predi cts 516 PPIs between proteins from these two organisms. We show that pairs of human proteins we predict to interact with the same Plasmodium protein are close to each other in the human PPI network and that Plasmodium p ai rs p re di cte d to in te r ac t wi th sa me h um an p ro te in ar e co-expressed in DNA microarray datasets measured during various stages of the Plasmodium life cycle. Finally, we identify functionally enriched sub-networks spanned by the predicted interactions and discuss the plausibility of our predictions. Availability: Suppl emen tary data are avai lable at http://staff.vbi. vt.edu/dyer md/publications /dyer2007a.h tml Contact: [email protected] Supplementary information: Supplementary data are available at Bioinformatics online. 1 INTRODUCTION Infectious dis eas es res ult in millions of deaths each year. Millions of dollars are spent annually to better understand how pathogens infect their hosts and to identify potential targets for therapeutics. For example, the parasite Plasmod ium falciparum is responsible for the most severe form of malaria. Each year there are an estimated 300–500 million clinical cases of malaria resu lting in $1.5–2.7 million deaths. Alt hou gh mal ari a is a dange rous infectio us disea se, there is curr ently no effect ive vaccin e for it. Acqui red parasite resista nce has made sever al drugs obsolete. Additionally, preventative drugs that reduce the risk of infection are often too expensive for people living in infected areas (Kooij et al ., 2006). An imp ortant aspect of any host- pat hog en system is the mechanism by which a pathogen infects its host. Host-pathogen protein–protein interactions (PPIs) play a vital role in initiating infection. Surface proteins and molecules form the foundation of communication between a host and pathogen. An example in Plasmodium are mero zoite surface proteins (MSP1s). MSP1s allow the parasite to invade a red blood cell (RBC) (Kauth et al ., 2006). Ide nti fyi ng whi ch PPI s enable a pat hog en to in vade it s ho st pr ov id es us wi th po te n ti a l targ et s f or therapeutics. Unfo rtuna tely, resources for study ing inter action s betwe en host and pathogen proteins are very limited. High-throughput exp eri mental scr eens have bee n pri mar ily used to detect intra -spe cies PPIs (Gavi n et al ., 2002; Gi ot et al ., 2003; Ho et al ., 2002; Ito et al ., 2000, 2001; Li et al ., 2004; Rual et al ., 2005; Stelzl et al ., 2005; Uetz et al ., 2000). A wide range of computational methods have been developed to predict PPIs wit hin a sin gle org ani sm. Ini tial met hod s use d seq uen ce– si gnat ur e pairs (Spr inzak and Margal it , 2001), pr ot ei n domain profiles (Kim et al ., 2002; Ng et al ., 2003) and sequence homo logy (Yu et al ., 2004) to pr edict PPIs . More rece nt techn ique s have integrate d a numb er of funct ional genomic data types such as gene expression and knockout phenotype and used sophisticated machine-learning frameworks, such as Bayesian networks (Jansen et al ., 2003), decision trees (Zhang et al ., 2004), ran dom for ests and support vector mac hin es (Qi et al ., 2006) to predict PPIs. As far as we know, no systemat ic me thods have be en reported for predicting physical interactions between host and pathogen proteins. Computational prediction of such interac- tions is an important unsolved problem, which is made difficult by two factors. First, experimental studies test a small number of such PPIs at a time. Only recently have efforts started to col lat e known hos t-p athoge n PPIs int o a compre hensive publicly available database (Joshi-Tope et al ., 2005). Second, a number of data types used to train the previously mentioned metho ds, such as gene expr ession and knockout pheno types , are not available for hos t-path oge n sys tems. For exa mpl e, simu ltane ous gene expre ssio n measu reme nt of both host and pathogen upon infection are very rarely available. In this study, we integrate a number of public intra-species PPI datasets with protein–domain profiles to develop a novel fra mework for pr edi cti ng and stu dyi ng hos t-path ogen PPI net wor ks . We use intra- spe cie s PPIs and pr ote in– domain profiles to compute statistics on how often proteins containing speci fic pairs of domains interac t. We use these statistic s to *To whom correspondence should be addressed. ß 2007 The Author(s) This is an Open Access article distributed under the terms of the Creative Commons Attribution Non-Commercial License ( http://creativecommons.org/licenses/ by-nc/2.0/uk/) which permits unrestricted non-commercial use, distribution, and reproduction in any medium, provided the original work is properly cited. a t H u n a n U i v e r s i t y o n A p r i l 3 , 2 0 1 2 h t t p : / / b i o i n f o r m a t i c s . o x f o r d j o u r n a l s . o r g / D o w n l o a d e d f r o
-
Upload
nguyen-hoang-tu -
Category
Documents
-
view
225 -
download
0
Transcript of Bioinformatics 2007 Dyer i159 66

8/2/2019 Bioinformatics 2007 Dyer i159 66
http://slidepdf.com/reader/full/bioinformatics-2007-dyer-i159-66 1/8
Vol. 23 ISMB/ECCB 2007, pages i159–i166
BIOINFORMATICS doi:10.1093/bioinformatics/btm208
Computational prediction of host-pathogen
protein–protein interactions
Matthew D. Dyer1,2,*, T. M. Murali3 and Bruno W. Sobral2
1Genetics, Bioinformatics and Computational Biology Program, 2 Virginia Bioinformatics Institute and3Department of Computer Science, Virginia Polytechnic Institute and State University, Blacksburg,
VA 24061, USA
ABSTRACT
Motivation: Infectious diseases such as malaria result in millions of
deaths each year. An important aspect of any host-pathogen system
is the mechanism by which a pathogen can infect its host. One
method of infection is via protein–protein interactions (PPIs) where
pathogen proteins target host proteins. Developing computational
methods that identify which PPIs enable a pathogen to infect a host
has great implications in identifying potential targets for therapeutics.
Results: We present a method that integrates known intra-species
PPIs with protein-domain profiles to predict PPIs between host and
pathogen proteins. Given a set of intra-species PPIs, we identify the
functional domains in each of the interacting proteins. For every pair
of functional domains, we use Bayesian statistics to assess the
probability that two proteins with that pair of domains will interact.
We apply our method to the Homo sapiens – Plasmodium falciparum
host-pathogen system. Our system predicts 516 PPIs between
proteins from these two organisms. We show that pairs of human
proteins we predict to interact with the same Plasmodium protein are
close to each other in the human PPI network and that Plasmodium
pairs predicted to interact with same human protein are
co-expressed in DNA microarray datasets measured during various
stages of the Plasmodium life cycle. Finally, we identify functionally
enriched sub-networks spanned by the predicted interactions anddiscuss the plausibility of our predictions.
Availability: Supplementary data are available at http://staff.vbi.
vt.edu/dyermd/publications/dyer2007a.html
Contact: [email protected]
Supplementary information: Supplementary data are available at
Bioinformatics online.
1 INTRODUCTION
Infectious diseases result in millions of deaths each year.
Millions of dollars are spent annually to better understand how
pathogens infect their hosts and to identify potential targets for
therapeutics. For example, the parasite Plasmodium falciparum
is responsible for the most severe form of malaria. Each yearthere are an estimated 300–500 million clinical cases of malaria
resulting in $1.5–2.7 million deaths. Although malaria is a
dangerous infectious disease, there is currently no effective
vaccine for it. Acquired parasite resistance has made several
drugs obsolete. Additionally, preventative drugs that reduce the
risk of infection are often too expensive for people living in
infected areas (Kooij et al ., 2006).
An important aspect of any host-pathogen system is the
mechanism by which a pathogen infects its host. Host-pathogen
protein–protein interactions (PPIs) play a vital role in initiating
infection. Surface proteins and molecules form the foundation
of communication between a host and pathogen. An example in
Plasmodium are merozoite surface proteins (MSP1s). MSP1s
allow the parasite to invade a red blood cell (RBC) (Kauth
et al ., 2006). Identifying which PPIs enable a pathogen to
invade its host provides us with potential targets for
therapeutics.
Unfortunately, resources for studying interactions between
host and pathogen proteins are very limited. High-throughput
experimental screens have been primarily used to detect
intra-species PPIs (Gavin et al ., 2002; Giot et al ., 2003;
Ho et al ., 2002; Ito et al ., 2000, 2001; Li et al ., 2004; Rual
et al ., 2005; Stelzl et al ., 2005; Uetz et al ., 2000). A wide range
of computational methods have been developed to predict PPIs
within a single organism. Initial methods used sequence–
signature pairs (Sprinzak and Margalit, 2001), protein
domain profiles (Kim et al ., 2002; Ng et al ., 2003) and sequence
homology (Yu et al ., 2004) to predict PPIs. More recent
techniques have integrated a number of functional genomic
data types such as gene expression and knockout phenotypeand used sophisticated machine-learning frameworks, such as
Bayesian networks (Jansen et al ., 2003), decision trees (Zhang
et al ., 2004), random forests and support vector machines
(Qi et al ., 2006) to predict PPIs.
As far as we know, no systematic methods have been
reported for predicting physical interactions between host and
pathogen proteins. Computational prediction of such interac-
tions is an important unsolved problem, which is made difficult
by two factors. First, experimental studies test a small number
of such PPIs at a time. Only recently have efforts started to
collate known host-pathogen PPIs into a comprehensive
publicly available database (Joshi-Tope et al ., 2005). Second,
a number of data types used to train the previously mentioned
methods, such as gene expression and knockout phenotypes,are not available for host-pathogen systems. For example,
simultaneous gene expression measurement of both host and
pathogen upon infection are very rarely available.
In this study, we integrate a number of public intra-species
PPI datasets with protein–domain profiles to develop a novel
framework for predicting and studying host-pathogen PPI
networks. We use intra-species PPIs and protein–domain
profiles to compute statistics on how often proteins containing
specific pairs of domains interact. We use these statistics to*To whom correspondence should be addressed.
ß 2007 The Author(s)This is an Open Access article distributed under the terms of the Creative Commons Attribution Non-Commercial License ( http://creativecommons.org/licenses/ by-nc/2.0/uk/) which permits unrestricted non-commercial use, distribution, and reproduction in any medium, provided the original work is properly cited.
8/2/2019 Bioinformatics 2007 Dyer i159 66
http://slidepdf.com/reader/full/bioinformatics-2007-dyer-i159-66 2/8
predict inter-species PPIs in host-pathogen systems. Since gold-
standard datasets of experimentally verified host-pathogen
PPIs are not readily available, we develop three computational
tests to assess the validity of our predictions:
(1) We identify pairs of host proteins that we predict to
interact with the same pathogen protein and measure the
distance between the host proteins in the host PPI
network. We compute the distribution of these distances
over all predicted interactions. We compute a similar
distribution of distances in the pathogen PPI network
between pairs of pathogen proteins we predict to interact
with the same host protein.
(2) We select DNA microarray datasets measuring gene
expression during various stages in the parasite’s life cycle
and in host cells infected by the parasite. For pairs of host
proteins defined as in the distance analysis, we compute
distributions of the Spearman’s correlation between the
expression profiles of the proteins in a pair. We compute
similar distributions for pairs of pathogen proteins.
(3) We compute pairs of Gene Ontology (GO) (Ashburner
et al ., 2000) functions (one function annotating hostproteins and the other annotating pathogen proteins)
that are enriched in our predicted network.
We predict a total of 516 interactions with a probability of at
least 0.50 in the H.sapiens – P.falciparum system (henceforth
referred to as human– Plasmodium). We show that human
protein pairs we predict to interact with the same Plasmodium
protein are close to each other in the human PPI network,
indicating that they are likely to be involved in similar
biological processes. Additionally, Plasmodium pairs predicted
to interact with same human protein are co-expressed in DNA
microarray datasets measured during various stages of the
Plasmodium life cycle. Finally, we identify functionally enriched
subnetworks in our predicted network and discuss theirbiological significance. For example, we identify a subnetwork
connecting human proteins involved in blood coagulation to
Plasmodium that are ‘integral to membrane’. This subnetwork
contains malaria proteins known to be involved in patho-
genesis. Additionally, our analysis finds enriched subnetworks
that cover 10 of the 15 GO functions listed by Ockenhouse et al .
(2006) that were enriched in genes up-regulated in individuals
infected with malaria. These results demonstrate that we indeed
identify plausible PPIs between human and P.falciparum
proteins.
2 METHODS
We adapt the sequence–signature algorithm presented by Sprinzak andMargalit (2001) to predict inter-species PPIs and to calculate the
probability of each prediction. After describing the method in detail, we
present the three tests we have developed to assess the validity of our
predictions.
2.1 Using protein–domain profiles to predict PPIs
We start with a set of intra-species PPIs and the domains present in
each of the interacting proteins. For every pair of functional
domains a and b, we use Bayesian statistics to assess the probability
that two proteins, one containing domain a and the other containing
domain b, will interact. We use these domain-pair statistics to predict
interactions between host proteins and pathogen proteins and to
combine predictions for a single host-pathogen protein pair stemming
from distinct domain pairs.
We first introduce some notation. Let Dð g; d Þ denote the event that
protein g contains domain d and I ð g; hÞ be the event that proteins g
and h interact. We use Prf g; hjd ; eg to denote the probability that
proteins g and h interact given that g contains domain d and h containsdomain e, and Prfd ; ej g;hg to denote the probability protein g contains
domain d and protein h contains domain e given that g and h interact.
We use Bayes rule to compute Prf g;hjd ; eg.
Prf g;hjd ; eg ¼Prfd ; ej g; hg PrfI ð g; hÞg
PrfDð g; d Þ; Dðh; eÞgð1Þ
Let P be the set of proteins with at least one domain and at least one
interaction and let Pd be the subset of proteins in P that contain domain
d . Let S be the set of interactions between pairs of proteins in P and let
S d ,e be the subset of S where one protein contains d and the other
contains e.
For every pair of domains d and e (d and e may be identical), we
estimate each of the probabilities on the right hand side of (1) from
data. Prfd ;
ej g;
hgis the fraction of interactions where one protein
contains domain d and the other contains domain e:
Prfd ; ej g; hg ¼jS d ;ej
jS j
PrfI ð g; hÞg represents the probability that a pair of proteins interact,
which can be computed as the number of known interactions divided by
the total number of possible interactions:
PrfI ð g; hÞg ¼jS jjPj2
À Á
Here we use jPj2
À Á, rather than jPj2, to avoid counting self-interacting
proteins. Finally, PrfDð g; d Þ;Dðh; eÞg is the probability that if we choose
two proteins, one will contain domain d and the other domain e. We
can estimate this probability as follows, with a correction to account for
the situation when the same protein contains both domains:
PrfDð g; d Þ;Dðh; eÞg ¼jPd jjPej À jPd \ Pej
jPj2
À Á
Substituting each of these estimates back into (1) we get the
following:
Prf g; hjd ; eg ¼jS d ;ej
jPd jjPej À jPd \ Pej
Multiple pairs of domains may predict that the same pair of proteins
interact. We integrate all these predictions, assuming that they are
independent. Denoting by M g the set of domains contained in protein g,
we have
PrfI ð g;hÞg ¼ 1 ÀY
d 2M g
Y
e2M h
ð1 À Prf g; hjd ; egÞ ð2Þ
In this article, we do not correct for situations where multiple
domains occur in a correlated manner in interacting proteins. Our
analysis indicates that statistics on co-occurrence of more than two
domains in interacting proteins are currently too sparse to be useful
(data not shown).
To apply these ideas to a host-pathogen system, we use
InterProScan (Quevillon et al ., 2005) to identify domains in each host
and pathogen protein. For every pair of host and pathogen proteins
that contain at least one domain, we use (2) to estimate the
probability that the proteins interact. We discard all predictions
M.D.Dyer et al.
i160

8/2/2019 Bioinformatics 2007 Dyer i159 66
http://slidepdf.com/reader/full/bioinformatics-2007-dyer-i159-66 3/8
where PrfI ð g; hÞg < 0:5. Let G be the resulting weighted bipartite graph
of predicted interactions.
2.2 Proximity in intra-species PPI networks
Since a protein’s function is governed by the other proteins it interacts
with and by its indirect neighbors, we asked if two host proteins that we
predict to interact with the same pathogen protein are close to each
other in the host PPI network. Specifically, for each triplet ð g; h; pÞ in Gwhere we predict that the host proteins g and h interact with pathogen
protein p, we compute the length of the shortest path between g and h in
the host PPI network. We plot distributions of these triplet distances.
We expect that there should be a negative correlation between the
number of such pairs at a particular distance and the distance itself.
This result would be significant because the closer g and h are in the
host PPI network, the more likely they are to share a similar function.
We plot similar distributions for all triplets ðh; p;qÞ in G where we
predict that the host protein h interacts with pathogen proteins p and q.
2.3 Correlated gene expression
A number of papers have demonstrated that interacting proteins in the
same organism tend to have correlated gene expression
patterns (Grigoriev, 2001; Jansen et al ., 2002). We reasoned that
proteins we predict to interact should show similar behavior. However,
available gene expression datasets measure expression in either the host
or the pathogen but not in both simultaneously. Therefore, we consider
triplets ðh; p; qÞ in G where we predict that the host protein h interacts
with pathogen proteins p and q. We ask if the gene expression profiles
of p and q are correlated. We plot the distribution of the Spearman’s
correlation coefficient of the expression profiles of p and q. We plot
similar distributions for all triplets ð g; h; pÞ, where we predict that host
proteins g and h interact with pathogen protein p.
2.4 Functionally enriched subnetworks
We further assess the quality of our predictions by measuring the
functional coherence of the predicted network. We find pairs of
functions such that proteins annotated with the functions in the GO
have a surprisingly large number of predicted interactions. Thehypergeometric distribution is often used to identify which biological
attributes are enriched in a subset of genes of interest. However, when
applied to our context, this distribution cannot take into account the
probability we associate with each predicted interaction. Therefore,
we apply the procedure described subsequently.
Given a pair of GO functions c and d , let Gc,d be the subgraph of G
induced by the host proteins annotated with c and pathogen proteins
annotated with d . We define the weight wc,d of Gc,d as the sum of the
probabilities of the interactions in Gc,d . We assess the statistical
significance of wc,d as follows. Let k (respectively, l ) be the number of
host (respectively, pathogen) proteins in G annotated with the
function c (respectively, d ). We ask the following question: over all
possible ways of selecting k host proteins and l pathogen proteins, what
fraction of choices will induce a subgraph of G whose weight is at
least wc,d ? We set this fraction to be the P-value Pc,d of the pair of functions ðc;d Þ.
To assess Pc,d , we generate multiple random sets of functional
annotations for all host and pathogen proteins. For each random set of
annotations, we compute the weight of the subgraph of G induced by
the host proteins randomly annotated with c and the pathogen proteins
randomly annotated with d . Since functions in GO are specified at
multiple levels of detail, annotations must obey the true path rule, i.e. a
gene annotated with a function c is also annotated with all ancestors
of c. Therefore, we ensure that each random set of annotations also
satisfies the true path rule. We first apply the true path rule to the
annotations. To generate a random set of annotations for host
(respectively, pathogen) proteins, we randomly select a pair of host
(respectively, pathogen) proteins and swap the sets of functions
annotating them. We repeat this process for multiple pairs of proteins.
This procedure is a modification of well-known methods for graph
randomization applied to bipartite graphs (e.g. Sharan et al ., 2005).
We apply these steps to every pair of functions in GO and retain only
those pairs ðc; d Þ for which Pc;d 0:05. Since functions in GO arespecified at multiple levels of detail, the set of enriched function pairs
may contain closely related pairs of functions. We use the following
criteria to collapse the enriched pairs to the most specific and most
enriched function pairs. From the set of all enriched pairs, we remove a
pair of functions ð f ; gÞ if there is another pair of enriched
functions ðl ; mÞ such that
(1) Pl ;m < P f ; g i.e. ðl ; mÞ is more statistically significant than ð f ; gÞ,
(2) l is either an ancestor or a descendant of f , and
(3) m is either an ancestor or a descendant of g.
See Figure 1 for an example.
2.5 Datasets used
We downloaded all data used in this study in July 2006, except for the
gene expression data, which we obtained in December 2006.
2.5.1 Genomic information We use the UniProt
database (Bairoch et al ., 2005) as a source for protein sequence
information. We use InterProScan (Quevillon et al ., 2005) as our
method for determining protein-domain profiles. We obtain functional
annotations from GO (Ashburner et al ., 2000).
2.5.2 Protein-protein interaction data We gather human, fly,
and Plasmodium PPIs from five databases: the Biomolecular Interaction
Network Database (Gilbert, 2005), the Database of Interacting
Proteins (Salwinski et al ., 2004), IntAct (Hermjakob et al ., 2004), the
Munich Information Center for Protein Sequences (Guldener et al .,
2006) and REACTOME (Joshi-Tope et al ., 2005). After removing
duplicate interactions and self interactions, we obtain a total of 39 207human, 18 412 fly and 2643 Plasmodium interactions.
2.5.3 Gene expression profiles We consider a number of gene
expression datasets for the triplet co-expression analysis. These datasets
are available from NCBI’s GEO (Edgar et al ., 2002) and from
previously published studies.
All the Plasmodium expression datasets focus on merozoite invasion
of human RBCs. Bozdech et al . (2003) and Le Roch et al . (2003)
measure time courses of gene expression during the intra-erythrocytic
life cycle within the RBC. These two datasets contain 46 samples and
Fig. 1. An illustration of two enriched pairs of functions (l , m) and ( f , g)
where l is an ancestor of f and m is an ancestor of g. Dashed lines denote
paths between functions in GO defined by parent-child relationships
between them.
Computational prediction of host-pathogen protein–protein interactions
i161

8/2/2019 Bioinformatics 2007 Dyer i159 66
http://slidepdf.com/reader/full/bioinformatics-2007-dyer-i159-66 4/8
17 samples, respectively. The dataset published by Le Roch et al . (2003)
contains two time courses each with seven samples where cells are
synchronized under different conditions. The last three samples
measure expression within gametocytes and sporozoites which are
important during the mosquito and initial human infection stages of the
Plasmodium life cycle. We did not consider datasets that contained very
small numbers of samples (Baum et al ., 2005; Stubbs et al ., 2005).
The human datasets measure gene expression by isolating peripheral
blood mononuclear cells (PBMCs) from individuals. The unpublishedBoldt et al . dataset (GEO series GSE1124) contains 15 samples from
Gabonese children that are either healthy or show uncomplicated or
severe symptoms of malaria. The Ockenhouse et al . (2006) dataset
measures 71 expression profiles from people who are either experimen-
tally or naturally infected with malaria.
3 RESULTS
We apply our method to the human-Plasmodium host–
pathogen system. As a negative control, we also predict PPIs
for the hypothetical fly– Plasmodium host-pathogen system.
In order to focus our predictions on Plasmodium proteins likely
to be involved in pathogenesis, we generate our training set of
proteins and PPIs as follows.
(1) We remove Plasmodium proteins annotated with mito-
chondria, nucleus, ribosome, cell process, helicase activ-
ity, complex, nuclease activity, nucleic acid binding or
nucleotide binding. We also remove human and fly
proteins annotated with ribosome, nucleic acid binding,
nucleotide binding, nucleoside binding or proteolysis.
(2) We add Plasmodium proteins annotated with subtilisin
activity, dense granule, hemoglobin metabolism, protein
folding, polymerization, cell–cell communication or cell
death, as well as human and fly proteins annotated with
blood coagulation, cell–cell communication, protein
folding, polymerization or cell death. We add these
proteins even if they were removed in the previous step.
(3) We remove proteins that do not participate in any PPIs.
Q53EP3
Q8IDW0
O97227
Q8IL09
Q9NYG6 Q76NM8
CRYAB
CDPK4CDPK3
CDPK1
CDPK2
CDC2H
KC1
Q96C20
HSPB1
Q6I9U7
Q53X53
CRYAA
Q96EI7
Q6FIH3
HSPB7
HSPB6Q8N241
HSPB8
Q5T5Q2
Q13684
Q68DG0Q6ICS9
Q5T5Q0
Q71V83
HSPB2
Q6NVI3
KLKB1Q8IAS3
Q8I339
ODB2
ODP2
ODO2
TRAF2
ODPB
TRAF1
ODBB
ODO1
ODPX
Q96LE1
UROK
Q6P0Y5
Q6LFK3
Q8IK89
Q8ILA7
Q8I2U2
Q8I1Q3
Q7Z7P3
Q8IAL6
SMD1
SMD2
Q6P4I0
SMD3
Q01991
Q6LEY3
TRAF5
Q6AZX1
Q6FHY1
TRAF3
TRAF6
Q5T1L5
Q86YI5
CDN1C
Q6LBS1
Q15182
Q8NCT0
Q6GTN4
Q6FGG1
HGFL
Q53EM5
Q68CU5
Q8I489
Q8I2E1
O96282
O96123
Q9U0J2
Q8IL88
Q96TE0 CCNF
Q9UIS4
CDN1B
Q6IB35
Q658U1
Q5VVL8Q53H06
Q96HY7
Q2KJU4
Q8TC75
Q96LZ0
Q5BKT2
Q6IBQ1
Q6IB86
Q5VYJ4
Q9BRA0
Q49AN9
O75243
Q6PKB4
Q53HE7
Q5XPV6
Q66K91
Q6IAH0Q4W5J5
Q8N4M0
Q7Z5A3 Q86XF3
Q9NVA0
PROZ
PROC
FA10
FA9
FA7
Q5JVF1
PLMN
Q96M82
Q9BQL0
Q8TAN9
Q708J1
Q16187
FA12
Q8I5T9
86YI5_HUMAN
Q5T1L6
Q6IBS5
Q5JVF5
Q5H9M3 Q9UDX0
Q7Z337
CDN1A
Q8ND81
Q2KJU6
Q9HCE2
Q6FI05
Q7LDY7
Q86TW7
Q86SW4
Q5VVL7
Q16791
Q6LCK9
Q6I9V6
Q5TYJ8
TKT2
Q5TYJ9
Q9H0I9
Q9BUM8
Q9ULD0TKT
FA11
Q53GN8
Q4W5C3
Q5TEH4
Q13208
Q4W5C2
Q8IES0
Q8IB02
Q5FBE1
Q4QZ40
Q5U0H2
Q53H04
Q5JVF6
O43806
Q2KJU3
Q59ED0
TRI37
Q5JYJ8THRB
Q5JVE7
TPA
Fig. 2. A layout of the predicted human– Plasmodium PPI network. (Purple) Ovals are Plasmodium proteins. Rectangles are human proteins. Green
rectangles are human protein with known interactions with other human proteins. Solid (red) edges are predicted PPIs. Dashed blue edges connect
human protein interactors. Dotted blue edges connect human proteins at a distance of two in the human PPI network.
M.D.Dyer et al.
i162
8/2/2019 Bioinformatics 2007 Dyer i159 66
http://slidepdf.com/reader/full/bioinformatics-2007-dyer-i159-66 5/8
(4) For every domain, we count the number of proteins in
which the domain occurs. We consider a domain to be
infrequent if it occurs in less than four proteins. We
remove all proteins that contain only uncommon
domains. We also ignore the presence of an uncommon
domain in the remaining proteins.
In the training set, we include an interaction only if we have
retained both the interactors after these steps. Finally, we have
a training set with 4177 human PPIs spanning 2196 human
proteins, 9384 fly PPIs spanning 3864 fly proteins, and 127
Plasmodium PPIs spanning 120 Plasmodium proteins. We create
the set of proteins for prediction by applying only steps (1), (2)
and (4). We obtain a universe of 27 371 human proteins, 11 924
fly proteins and 938 Plasmodium proteins on which to make
predictions.
We predict 516 human– Plasmodium PPIs with a probability
of at least 0.50. These predictions involve 158 human proteins
and 30 Plasmodium proteins. Figure 2 displays a layout of this
network. We predict 44 fly– Plasmodium PPIs with a probabilityof at least 0.50. These predictions involve 29 fly proteins and
8 Plasmodium proteins. No malaria proteins participate in both
predicted networks. Table 1 displays the number of PPIs we
predict for different ranges of probabilities. The marked
difference in the number of PPIs predicted for the two systems
suggest that our methodology indeed identifies plausible
interactions between host and pathogen proteins.
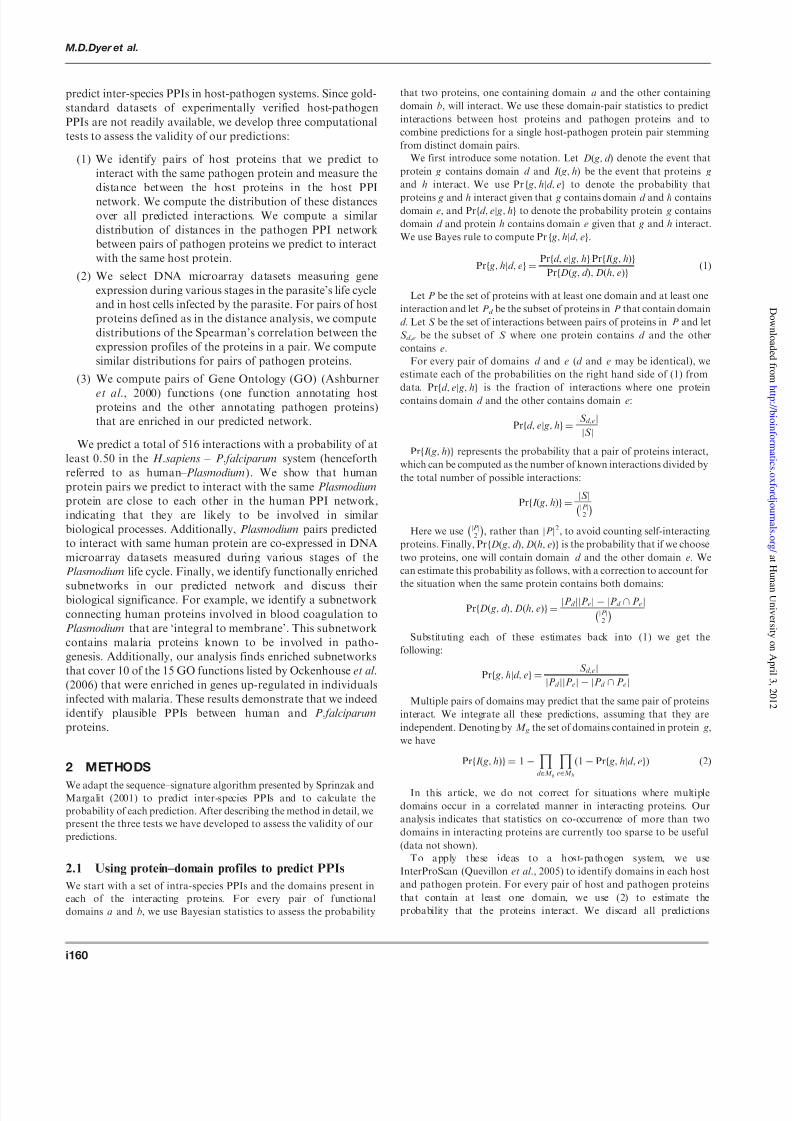
3.1 Triplet proximity in PPI networks
In the human–Plasmodium network, we use the phrase ‘H-H-P
triplet’ to refer to two human proteins predicted to interact with
the same Plasmodium protein. Similarly, we use the phrase
‘H-P-P triplet’ to refer to a human protein predicted to interactwith two Plasmodium proteins. We compute the fraction of
triplets such that the two human proteins are a distance k apart
in the human PPI network, for different values of k ! 1. Note
that this network contains all 39 207 interactions between
human proteins. Figure 3 displays these distributions for
H-H-P triplets.
Of the 158 human proteins predicted to interact with
Plasmodium proteins, only 31 have known interactions in the
human PPI network. There are a total 582 H-H-P triplets and
31 H-P-P triplets. Figure 3 demonstrates that as many as
72% of human protein pairs in H-H-P triplets are at a distance
of two or less in the human PPI network. Thus our predictionsare likely to connect human proteins with functional relation-
ships. The average distance between Plasmodium proteins in
H-P-P triplets is 5.5 (data not shown), probably because
the Plasmodium PPI network is sparse and contains only
2643 interactions. For the fly– Plasmodium predictions, we have
30 H-H-P triplets and 5 H-P-P triplets. These counts are too
small for us to draw any conclusions.
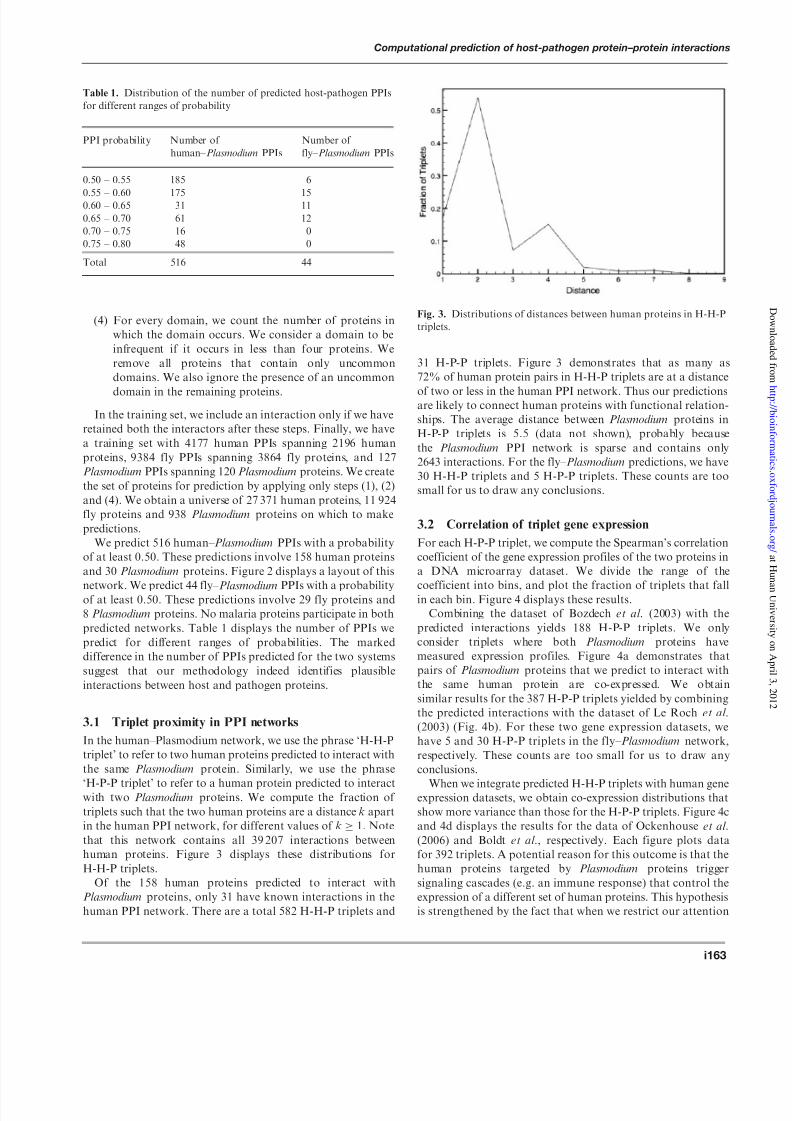
3.2 Correlation of triplet gene expression
For each H-P-P triplet, we compute the Spearman’s correlation
coefficient of the gene expression profiles of the two proteins in
a DNA microarray dataset. We divide the range of the
coefficient into bins, and plot the fraction of triplets that fallin each bin. Figure 4 displays these results.
Combining the dataset of Bozdech et al . (2003) with the
predicted interactions yields 188 H-P-P triplets. We only
consider triplets where both Plasmodium proteins have
measured expression profiles. Figure 4a demonstrates that
pairs of Plasmodium proteins that we predict to interact with
the same human protein are co-expressed. We obtain
similar results for the 387 H-P-P triplets yielded by combining
the predicted interactions with the dataset of Le Roch et al .
(2003) (Fig. 4b). For these two gene expression datasets, we
have 5 and 30 H-P-P triplets in the fly– Plasmodium network,
respectively. These counts are too small for us to draw any
conclusions.
When we integrate predicted H-H-P triplets with human geneexpression datasets, we obtain co-expression distributions that
show more variance than those for the H-P-P triplets. Figure 4c
and 4d displays the results for the data of Ockenhouse et al .
(2006) and Boldt et al ., respectively. Each figure plots data
for 392 triplets. A potential reason for this outcome is that the
human proteins targeted by Plasmodium proteins trigger
signaling cascades (e.g. an immune response) that control the
expression of a different set of human proteins. This hypothesis
is strengthened by the fact that when we restrict our attention
Table 1. Distribution of the number of predicted host-pathogen PPIs
for different ranges of probability
PPI probability Number of
human– Plasmodium PPIs
Number of
fly– Plasmodium PPIs
0.50 – 0.55 185 6
0.55 – 0.60 175 150.60 – 0.65 31 11
0.65 – 0.70 61 12
0.70 – 0.75 16 0
0.75 – 0.80 48 0
Total 516 44
Fig. 3. Distributions of distances between human proteins in H-H-P
triplets.
Computational prediction of host-pathogen protein–protein interactions
i163
8/2/2019 Bioinformatics 2007 Dyer i159 66
http://slidepdf.com/reader/full/bioinformatics-2007-dyer-i159-66 6/8
to H-H-P triplets involving human proteins known to be
localized to the cell surface or the plasma membrane, we obtain
distributions similar to those in Figure 4c and d (data not
shown).
3.3 Functionally enriched subnetworks
To compute pairs of enriched functions in the predicted
networks, we generate 1 000000 random sets of human and
Plasmodium GO annotations. We discard all pairs of functions
whose P-value is greater than 0.05. After collapsing the
remaining enriched pairs, we remove any pairs in which at
least one function has a depth less than three in the GO
hierarchy. (We measure the depth of a function as the length of the shortest path to the root of the category the function
belongs to.)
We identify 39 enriched pairs of GO functions in the
predicted human– Plasmodium network and none in the
fly– Plasmodium network after a Bonferroni correction.
(The list of pairs of enriched functions is available on our
Supplementary.) Ockenhouse et al . (2006) report that genes
up-regulated in individuals infected with malaria are enriched
in 15 GO terms. In our analysis, we are able to identify 10 of
these functions in enriched pairs before collapsing: apoptosis,
immune response, inflammatory response, intracellular protein
transport, mitochondrion, nuclear mRNA splicing, protein
folding, regulation of apoptosis, regulation of transcription and
ubiquitin cycle.
Before discussing the functionally enriched subnetworks in
detail, we briefly review the life cycle of P.falciparum .
Malaria infection spreads by the parasite’s ability to infect
human hosts and the Anopheles mosquito. When an
infected mosquito bites a human, it injects malaria sporozoites
into the host’s blood system. The parasites subsequently
invade liver cells. Within hepatic cells, the parasite undergoes
schizogony, or asexual reproduction, to form exo-erythrocyticmerozoites. These merozoites are released into the blood
stream where they invade host erythrocytes (red blood
cells or RBCs). Once inside an erythrocyte, the parasite
undergoes rapid multiplication. During this development,
the parasite first metamorphoses into the ring stage. On further
development, it becomes a trophozoite and begins feeding
on the host hemoglobin. Subsequently, through asexual
reproduction, a trophozoite forms a schizont that gives rise
to several merozoites. These intracellular merozoites escape from
Fig. 4. Distributions of Spearman’s correlations for the triplet co-expression analysis.
M.D.Dyer et al.
i164
8/2/2019 Bioinformatics 2007 Dyer i159 66
http://slidepdf.com/reader/full/bioinformatics-2007-dyer-i159-66 7/8
the erythrocyte when it is burst to subsequently infect new
erythrocytes and continue this erythrocytic life cycle.
During its life within the host RBC, the malaria parasite has
specialized mechanisms for causing physical changes to the
RBC (Hiller et al ., 2004). Pf EMP1s are exported to the RBC
surface where they cause the RBC to become sticky and adhere
to the endothelial lining in the capillaries and additional
uninfected RBCs through a process known as rosetting. Thebuild-up results in circulatory blocking, which restricts the flow
of oxygen.
Our analysis finds an enriched subnetwork between human
proteins annotated with ‘blood coagulation’ and malaria
proteins annotated with ‘integral to membrane’ (P-value
3 Â 10À6). This network includes predicted interactions between
Q8IAS3, a known Pf EMP1, and several human proteins
involved in blood coagulation. One of the predicted interacting
partners of Q8IAS3 is plasminogen (Q5TEH4), which is
involved in the degradation of many blood plasma proteins.
An important step in the release of malaria merozoites from
infected erythrocytes is the activation of plasminogen
(Roggwiller et al ., 1997). Q8IAS3 is highly expressed during
the erythrocytic life cycle (Stoeckert et al ., 2006). Our analysispredicts that pf EMP1 might interact with host plasminogen to
promote the degradation of RBCs. Additional predicted
partners of Q8IAS3 include hepatocyte growth factors
(HGFs). During the liver stages of the Plasmodium life cycle,
there is a required induction of HGFs for hepatocyte invasion
(Carrolo et al ., 2003). Thus, our prediction suggests that
Q8IAS3 may also play a key role in hepatic cell invasion by
triggering the activation of HGFs.
Platelets are tiny cells in the blood that are important for
clotting. Other symptoms of malaria infection are bleeding
disorders and Thrombocytopenia, which is the presence of
reduced platelet counts and dysfunctional platelets. Besides
Q8IAS3, we predict that two additional proteins, Q8IAL6 and
Q8I339, interact with human blood coagulation proteins. Bothproteins are highly expressed throughout erythrocytic life cycle
(Stoeckert et al ., 2006). These two proteins are labeled as
hypothetical. Each contains a transmembrane domain, suggest-
ing that they are localized to the Plasmodium cell surface.
Baruch et al . (1996) showed that mature parasitized RBCs have
an affinity for thrombospondin, which is found in blood
platelets. Our predictions suggest that these two proteins may
play a role in disrupting human blood coagulation pathways.
Given that these two proteins are predicted to interact with
some of the partners of Q8IAS3, they are likely to be members
of the malaria pathogenesis pathway.
Our functional enrichment analysis also identifies ‘subtilase
activity’ and ‘merozoite dense granule’ as functions annotating
Plasmodium proteins that interact with human proteinsinvolved in ‘blood coagulation’ (P-value 1 Â 10À6). The
dense granule is a specialized secretory organelle that excretes a
subtilisin-like protease that plays an important role in RBC
invasion and degradation (O’Donnell and Blackman,
2005;Withers-Martinez et al ., 2004). We predict that Q8IHZ5,
a known subtillisin-like protease, interacts with a number of
blood coagulation proteins, which suggests that it may also be
involved in the degradation of blood platelets. Expression
profiles of this protein show it is highly expressed during the
sporozoite and merozoite stages as well as the later stages of the
erythrocytic life cycle (Stoeckert et al ., 2006). These events
coincide with the stages where malaria enters the RBC and
travels in the blood stream. As in the case of the pathogenesis
proteins, we predict that a hypothetical Plasmodium protein
Q8IKP8 interacts with the predicted partners of Q8IHZ5.
These two proteins have a similar expression pattern (Stoeckert
et al ., 2006) and share a high degree of sequence similarity(Bitscore of 2053) (Altschul et al ., 1997). We predict that
Q8IKP8 may also be a subtilisin-like protein.
4 CONCLUSION
Predicting interactions between host and pathogen proteins is
an unsolved problem with important implications in biomedi-
cine. We have presented an algorithm that integrates protein
domain profiles with interactions between proteins from the
same organism to predict interactions between host and
pathogen proteins. When applied to the human– Plasmodium
system, our method identifies several biologically important
sub-networks that can act as the starting point for therapeutic
development.An important extension to our method is to incorporate
reliability estimates of PPIs detected by high-throughput
screens (Suthram et al ., 2006). There are many Plasmodium
proteins known to be important to the erythrocytic life cycle
(Bairoch et al ., 2005; Baruch et al ., 1996; Biargo et al ., 2003;
Cowman and Crabb, 2006; Hiller et al ., 2004). We predict many
other interactors for both Pf EMP1s and MSP1s but with
probabilities less than 0.50. This observation suggests that
integrating additional data sources into our system may enable
us to predict more PPIs involved in malaria invasion of the host
with increased confidence.
ACKNOWLEDGEMENTS
We thank Dharmendar Rathore for many useful discussions.
This work was supported by Department of Defense grant
#DAAD 13-02-C-0018 to B.S., PI.
Conflict of Interest: none declared.
REFERENCES
Altschul,S.F. et al . (1997) Gapped BLAST and PSI-BLAST: a new generation of
protein database search programs. Nucleic Acids Res., 25, 3389–3402.
Ashburner,M. et al . (2000) Gene Ontology: tool for the unification of biology.
The Gene Ontology consortium. Nat. Genet., 25, 25–29.
Bairoch,A. et al . (2005) The Universal Protein Resource (UniProt). Nucleic Acids
Res., 33, D154–D159.Baruch,D.I. et al . (1996) Plasmodium falciparum erythrocyte membrane 1 is a
parasitized erythrocyte receptor for adherence to CD36, thrombospondin,
and intracellular adhesion molecule 1. Proc. Natl Acad. Sci. USA, 93,
3497–3502.
Baum,J. et al . (2005) Invasion by P. falciparum merozoites suggests a hierarchy of
molecular interactions. PLoS Pathog., 1, e37.
Biargo,C. et a l . (2003) A gene-family encoding small exported proteins
is conserved across Plasmodium genus. Mol. Biochem. Parasitol., 126,
209–218.
Bozdech,Z. et al . (2003) The transcriptome of the intraerythrocytic developmental
cycle of Plasmodium falciparum. PLoS Biol., 1, e5.
Computational prediction of host-pathogen protein–protein interactions
i165
8/2/2019 Bioinformatics 2007 Dyer i159 66
http://slidepdf.com/reader/full/bioinformatics-2007-dyer-i159-66 8/8
Carrolo,M. et al . (2003) Hepatocyte growth factor and its receptor are required
for malaria infection. Nat. Med., 9, 1363–1369.
Cowman,A.F. and Crabb,B.S. (2006) Invasion of red blood cells by malaria
parasites. Cell , 124, 755–766.
Edgar,R. et al . (2002) Gene Expression Omnibus: NCBI gene expression and
hybridization array data repository. Nucleic Acids Res., 30, 207–210.
Gavin,A.-C. et al . (2002) Functional organization of the yeast proteome by
systematic analysis of protein complexes. Nature, 415, 141–147.
Gilbert,D. (2005) Biomolecular Interaction Network Database. Brief.
Bioinformatics, 6, 194–198.Giot, L. et al . (2003) A protein interaction map of Drosophila melanogaster.
Science, 302, 1727–1736.
Grigoriev,A. (2001) A relationship between gene expression and
protein interaction on the proteome scale: analysis of the bacterioph-
age t7 and the yeast Saccharomyces cerevisiae. Nucleic Acids Res., 29,
3513–3519.
Guldener,U. et al . (2006) Mpact: the MIPS protein interaction resource on yeast.
Nucleic Acids Res., 34, D436–D441.
Hermjakob,H. et al . (2004) IntAct: an open source molecular interaction
database. Nucleic Acids Res., 32, D452–D455.
Hiller,N. et al . (2004) A host-targeting signal in virulence proteins reveals a
secretome in malarial infection. Science, 306, 1934–1937.
Ho,Y. et al . (2002) Systematic identification of protein complexes in
Saccharomyces cerevisiae by mass spectrometry. Nature, 415, 180–183.
Ito,T. et al . (2000) Toward a protein-protein interaction map of the budding
yeast: A comprehensive system to examine two-hybrid interactions in all
possible combinations between the yeast proteins. Proc. Natl Acad. Sci. USA,97, 1143–1147.
Ito,T. et al . (2001) A comprehensive two-hybrid analysis to explore the yeast
protein interactome. Proc. Natl Acad. Sci. USA, 98, 4569–4574.
Jansen,R. et al . (2002) Relating whole-genome expression data with protein-
protein interactions. Genome Res., 12, 37–46.
Jansen,R. et al . (2003) A Bayesian networks approach for predicting protein-
protein interactions from genomic data. Science, 302, 449–453.
Joshi-Tope,G. et al . (2005) REACTOME: a knowledgebase of biological
pathways. Nucleic Acids Res., 33, D428–D432.
Kauth,C.W. et al . (2006) Interactions between merozoite surface proteins 1, 6,
and 7 of the malaria parasite Plasmodium falciparum. J. Biol. Chem., 281,
31517–31527.
Kim,W.K. et al . (2002) Large scale statistical prediction of protein-protein
interaction by potentially interacting domain (PID) pair. Genome Inform. Ser.
Workshop Genome. Inform., 13, 42–50.
Kooij,T.W.A. et al . (2006) Plasmodium post-genomics: better the bug you know?
Nat. Rev., 4, 344–357.
Le Roch,K.G. et al . (2003) Discovery of gene function by expression profiling of
the malaria parasite life cycle. Science, 301, 1503–1508.
Li,S. et al . (2004) A map of the interactome network of the metazoan C. elegans.
Science, 303, 540–543.
Ng,S.K. et al . (2003) Integrative approach for computationally inferring protein
domain interactions. Bioinformatics, 19, 923–929.
Ockenhouse,C.F. et al . (2006) Common and divergent immune response signaling
pathways discovered in peripheral blood mononuclear cell gene expression
patterns in presymptomatic and clinically apparent malaria. Infect. Immun.,
74, 5561–5573.O’Donnell,R. and Blackman,M.J. (2005) The role of malaria meroite proteases in
red blood cell invasion. Curr. Opin. Microbiol., 8, 422–427.
Qi,Y. et al . (2006) Evaluation of different biological data and computational
classification methods for use in protein interaction prediction. Proteins, 63,
490–500.
Quevillon,E. et al . (2005) InterProScan: protein domains identifier. Nucleic Acids
Res., 33, W116–W120.
Roggwiller,E. et al . (1997) Host urokinase-type plasminogen activator partici-
pates in the release of malaria merozoites from infected erythrocytes. Mol.
Biochem. Parasitol., 86, 49–59.
Rual,J.-F. et al . (2005) Towards a proteome-scale map of the human protein-
protein interaction network. Nature, 437, 1173–1178.
Salwinski,L. et al . (2004) The Database of Interacting Proteins: 2004 update.
Nucleic Acids Res., 32, D449–D451.
Sharan,R. et al . (2005) Conserved patterns of protein interaction in multiple
species. PNAS , 102, 1974–1979.
Sprinzak,E. and Margalit,H. (2001) Correlated sequence-signatures as markers of protein-protein interaction. J. Mol. Biol., 311, 681–692.
Stelzl,U. et al . (2005) A human protein-protein interaction network: a resource
for annotating the proteome. Cell , 122, 957–968.
Stoeckert, C.J.Jr, et al . (2006) PlasmoDB v5: new looks, new genomes. Trends
Parasitol., 22, 543–546.
Stubbs,J. et al . (2005) Molecular mechanism for switching of P. falciparum
invasion pathways into human erythrocytes. Science, 309, 1384–1387.
Suthram,S. et al . (2006) A direct comparison of protein interaction confidence
assignment schemes. BMC Bioinformatics, 7, 360.
Uetz,P. et al . (2000) A comprehensive analysis of protein-protein interactions in
Saccharomyces cerevisiae. Nature, 403, 623–627.
Withers-Martinez,C. et al . (2004) Subtilisin-like proteases of the malaria parasite.
Mol. Microbiol., 53, 55–63.
Yu,H. et al . (2004) Annotation transfer between genomes: protein-protein
interologs and protein-dna regulogs. Genome Res., 14, 1107–1118.
Zhang,L. et al . (2004) Predicting co-complexed protein pairs using genomic and
proteomic data integration. BMC Bioinformatics, 5, 38.
M.D.Dyer et al.
i166