Biogeochemistry of unpolluted forested watersheds in the...
32
Biogeochemistry of unpolluted forested watersheds in the Oregon Cascades: temporal patterns of precipitation and stream nitrogen fluxes KRISTIN L. VANDERBILT 1,4, * , KATE LAJTHA 2 and FREDERICK J. SWANSON 3 1 Department of Forest Science, Oregon State University, Corvallis, OR 97331, USA; 2 Department of Botany and Plant Pathology, Oregon State University, Corvallis, OR 97331, USA; 3 Pacific Northwest Research Station, USDA Forest Service, Corvallis, OR 97331, USA; 4 Current address: Department of Biology, University of New Mexico, Albuquerque, NM 87131, USA; *Author for correspondence (e-mail: [email protected]; phone: (505) 277-1909; fax: (505) 277-5355) Received 20 November 2001; accepted in revised form 20 January 2002 Key words: DON, H.J. Andrews Experimental Forest, Hydrology, Nitrogen, Streams, Watershed Abstract. We analyzed long-term organic and inorganic nitrogen inputs and outputs in precipitation and streamwater in six watersheds at the H.J. Andrews Experimental Forest in the central Cascade Moun- tains of Oregon. Total bulk N deposition, averaging 1.6 to 2.0 kg N ha -1 yr -1 , is low compared to other sites in the United States and little influenced by anthropogenic N sources. Streamwater N export is also low, averaging <1 kg ha -1 yr -1 . DON is the predominant form of N exported from all watersheds, fol- lowed by PON, NH 4 -N, and NO 3 -N. Total annual stream discharge was a positive predictor of annual DON output in all six watersheds, suggesting that DON export is related to regional precipitation. In contrast, annual discharge was a positive predictor of annual NO 3 -N output in one watershed, annual NH 4 -N output in three watersheds, and annual PON output in three watersheds. Of the four forms of N, only DON had consistent seasonal concentration patterns in all watersheds. Peak streamwater DON concentrations occurred in November-December after the onset of fall rains but before the peak in the hydrograph, probably due to flushing of products of decomposition that had built up during the dry summer. Multiple biotic controls on the more labile nitrate and ammonium concentrations in streams may obscure temporal DIN flux patterns from the terrestrial environment. Results from this study un- derscore the value of using several watersheds from a single climatic zone to make inferences about controls on stream N chemistry; analysis of a single watershed may preclude identification of geograph- ically extensive mechanisms controlling N dynamics. Introduction In recent decades, as atmospheric nitrogen (N) deposition has risen substantially over historical levels in many locations (Fenn et al. 1998; Holland et al. 1999), stream chemistry data have been analyzed to evaluate how elevated N deposition and other ecosystem properties affect N cycling through forests and streams. Inves- tigators have used streamwater N records from a range of forested watersheds with different size, N deposition, vegetation, and soil characteristics to infer which of these factors affect N output (Dise and Wright 1995; Lepisto et al. 1995). Others Biogeochemistry 62: 87–117, 2003. © 2003 Kluwer Academic Publishers. Printed in the Netherlands.
Transcript of Biogeochemistry of unpolluted forested watersheds in the...
Biogeochemistry of unpolluted forested watersheds inthe Oregon Cascades: temporal patterns ofprecipitation and stream nitrogen fluxes
KRISTIN L. VANDERBILT1,4,*, KATE LAJTHA2 and FREDERICK J.SWANSON3
1Department of Forest Science, Oregon State University, Corvallis, OR 97331, USA; 2Department ofBotany and Plant Pathology, Oregon State University, Corvallis, OR 97331, USA; 3Pacific NorthwestResearch Station, USDA Forest Service, Corvallis, OR 97331, USA; 4Current address: Department ofBiology, University of New Mexico, Albuquerque, NM 87131, USA; *Author for correspondence (e-mail:[email protected]; phone: (505) 277-1909; fax: (505) 277-5355)
Received 20 November 2001; accepted in revised form 20 January 2002
Key words: DON, H.J. Andrews Experimental Forest, Hydrology, Nitrogen, Streams, Watershed
Abstract. We analyzed long-term organic and inorganic nitrogen inputs and outputs in precipitation andstreamwater in six watersheds at the H.J. Andrews Experimental Forest in the central Cascade Moun-tains of Oregon. Total bulk N deposition, averaging 1.6 to 2.0 kg N ha−1 yr−1, is low compared to othersites in the United States and little influenced by anthropogenic N sources. Streamwater N export is alsolow, averaging <1 kg ha−1 yr−1. DON is the predominant form of N exported from all watersheds, fol-lowed by PON, NH4-N, and NO3-N. Total annual stream discharge was a positive predictor of annualDON output in all six watersheds, suggesting that DON export is related to regional precipitation. Incontrast, annual discharge was a positive predictor of annual NO3-N output in one watershed, annualNH4-N output in three watersheds, and annual PON output in three watersheds. Of the four forms of N,only DON had consistent seasonal concentration patterns in all watersheds. Peak streamwater DONconcentrations occurred in November-December after the onset of fall rains but before the peak in thehydrograph, probably due to flushing of products of decomposition that had built up during the drysummer. Multiple biotic controls on the more labile nitrate and ammonium concentrations in streamsmay obscure temporal DIN flux patterns from the terrestrial environment. Results from this study un-derscore the value of using several watersheds from a single climatic zone to make inferences aboutcontrols on stream N chemistry; analysis of a single watershed may preclude identification of geograph-ically extensive mechanisms controlling N dynamics.
Introduction
In recent decades, as atmospheric nitrogen (N) deposition has risen substantiallyover historical levels in many locations (Fenn et al. 1998; Holland et al. 1999),stream chemistry data have been analyzed to evaluate how elevated N depositionand other ecosystem properties affect N cycling through forests and streams. Inves-tigators have used streamwater N records from a range of forested watersheds withdifferent size, N deposition, vegetation, and soil characteristics to infer which ofthese factors affect N output (Dise and Wright 1995; Lepisto et al. 1995). Others
Biogeochemistry 62: 87–117, 2003.© 2003 Kluwer Academic Publishers. Printed in the Netherlands.
have examined long-term records from a few watersheds to learn how changes inN deposition or climate influence N output (Murdoch and Stoddard 1992; Mitchellet al. 1996; Swank and Vose 1997). These studies offer insights into N cycling inwatersheds where the N cycle has been altered by anthropogenic additions of N.However, understanding the causes of natural variability of stream N solute chem-istry in unpolluted sites is essential for providing baseline information againstwhich data from elevated N deposition sites can be compared (Hedin et al. 1995).Few long-term records exist, however, for sites that are free from anthropogenic Ninputs.
Unlike many areas in the United States, the H.J. Andrews Experimental Forest,OR, (HJA) is almost completely unaffected by N inputs from anthropogenicsources. The Andrews Forest has six watersheds where N fluxes and hydrology havebeen monitored for as much as thirty-two years. This is one of the longest recordsof N fluxes in forested watersheds receiving low N inputs in the United States. Inaddition, while most stream chemistry records include only dissolved inorganic N(DIN), the Andrews record also includes dissolved organic N (DON) and particu-late organic N (PON). Processes influencing N export in this N-limited ecosystemcan be investigated using this rich record of the natural variability of N inputs andoutputs.
Terrestrial and aquatic processes affect DIN concentrations in streamwater. Wa-tershed geomorphology (Creed and Band 1998), soil characteristics (Gundersen etal. 1998; Seely et al. 1998), land-use or fire history (Pardo et al. 1995; Johnson etal. 1997), vegetation type or successional stage (Vitousek and Reiners 1975; Wig-ington et al. 1998), and atmospheric loading (Stoddard 1994) may all affect thequantity of DIN entering a stream from the terrestrial ecosystem. N uptake by veg-etation or soil microfauna may also influence seasonal patterns of stream DIN ex-port (Likens and Bormann 1995; Vitousek 1977; Foster et al. 1989). In-stream pro-cesses, such as denitrification, cycling of N through biota, organic matter storageand particulate matter transport, can also modify stream DIN concentrations (Meyeret al. 1998; Burns 1998). Hydrologic processes, in particular, are frequently corre-lated with streamwater DIN concentrations. Several studies document seasonalNO3-N concentration-discharge relationships (Bond 1979; Foster et al. 1989; Hill1986; Newbold et al. 1995) and spikes in NO3-N concentration associated with highdischarge events (Hill 1993; Newbold et al. 1995).
Much less is known about processes influencing DON concentrations and fluxesin streamwater. Stream discharge was positively correlated with DON concentra-tions in five of nine watersheds studies in New England (Campbell et al. 2000) andfive out of ten streams in the Lake Tahoe Basin (Coats and Goldman 2001). Peaksin DON concentrations were observed during storm events in an Appalachianstream (Buffam et al. 2001). McHale et al. (2000) found that DON concentrationswere positively related to stream discharge in both dormant and growing seasons,and concluded that biotic controls seem to have a greater impact on NO3-N con-centrations than on DON concentrations. Due to differences in sorption behavior insoils and microbial lability between organic and inorganic forms of N, controls onDON in streams may differ substantially from controls on DIN.
88
Long-term datasets from HJA are used in this study to seek consistent relation-ships between DON and DIN export and watershed hydrology across years andacross watersheds. Our objectives were to 1) characterize long-term patterns of Ndynamics in precipitation and streamwater at the HJA, 2) analyze relationships be-tween annual output of N solutes and annual stream discharge, 3) analyze relation-ships between seasonal streamwater N solute concentrations and precipitation andstream discharge, and 4) compare our results with those from other forested water-sheds.
Methods
General site description
The H.J. Andrews Experimental Forest is located in the west-central CascadeMountains of Oregon (Figure 1). This rugged, 6400-ha area is characterized bydense coniferous forests and steep slopes. Elevation ranges from 412 m to 1630 m.The Pacific Ocean lies 160 km to the west and strongly influences the climate ofHJA. At 430 m elevation, mean January and July temperatures are 2 and 18 °C,respectively, and annual precipitation averages 250 cm. About 80% of annual pre-cipitation falls in the October-March period during storms of relatively long dura-tion (12–72 hours) and low intensity. Precipitation is typically dominated by rainbelow 350 m and snow above 1100 m. At elevations above 750 m, snowpack maypersist for several months. Rain and snow events both occur between 400 and 1200m elevation (Harr 1981).
Watershed characteristics
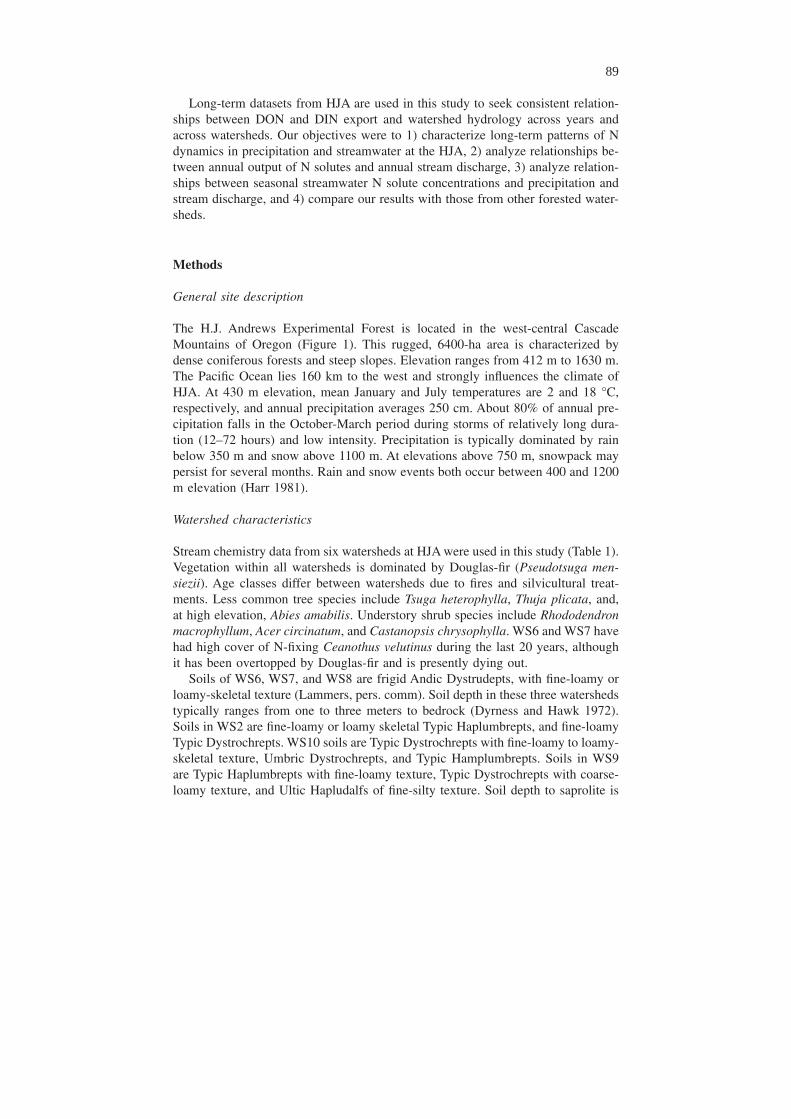
Stream chemistry data from six watersheds at HJA were used in this study (Table 1).Vegetation within all watersheds is dominated by Douglas-fir (Pseudotsuga men-siezii). Age classes differ between watersheds due to fires and silvicultural treat-ments. Less common tree species include Tsuga heterophylla, Thuja plicata, and,at high elevation, Abies amabilis. Understory shrub species include Rhododendronmacrophyllum, Acer circinatum, and Castanopsis chrysophylla. WS6 and WS7 havehad high cover of N-fixing Ceanothus velutinus during the last 20 years, althoughit has been overtopped by Douglas-fir and is presently dying out.
Soils of WS6, WS7, and WS8 are frigid Andic Dystrudepts, with fine-loamy orloamy-skeletal texture (Lammers, pers. comm). Soil depth in these three watershedstypically ranges from one to three meters to bedrock (Dyrness and Hawk 1972).Soils in WS2 are fine-loamy or loamy skeletal Typic Haplumbrepts, and fine-loamyTypic Dystrochrepts. WS10 soils are Typic Dystrochrepts with fine-loamy to loamy-skeletal texture, Umbric Dystrochrepts, and Typic Hamplumbrepts. Soils in WS9are Typic Haplumbrepts with fine-loamy texture, Typic Dystrochrepts with coarse-loamy texture, and Ultic Hapludalfs of fine-silty texture. Soil depth to saprolite is
89

probably less than 3 m in WS9 (Fredriksen 1975), between one and two meters inWS2 (Rothacher et al. 1967), and as much as six meters in WS10 (Fredriksen 1975).Soils in all the watersheds have similar hydraulic characteristics (Perkins 1997).Hydraulic conductivity and subsurface flow are high (Harr 1977).
Precipitation and streamwater sampling
Precipitation samplers were located in clearings at 922 m elevation in WS7 and at430 m elevation near WS9. Precipitation was collected at three-week intervals from10/1/1968 until 5/24/1988 and at one-week intervals thereafter. From 1968 until1988, both precipitation collectors consisted of stainless steel funnels to catch bulkprecipitation that was fed through plastic tubing to an acid-washed polyethylenecarboy within an insulated box. In 1988, the high elevation funnel collector wasreplaced with an Aerochem Metrics precipitation collector that collects both wetand dry precipitation; only the wet precipitation data are analyzed.
Streamwater was sampled just above the weir at the outlet of each watershed.Sampling location has not changed since the inception of the study. Samples werecollected by flow-proportional water sampler (Fredriksen 1969). Until June 1988,individual samples were composited in an acid-washed polyethylene carboy, storedin the dark, and collected at three-week intervals. Since June 1988, carboys werecollected once a week, refrigerated, and combined at three-week intervals for chem-ical analysis. To test whether water chemistry changed during the three-week stor-age period, two grab samples were collected during each sampling period in 1981–
Figure 1. Six gauged watersheds are located in the H.J. Andrews Experimental Forest, Oregon in theCascade Mountains of Oregon. Triangles are locations of precipitation collectors.
90
Tabl
e1.
Cha
ract
eris
tics
ofth
esi
xga
uged
wat
ersh
eds
atH
JA.
Wat
ersh
edA
rea
(ha)
Ele
vatio
n(m
)A
spec
t%
Bas
alA
rea
Log
ged
(Yea
rof
Har
vest
)
Type
ofH
arve
stD
ougl
as-fi
rag
ein
2000
Peri
odof
Stre
am
Che
mis
try
Rec
ord
(wat
erye
ars)
WS2
6053
0–10
70N
W0
Unc
ut47
0ye
ars
1982
–200
1
WS9
8.5
425–
700
SW0
Unc
ut47
0ye
ars
1969
–200
1
WS1
010
.243
0–67
0SW
100
(197
5)C
lear
-cut
25ye
ars
1969
–200
1
WS6
13.0
863–
1013
S10
0(1
974)
Cle
ar-c
ut25
year
s19
72–1
987
WS7
15.4
908–
1097
SSE
60(1
974)
Shel
terw
ood
Cut
25ye
ars
1972
–198
7
40(1
984)
WS8
21.4
955–
1190
SSE
0U
ncut
170
year
s19
72–2
001
91
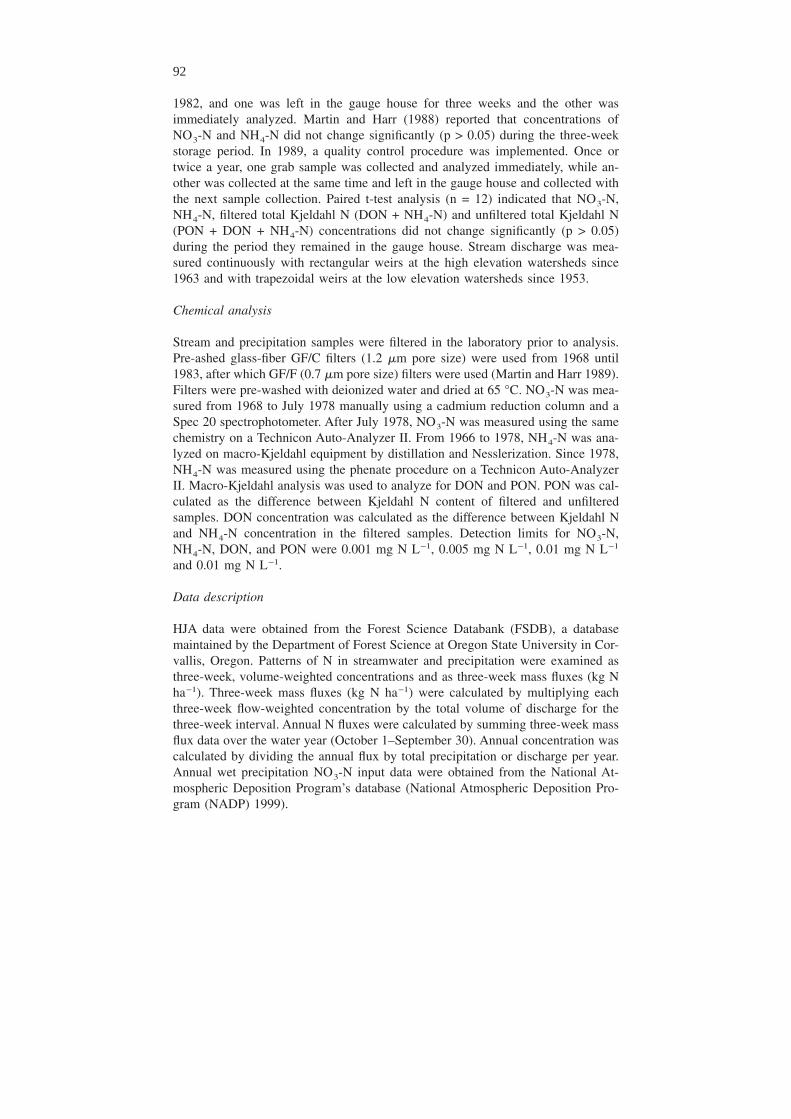
1982, and one was left in the gauge house for three weeks and the other wasimmediately analyzed. Martin and Harr (1988) reported that concentrations ofNO3-N and NH4-N did not change significantly (p > 0.05) during the three-weekstorage period. In 1989, a quality control procedure was implemented. Once ortwice a year, one grab sample was collected and analyzed immediately, while an-other was collected at the same time and left in the gauge house and collected withthe next sample collection. Paired t-test analysis (n = 12) indicated that NO3-N,NH4-N, filtered total Kjeldahl N (DON + NH4-N) and unfiltered total Kjeldahl N(PON + DON + NH4-N) concentrations did not change significantly (p > 0.05)during the period they remained in the gauge house. Stream discharge was mea-sured continuously with rectangular weirs at the high elevation watersheds since1963 and with trapezoidal weirs at the low elevation watersheds since 1953.
Chemical analysis
Stream and precipitation samples were filtered in the laboratory prior to analysis.Pre-ashed glass-fiber GF/C filters (1.2 �m pore size) were used from 1968 until1983, after which GF/F (0.7 �m pore size) filters were used (Martin and Harr 1989).Filters were pre-washed with deionized water and dried at 65 °C. NO3-N was mea-sured from 1968 to July 1978 manually using a cadmium reduction column and aSpec 20 spectrophotometer. After July 1978, NO3-N was measured using the samechemistry on a Technicon Auto-Analyzer II. From 1966 to 1978, NH4-N was ana-lyzed on macro-Kjeldahl equipment by distillation and Nesslerization. Since 1978,NH4-N was measured using the phenate procedure on a Technicon Auto-AnalyzerII. Macro-Kjeldahl analysis was used to analyze for DON and PON. PON was cal-culated as the difference between Kjeldahl N content of filtered and unfilteredsamples. DON concentration was calculated as the difference between Kjeldahl Nand NH4-N concentration in the filtered samples. Detection limits for NO3-N,NH4-N, DON, and PON were 0.001 mg N L−1, 0.005 mg N L−1, 0.01 mg N L−1
and 0.01 mg N L−1.
Data description
HJA data were obtained from the Forest Science Databank (FSDB), a databasemaintained by the Department of Forest Science at Oregon State University in Cor-vallis, Oregon. Patterns of N in streamwater and precipitation were examined asthree-week, volume-weighted concentrations and as three-week mass fluxes (kg Nha−1). Three-week mass fluxes (kg N ha−1) were calculated by multiplying eachthree-week flow-weighted concentration by the total volume of discharge for thethree-week interval. Annual N fluxes were calculated by summing three-week massflux data over the water year (October 1–September 30). Annual concentration wascalculated by dividing the annual flux by total precipitation or discharge per year.Annual wet precipitation NO3-N input data were obtained from the National At-mospheric Deposition Program’s database (National Atmospheric Deposition Pro-gram (NADP) 1999).
92
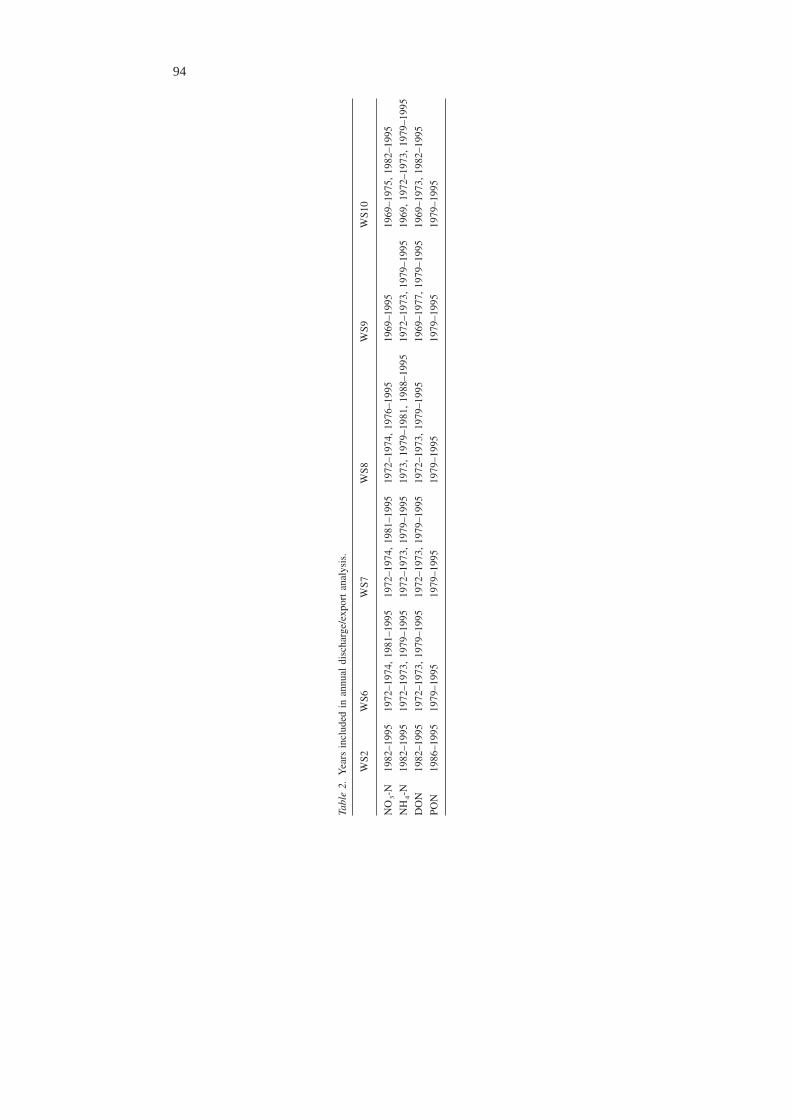
Six watersheds were used for the analysis of annual stream discharge and an-nual N export. WS6, WS7, and WS10 were harvested in the 1974 and 1975, andthe years directly following harvest were not used to derive annual relationshipsbecause the disturbance increased annual discharge and altered nutrient export(Martin and Harr 1989). The years included in the analyses (Table 2) were deter-mined by examining plots of NO3-N and filtered Kjeldahl N export and estimatingthe year when export returned to pre-disturbance levels. Nitrate returned to pre-disturbance levels within six years after harvest, while harvest had little impact onfiltered Kjeldahl N (DON + NH4-N) values (Martin and Harr 1989). NH4-N andPON data were not collected during the first few years following harvest, and otheryears lack a complete stream chemistry record and were also excluded from theannual analysis.
Seasonal analysis was intended to examine subtle responses to changes in wa-tershed hydrology, so only watersheds completely unaffected by harvest–WS2,WS8, and WS9–were used. The three-week interval of data collection was con-verted to monthly data for graphs by averaging together all data points collected ineach month across all years.
Because hydrology-driven patterns in N stream chemistry may vary by season,three intervals were defined for analysis based on precipitation and forest biologi-cal activity: fall, winter, and spring/summer. Fall was defined as the months ofSeptember, October, and November. Stream low flows occur in August and Sep-tember, and fall storms begin to increase stream discharge in October. Stream dis-charge rises dramatically in November. Winter included December, January, Feb-ruary, and March, when soils are generally saturated (Perkins 1997) and precipita-tion, soil water flux, and stream flow are high. The spring/summer interval extendedfrom April through August. Precipitation decreases and soil moisture drops belowsaturation in April or May (Perkins 1997).
Statistical analysis
Annual N inputs and outputs (kg N ha−1 yr−1) of NO3-N, NH4-N, DON and PONwere regressed against annual precipitation and stream discharge. Pearson correla-tion coefficients were calculated for all combinations of seasons, three-week con-centrations of NH4-N, DON and PON and three-week precipitation and three-weekstream discharge. Precipitation and discharge required a log transformation to lin-earize the relationship between response and explanatory variables. N concentra-tions were log transformed to equalize variance of residuals.
Logistic regression was used to regress three-week NO3-N concentrationsagainst stream discharge and precipitation because many of the values for NO3-Nconcentration were below detection. The data were recoded as 1 if a concentrationother than zero was recorded, and 0 if a concentration below detection was re-corded. All statistical analyses were done using SAS (SAS Institute, Inc. 1990).
93
Tabl
e2.
Yea
rsin
clud
edin
annu
aldi
scha
rge/
expo
rtan
alys
is.
WS2
WS6
WS7
WS8
WS9
WS1
0
NO
3-N
1982
–199
519
72–1
974,
1981
–199
519
72–1
974,
1981
–199
519
72–1
974,
1976
–199
519
69–1
995
1969
–197
5,19
82–1
995
NH
4-N
1982
–199
519
72–1
973,
1979
–199
519
72–1
973,
1979
–199
519
73,
1979
–198
1,19
88–1
995
1972
–197
3,19
79–1
995
1969
,19
72–1
973,
1979
–199
5
DO
N19
82–1
995
1972
–197
3,19
79–1
995
1972
–197
3,19
79–1
995
1972
–197
3,19
79–1
995
1969
–197
7,19
79–1
995
1969
–197
3,19
82–1
995
PON
1986
–199
519
79–1
995
1979
–199
519
79–1
995
1979
–199
519
79–1
995
94
Results
Annual precipitation N inputs
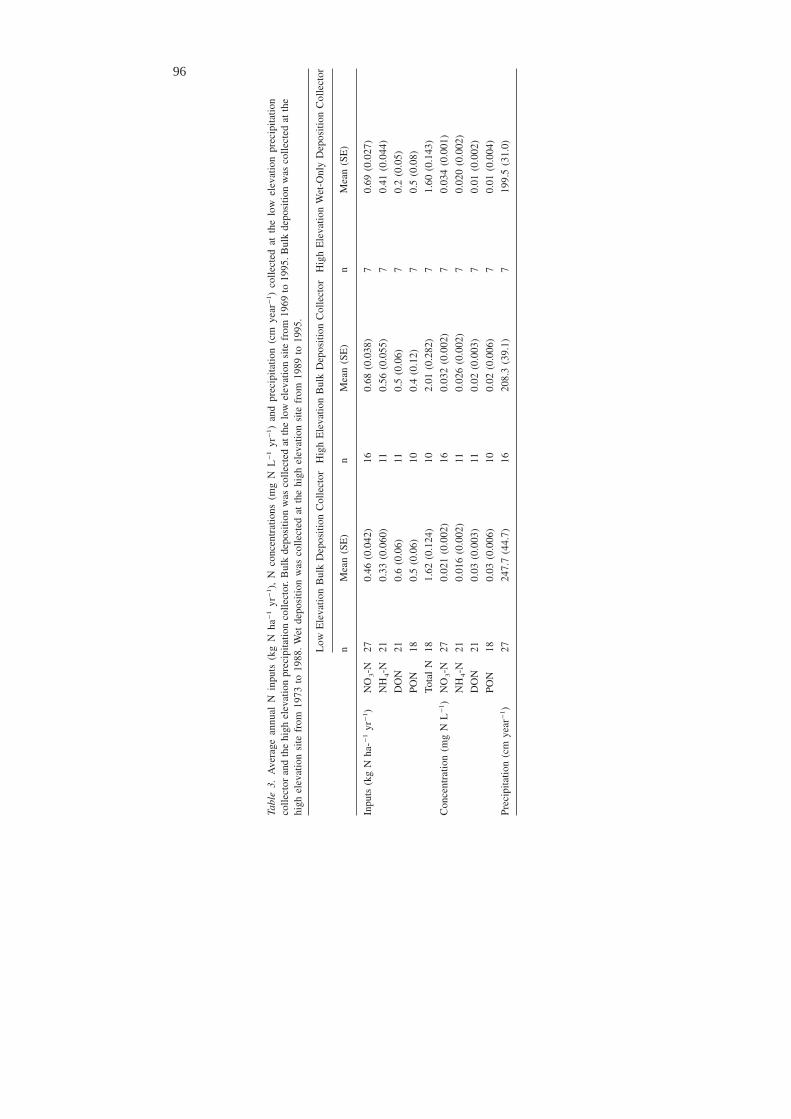
At the low-elevation collector, total annual bulk N input averaged 1.63kg N ha−1 yr−1; at the high elevation collector total annual bulk N input averaged2.01 kg N ha−1 yr−1 and wet-only input averaged 1.60 kg N ha−1 yr−1. Inputs andconcentrations of specific N species followed similar patterns: DON was the larg-est component of N input at the low-elevation collector, followed by PON, NO3-N,and NH4-N (Table 3). At the high-elevation collector, NO3-N input was higher thanat low elevation and was the largest component of N in bulk and wet-only inputs,followed by NH4-N, DON, and PON.
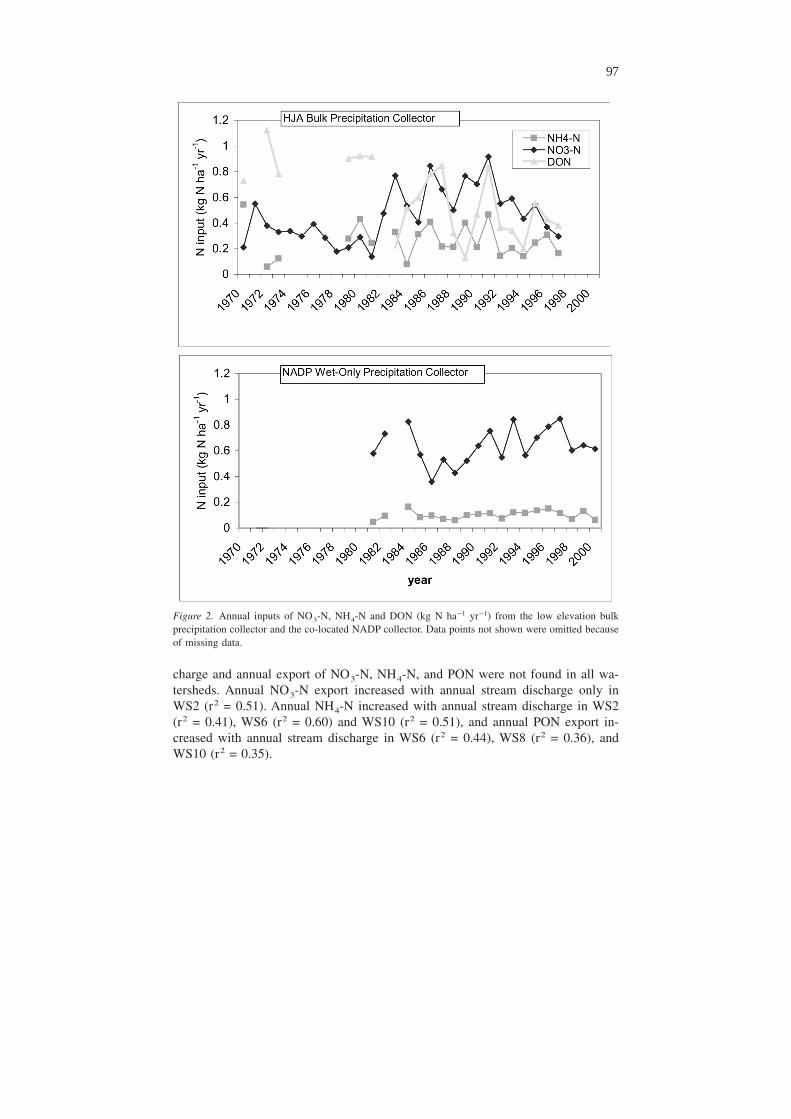
Of all four N solutes, only annual input of NO3-N in bulk precipitation has in-creased significantly (r2 = 0.35; p = 0.001) since 1970 (Figure 2) at the low eleva-tion bulk precipitation collector. In contrast, the NADP wet precipitation NO3-Nrecord from a collector co-located with the HJA bulk precipitation collector showedno significant trend (p > 0.05) for the period between 1980 and 2000. Annual bulkinputs of NO3-N, NH4-N, DON and PON were not correlated with annual precipi-tation at the low elevation bulk precipitation collector.
No long-term trends in annual inputs of any form of N were found at the highelevation site. Annual inputs of DON and PON in bulk and wet-only deposition athigh elevation were not correlated with annual precipitation (p > 0.05). Annual pre-cipitation was, however, a significant predictor of annual bulk NO3-N input (r2 =0.242, p = 0.0529), annual wet-only NO3-N input (r2 = 0.607, p = 0.0390) andannual bulk NH4-N input (r2 = 0.42, p = 0.0380) at the high elevation site.
While little intra-annual variability in concentrations or inputs of NH4-N, DON,and PON (Figure 3) occurs, August peaks in NO3-N concentrations are much morepronounced at the high elevation bulk precipitation collector than at the low eleva-tion bulk precipitation collector. Peaks in DON inputs occur in September andApril/May at both elevations.
Annual stream N outputs
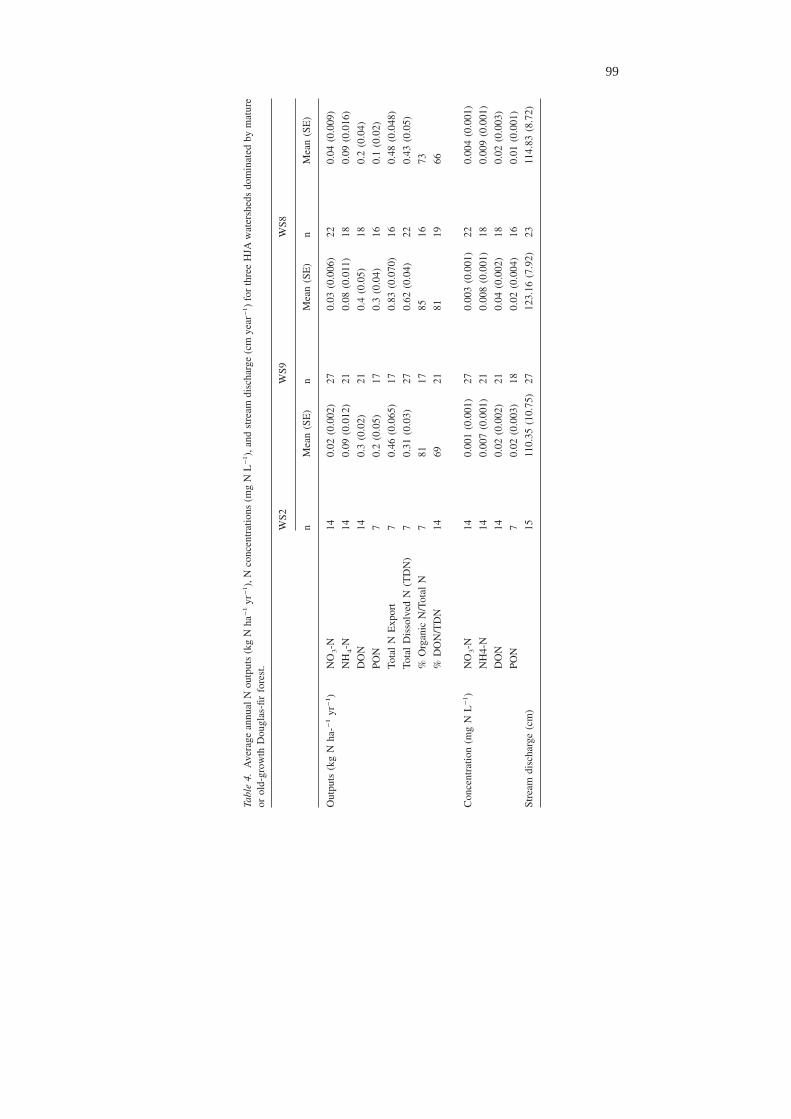
On average, DON comprised the largest fraction of total annual N output from HJAwatersheds (Table 4). PON was the second largest fraction of annual N output, fol-lowed by NH4-N and then NO3-N. Average annual concentrations reflected the an-nual trends in N output; that is, the order of concentration was DON > PON >NH4-N > NO3-N.
Annual N output versus annual stream discharge
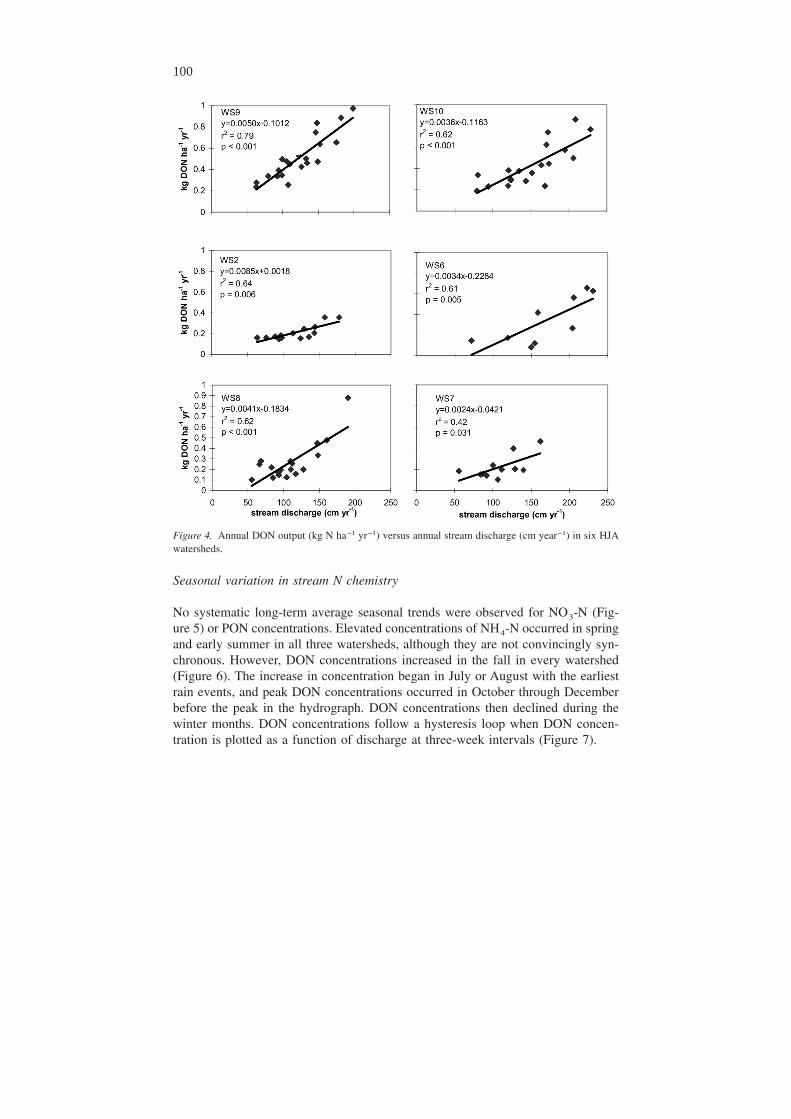
Total annual discharge was a positive predictor of annual DON export in all wa-tersheds (Figure 4) with r2 values ranging from 0.42 to 0.79. DON-discharge re-gression line slopes are not significantly different from each other (p > 0.05). Incontrast to DON, significant relationships (p < 0.05) between annual stream dis-
95
Tabl
e3.
Ave
rage
annu
alN
inpu
ts(k
gN
ha−
1yr
−1),
Nco
ncen
trat
ions
(mg
NL
−1
yr−
1)
and
prec
ipita
tion
(cm
year
−1)
colle
cted
atth
elo
wel
evat
ion
prec
ipita
tion
colle
ctor
and
the
high
elev
atio
npr
ecip
itatio
nco
llect
or.B
ulk
depo
sitio
nw
asco
llect
edat
the
low
elev
atio
nsi
tefr
om19
69to
1995
.Bul
kde
posi
tion
was
colle
cted
atth
ehi
ghel
evat
ion
site
from
1973
to19
88.
Wet
depo
sitio
nw
asco
llect
edat
the
high
elev
atio
nsi
tefr
om19
89to
1995
.
Low
Ele
vatio
nB
ulk
Dep
ositi
onC
olle
ctor
Hig
hE
leva
tion
Bul
kD
epos
ition
Col
lect
orH
igh
Ele
vatio
nW
et-O
nly
Dep
ositi
onC
olle
ctor
nM
ean
(SE
)n
Mea
n(S
E)
nM
ean
(SE
)
Inpu
ts(k
gN
ha-−
1yr
−1)
NO
3-N
270.
46(0
.042
)16
0.68
(0.0
38)
70.
69(0
.027
)
NH
4-N
210.
33(0
.060
)11
0.56
(0.0
55)
70.
41(0
.044
)
DO
N21
0.6
(0.0
6)11
0.5
(0.0
6)7
0.2
(0.0
5)
PON
180.
5(0
.06)
100.
4(0
.12)
70.
5(0
.08)
Tota
lN
181.
62(0
.124
)10
2.01
(0.2
82)
71.
60(0
.143
)
Con
cent
ratio
n(m
gN
L−
1)
NO
3-N
270.
021
(0.0
02)
160.
032
(0.0
02)
70.
034
(0.0
01)
NH
4-N
210.
016
(0.0
02)
110.
026
(0.0
02)
70.
020
(0.0
02)
DO
N21
0.03
(0.0
03)
110.
02(0
.003
)7
0.01
(0.0
02)
PON
180.
03(0
.006
)10
0.02
(0.0
06)
70.
01(0
.004
)
Prec
ipita
tion
(cm
year
−1)
2724
7.7
(44.
7)16
208.
3(3
9.1)
719
9.5
(31.
0)
96
charge and annual export of NO3-N, NH4-N, and PON were not found in all wa-tersheds. Annual NO3-N export increased with annual stream discharge only inWS2 (r2 = 0.51). Annual NH4-N increased with annual stream discharge in WS2(r2 = 0.41), WS6 (r2 = 0.60) and WS10 (r2 = 0.51), and annual PON export in-creased with annual stream discharge in WS6 (r2 = 0.44), WS8 (r2 = 0.36), andWS10 (r2 = 0.35).
Figure 2. Annual inputs of NO3-N, NH4-N and DON (kg N ha−1 yr−1) from the low elevation bulkprecipitation collector and the co-located NADP collector. Data points not shown were omitted becauseof missing data.
97
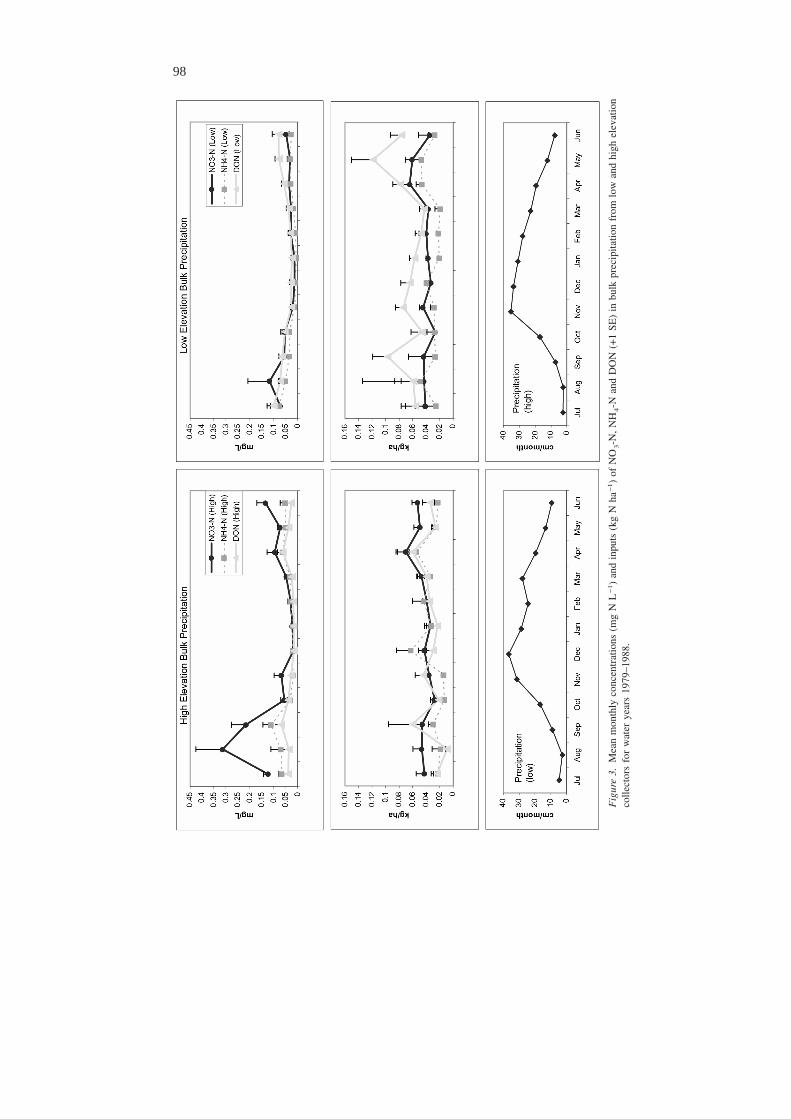
Fig
ure
3.M
ean
mon
thly
conc
entr
atio
ns(m
gN
L−
1)
and
inpu
ts(k
gN
ha−
1)
ofN
O3-N
,NH
4-N
and
DO
N(+
1SE
)in
bulk
prec
ipita
tion
from
low
and
high
elev
atio
nco
llect
ors
for
wat
erye
ars
1979
–198
8.
98
Tabl
e4.
Ave
rage
annu
alN
outp
uts
(kg
Nha
−1
yr−
1),
Nco
ncen
trat
ions
(mg
NL
−1),
and
stre
amdi
scha
rge
(cm
year
−1)
for
thre
eH
JAw
ater
shed
sdo
min
ated
bym
atur
eor
old-
grow
thD
ougl
as-fi
rfo
rest
.
WS2
WS9
WS8
nM
ean
(SE
)n
Mea
n(S
E)
nM
ean
(SE
)
Out
puts
(kg
Nha
-−1
yr−
1)
NO
3-N
140.
02(0
.002
)27
0.03
(0.0
06)
220.
04(0
.009
)
NH
4-N
140.
09(0
.012
)21
0.08
(0.0
11)
180.
09(0
.016
)
DO
N14
0.3
(0.0
2)21
0.4
(0.0
5)18
0.2
(0.0
4)
PON
70.
2(0
.05)
170.
3(0
.04)
160.
1(0
.02)
Tota
lN
Exp
ort
70.
46(0
.065
)17
0.83
(0.0
70)
160.
48(0
.048
)
Tota
lD
isso
lved
N(T
DN
)7
0.31
(0.0
3)27
0.62
(0.0
4)22
0.43
(0.0
5)
%O
rgan
icN
/Tot
alN
781
1785
1673
%D
ON
/TD
N14
6921
8119
66
Con
cent
ratio
n(m
gN
L−
1)
NO
3-N
140.
001
(0.0
01)
270.
003
(0.0
01)
220.
004
(0.0
01)
NH
4-N
140.
007
(0.0
01)
210.
008
(0.0
01)
180.
009
(0.0
01)
DO
N14
0.02
(0.0
02)
210.
04(0
.002
)18
0.02
(0.0
03)
PON
70.
02(0
.003
)18
0.02
(0.0
04)
160.
01(0
.001
)
Stre
amdi
scha
rge
(cm
)15
110.
35(1
0.75
)27
123.
16(7
.92)
2311
4.83
(8.7
2)
99
Seasonal variation in stream N chemistry
No systematic long-term average seasonal trends were observed for NO3-N (Fig-ure 5) or PON concentrations. Elevated concentrations of NH4-N occurred in springand early summer in all three watersheds, although they are not convincingly syn-chronous. However, DON concentrations increased in the fall in every watershed(Figure 6). The increase in concentration began in July or August with the earliestrain events, and peak DON concentrations occurred in October through Decemberbefore the peak in the hydrograph. DON concentrations then declined during thewinter months. DON concentrations follow a hysteresis loop when DON concen-tration is plotted as a function of discharge at three-week intervals (Figure 7).
Figure 4. Annual DON output (kg N ha−1 yr−1) versus annual stream discharge (cm year−1) in six HJAwatersheds.
100
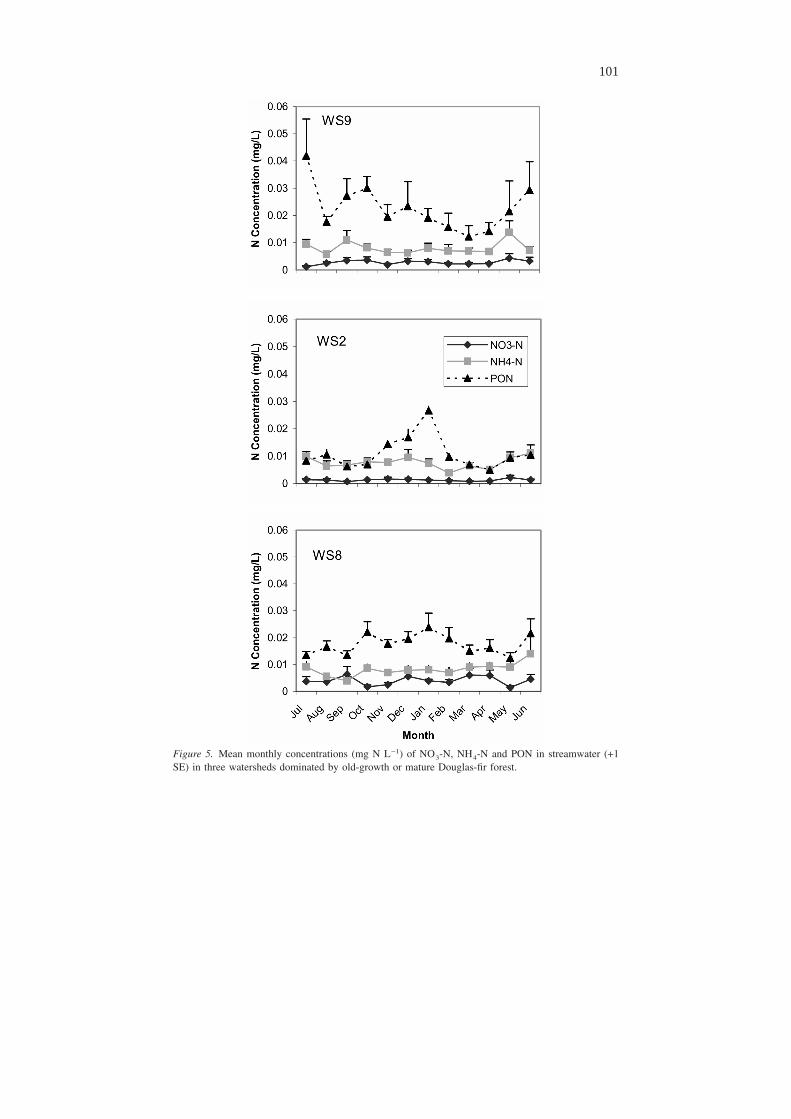
Figure 5. Mean monthly concentrations (mg N L−1) of NO3-N, NH4-N and PON in streamwater (+1SE) in three watersheds dominated by old-growth or mature Douglas-fir forest.
101
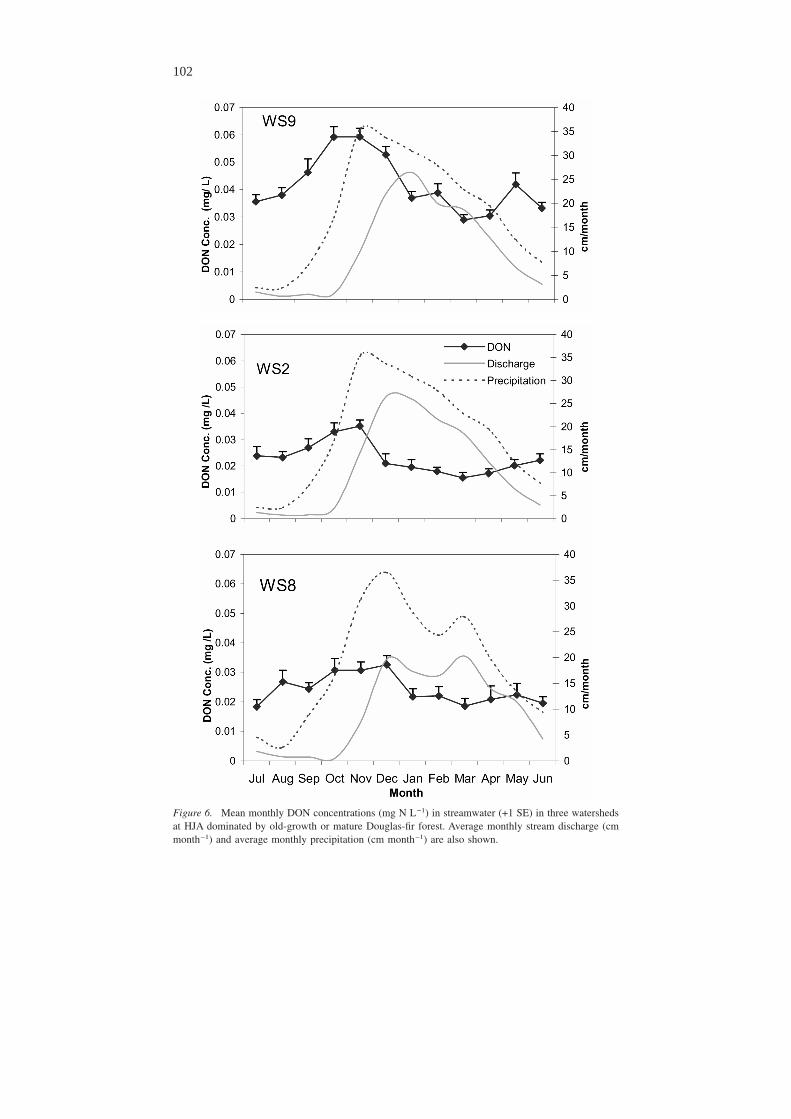
Figure 6. Mean monthly DON concentrations (mg N L−1) in streamwater (+1 SE) in three watershedsat HJA dominated by old-growth or mature Douglas-fir forest. Average monthly stream discharge (cmmonth−1) and average monthly precipitation (cm month−1) are also shown.
102

Relationship between hydrology and seasonal variations in N concentration
For seasonal analyses, only those instances where correlations were observed in allthree undisturbed watersheds were noted. DON concentrations were positively cor-related with precipitation in all watersheds in Fall and Winter, but not in Spring/Summer. NH4-N and PON concentrations were not significantly correlated to ei-ther precipitation or discharge in all watersheds in Fall, Winter, or Spring/Summer(Table 5). The probability of a detectable NO3-N concentration was not related todischarge or precipitation in all three watersheds in any season. The odds of a de-tectable NO3-N concentration occurring did decrease significantly with increasingprecipitation (odds ratio = 0.90, n = 136) and stream discharge (odds ratio = 0.89,n = 136) in Winter in WS8.
Discussion
Precipitation inputs and concentrations
Annual patterns in precipitationAverage annual DIN inputs in bulk precipitation at HJA (0.79 kg N ha−1 yr−1 at thelow elevation site and 1.24 kg N ha−1 yr−1 at the high elevation site) are smallrelative to sites in the Eastern US where deposition of atmospheric pollutants ishigher. Typical values of DIN inputs in bulk input for forested sites in the easternUS were 7.1 kg N ha−1 yr−1 during 1995–1997 (Campbell et al. 2000) at the Hub-bard Brook Experimental Forest, New Hampshire and 12.8 kg N ha−1 yr−1 in the
Figure 7. DON concentrations plotted as a function of discharge at three-week intervals follows aclock-wise hysteresis loop. Data are from WS9, October 1994–June 1995.
103
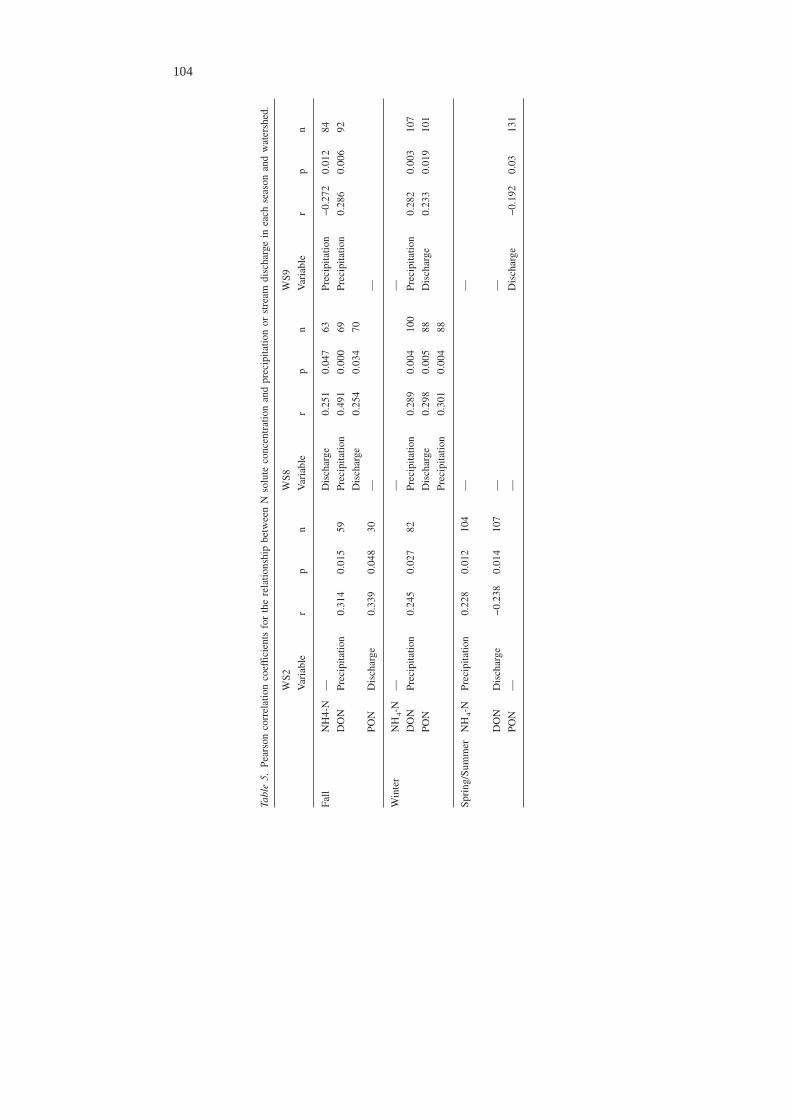
Tabl
e5.
Pear
son
corr
elat
ion
coef
fici
ents
for
the
rela
tions
hip
betw
een
Nso
lute
conc
entr
atio
nan
dpr
ecip
itatio
nor
stre
amdi
scha
rge
inea
chse
ason
and
wat
ersh
ed.
WS2
WS8
WS9
Var
iabl
er
pn
Var
iabl
er
pn
Var
iabl
er
pn
Fall
NH
4-N
—D
isch
arge
0.25
10.
047
63Pr
ecip
itatio
n−
0.27
20.
012
84
DO
NPr
ecip
itatio
n0.
314
0.01
559
Prec
ipita
tion
0.49
10.
000
69Pr
ecip
itatio
n0.
286
0.00
692
Dis
char
ge0.
254
0.03
470
PON
Dis
char
ge0.
339
0.04
830
——
Win
ter
NH
4-N
——
—
DO
NPr
ecip
itatio
n0.
245
0.02
782
Prec
ipita
tion
0.28
90.
004
100
Prec
ipita
tion
0.28
20.
003
107
PON
Dis
char
ge0.
298
0.00
588
Dis
char
ge0.
233
0.01
910
1
Prec
ipita
tion
0.30
10.
004
88
Spri
ng/S
umm
erN
H4-N
Prec
ipita
tion
0.22
80.
012
104
——
DO
ND
isch
arge
−0.
238
0.01
410
7—
—
PON
——
Dis
char
ge−
0.19
20.
0313
1
104
mountains of eastern Tennessee (Boring et al. 1988). Wet DIN input alone was 4.0and 7.1 kg N ha−1 yr−1 at two forested sites in Georgia (Lovett and Lindberg 1993),while wet DIN input at the high elevation site at HJA was 1.1 kg N ha−1 yr−1. Evencompared to annual bulk input of total N (DIN + DON + PON) in Olympic Na-tional Park, Washington, which ranged from 3.11 to 3.42 kg N ha−1 yr−1 (Edmondset al. 1998), annual bulk input of total N at HJA is low, averaging 1.6 and 2.0kg ha−1 yr−1 at the low and high collectors, respectively.
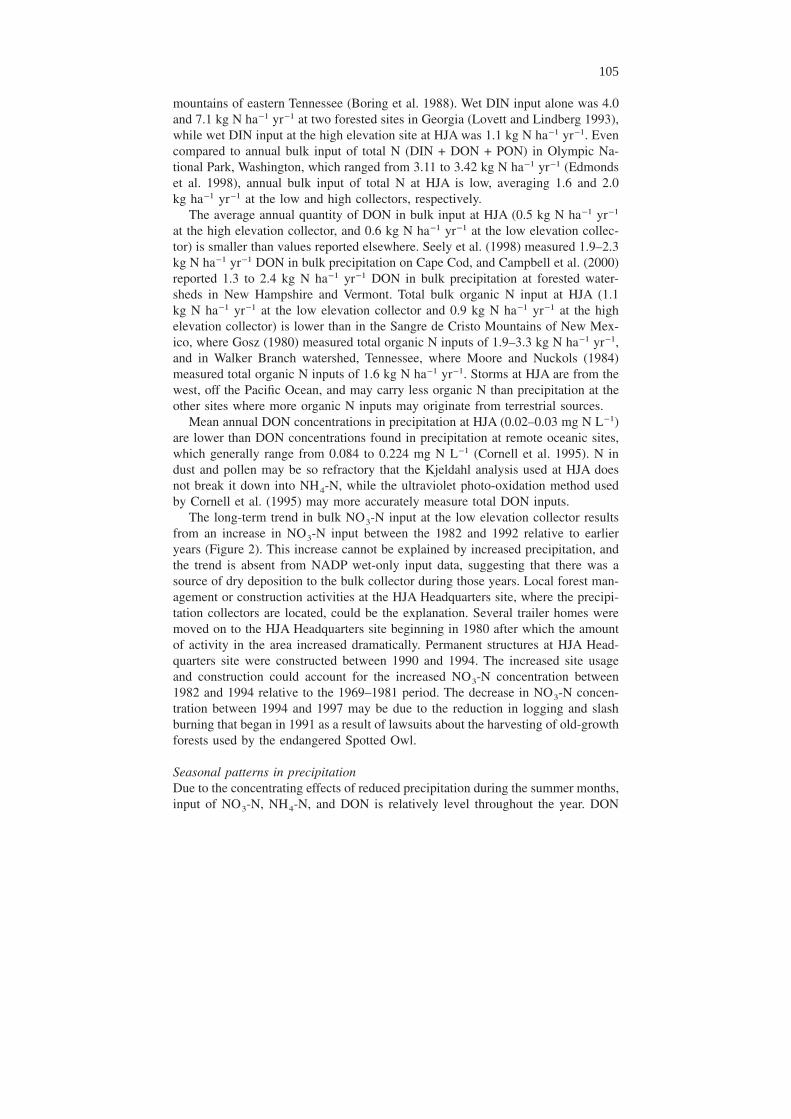
The average annual quantity of DON in bulk input at HJA (0.5 kg N ha−1 yr−1
at the high elevation collector, and 0.6 kg N ha−1 yr−1 at the low elevation collec-tor) is smaller than values reported elsewhere. Seely et al. (1998) measured 1.9–2.3kg N ha−1 yr−1 DON in bulk precipitation on Cape Cod, and Campbell et al. (2000)reported 1.3 to 2.4 kg N ha−1 yr−1 DON in bulk precipitation at forested water-sheds in New Hampshire and Vermont. Total bulk organic N input at HJA (1.1kg N ha−1 yr−1 at the low elevation collector and 0.9 kg N ha−1 yr−1 at the highelevation collector) is lower than in the Sangre de Cristo Mountains of New Mex-ico, where Gosz (1980) measured total organic N inputs of 1.9–3.3 kg N ha−1 yr−1,and in Walker Branch watershed, Tennessee, where Moore and Nuckols (1984)measured total organic N inputs of 1.6 kg N ha−1 yr−1. Storms at HJA are from thewest, off the Pacific Ocean, and may carry less organic N than precipitation at theother sites where more organic N inputs may originate from terrestrial sources.
Mean annual DON concentrations in precipitation at HJA (0.02–0.03 mg N L−1)are lower than DON concentrations found in precipitation at remote oceanic sites,which generally range from 0.084 to 0.224 mg N L−1 (Cornell et al. 1995). N indust and pollen may be so refractory that the Kjeldahl analysis used at HJA doesnot break it down into NH4-N, while the ultraviolet photo-oxidation method usedby Cornell et al. (1995) may more accurately measure total DON inputs.
The long-term trend in bulk NO3-N input at the low elevation collector resultsfrom an increase in NO3-N input between the 1982 and 1992 relative to earlieryears (Figure 2). This increase cannot be explained by increased precipitation, andthe trend is absent from NADP wet-only input data, suggesting that there was asource of dry deposition to the bulk collector during those years. Local forest man-agement or construction activities at the HJA Headquarters site, where the precipi-tation collectors are located, could be the explanation. Several trailer homes weremoved on to the HJA Headquarters site beginning in 1980 after which the amountof activity in the area increased dramatically. Permanent structures at HJA Head-quarters site were constructed between 1990 and 1994. The increased site usageand construction could account for the increased NO3-N concentration between1982 and 1994 relative to the 1969–1981 period. The decrease in NO3-N concen-tration between 1994 and 1997 may be due to the reduction in logging and slashburning that began in 1991 as a result of lawsuits about the harvesting of old-growthforests used by the endangered Spotted Owl.
Seasonal patterns in precipitationDue to the concentrating effects of reduced precipitation during the summer months,input of NO3-N, NH4-N, and DON is relatively level throughout the year. DON
105
input is consistently higher at the low elevation bulk collector than in the high el-evation collector, suggesting that the forested slopes surrounding the low elevationcollector may be a source of DON. More pollen, for example, may settle into thelow elevation collector, and could be a substantial source of DON since as much asforty-nine percent of water-soluble N from pollen is amino-N (Greenfield 1999).
Annual outputs
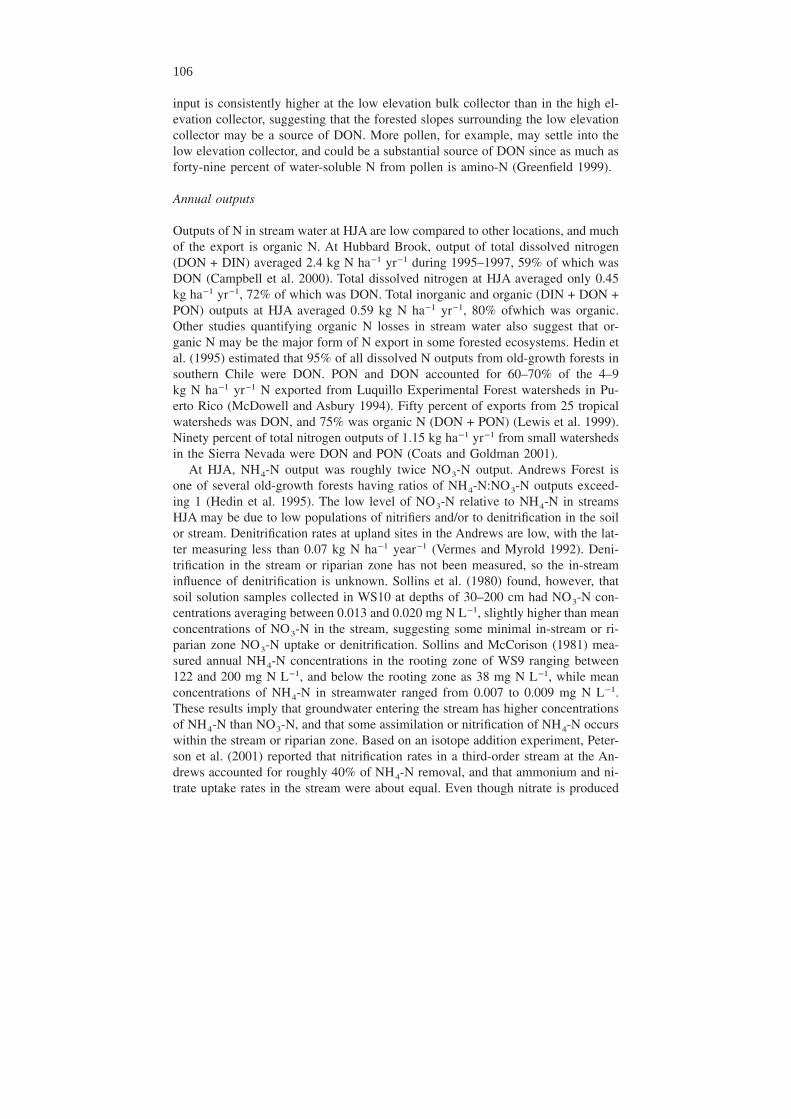
Outputs of N in stream water at HJA are low compared to other locations, and muchof the export is organic N. At Hubbard Brook, output of total dissolved nitrogen(DON + DIN) averaged 2.4 kg N ha−1 yr−1 during 1995–1997, 59% of which wasDON (Campbell et al. 2000). Total dissolved nitrogen at HJA averaged only 0.45kg ha−1 yr−1, 72% of which was DON. Total inorganic and organic (DIN + DON +PON) outputs at HJA averaged 0.59 kg N ha−1 yr−1, 80% ofwhich was organic.Other studies quantifying organic N losses in stream water also suggest that or-ganic N may be the major form of N export in some forested ecosystems. Hedin etal. (1995) estimated that 95% of all dissolved N outputs from old-growth forests insouthern Chile were DON. PON and DON accounted for 60–70% of the 4–9kg N ha−1 yr−1 N exported from Luquillo Experimental Forest watersheds in Pu-erto Rico (McDowell and Asbury 1994). Fifty percent of exports from 25 tropicalwatersheds was DON, and 75% was organic N (DON + PON) (Lewis et al. 1999).Ninety percent of total nitrogen outputs of 1.15 kg ha−1 yr−1 from small watershedsin the Sierra Nevada were DON and PON (Coats and Goldman 2001).
At HJA, NH4-N output was roughly twice NO3-N output. Andrews Forest isone of several old-growth forests having ratios of NH4-N:NO3-N outputs exceed-ing 1 (Hedin et al. 1995). The low level of NO3-N relative to NH4-N in streamsHJA may be due to low populations of nitrifiers and/or to denitrification in the soilor stream. Denitrification rates at upland sites in the Andrews are low, with the lat-ter measuring less than 0.07 kg N ha−1 year−1 (Vermes and Myrold 1992). Deni-trification in the stream or riparian zone has not been measured, so the in-streaminfluence of denitrification is unknown. Sollins et al. (1980) found, however, thatsoil solution samples collected in WS10 at depths of 30–200 cm had NO3-N con-centrations averaging between 0.013 and 0.020 mg N L−1, slightly higher than meanconcentrations of NO3-N in the stream, suggesting some minimal in-stream or ri-parian zone NO3-N uptake or denitrification. Sollins and McCorison (1981) mea-sured annual NH4-N concentrations in the rooting zone of WS9 ranging between122 and 200 mg N L−1, and below the rooting zone as 38 mg N L−1, while meanconcentrations of NH4-N in streamwater ranged from 0.007 to 0.009 mg N L−1.These results imply that groundwater entering the stream has higher concentrationsof NH4-N than NO3-N, and that some assimilation or nitrification of NH4-N occurswithin the stream or riparian zone. Based on an isotope addition experiment, Peter-son et al. (2001) reported that nitrification rates in a third-order stream at the An-drews accounted for roughly 40% of NH4-N removal, and that ammonium and ni-trate uptake rates in the stream were about equal. Even though nitrate is produced
106
in HJA streams, demand for all forms of N is evidently so high that very little ni-trate is exported from HJA watersheds.
Annual output related to stream discharge
Nitrate
The lack of correlation between annual NO3-N output and annual stream dischargein five of the six watersheds may be a function of multiple controls on labile DIN.First, high terrestrial biological demand for NO3-N would create low availability ofNO3-N for flushing. Vegetation demand for N is substantial in HJA where rainfallis quite high but N inputs are low (Sollins et al. 1980). Further, Hart et al. (1994)found that gross rates of nitrification at an old-growth site in the HJA were signif-icant, but that net rates were low because of swift microbial assimilation of nitrate.Pulses of NO3-N in streamwater have been observed during early fall storms (Gre-gory unpub. data) at HJA, but the pool of NO3-N in the soil may be so small thatfurther increases in stream discharge may not result in any measurable increase inNO3-N output. Nitrate concentrations may damped due to high riparian zone (Ash-by et al. 1998) and in-stream (Peterson et al. 2001) uptake of this limiting nutrientin a high carbon-availability environment. In a study of 25 watersheds of theAmerican tropics, Lewis et al. (1999) found that annual output of all N fractionsincreased with runoff. However, almost all of their sites had significantly higher Nexports than found at HJA, again suggesting that the strong N limitation seen atHJA caused the lack of a correlation between runoff and output.
DON
In contrast to DIN export, annual DON export is related to annual stream dischargein all watersheds, suggesting that there may be less biological processing of DONin soils, the riparian zone, and stream water compared to NO3-N and NH4-N. Al-though some plants may take up specific labile forms of DON (Nasholm et al.1998), DON in streams may be dominated by refractory fulvic acids, and may belittle affected by stream biota. Qualls and Haines (1992) reported that most DONdecomposed very slowly in an Appalachian stream, and concluded that stream DONis largely composed of refractory compounds. Hedin et al. (1995) also presentedevidence from watersheds in southern Chile suggesting that most hydrologic DONlosses are fulvic acids from soil organic matter.
Annual DON export and annual stream discharge have been shown to bestrongly positively related in other sites. For example, fifty-five percent of the vari-ation in annual DON export from 25 tropical watersheds was explained by annualstream discharge (Lewis et al. 1999). This study was a survey over many sites,however, whereas the results from the HJA underscore the consistency of the mech-anism influencing DON export at a single site.
107
PON
Annual PON export increased significantly with annual stream discharge in four ofthe six watersheds. Greater discharge results in an increase in the wetted area ofthe streambank as the stream comes in contact with more detritus, potentially in-creasing PON concentration. Overland flow, although minor at HJA, may also moveorganic matter into streams during intense storms. Other processes, including dryravel, raindrop impact, needle ice, and animal movements (Swanson et al. 1982)introduce particles into the channel throughout the year. Even a light rain may washparticles from the forest canopy in throughfall into the stream, increasing PONconcentration.
Seasonal hydrologic controls on N concentrations
Correlation between precipitation or discharge and N solute concentrations wasrarely consistent across watersheds in a given season, and correlation coefficientswere low, ranging between 0.2 and 0.4. Much of the variation in streamwater Nconcentrations may be obscured by the coarse resolution of the data. The flow-weighted N concentration data reflect changes in concentration over a three-weekperiod, during which concentration may have changed dramatically more than once.Concentrations of DIN and DON, for example, have been observed to differ be-tween rising and falling limbs of a storm hydrograph at the HJA (Fredriksen 1972;Wondzell and Swanson 1996) and elsewhere (Henderson et al. 1977; Bond 1979).Bakke (1993) also reported low correlations between NO3-N concentrations andstream discharge for a long-term data set at another site in Oregon, and concludedthat grab samples taken at two-week intervals also lacked the resolution to ade-quately capture fluctuations in NO3-N concentrations. Interpretation of plots of nu-trient concentrations and hydrologic mechanisms controlling seasonal N streamchemistry based on consistent statistical results across all three watersheds are dis-cussed below.
Fall and winter
Precipitation was positively correlated with DON concentrations at the three-weekinterval in all three watersheds in Fall and Winter. A precipitation-related mecha-nism for the increase in DON observed in the fall is suggested by the data of Sol-lins and McCorison (1981) who observed an increase in DON at the 2.0 m depth inWS10 that began in August 1976 with the first fall rains and peaked in November1976. Decomposer activity may be stimulated as soils wet up in the fall, resultingin increased DON in soil solution. Some of the fall increase in DON concentrationin stream water may be a function of elevated DON in groundwater seeping intothe stream.
Evidence from other studies suggests that flushing from the upper soil horizonsresults in the increased concentration of DON in streamwater. For example, DOCconcentrations peak before spring stream discharge peaks in the Snake River (Horn-
108
berger et al. 1994) and in a small headwater catchment in Colorado (Boyer et al.1996), in a pattern similar to that observed for DON in HJA watersheds. Theseresponses were hypothesized to be the result of increased flows through the uppersoil horizon during snowmelt (analogous to rainfall at HJA), which flushed DOCenriched interstitial water, built up during low flow periods, to the stream. BecauseDOC fluxes were highly correlated with DON fluxes in 42 case studies of forestedecosystems (Michalzik et al. 2001) this mechanism may be applied to DON, aswell. The hysteresis loop (Figure 7) exhibited by seasonal DON concentrations il-lustrates that the sources of DON are depleted in the spring relative to the fall andthat total DON export is supply limited.
DON concentrations observed during fall storm events at HJA indicate that thethree-week level of observation does not adequately capture the variability of DONconcentrations in discharge, at least partially accounting for the low correlation co-efficients. Fredriksen (1972) reported that DON concentration in streamwaterpeaked before the hydrograph peaked during a storm in Andrews Forest WS10.Wondzell and Swanson (1996) also found that DON concentrations were higheston the rising limb of the hydrograph during fall storms in a small tributary empty-ing into a 4th order HJA stream.
The positive correlation between fall DON concentrations and precipitation,rather than stream discharge, at the three-week scale of measurement may be ob-served because early fall storms flush near-stream pools of DOC and DON fromthe soil and litter into the stream causing the increased DON concentration withlittle effect on the hydrograph. Leaf litter can be a major source of DOC in streamwater. For example, in headwater streams at Coweeta and Hubbard Brook leaf lit-ter in the stream contributed as much as 30% to 40% of daily DOC export (Mc-Dowell and Fisher 1976; Meyer et al. 1998). Peak litterfall occurs at the same timeas peak DON concentrations in streamwater in WS10 (Triska et al. 1984). Hongve(1999) concluded that leaching of DOC from coniferous or deciduous litter couldexplain the markedly increased concentration of DOC in autumnal storm events inforested catchments. Precipitation may leach organic material from litter near thestream during storms or deliver litter into the stream itself, resulting in the observedprecipitation-concentration seasonal pattern. In a study of 14 small HJA streams,Bonin et al. (2000) observed a dramatic reduction in C:N ratio and increases inmicrobial respiration and enzyme activity of fine particulate organic matter follow-ing an October storm. They attributed these changes to inputs of litter with highconcentrations of organic N, which supports the idea that the fall increases in DONconcentration at HJA may be due to litter inputs. Another possible source of DONto the stream related to precipitation in the fall is throughfall, which was identifiedas a major source of DON to streams in a watershed in Switzerland (Hagedorn etal. 2000).
Spring/Summer
There were no consistent relationships between N concentrations and precipitationor discharge across all watersheds in spring/summer. Biological demand by stream
109
organisms probably plays a strong role in regulating stream N chemistry duringthis season. Diel fluctuations in NO3-N were observed during three summer low-flow days in a first-order stream in HJA (Vanderbilt, unpublished data) with highestconcentrations occurring during the night, presumably because of microbial uptakeduring the day. Biological uptake of DIN in HJA streams has been shown to belight-limited (Gregory 1980). Stable isotope tracer studies conducted in a third-or-der HJA stream clearly illustrate the high within-stream biological demand forNH4-N and NO3-N during the summer (Peterson et al. 2001).
Seasonal patterns at HJA compared to other sites
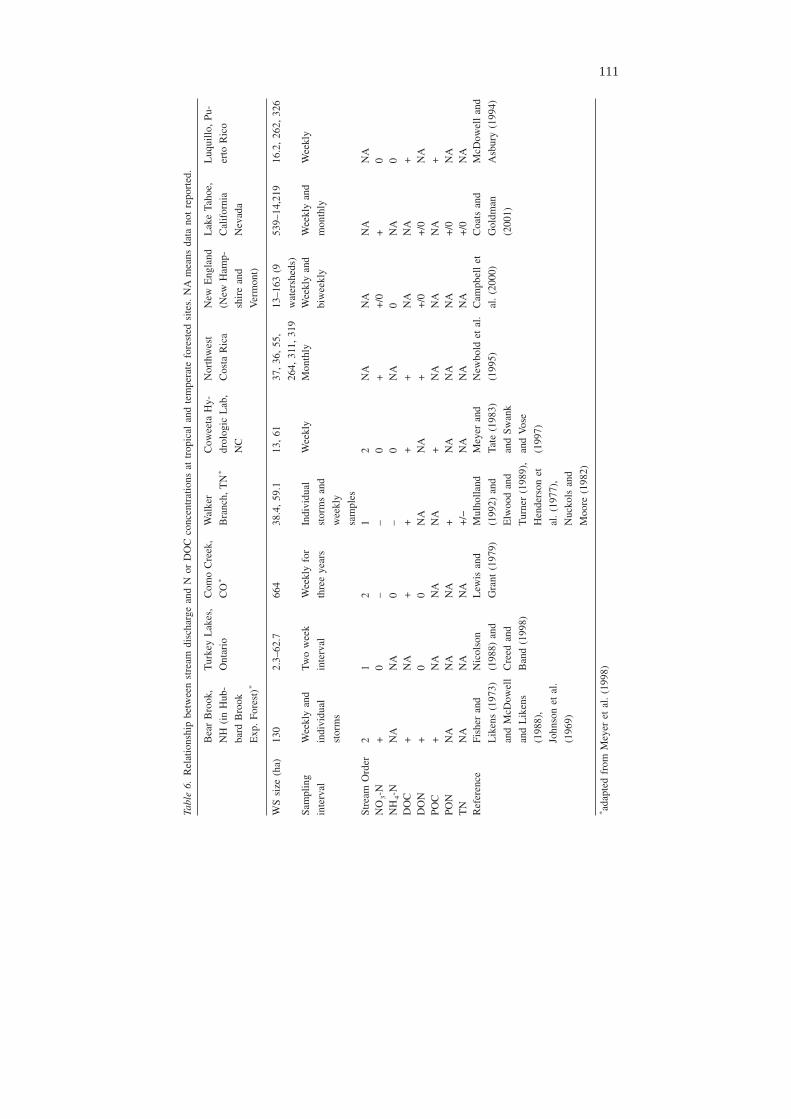
Relatively few studies examine the relationship between seasonal variation instream discharge and DON concentration (Table 6). A relationship between streamdischarge and DOC has been more frequently detected, however, and DON andDOC response to discharge will probably be similar (Hedin et al. 1995; Michalziket al. 2001). Consistent with results of this study, most others report that at the scaleof seasons or individual storms DOC concentration increases with increasing dis-charge. The variability detected in DOC or DON responses to increasing stormflowbetween sites may be a function of differing flowpaths. Hinton et al. (1998) foundthat DOC concentrations were positively correlated with stream discharge duringstorms in some small catchments in central Ontario, but not in others, and con-cluded that the difference in response was due to different DOC sources and flow-paths in riparian, hillslope and wetland areas. The importance of flowpaths in de-termining stream nitrogen chemistry is widely recognized (Mulholland 1993; Hillet al. 1999; Cirmo and McDonnell 1997). The relative amounts of pre-event “old”water that has had long contact with the soil and “new event” water flowing throughmacropores at least partially determine the concentration-discharge response of ni-trogen solutes. Hagedorn et al. (2000) were able to explain temporal variations inDOC and DON concentrations during storms based on changing contributions ofwater from topsoil, throughfall, and subsoil during stormflow.
While no seasonal changes in NO3-N concentrations were observed at the HJA,many other studies have reported seasonal fluctuations in NO3-N (Williams andMelack 1997; Feller and Kimmins 1979; Stottlemyer and Troendle 1992). Edmondset al. (1995) found highest NO3-N concentrations in the fall in a stream in an old-growth forested watershed in Olympic National Park, Washington, where precipi-tation patterns are similar to those at the HJA. More commonly, NO3-N pulses instream water have been reported during snowmelt (Hubbard Brook, NH: ??; IsleRoyale National Park, MI: Stottlemyer et al. (1998) and Stottlemyer and Toczyd-lowski (1999); Turkey Lakes, Ontario: Creed and Band (1998); Sierra Nevada, CA:Johnson et al. (1997)). This pattern is attributed to the flushing from the soil ofNO3-N built-up from decomposition during the winter (Rascher et al. 1987) andrelease of NO3-N stored in the snowpack (Williams and Melack 1991). Similarpulses of NO3-N concentration in streamwater have been observed when fall rainsflush soils of decomposition products built up during a dry summer (Edmonds etal. 1998; Fenn and Poth 1999). Winter, or dormant season, increases in NO3-N in
110
Tabl
e6.
Rel
atio
nshi
pbe
twee
nst
ream
disc
harg
ean
dN
orD
OC
conc
entr
atio
nsat
trop
ical
and
tem
pera
tefo
rest
edsi
tes.
NA
mea
nsda
tano
tre
port
ed.
Bea
rB
rook
,
NH
(in
Hub
-
bard
Bro
ok
Exp
.Fo
rest
)*
Tur
key
Lak
es,
Ont
ario
Com
oC
reek
,
CO
*
Wal
ker
Bra
nch,
TN
*
Cow
eeta
Hy-
drol
ogic
Lab
,
NC
Nor
thw
est
Cos
taR
ica
New
Eng
land
(New
Ham
p-
shir
ean
d
Ver
mon
t)
Lak
eTa
hoe,
Cal
ifor
nia
Nev
ada
Luq
uillo
,Pu
-
erto
Ric
o
WS
size
(ha)
130
2.3–
62.7
664
38.4
,59
.113
,61
37,
36,
55,
264,
311,
319
13–1
63(9
wat
ersh
eds)
539–
14,2
1916
.2,
262,
326
Sam
plin
g
inte
rval
Wee
kly
and
indi
vidu
al
stor
ms
Two
wee
k
inte
rval
Wee
kly
for
thre
eye
ars
Indi
vidu
al
stor
ms
and
wee
kly
sam
ples
Wee
kly
Mon
thly
Wee
kly
and
biw
eekl
y
Wee
kly
and
mon
thly
Wee
kly
Stre
amO
rder
21
21
2N
AN
AN
AN
AN
O3-N
+0
––
0+
+/0
+0
NH
4-N
NA
NA
0–
0N
A0
NA
0D
OC
+N
A+
++
+N
AN
A+
DO
N+
00
NA
NA
++
/0+
/0N
APO
C+
NA
NA
NA
+N
AN
AN
A+
PON
NA
NA
NA
+N
AN
AN
A+
/0N
AT
NN
AN
AN
A+
/−N
AN
AN
A+
/0N
AR
efer
ence
Fish
eran
d
Lik
ens
(197
3)
and
McD
owel
l
and
Lik
ens
(198
8),
John
son
etal
.
(196
9)
Nic
olso
n
(198
8)an
d
Cre
edan
d
Ban
d(1
998)
Lew
isan
d
Gra
nt(1
979)
Mul
holla
nd
(199
2)an
d
Elw
ood
and
Tur
ner
(198
9),
Hen
ders
onet
al.
(197
7),
Nuc
kols
and
Moo
re(1
982)
Mey
eran
d
Tate
(198
3)
and
Swan
k
and
Vos
e
(199
7)
New
bold
etal
.
(199
5)
Cam
pbel
let
al.
(200
0)
Coa
tsan
d
Gol
dman
(200
1)
McD
owel
lan
d
Asb
ury
(199
4)
*ad
apte
dfr
omM
eyer
etal
.(1
998)
111
these ecosystems are frequently followed by low growing season NO3-N concen-trations that are attributed to high NO3-N uptake by soils and vegetation (Foster etal. 1989; Edmonds et al. 1995; Lajtha et al. 1995). Where vegetation demand for Nis low, such as in mature deciduous forests, the summer-time low may not be ob-served (Vitousek and Reiners 1975; Martin 1979).
In contrast to the winter-maxima, summer-minima NO3-N concentration patternobserved at many sites in the northeastern US and Canada, streams at Coweeta Hy-drologic Lab, NC (Swank and Vose 1997) and at Walker Branch, TN (Mulholland1992) have the opposite seasonal NO3-N pattern. Mulholland (1992) posited that inareas where streamwater temperatures remain above 0 °C during the dormant sea-son rates of N immobilization from autumn leaf litter by soil and streamwater or-ganisms may be high throughout the fall and winter. The winter-minima, summer-maxima pattern of NO3-N in southern forest streams is influenced by year-roundnitrogen uptake in soils and by microbes and algae in the streams (Mulholland andHill 1997). This pattern might be expected at HJA, as well, where soil and streamsremain unfrozen throughout the year. There is evidently so little NO3-N availablein this high carbon, low nitrogen ecosystem that the pattern is not expressed.
Conclusion
The long-term precipitation and stream N chemistry datasets at HJA offer a valu-able record with which to examine temporal patterns of organic and inorganic Ndynamics in forested watersheds in an area free from atmospheric N pollution. Ouranalyses suggest that different factors may control organic vs. inorganic N export.Annual DON export is closely tied to annual stream discharge, in contrast to an-nual DIN export. At the seasonal scale, DON concentrations in streamwater in-creased with precipitation in the fall and winter, while variations in NO3-N andNH4-N concentrations at the seasonal scale were unrelated to precipitation orstream discharge in all watersheds. These results suggest that terrestrial or within-stream biotic controls may strongly influence streamwater concentrations of DIN,while DON may be much less sensitive to biological demand and more stronglytied to climate. High biological demand for NO3-N in this ecosystem may result instream concentrations of NO3-N too low to detect seasonal patterns. Our resultsimply that DON in streams may be recalcitrant, and largely unavailable to streamorganisms. Research characterizing DON compounds in streamwater and tracingDON to its source as root exudates, leaf leachate, or decomposition products willhelp clarify what drives the seasonal DON patterns observed in this study.
112
Acknowledgements
This research was supported by a cooperative agreement between the Pacific North-west Research Station of the U.S. Forest Service and Oregon State University, andby NSF OEB-96-32921 (H.J. Andrews Long-Term Ecological Research). The au-thors gratefully acknowledge the staff of the H.J. Andrews Experimental Forest fortheir years of effort making this high quality data set available. We thank Don Hen-shaw and Gody Spycher, managers of the Forest Science Database (FSDB), fromwhich these data came. We thank Cam Jones of the Central Chemical AnalyticalLab (CCAL) for his dedication to assuring that high quality data result from thestream and precipitation samples analyzed. Manuela Huso and Lisa Ganio providedvaluable statistical advice and Theresa Valentine provided Figure 1. We also thankthree anonymous reviewers for their suggestions that greatly improved this manu-script.
References
Ashby J.A., Bowden W.B. and Murdoch P.S. 1998. Controls on denitrification in riparian soils in head-water catchments of a hardwood forest in the Catskill Mountains, USA. Soil Biol. Biochem. 30:853–864.
Bakke P.D. 1993. The spatial and temporal variability of nitrate in streams of the Bull Run Watershed,Oregon. MS thesis, Oregon State University, Corvallis, USA.
Bond H.W. 1979. Nutrient concentration patterns in a stream draining a montane ecosystem in Utah.Ecology 60: 1184–1196.
Bonin H.L., Griffiths R.P. and Caldwell B.A. 2000. Nutrient and microbiological characteristics of finebenthic organic matter in mountain streams. J. N. Am. Benthol. Soc. 19: 235–249.
Boring L.R., Swank W.T., Waide J.B. and Henderson G.S. 1988. Sources, fates, and impacts of nitrogeninputs to terrestrial ecosystems; review and synthesis. Biogeochemistry 6: 119–159.
Boyer E.W., Hornberger G.M., Bencala K.E. and McKnight D. 1996. Overview of a simple model de-scribing variation of dissolved organic carbon in an upland catchment. Ecological Modelling 86:183–188.
Buffam I., Galloway J.N., Blum L.K. and McGlathery K.J. 2001. A stormflow/baseflow comparison ofdissolved organic matter concentrations and bioavailability in an Appalachian stream. Biogeochem-istry 53: 269–306.
Burns D.A. 1998. Retention of nitrate in an upland stream environment: A mass balance approach. Bio-geochemistry 40: 73–96.
Campbell J.L., Hornbeck J.W., McDowell W.H., Buso D.C., Shanley J.B. and Likens G.E. 2000. Dis-solved organic nitrogen budgets for upland, forested ecosystems in New England. Biogeochemistry49: 123–142.
Cirmo C.P. and McDonnell J.J. 1997. Linking the hydrologic and biogeochemical controls of nitrogentransport in near-stream zones of temperate-forested catchments: A review. J. Hydrol. 199: 88–120.
Coats R.N. and Goldman C.R. 2001. Patterns of nitrogen transport in streams of the Lake Tahoe basin,California-Nevada. Water Resour. Res. 37: 405–415.
Cornell S., Rendell A. and Jickells T. 1995. Atmospheric inputs of dissolved organic nitrogen to theoceans. Nature 376: 243–246.
Creed I.F. and Band L.E. 1998. Export of nitrogen from catchments within a temperate forest: Evidencefor a unifying mechanism regulated by variable source area dynamics. Water Resour. Res. 34: 3105–3120.
113
Dise N.B. and Wright R.F. 1995. Nitrogen leaching from European forests in relation to nitrogen depo-sition. For. Ecol. Manage. 71: 153–161.
Dyrness C.T. and Hawk G. 1972. Internal Report 43: Vegetation and Soils of the Hi-15 Watersheds, H.J.Andrews Experimental Forest. Coniferous Forest Biome, U.S. Analysis of Ecosystems. Universityof Washington, Seattle, Washington, USA.
Edmonds R.L., Thomas T.B. and Blew R.D. 1995. Biogeochemistry of an old-growth forested water-shed, Olympic National Park, Washington. Water Resour. Bull. 31: 409–419.
Edmonds R.L., Blew R.D., Marra J.L., Blew J., Barg A.K., Murray G. et al. 1998. Vegetation patterns,hydrology, and water chemistry in small watersheds in the Hoh River Valley, Olympic National Park.Scientific Monograph NPSD/NRUSGS/NRSM-98/02. United States Department of the Interior, Na-tional Park Service.
Elwood J.W. and Turner R.R. 1989. Streams: Water Chemistry and Ecology. In: Johnson D.W. and VanHook R.I. (eds), Analysis of Biogeochemical Cycling Processes in Walker Branch Watershed.Springer-Verlag, New York, pp. 301–350.
Feller M.C. and Kimmins J.P. 1979. Chemical characteristics of small streams near Haney in SouthwestBritish Columbia. Water Resour. Res. 15: 247–258.
Fenn M.E. and Poth M.A. 1999. Temporal and spatial trends in streamwater nitrate concentrations in theSan Bernardino Mountains, Southern California. J. Environ. Qual. 28: 822–836.
Fenn M.E., Poth M.A., Aber J.D., Baron J.S., Bormann B.T., Johnson D.W. et al. 1998. Nitrogen excessin North American ecosystems: Predisposing factors, ecosystem responses, and management strate-gies. Ecol. Appl. 8: 706–733.
Fisher S.G. and Likens G.E. 1973. Energy flow in Bear Brook, New Hampshire: An integrative ap-proach to stream ecosystem metabolism. Ecol. Monogr. 43: 421–439.
Foster N.W., Nicolson J.A. and Hazlett P.W. 1989. Temporal variation in nitrate and nutrient cations indrainage waters from a deciduous forest. J. Environ. Qual. 18: 238–244.
Frank H., Schleppi P., Waldner P. and Hannes F. 2000. Export of dissolved organic carbon and nitrogenfrom Gleysol dominated catchments-the significance of water flow paths. Biogeochemistry 50: 137–161.
Fredriksen R.L. 1969. A battery powered proportional water sampler. Water Resour. Res. 5: 1410–1413.Fredriksen R.L. 1972. Nutrient budgets of a Douglas-fir forest on an experimental watershed in western
Oregon. In: Proceedings-Research on Coniferous Forest Ecosystems-A Symposium. March 23–24,Bellingham, WA, USA., pp. 115–131.
Fredriksen R.L. 1975. Nitrogen, Phosphorus and Particulate Matter Budgets of Five Coniferous ForestEcosystems in the Western Cascades Range, Oregon. PhD Dissertation, Oregon State University,Corvallis, USA.
Gosz J. 1980. Nutrient budget studies for forests along an elevational gradient in New Mexico. Ecology61: 515–521.
Greenfield L.G. 1999. Weight loss and release of mineral nitrogen from decomposing pollen. Soil Biol.Biochem. 31: 353–361.
Gregory S.V. 1980. Effects of light, nutrients, and grazers on periphyton communities in streams. PhDDissertation, Oregon State University, Corvallis, USA.
Gundersen P., Callesen I. and de Vries W. 1998. Nitrate leaching in forest ecosystems is related to forestfloor C/N ratios. Environ. Pollut. 102 : 403–407.
Hagedorn F., Schleppi P., Peter W. and Hannes F. 2000. Export of dissolved organic carbon and nitrogenfrom Gleysol dominated catchments – the significance of water flow paths. Biogeochemistry 50:137–161.
Harr R.D. 1977. Water flux in soil and subsoil on a steep forested slope. Journal of Hydrology 33: 37–58.
Harr R.D. 1981. Some characteristics and consequences of snowmelt during rainfall in western Oregon.J. Hydrol. 53: 277–304.
Hart S.C., Nason G.E., Myrold D.D. and Perr D.A. 1994. Dynamics of gross nitrogen transformationsin an old-growth forest: the carbon connection. Ecology 75: 880–891.
114
Hedin L.O., Armesto J.J. and Johnson A.H. 1995. Patterns of nutrient loss from unpolluted, old-growthtemperate forests: Evaluation of biogeochemical theory. Ecology 76: 493–509.
Henderson G.S., Hunley A. and Selvidge W. 1977. Nutrient discharge from Walker Branch Watershed.In: Correll D.L. (ed.), Watershed Research in Eastern North America: A Workshop to Compare Re-sults. Chesapeake Bay Center for Environmental Studies, Smithsonian Institution, Edgewater, Mary-land, USA, pp. 307–320.
Hill A.R. 1986. Stream nitrate-N loads in relation to variations in annual and seasonal runoff regimes.Water Resour. Bull. 22: 829–839.
Hill A.R. 1993. Nitrogen dynamics of storm runoff in the riparian zone of a forested watershed. Bio-geochemistry 29: 19–44.
Hill A.R., Kemp W.A., Buttle J.M. and Goodyear 1999. Nitrogen chemistry of subsurface storm runoffon forested Canadian Shield hillslopes. Water Resourc. Res. 35: 811–821.
Hinton M.J., Schiff S.L. and English M.C. 1998. Sources and flowpaths of dissolved organic carbonduring storms in two forested watersheds of the Precambrian Shield. Biogeochemistry 41: 175–197.
Holland E.A., Dentener F.J., Braswell B.H. and Sulzman J.M. 1999. Contemporary and pre-industrialglobal reactive nitrogen budgets. Biogeochemistry 46: 7–43.
Hongve D. 1999. Production of dissolved organic carbon in forested catchments. J Hydrol. 224: 91–99.Hornberger G.M., Bencala K.E. and McKnight D.M. 1994. Hydrological controls on dissolved organic
carbon during snowmelt in the Snake River near Montezuma, Colorado. Biogeochemistry 25: 147–165.
Johnson D.W., Susfalk R.B. and Dahlgren R.A. 1997. Nutrient fluxes in forests of the eastern SierraNevada mountains, United States of America. Global Biogeochem. Cycles 11: 673–681.
Johnson N.M., Likens G.E., Bormann F.H., Fisher D.W. and Pierce R.S. 1969. A working model for thevariation in stream chemistry at the Hubbard Brook Experimental Forest, New Hampshire. WaterResour. Res. 5: 1353–1363.
Lajtha K., Seely B. and Valiela I. 1995. Retention and leaching losses of atmospherically-derived nitro-gen in the aggrading coastal watershed of Waquoit Bary, MA. Biogeochemistry 28: 33–54.
Lepisto A., Andersson L., Arheimer B. and Sundblad K. 1995. Influence of catchment characteristics,forestry, activities and deposition on nitrogen export from small forested catchments. Water Air SoilPollut. 84: 81–102.
Lewis W.M. Jr and Grant M.C. 1979. Relationships between stream discharge and yield of dissolvedsubstances from a Colorado mountain watershed. Soil Science 128: 353–363.
Lewis W.M. Jr, Melack J.M., McDowell W.H., McClain M. and Richey J.E. 1999. Nitrogen yields fromundisturbed watersheds in the Americas. Biogeochemistry 46: 149–162.
Likens G.E. and Bormann F.H. 1995. Biogeochemistry of a Forested Ecosystem. Springer-Verlag, NewYork.
Lovett G.M. and Lindberg S.E. 1993. Atmospheric deposition and canopy interactions of nitrogen inforests. Can. J. For. Res. 23: 1603–1616.
Martin C.W. 1979. Precipitation and streamwater chemistry in an undisturbed forested watershed in NewHampshire. Ecology 60: 36–42.
Martin C.W. and Harr R.D. 1988. Precipitation and streamwater chemistry from undisturbed watershedsin the Cascade Mountains of Oregon. Water Air Soil Pollut. 42: 203–219.
Martin C.W. and Harr R.D. 1989. Logging of mature Douglas-fir in western Oregon has little effect onnutrient output budgets. Can. J. For. Res. 19: 35–43.
McDowell W.H. and Fisher S.G. 1976. Autumnal processing of dissolved organic matter in a smallwoodland stream ecosystem. Ecology 57: 561–569.
McDowell W.H. and Asbury C.E. 1994. Export of carbon, nitrogen and major ions from three tropicalmontane watersheds. Limnol. Oceanogr. 39: 111–125.
McDowell W.H. and Likens G.E. 1988. Origin, composition, and flux of dissolved organic carbon in theHubbard Brook Valley. Ecol. Monogr. 58: 177–195.
McHale M.R., Mitchell M.J., McDonnell J.J. and Cirmo C.P. 2000. Nitrogen solutes in an Adirondackforested watershed: Importance of dissolved organic nitrogen. Biogeochemistry 48: 165–184.
115
Meyer J.L. and Tate C.M. 1983. The effects of watershed disturbance on dissolved organic carbon dy-namics of a stream. Ecology 64: 33–44.
Meyer J.L., Wallace J.B. and Eggert S.L. 1998. Leaf litter as a source of dissolved organic carbon instreams. Ecosystems 1: 240–249.
Mitchell M.J., Driscoll C.T., Kahl J.S., Likens G.E., Murdoch P.S. and Pardo L.H. 1996. Climatic con-trol of nitrate loss from forested watersheds in the northeast United States. Environ. Sci. Technol.30: 2609–2612.
Michalzik B., Kalbitz K., Park J.-H., Solinger S. and Matzner E. 2001. Fluxes and concentrations ofdissolved organic carbon and nitrogen-a synthesis for temperate forests. Biogeochemistry 52: 173–205.
Moore I.D. and Nuckols J.R. 1984. Relationship between atmospheric nitrogen deposition and the streamnitrogen profile. J. Hydrol. 74: 81–103.
Mulholland P.J. 1993. Hydrometric and stream chemistry evidence of three storm flowpaths in WalkerBranch Watershed. J. Hydrol. 151: 291–316.
Mulholland P.J. 1992. Regulation of nutrient concentrations in a temperate forest stream: Roles of up-land, riparian, and instream processes. Limnol. Oceanogr. 37: 1512–1526.
Mulholland P.J. and Hill W.R. 1997. Seasonal patterns in streamwater nutrient and dissolved organiccarbon concentrations: Separating catchment flow path and in-stream effects. Water Resourc. Res.33: 1297–1306.
Murdoch P.S. and Stoddard J.L. 1992. Role of nitrate in the acidification of streams in the CatskillMountains of New York. Water Resourc. Res. 28: 2707–2720.
Nasholm T., Ekblad A., Nordin A., Giesler R., Hogberg M. and Hogberg P. 1998. Boreal forest plantstake up organic nitrogen. Nature 392: 914–916.
National Atmospheric Deposition Program (NADP) 1999. (NRSP-3)/National Trends Network. NADPProgram Office, Illinois State Water Survey.
Newbold J.D., Sweeney B.W., Jackson J.K. and Kaplan L.A. 1995. Concentrations and export of solutesfrom six mountain streams in northwestern Costa Rica. J. N. Am. Bethol. Soc. 14: 21–37.
Nicolson J.A. 1988. Water and chemical budgets for terrestrial basins at the Turkey Lakes WatershedCan. J. Fish. Aquat. Sci. 45: 88–95.
Nuckols J.R. and Moore I.D. 1982. The influence of atmospheric nitrogen influx upon the stream nitro-gen profile of a relatively undisturbed forested watershed. J. Hydrol. 57: 113–135.
Pardo L.H., Driscoll C.T. and Likens G.E. 1995. Patterns of nitrate loss from a chronosequence of clear-cut watersheds. Water Air Soil Pollut. 85: 1659–1664.
Perkins R.M. 1997. Climatic and Physiographic Controls on Peakflow Generation in the Western Cas-cades, Oregon. PhD Dissertation, Oregon State University, Corvallis, USA.
Peterson B.J., Wollheim W.M., Mulholland P.J., Webster J.R., Meyer J.L., Tank J.L. et al. 2001. Controlof nitrogen export from watersheds by headwater streams. Science 292: 86–90.
Qualls R.G. and Haines B.L. 1992. Biodegradability of dissolved organic matter in forest throughfall,soil solution, and stream water. Soil Sci. Soc. Am. J. 56: 578–586.
Rascher C.M., Driscoll C.T. and Peter N.E. 1987. Concentration and flux of solutes from snow andforest floor during snowmelt in the West-Central Adirondack Region of New York. Biogeochemistry3: 209–224.
Rothacher J., Dyrness T. and Richardson R.L. 1967. Hydrologic and Related Characteristics of ThreeSmall Watersheds in the Oregon Cascades. General Technical Report. U.S. Department of Agricul-ture, U.S. Forest Service, Pacific Northwest Research Station, Portland, Oregon, USA, 54 pp.
SAS Institute, Inc. 1990. SAS/STAT Users Guide. Version 6. SAS Institute Inc., Cary, NC, USA.Seely B., Lajtha K. and Salvucci G.D. 1998. Transformation and retention of nitrogen in a coastal forest
ecosystem. Biogeochemistry 42: 325–343.Sollins P., Grier C.C., McCorison F.M., Cromack K. Jr and Fredriksen R.L. 1980. The internal element
cycles of an old-growth Douglas-fir ecosystem in western Oregon. Ecol. Monogr. 50: 261–285.Sollins P. and McCorison F.M. 1981. Nitrogen and carbon solution chemistry of an old growth conif-
erous forest watershed before and after cutting. Water Resour. Res. 17: 1409–1418.
116
Stoddard J.L. 1994. Long-term changes in watershed retention of nitrogen. In: Baker L.A. (ed.), Envi-ronmental chemistry of lakes and reservoirs. Advances in chemistry series 237. American ChemicalSociety, Washington, DC, USA, pp. 223–284.
Stohlgren T.J., Melack J.M., Esperanza A.M. and Parsons D.J. 1991. Atmospheric deposition and soluteexport in giant sequoia-mix conifer watersheds in the Sierra Nevada. Biogeochemistry 12: 207–230.
Stottlemyer R., Toczydlowski D. and Herrmann R. 1998. Biogeochemistry of a Mature Boreal Ecosys-tem: Isle Royale National Park, Michigan. Scientific Monograph NPS/NRUSGS/NRSM-98/01.United States Department of the Interior, National Park Service.
Stottlemyer R. and Toczydlowski D. 1999. Seasonal relationships between soil precipitation, forest floorand streamwater nitrogen, Isle Royale, Michigan. Soil Sci. Soc. Am. J. 63: 389–398.
Stottlemyer R. and Troendle C.A. 1992. Nutrient concentration patterns in streams draining alpine andsubalpine catchments, Fraser Experimental Forest, Colorado. J. Hydrol. 140: 179–208.
Swank W.T. and Vose J.M. 1997. Long-term nitrogen dynamics of Coweeta forested watersheds in thesoutheastern United States of America. Global Biogeochem. Cycles 11: 657–671.
Swanson F.J., Fredriksen R.L. and McCorison F.M. 1982. Material transfer in a western Oregon for-ested watershed. In: Edmonds R.L. (ed.), Analysis of coniferous forest ecosystems in the westernUnited States. US/IBP Synthesis Series 14. Hutchinson Ross Publishing Company, Stroudsburg, PA,USA, pp. 233–266.
Triska F.J., Sedell J.R., Cromack K. Jr, Gregory S.V. and McCorison M.F. 1984. Nitrogen budget for asmall coniferous forest stream. Ecol. Monogr. 54: 119–140.
Vermes J.-F. and Myrold D.D. 1992. Denitrification in forest soils in Oregon. Can. J. For. Res. 22: 504–512.
Vitousek P.M. 1977. The regulation of element concentrations in mountain streams in the northeasternUnited States. Ecol. Monogr. 47: 65–87.
Vitousek P.M. and Reiners W.A. 1975. Ecosystem succession and nutrient retention: A hypothesis. Bio-science 25: 376–381.
Wigington P.J. Jr, Church M.R., Strickland T.C., Eshleman K.N. and Van Sickle J. 1998. Autumn chem-istry of Oregon Coast Range streams. J. Am. Water Res. Assoc. 34: 1035–1049.
Williams M.R. and Melack J.M. 1997. Atmospheric deposition, mass balances, and processes regulatingstormwater solute concentrations in mixed-conifer catchments of the Sierra Nevada, California. Bio-geochemistry 37: 111–144.
Williams M.W. and Melack J.M. 1991. Solute chemistry of snowmelt and runoff in an alpine basin,Sierra Nevada. Water Resourc. Res. 27: 1575–1588.
Wondzell S.M. and Swanson F.J. 1996. Seasonal and storm dynamics of the hyporheic zone of a 4th-order mountain stream. II Nitrogen cycling. J. N. Am. Benthol. Soc. 15: 20–34.
117


![[CM2015] Chapter 7 - Biogeochemistry](https://static.fdocuments.net/doc/165x107/589f959c1a28ab1b198b6265/cm2015-chapter-7-biogeochemistry.jpg)