Biogas Upgrading Scenarios in Europe Status & … removal no yes yes recommended yes Investment cost...
46
UNIVERSITY OF JYVÄSKYLÄ Biogas Upgrading Scenarios in Europe – Status & Prospects Dr Prasad Kaparaju University Lecturer International Workshop on Promotion of Biogas Upgrading and Bottling in India and EU August 22 - 24, 2013, IIT Delhi
Transcript of Biogas Upgrading Scenarios in Europe Status & … removal no yes yes recommended yes Investment cost...
UNIVERSITY OF JYVÄSKYLÄ
Biogas Upgrading Scenarios in
Europe – Status & Prospects
Dr Prasad Kaparaju
University Lecturer
International Workshop on Promotion of Biogas Upgrading and Bottling in India and EU August 22 - 24, 2013, IIT Delhi
UNIVERSITY OF JYVÄSKYLÄ
EU’s renewable energy and transport
system
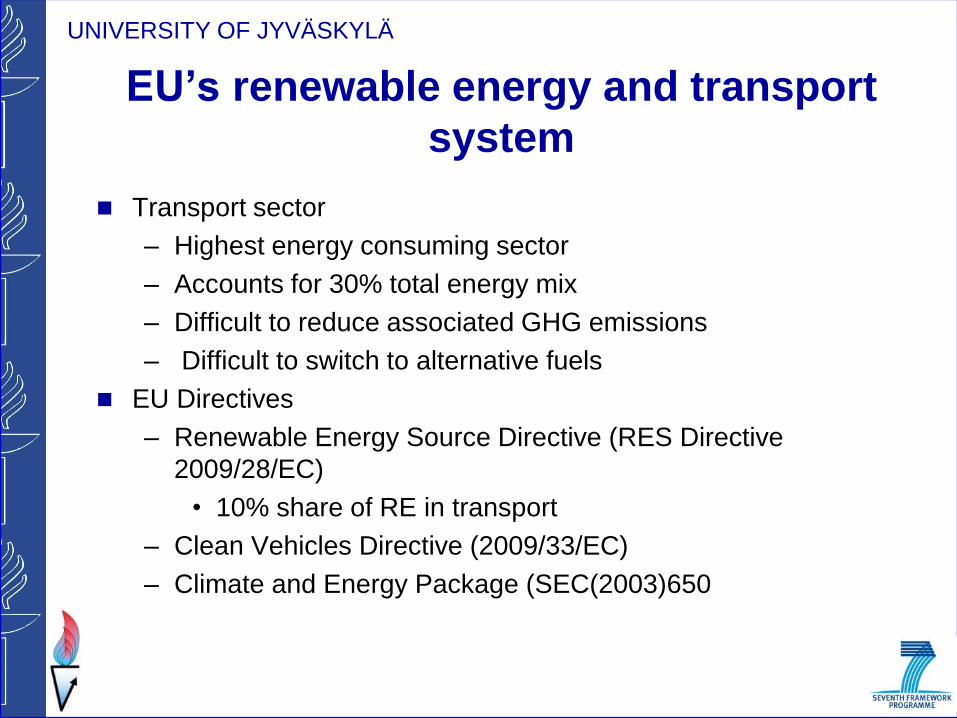
Transport sector
– Highest energy consuming sector
– Accounts for 30% total energy mix
– Difficult to reduce associated GHG emissions
– Difficult to switch to alternative fuels
EU Directives
– Renewable Energy Source Directive (RES Directive
2009/28/EC)
• 10% share of RE in transport
– Clean Vehicles Directive (2009/33/EC)
– Climate and Energy Package (SEC(2003)650
UNIVERSITY OF JYVÄSKYLÄ
Importance of biomethane in EU’s renewable
energy and transport system
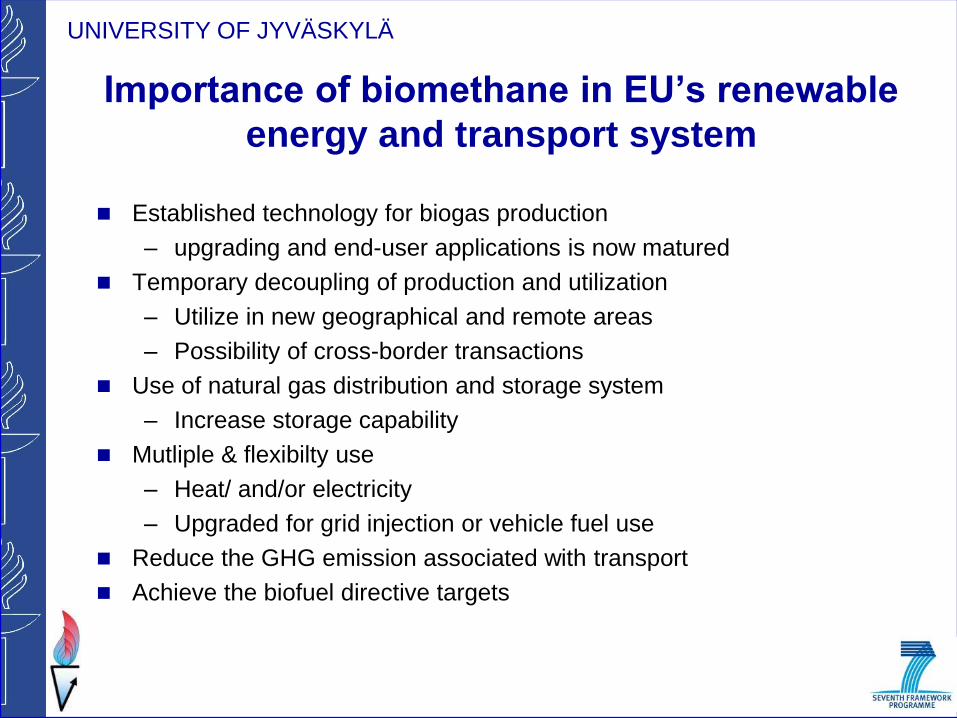
Established technology for biogas production
– upgrading and end-user applications is now matured
Temporary decoupling of production and utilization
– Utilize in new geographical and remote areas
– Possibility of cross-border transactions
Use of natural gas distribution and storage system
– Increase storage capability
Mutliple & flexibilty use
– Heat/ and/or electricity
– Upgraded for grid injection or vehicle fuel use
Reduce the GHG emission associated with transport
Achieve the biofuel directive targets
UNIVERSITY OF JYVÄSKYLÄ
Biogas industry in Europe
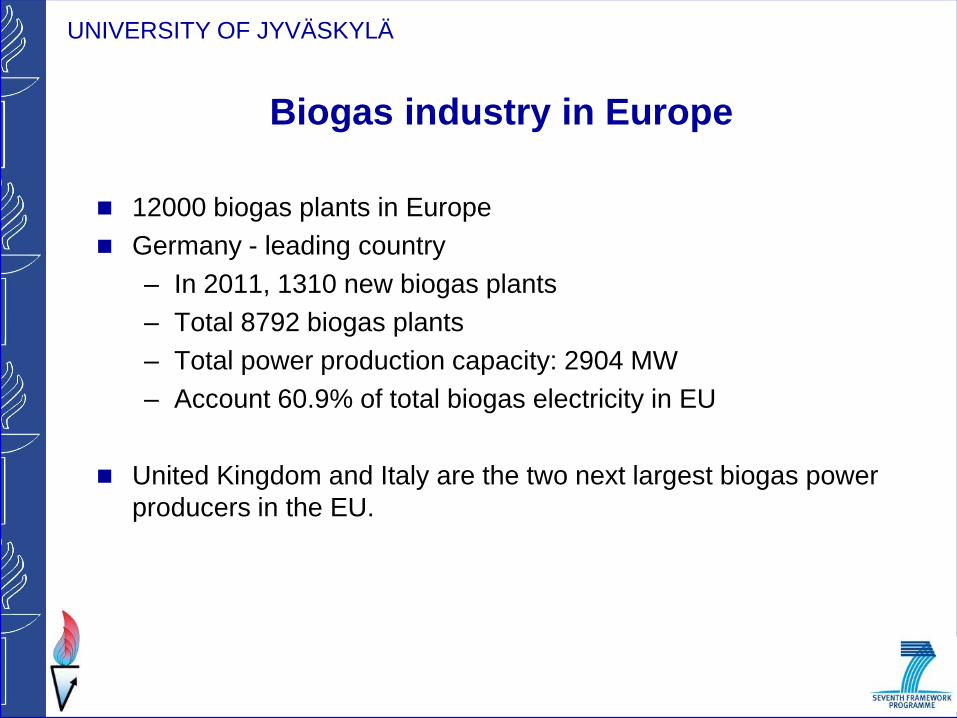
12000 biogas plants in Europe
Germany - leading country
– In 2011, 1310 new biogas plants
– Total 8792 biogas plants
– Total power production capacity: 2904 MW
– Account 60.9% of total biogas electricity in EU
United Kingdom and Italy are the two next largest biogas power
producers in the EU.
UNIVERSITY OF JYVÄSKYLÄ
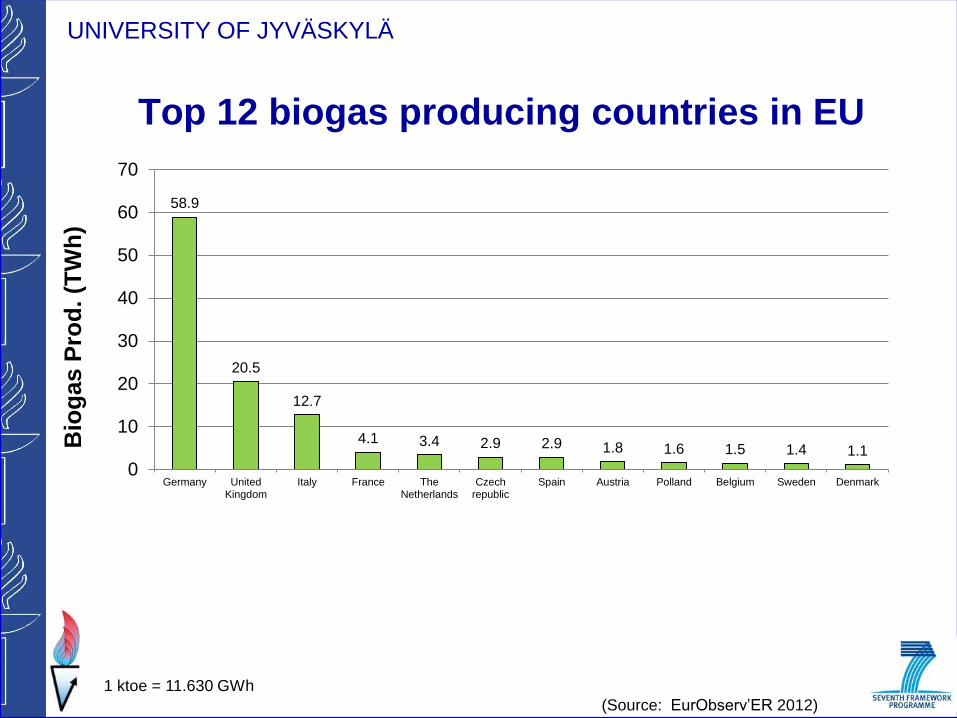
Top 12 biogas producing countries in EU
(Source: EurObserv’ER 2012)
1 ktoe = 11.630 GWh
58.9
20.5
12.7
4.1 3.4 2.9 2.9 1.8 1.6 1.5 1.4 1.1
0
10
20
30
40
50
60
70
Germany UnitedKingdom
Italy France TheNetherlands
Czechrepublic
Spain Austria Polland Belgium Sweden Denmark
Bio
gas P
rod
. (T
Wh
)
UNIVERSITY OF JYVÄSKYLÄ
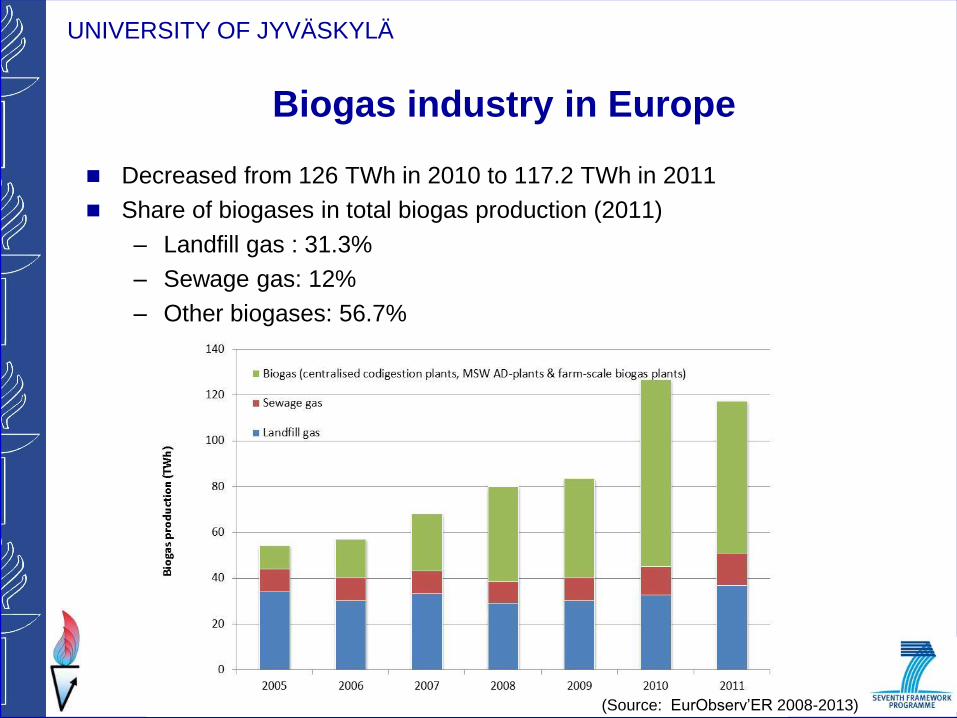
Biogas industry in Europe
Decreased from 126 TWh in 2010 to 117.2 TWh in 2011
Share of biogases in total biogas production (2011)
– Landfill gas : 31.3%
– Sewage gas: 12%
– Other biogases: 56.7%
(Source: EurObserv’ER 2008-2013)
UNIVERSITY OF JYVÄSKYLÄ
Landfill gas
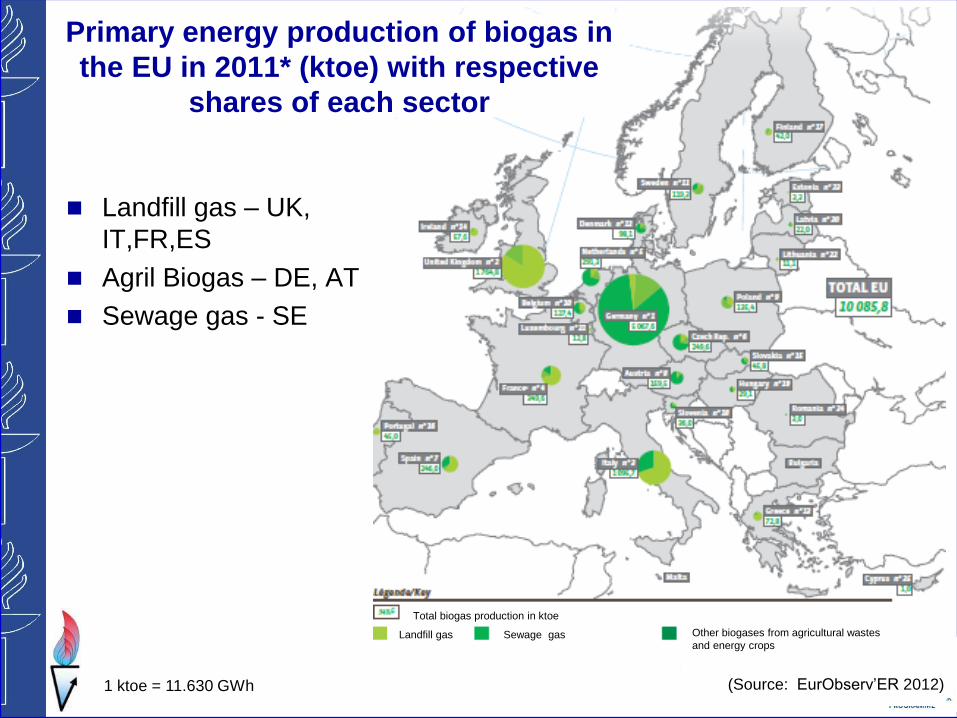
Primary energy production of biogas in
the EU in 2011* (ktoe) with respective
shares of each sector
Landfill gas – UK,
IT,FR,ES
Agril Biogas – DE, AT
Sewage gas - SE
Sewage gas Other biogases from agricultural wastes
and energy crops
Total biogas production in ktoe
(Source: EurObserv’ER 2012) 1 ktoe = 11.630 GWh
UNIVERSITY OF JYVÄSKYLÄ
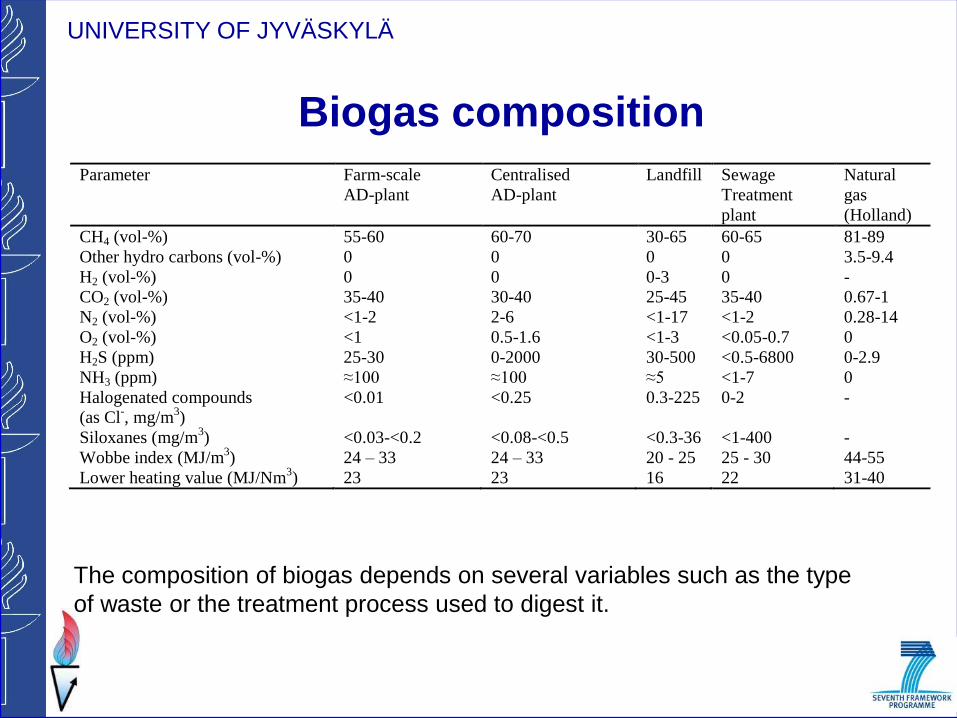
Biogas composition
The composition of biogas depends on several variables such as the type
of waste or the treatment process used to digest it.
Parameter Farm-scale
AD-plant
Centralised
AD-plant
Landfill Sewage
Treatment
plant
Natural
gas
(Holland)
CH4 (vol-%) 55-60 60-70 30-65 60-65 81-89
Other hydro carbons (vol-%) 0 0 0 0 3.5-9.4
H2 (vol-%) 0 0 0-3 0 -
CO2 (vol-%) 35-40 30-40 25-45 35-40 0.67-1
N2 (vol-%) <1-2 2-6 <1-17 <1-2 0.28-14
O2 (vol-%) <1 0.5-1.6 <1-3 <0.05-0.7 0
H2S (ppm) 25-30 0-2000 30-500 <0.5-6800 0-2.9
NH3 (ppm) ≈100 ≈100 ≈5 <1-7 0
Halogenated compounds
(as Cl-, mg/m
3)
<0.01 <0.25 0.3-225 0-2 -
Siloxanes (mg/m3) <0.03-<0.2 <0.08-<0.5 <0.3-36 <1-400 -
Wobbe index (MJ/m3) 24 – 33 24 – 33 20 - 25 25 - 30 44-55
Lower heating value (MJ/Nm3) 23 23 16 22 31-40

UNIVERSITY OF JYVÄSKYLÄ
BIOGAS UTILIZATION
Traditional
– Cooking, Lighting
Commercial
– Heat and steam
– Electricity and/or heat (cogeneration in CHP)
– Vehicle fuel
– Fuel cells
– Injection to natural gas grid
UNIVERSITY OF JYVÄSKYLÄ
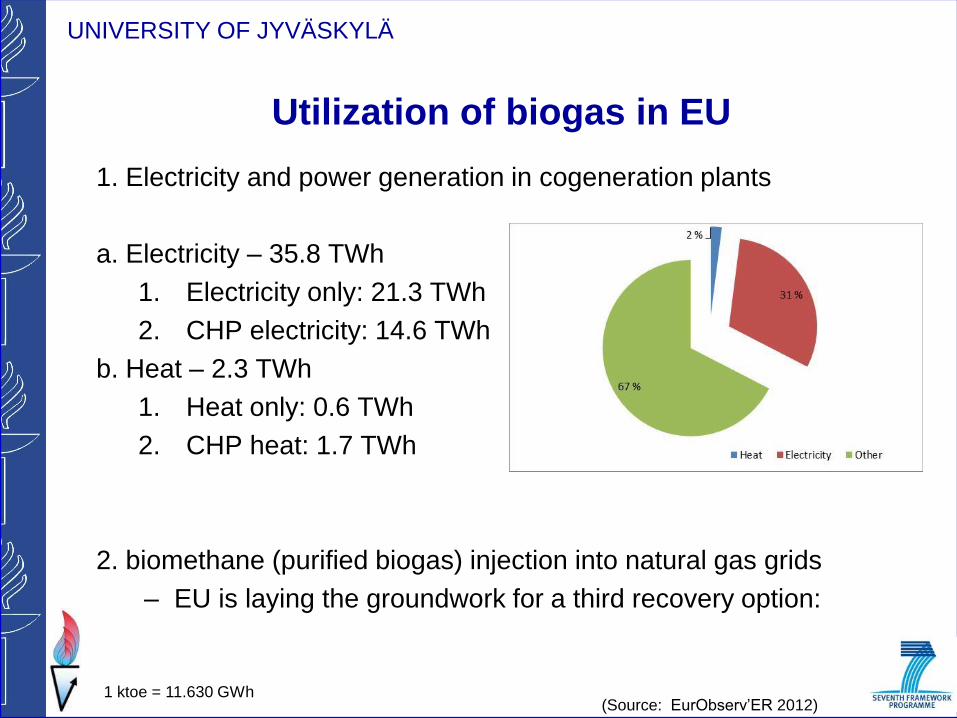
Utilization of biogas in EU
1. Electricity and power generation in cogeneration plants
a. Electricity – 35.8 TWh
1. Electricity only: 21.3 TWh
2. CHP electricity: 14.6 TWh
b. Heat – 2.3 TWh
1. Heat only: 0.6 TWh
2. CHP heat: 1.7 TWh
2. biomethane (purified biogas) injection into natural gas grids
– EU is laying the groundwork for a third recovery option:
(Source: EurObserv’ER 2012) 1 ktoe = 11.630 GWh
UNIVERSITY OF JYVÄSKYLÄ
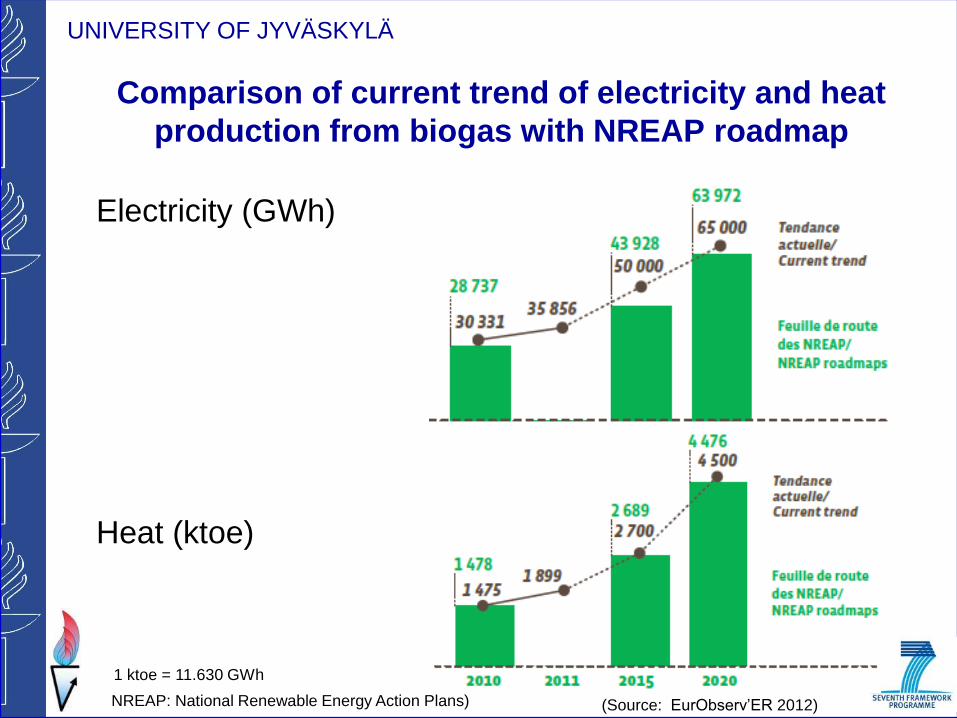
Comparison of current trend of electricity and heat
production from biogas with NREAP roadmap
(Source: EurObserv’ER 2012) NREAP: National Renewable Energy Action Plans)
Electricity (GWh)
Heat (ktoe)
1 ktoe = 11.630 GWh
UNIVERSITY OF JYVÄSKYLÄ
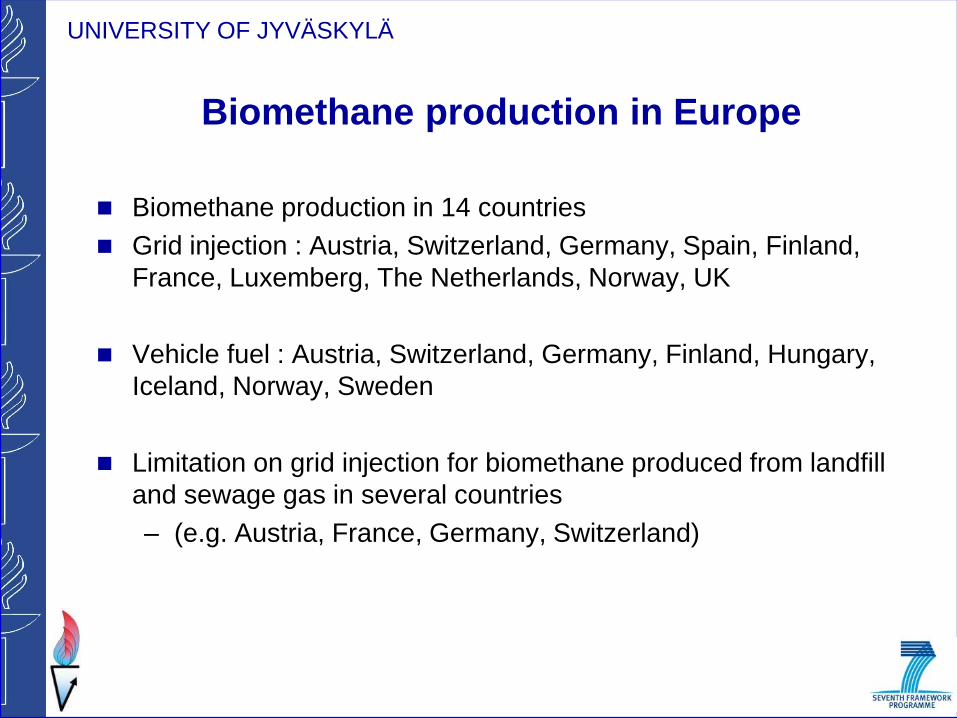
Biomethane production in Europe
Biomethane production in 14 countries
Grid injection : Austria, Switzerland, Germany, Spain, Finland,
France, Luxemberg, The Netherlands, Norway, UK
Vehicle fuel : Austria, Switzerland, Germany, Finland, Hungary,
Iceland, Norway, Sweden
Limitation on grid injection for biomethane produced from landfill
and sewage gas in several countries
– (e.g. Austria, France, Germany, Switzerland)
UNIVERSITY OF JYVÄSKYLÄ
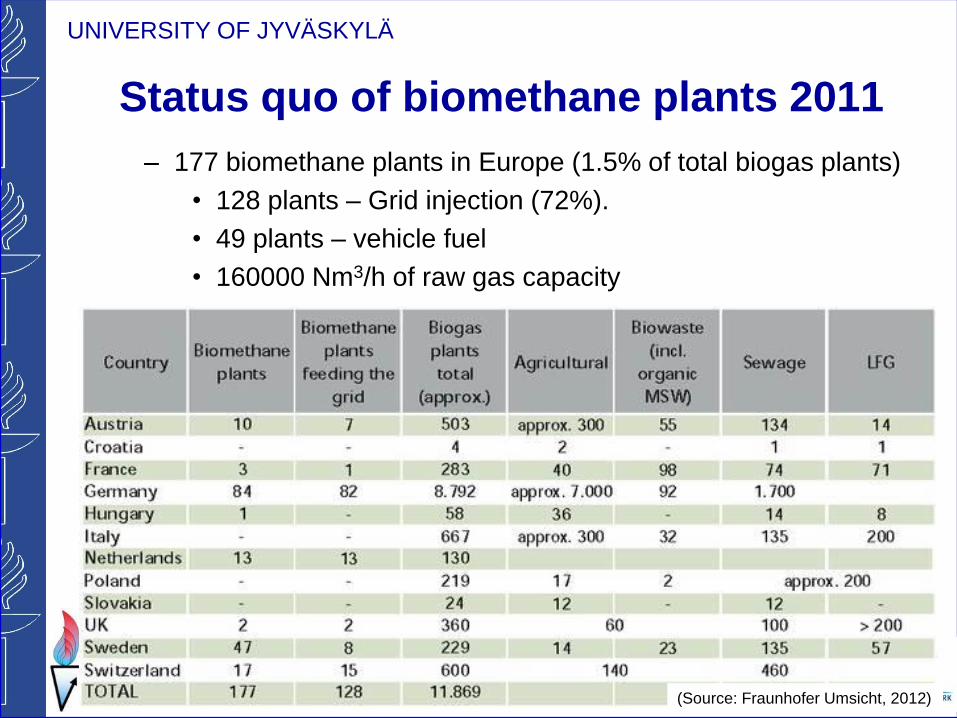
Status quo of biomethane plants 2011
– 177 biomethane plants in Europe (1.5% of total biogas plants)
• 128 plants – Grid injection (72%).
• 49 plants – vehicle fuel
• 160000 Nm3/h of raw gas capacity
(Source: Fraunhofer Umsicht, 2012)
UNIVERSITY OF JYVÄSKYLÄ
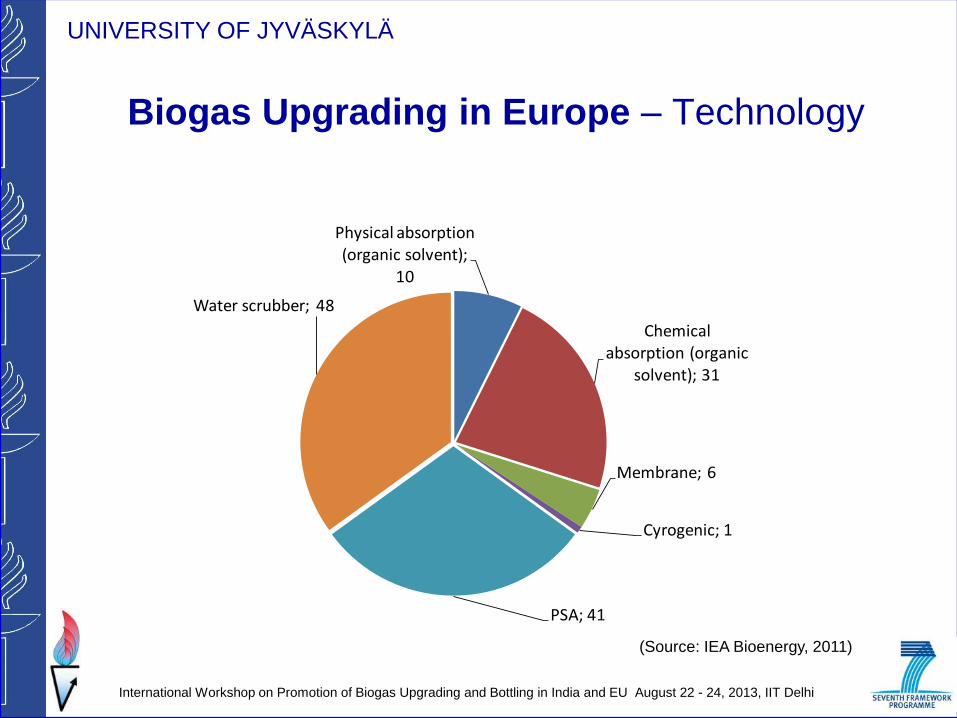
Biogas Upgrading in Europe – Technology
International Workshop on Promotion of Biogas Upgrading and Bottling in India and EU August 22 - 24, 2013, IIT Delhi
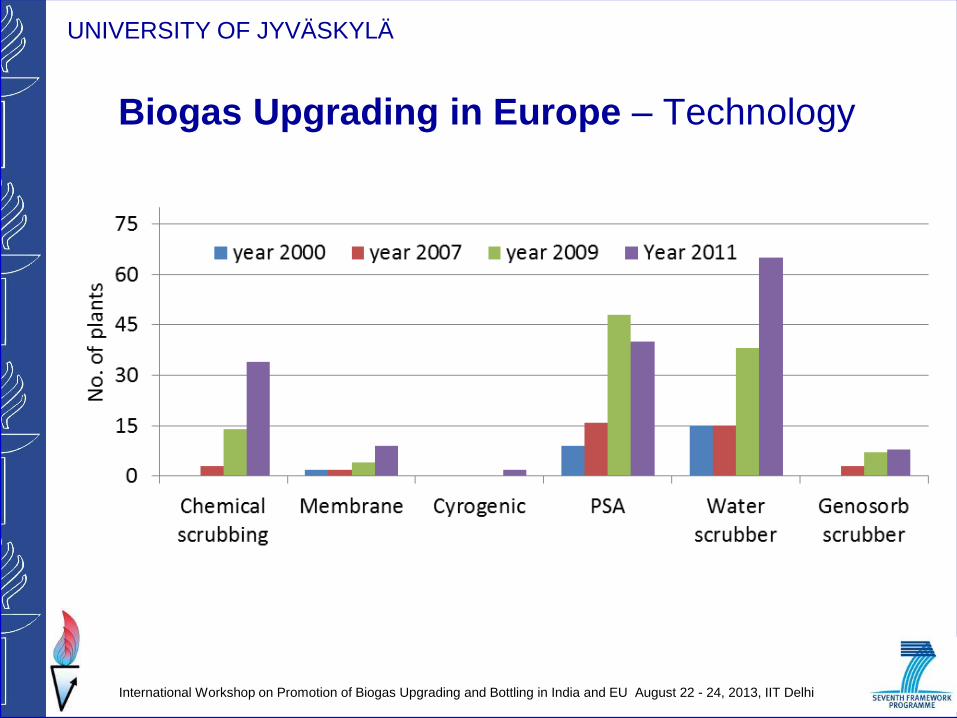
(Source: IEA Bioenergy, 2011)
Physical absorption (organic solvent);
10
Chemical absorption (organic
solvent); 31
Membrane; 6
Cyrogenic; 1
PSA; 41
Water scrubber; 48
UNIVERSITY OF JYVÄSKYLÄ
Biogas Upgrading in Europe – Technology
International Workshop on Promotion of Biogas Upgrading and Bottling in India and EU August 22 - 24, 2013, IIT Delhi
UNIVERSITY OF JYVÄSKYLÄ
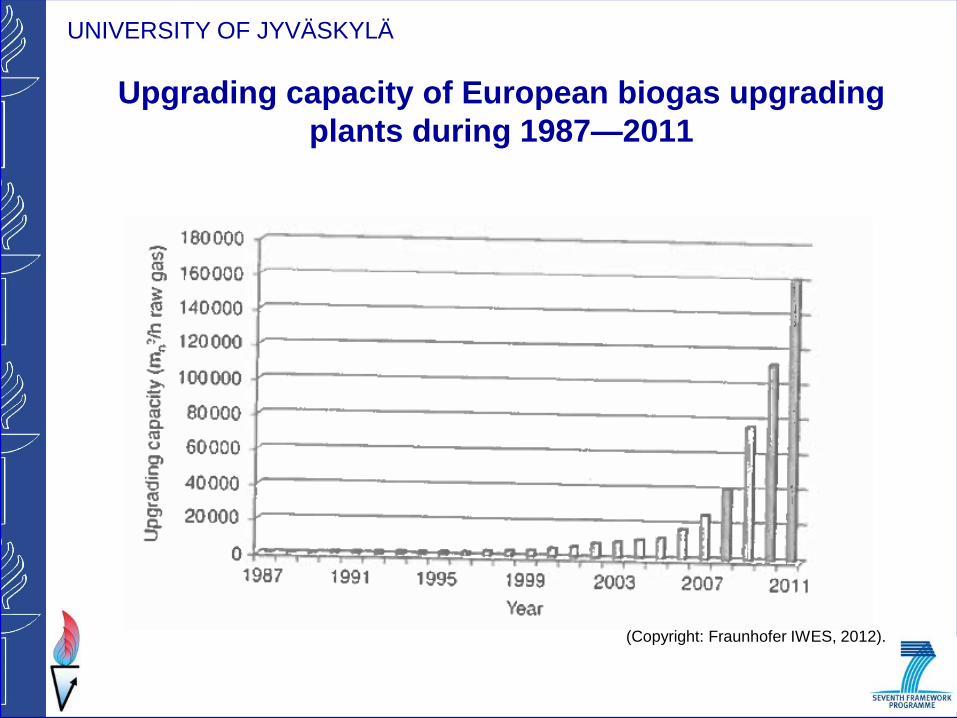
Upgrading capacity of European biogas upgrading
plants during 1987—2011
(Copyright: Fraunhofer IWES, 2012).

UNIVERSITY OF JYVÄSKYLÄ
Biogas Upgrading – Technology and raw
biogas capacity (Nm3/h)
International Workshop on Promotion of Biogas Upgrading and Bottling in India and EU August 22 - 24, 2013, IIT Delhi
Physical absorption (organic solvent);
5225
Chemical absorption (organic solvent);
32170
Membrane; 1230
Cyrogenic; 1600
PSA; 20230
Water scrubber; 46440
(Source: IEA Bioenergy, 2011)
UNIVERSITY OF JYVÄSKYLÄ
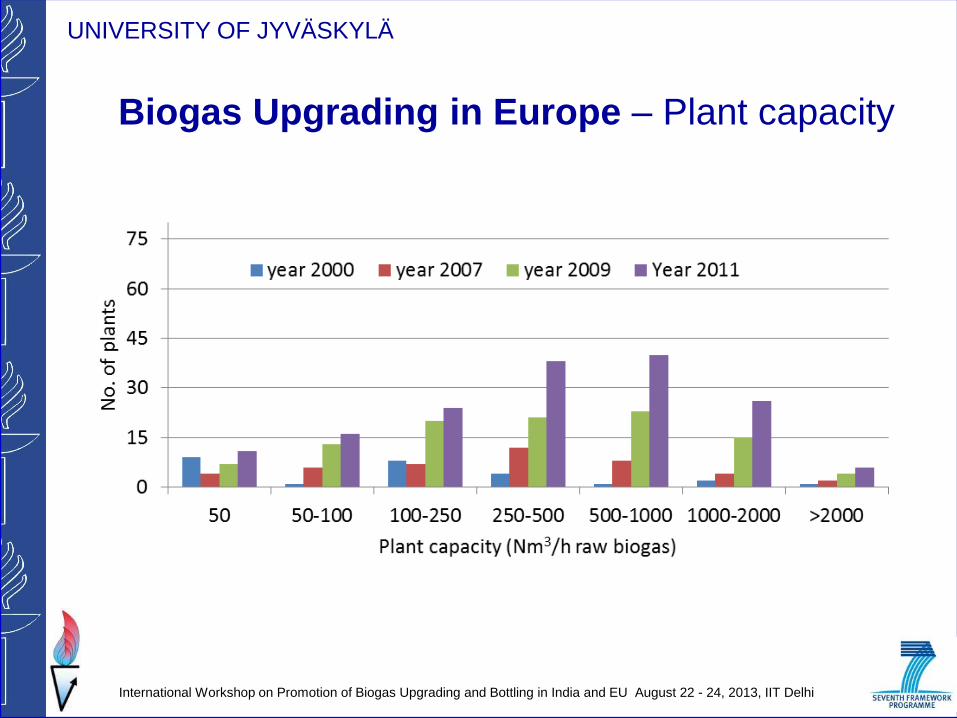
Biogas Upgrading in Europe – Plant capacity
International Workshop on Promotion of Biogas Upgrading and Bottling in India and EU August 22 - 24, 2013, IIT Delhi
UNIVERSITY OF JYVÄSKYLÄ
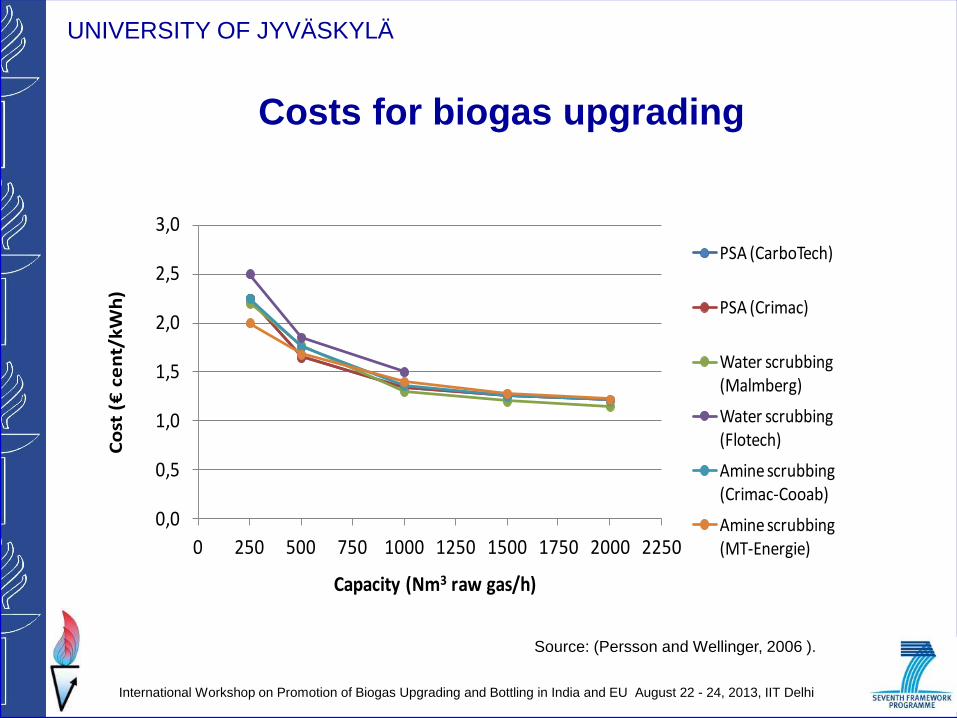
Costs for biogas upgrading
International Workshop on Promotion of Biogas Upgrading and Bottling in India and EU August 22 - 24, 2013, IIT Delhi
0,0
0,5
1,0
1,5
2,0
2,5
3,0
0 250 500 750 1000 1250 1500 1750 2000 2250
Co
st (€
cen
t/k
Wh
)
Capacity (Nm3 raw gas/h)
PSA (CarboTech)
PSA (Crimac)
Water scrubbing (Malmberg)
Water scrubbing (Flotech)
Amine scrubbing (Crimac-Cooab)
Amine scrubbing (MT-Energie)
Source: (Persson and Wellinger, 2006 ).
UNIVERSITY OF JYVÄSKYLÄ
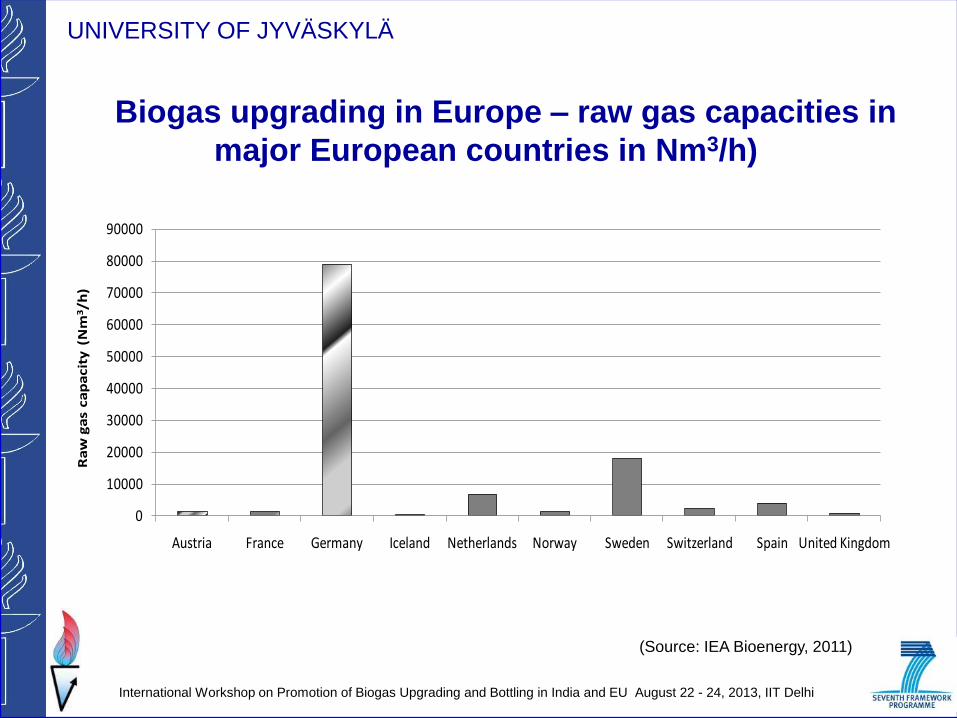
Biogas upgrading in Europe – raw gas capacities in
major European countries in Nm3/h)
International Workshop on Promotion of Biogas Upgrading and Bottling in India and EU August 22 - 24, 2013, IIT Delhi
(Source: IEA Bioenergy, 2011)
0
10000
20000
30000
40000
50000
60000
70000
80000
90000
Austria France Germany Iceland Netherlands Norway Sweden Switzerland Spain United Kingdom
Ra
w g
as
ca
pa
cit
y (
Nm
3/h
)
UNIVERSITY OF JYVÄSKYLÄ
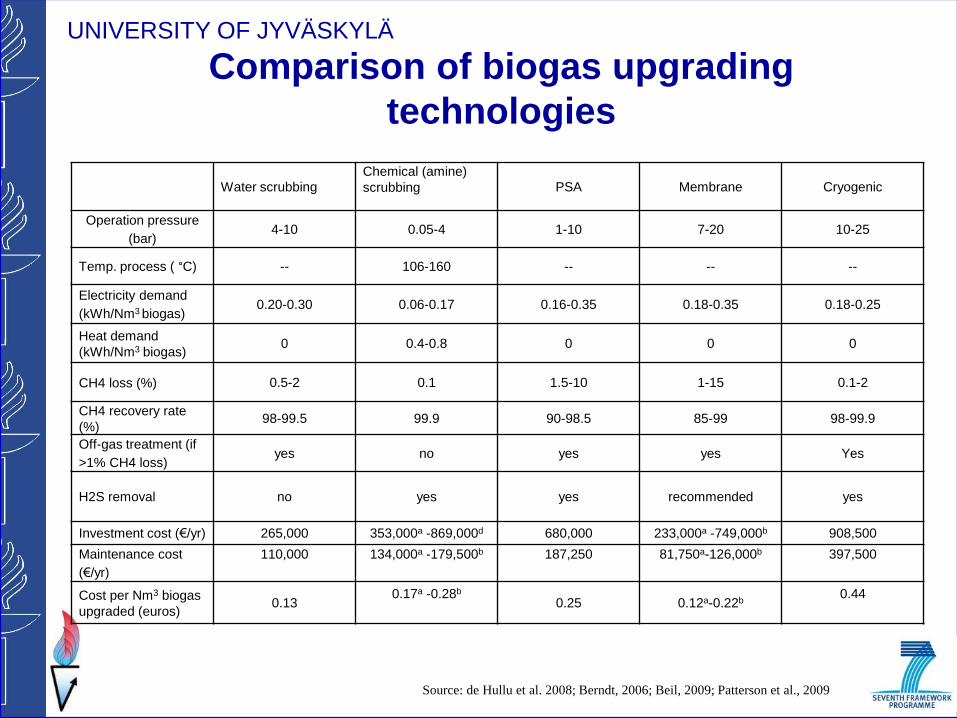
Comparison of biogas upgrading
technologies
Water scrubbing
Chemical (amine)
scrubbing
PSA Membrane Cryogenic
Operation pressure
(bar) 4-10 0.05-4 1-10 7-20 10-25
Temp. process ( °C) -- 106-160 -- -- --
Electricity demand
(kWh/Nm3 biogas) 0.20-0.30 0.06-0.17 0.16-0.35 0.18-0.35 0.18-0.25
Heat demand
(kWh/Nm3 biogas) 0 0.4-0.8 0 0 0
CH4 loss (%) 0.5-2 0.1 1.5-10 1-15 0.1-2
CH4 recovery rate
(%) 98-99.5 99.9 90-98.5 85-99 98-99.9
Off-gas treatment (if
>1% CH4 loss) yes no yes yes Yes
H2S removal no yes yes recommended yes
Investment cost (€/yr) 265,000 353,000a -869,000d 680,000 233,000a -749,000b 908,500
Maintenance cost
(€/yr)
110,000
134,000a -179,500b
187,250
81,750a-126,000b
397,500
Cost per Nm3 biogas
upgraded (euros) 0.13
0.17a -0.28b
0.25 0.12a-0.22b
0.44
Source: de Hullu et al. 2008; Berndt, 2006; Beil, 2009; Patterson et al., 2009
UNIVERSITY OF JYVÄSKYLÄ
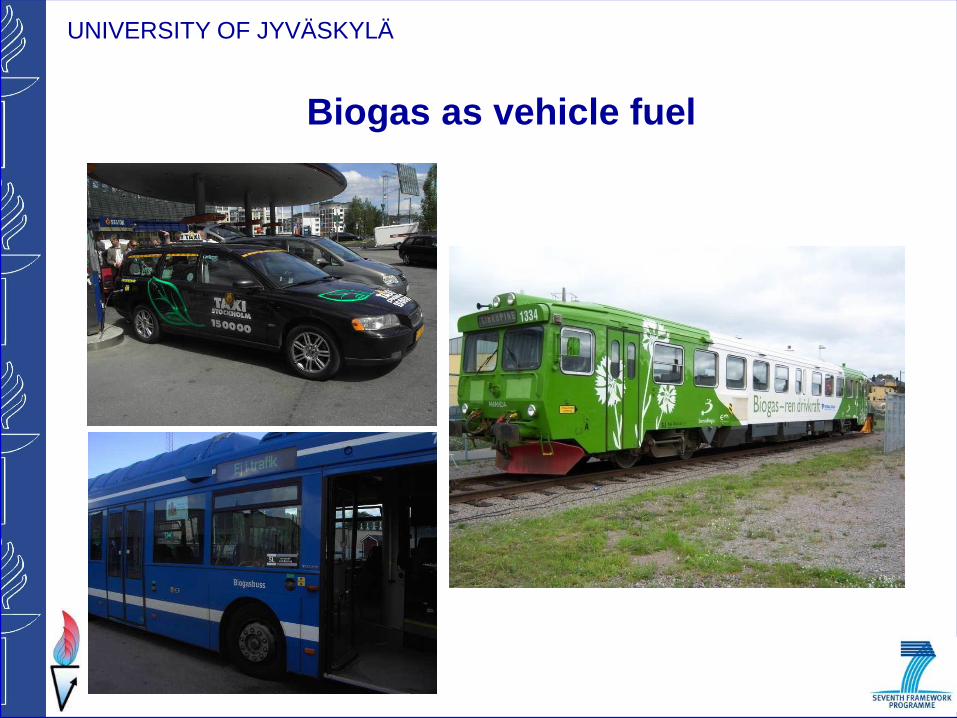
Biogas as vehicle fuel
Biomethane can be used in vehicles operated with natural gas
without any engine modification.
Bifuel vehicles use gas and gasoline
– Range with gas 200‐400 km
Dual fuel vehicles use methane and diesel
Biomethane is compressed to 200 bars for on-site storage or
transport by road.
It is also distributed through natural gas grid or separate on-site
fuelling stations

UNIVERSITY OF JYVÄSKYLÄ
Biomethane in road transport
Most common in Europe,
Sweden forerunner country
Small but growing market
– Estimate: 1.5-3 TWh
CNG sales 2012 (GWh)/share biomethane
UNIVERSITY OF JYVÄSKYLÄ
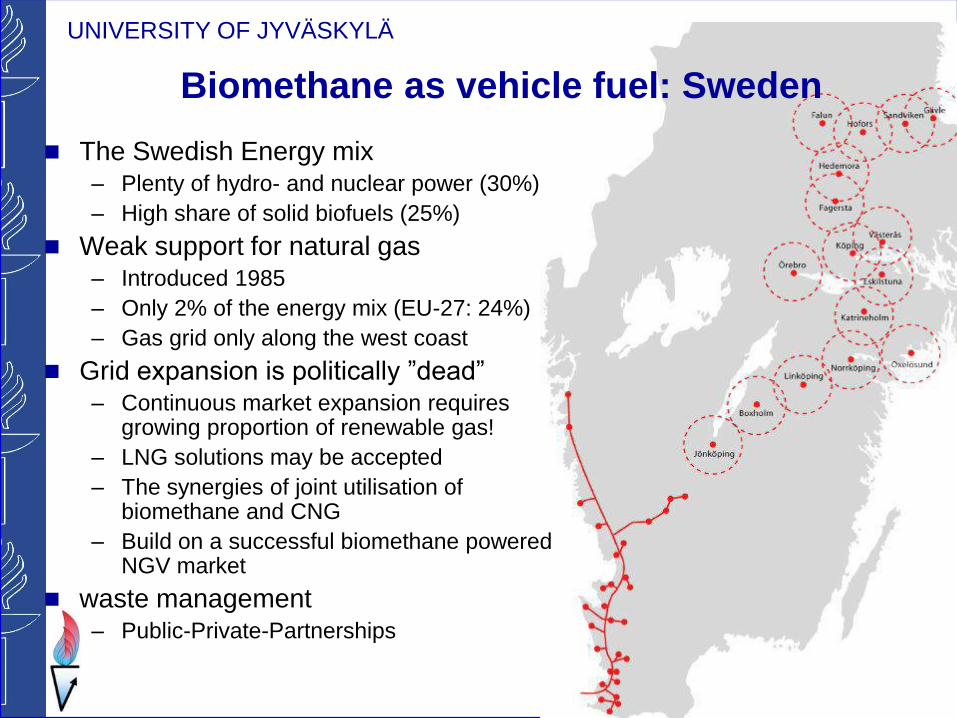
Biomethane as vehicle fuel: Sweden
The Swedish Energy mix – Plenty of hydro- and nuclear power (30%)
– High share of solid biofuels (25%)
Weak support for natural gas – Introduced 1985
– Only 2% of the energy mix (EU-27: 24%)
– Gas grid only along the west coast
Grid expansion is politically ”dead” – Continuous market expansion requires
growing proportion of renewable gas!
– LNG solutions may be accepted
– The synergies of joint utilisation of biomethane and CNG
– Build on a successful biomethane powered NGV market
waste management – Public-Private-Partnerships

UNIVERSITY OF JYVÄSKYLÄ
Biogas production in Sweden
Trend toward final utilization as automotive fuel
– 2007-2011: from 275 to 726 GWh
– Supplied by WWTP’s and centralized co-digestion plants
– 2.5TWh biogas prod. anticipated within 2014
In 2010: 47 upgrading facilities (8 with grid injection, 170GWh)
1.38 TWh in total (2010)
Source: Swedish Energy Agency, ES2011:07
[GWh]
UNIVERSITY OF JYVÄSKYLÄ
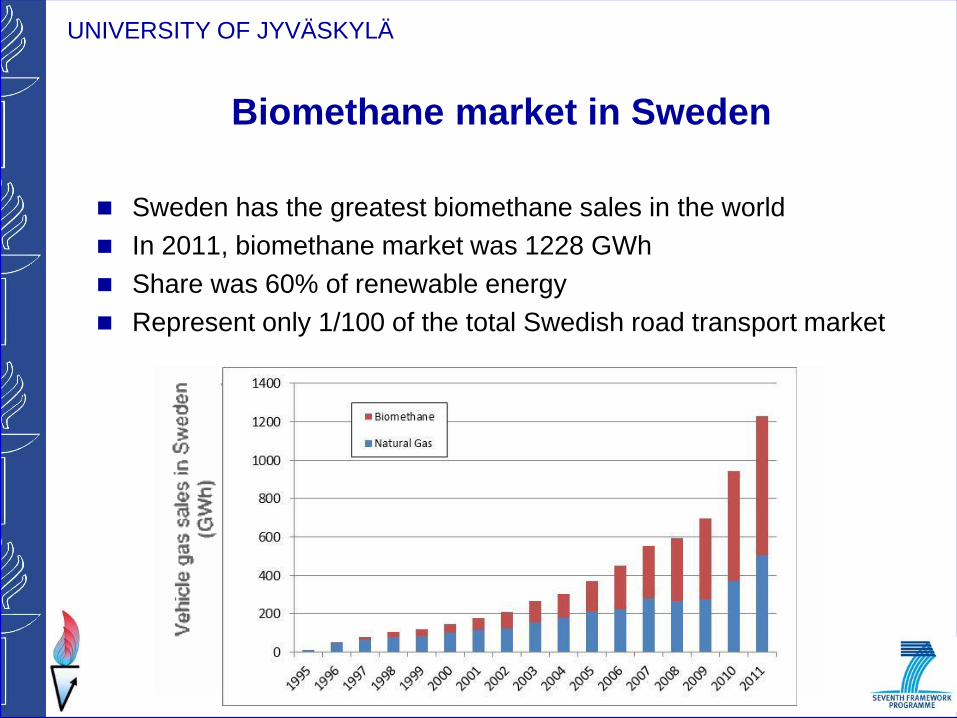
Biomethane market in Sweden
Sweden has the greatest biomethane sales in the world
In 2011, biomethane market was 1228 GWh
Share was 60% of renewable energy
Represent only 1/100 of the total Swedish road transport market
UNIVERSITY OF JYVÄSKYLÄ
Supportive policy measures in Sweden
Fuel tax exemptions
Fringe company car tax reductions
Parking benefits, congestion fee exemptions
Environmental demands regarding fuels and vehicles in regional
and local government procurements and contracts
Creation of clean(er) vehicle definition, preferably national
Investment grants, refueling stations and waste biomethane
production
Establish national and/or international standards regarding
storage, handling, transport and utilisation of biomethane
UNIVERSITY OF JYVÄSKYLÄ
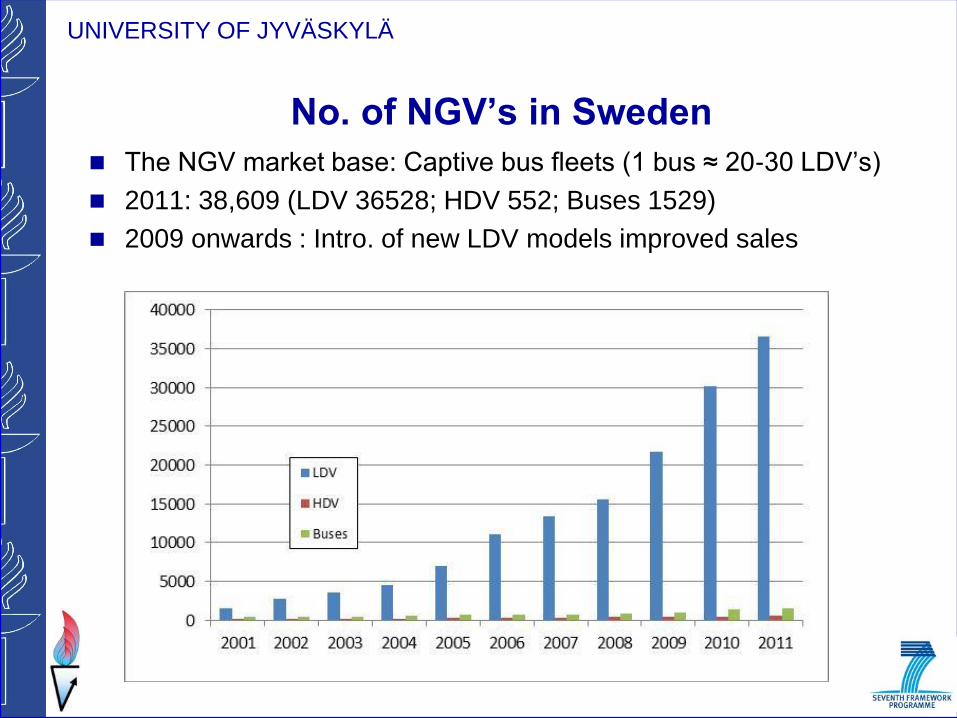
No. of NGV’s in Sweden
The NGV market base: Captive bus fleets (1 bus ≈ 20-30 LDV’s)
2011: 38,609 (LDV 36528; HDV 552; Buses 1529)
2009 onwards : Intro. of new LDV models improved sales
UNIVERSITY OF JYVÄSKYLÄ
NGV market dynamics of Sweden
Local pollution problems + no grid access = biomethane buses
Grid connected cities of Malmö and Gothenburg
Converting to NG buses to solve local pollution problems
– NG companies searching for a new market segment
Environmental state funding to municipals decisive (1998-2010)
– Non-grid cities upgraded to biomethane to fuel their buses –
grid cities followed
– Captive bus fleets shown* providing the essential niche of the
emerging NGV market in Sweden

UNIVERSITY OF JYVÄSKYLÄ
Biogas Highway Göteborg - Stockholm
500 km
12 biomethane fuelling stations
UNIVERSITY OF JYVÄSKYLÄ
Biogas as vehicle fuel
UNIVERSITY OF JYVÄSKYLÄ
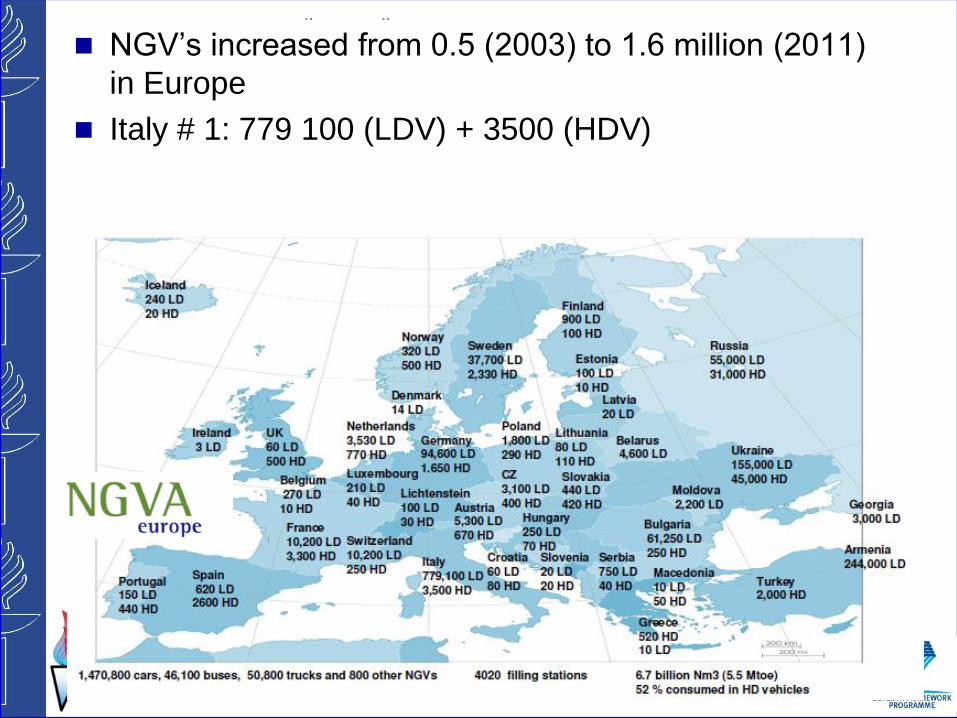
NGV’s increased from 0.5 (2003) to 1.6 million (2011)
in Europe
Italy # 1: 779 100 (LDV) + 3500 (HDV)
UNIVERSITY OF JYVÄSKYLÄ
Biogas injection to natural gas grid
Biogas can be distributed via natural gas grid
Grid connects the production site with more densely populated
areas
Some countries have standards for gas injection to grid
– CH4, CO2, sulphur compounds, moisture, Wobbe index,
siloxanes…
– Low‐ and High value gas
Biogas is cleaned & upgraded before injection
– Odorisation
– If necessary, heating value adjustment
– Commercially available technology
UNIVERSITY OF JYVÄSKYLÄ
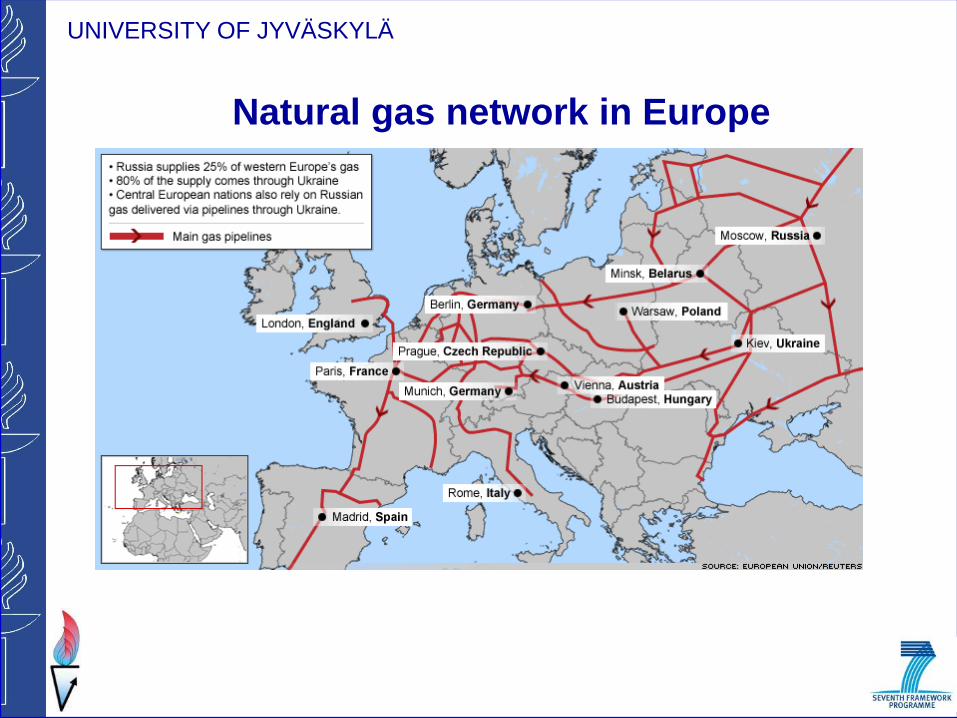
Natural gas network in Europe
UNIVERSITY OF JYVÄSKYLÄ
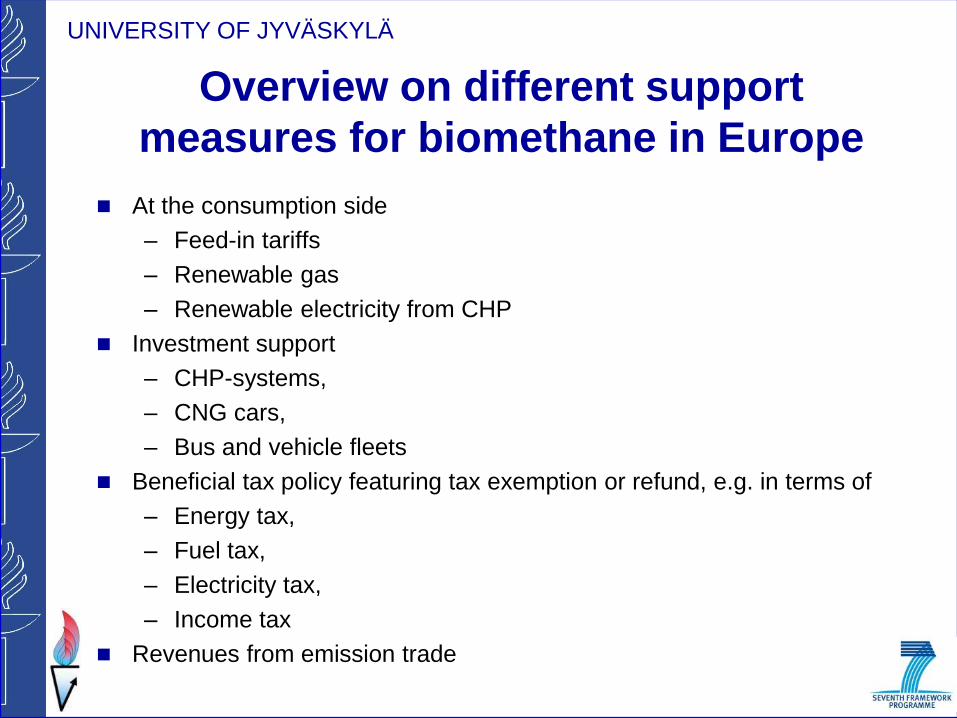
Overview on different support
measures for biomethane in Europe
At the consumption side
– Feed-in tariffs
– Renewable gas
– Renewable electricity from CHP
Investment support
– CHP-systems,
– CNG cars,
– Bus and vehicle fleets
Beneficial tax policy featuring tax exemption or refund, e.g. in terms of
– Energy tax,
– Fuel tax,
– Electricity tax,
– Income tax
Revenues from emission trade
UNIVERSITY OF JYVÄSKYLÄ
What are the bottle necks ?
Methane emission (slip)
Market volume
Trade
Regulation
UNIVERSITY OF JYVÄSKYLÄ
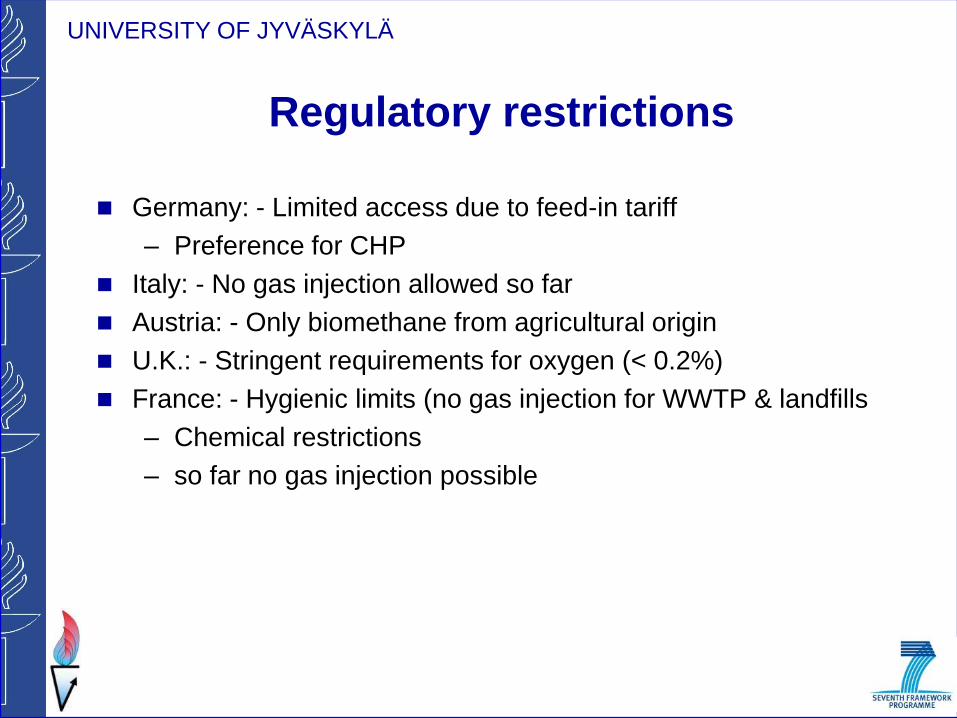
Regulatory restrictions
Germany: - Limited access due to feed-in tariff
– Preference for CHP
Italy: - No gas injection allowed so far
Austria: - Only biomethane from agricultural origin
U.K.: - Stringent requirements for oxygen (< 0.2%)
France: - Hygienic limits (no gas injection for WWTP & landfills
– Chemical restrictions
– so far no gas injection possible
UNIVERSITY OF JYVÄSKYLÄ
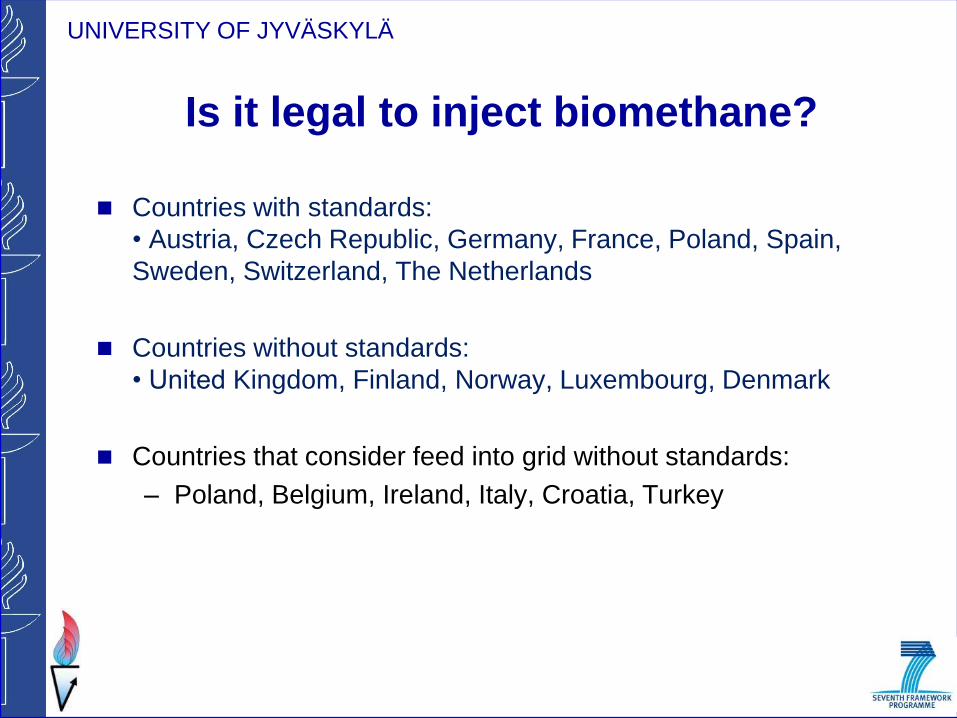
Is it legal to inject biomethane?
Countries with standards:
• Austria, Czech Republic, Germany, France, Poland, Spain,
Sweden, Switzerland, The Netherlands
Countries without standards:
• United Kingdom, Finland, Norway, Luxembourg, Denmark
Countries that consider feed into grid without standards:
– Poland, Belgium, Ireland, Italy, Croatia, Turkey
UNIVERSITY OF JYVÄSKYLÄ
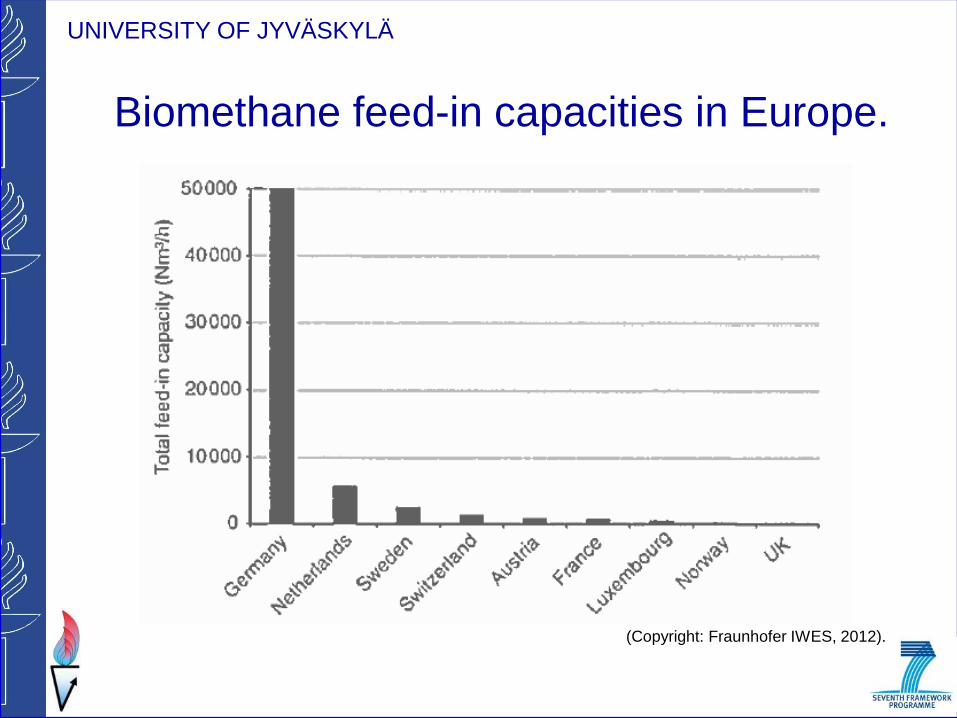
Biomethane feed-in capacities in Europe.
(Copyright: Fraunhofer IWES, 2012).

UNIVERSITY OF JYVÄSKYLÄ
Biomethane in Germany – facts and figures
90 plants for biogas upgrading
87 plants for biogas injection in 2012
Capacity of 55930 Nm³/h
39 plants under construction
63 plants in planning
Moderate increase
189 plants ->
10679 Nm3/h
Source: dena, 2012
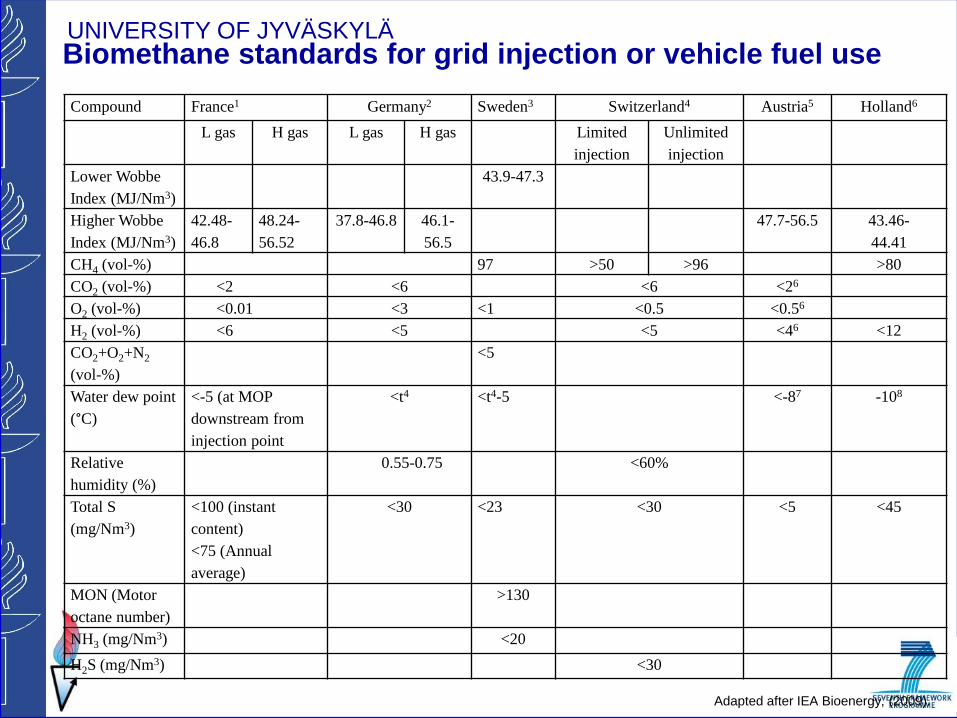
UNIVERSITY OF JYVÄSKYLÄ Biomethane standards for grid injection or vehicle fuel use
Compound France1 Germany2 Sweden3 Switzerland4 Austria5 Holland6
L gas H gas L gas H gas Limited
injection
Unlimited
injection
Lower Wobbe
Index (MJ/Nm3)
43.9-47.3
Higher Wobbe
Index (MJ/Nm3)
42.48-
46.8
48.24-
56.52
37.8-46.8 46.1-
56.5
47.7-56.5 43.46-
44.41
CH4 (vol-%) 97 >50 >96 >80
CO2 (vol-%) <2 <6 <6 <26
O2 (vol-%) <0.01 <3 <1 <0.5 <0.56
H2 (vol-%) <6 <5 <5 <46 <12
CO2+O2+N2
(vol-%)
<5
Water dew point
(°C)
<-5 (at MOP
downstream from
injection point
<t4 <t4-5 <-87 -108
Relative
humidity (%)
0.55-0.75 <60%
Total S
(mg/Nm3)
<100 (instant
content)
<75 (Annual
average)
<30 <23 <30 <5 <45
MON (Motor
octane number)
>130
NH3 (mg/Nm3) <20
H2S (mg/Nm3) <30
Adapted after IEA Bioenergy, (2009).
UNIVERSITY OF JYVÄSKYLÄ
Thank you for your attention
EU FP7 Valorgas project: Valorisation of Food Waste
to Biogas
UNIVERSITY OF JYVÄSKYLÄ
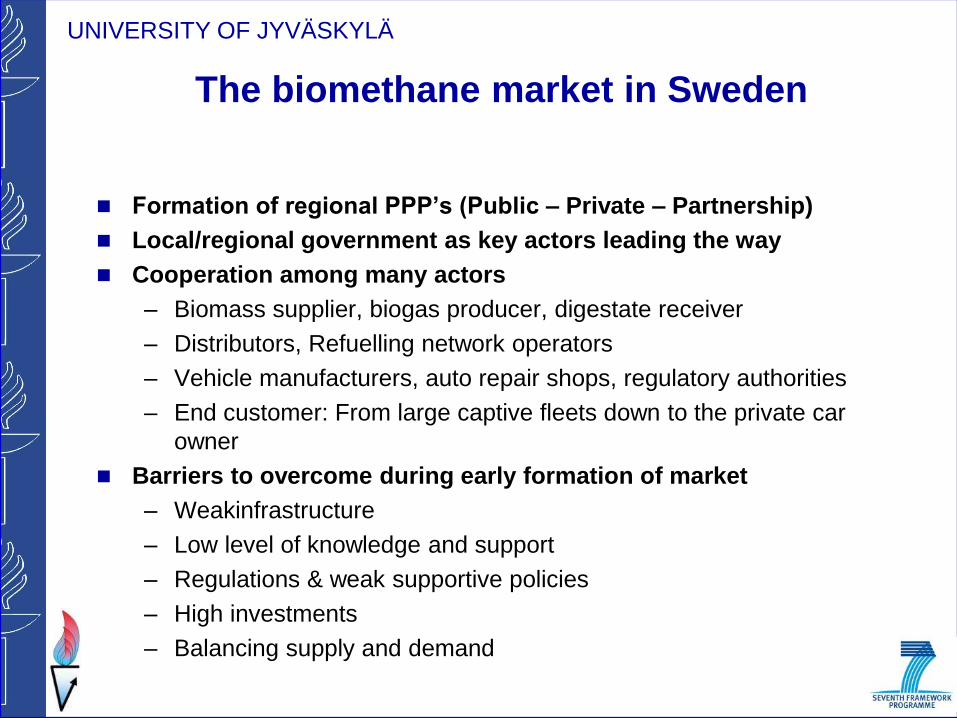
The biomethane market in Sweden
Formation of regional PPP’s (Public – Private – Partnership)
Local/regional government as key actors leading the way
Cooperation among many actors
– Biomass supplier, biogas producer, digestate receiver
– Distributors, Refuelling network operators
– Vehicle manufacturers, auto repair shops, regulatory authorities
– End customer: From large captive fleets down to the private car
owner
Barriers to overcome during early formation of market
– Weakinfrastructure
– Low level of knowledge and support
– Regulations & weak supportive policies
– High investments
– Balancing supply and demand

UNIVERSITY OF JYVÄSKYLÄ
The biomethane market in Sweden
Capital intensive business with small profit margins
– Need additional drivers and good framework conditions
Tax exemption + high fossil fuel taxes
– Upgraded biogas: buy at 0.5-0.8 €/m3, retail at 1.6 €/m3
– Long-term high-volume contracts securing the market
– Waste management + procurement of public transport
Escalating substrate costs in harmony with market growth?
– Learning curves + Increasing and volatile fossil fuel prices increase-
better profit margins
– Challenge: Starting with free or cheap waste, now followed by more
expensive substrates, e.g. energy crops
Extension of existing policies and no new ones to facilitate production
growth
UNIVERSITY OF JYVÄSKYLÄ
BIOMETHANE STANDARDS:
What is the status?
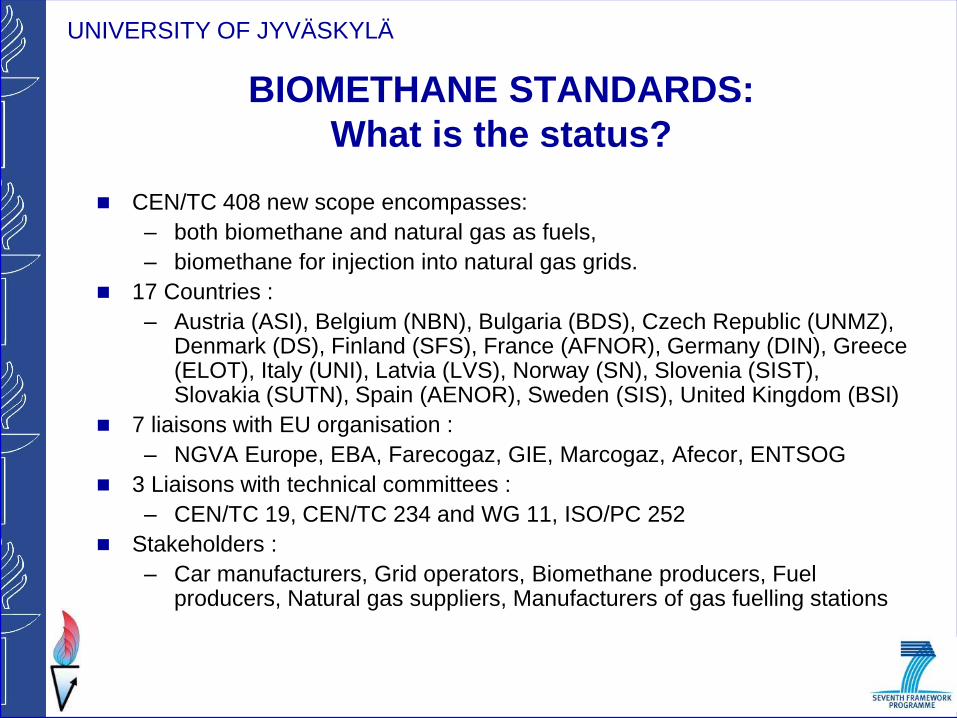
CEN/TC 408 new scope encompasses:
– both biomethane and natural gas as fuels,
– biomethane for injection into natural gas grids.
17 Countries :
– Austria (ASI), Belgium (NBN), Bulgaria (BDS), Czech Republic (UNMZ), Denmark (DS), Finland (SFS), France (AFNOR), Germany (DIN), Greece (ELOT), Italy (UNI), Latvia (LVS), Norway (SN), Slovenia (SIST), Slovakia (SUTN), Spain (AENOR), Sweden (SIS), United Kingdom (BSI)
7 liaisons with EU organisation :
– NGVA Europe, EBA, Farecogaz, GIE, Marcogaz, Afecor, ENTSOG
3 Liaisons with technical committees :
– CEN/TC 19, CEN/TC 234 and WG 11, ISO/PC 252
Stakeholders :
– Car manufacturers, Grid operators, Biomethane producers, Fuel producers, Natural gas suppliers, Manufacturers of gas fuelling stations
UNIVERSITY OF JYVÄSKYLÄ
Barriers for biomethane market
Lack of a common European biomethane specification for grid
injection and vehicle fuel use
Availability of proper incentive schemes, favouring grid injection
and/or vehicle use over biogas for electricity production
Availability of Natural Gas Vehicle (NGV) refuelling infrastructure
Availability of an EU-wide NGV market in terms of vehicle offer
Source: GreenGasGrids Project


![Olcott...Multiple Sclerosis Mumps Osteoporosis Pacemaker Yes Cl Yes [2 Yes Yes Yes [2 Yes Parkinson's Disease [2 Yes ... Yes [2 Yes D Yes Yes C] Yes Yes Rheumatoid Arthritis Yes HABITS](https://static.fdocuments.net/doc/165x107/5f437d8dde860906673fc43a/olcott-multiple-sclerosis-mumps-osteoporosis-pacemaker-yes-cl-yes-2-yes-yes.jpg)