Biofuel from Cellulosic Biomass - Kansas State Universitycse.ksu.edu/files/cse/Wang.pdf · Biofuel...
23
Donghai Wang, Ph.D. Associate Professor Biological and Agricultural Engineering Kansas State University Manhattan, KS 66506 Biofuel from Cellulosic Biomass Kansas State University Bioenergy Symposium April 27-28, 2011 Manhattan, KS
Transcript of Biofuel from Cellulosic Biomass - Kansas State Universitycse.ksu.edu/files/cse/Wang.pdf · Biofuel...
Donghai Wang, Ph.D.
Associate ProfessorBiological and Agricultural Engineering
Kansas State UniversityManhattan, KS 66506
Biofuel from Cellulosic Biomass
Kansas State University Bioenergy Symposium
April 27-28, 2011 Manhattan, KS
Contents
Current ethanol situation in the US
Challenges of cellulosic ethanol
Current research on cellulosic ethanol
Our ongoing research on cellulosic ethanol
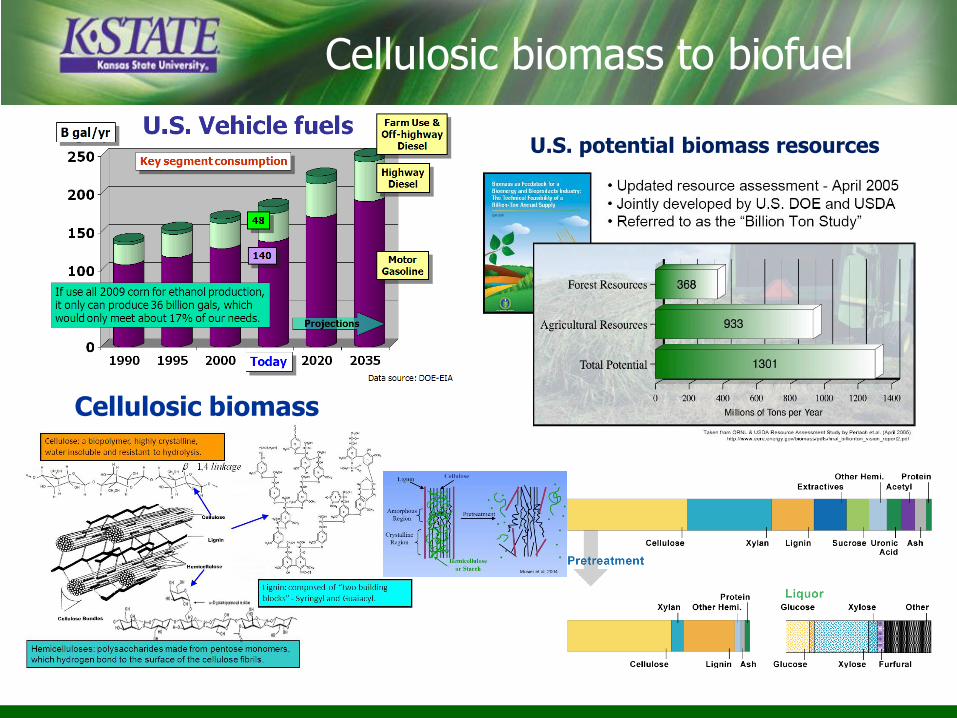
Cellulosic biomass to biofuel
Cellulosic biomass
U.S. potential biomass resources

Source: RFA
As 2/25/2010, US has 27 cellulosicethanol projects under developmentand construction (19 companies), butno cellulosic ethanol on market yet.
Current US ethanol production
0
2000
4000
6000
8000
10000
12000
14000
Millio
ns o
f G
allo
ns
'00 '01 '02 '03 '04 '05 '06 '07 '08 '09 '10
Production
Historic U.S. fuel Ethanol Production
Sorghum
~3.5%Corn
~96%
In 2010, US ethanol production reached 13.23 billions of gallons.
13.23 B Gal
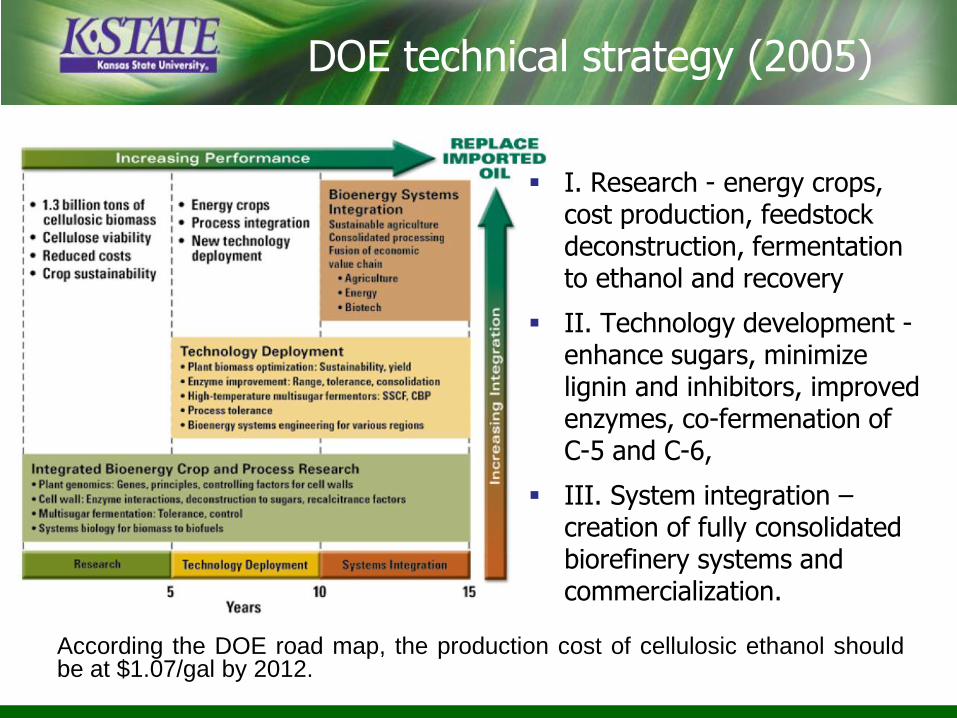
DOE technical strategy (2005)
I. Research - energy crops, cost production, feedstock deconstruction, fermentation to ethanol and recovery
II. Technology development -enhance sugars, minimize lignin and inhibitors, improved enzymes, co-fermenation of C-5 and C-6,
III. System integration –creation of fully consolidated biorefinery systems and commercialization.
According the DOE road map, the production cost of cellulosic ethanol shouldbe at $1.07/gal by 2012.
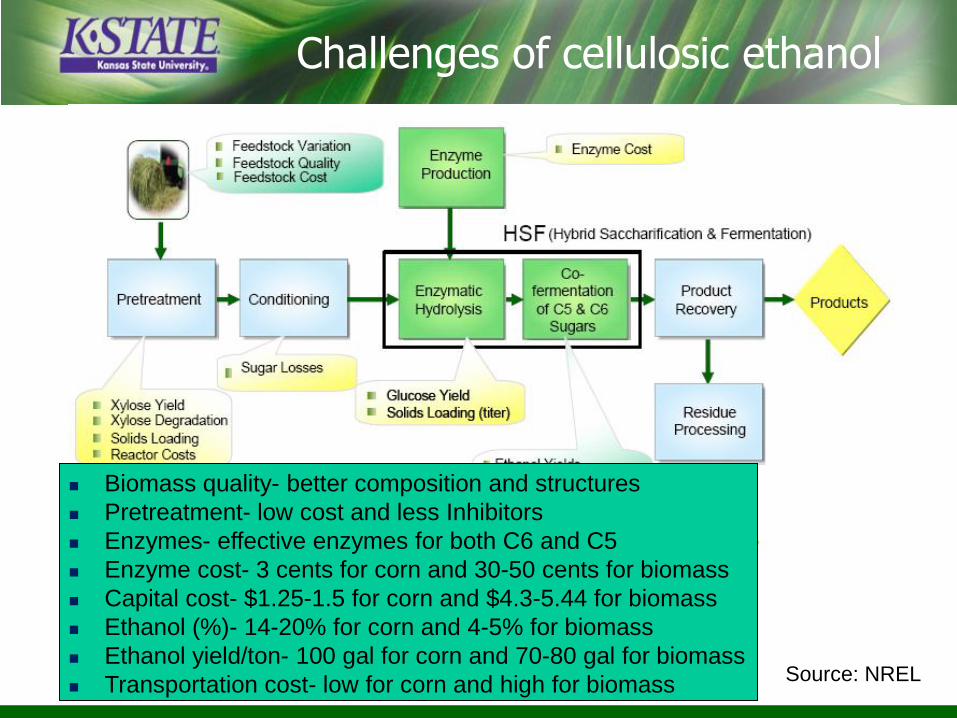
Source: NREL
Challenges of cellulosic ethanol
Biomass quality- better composition and structures
Pretreatment- low cost and less Inhibitors
Enzymes- effective enzymes for both C6 and C5
Enzyme cost- 3 cents for corn and 30-50 cents for biomass
Capital cost- $1.25-1.5 for corn and $4.3-5.44 for biomass
Ethanol (%)- 14-20% for corn and 4-5% for biomass
Ethanol yield/ton- 100 gal for corn and 70-80 gal for biomass
Transportation cost- low for corn and high for biomass
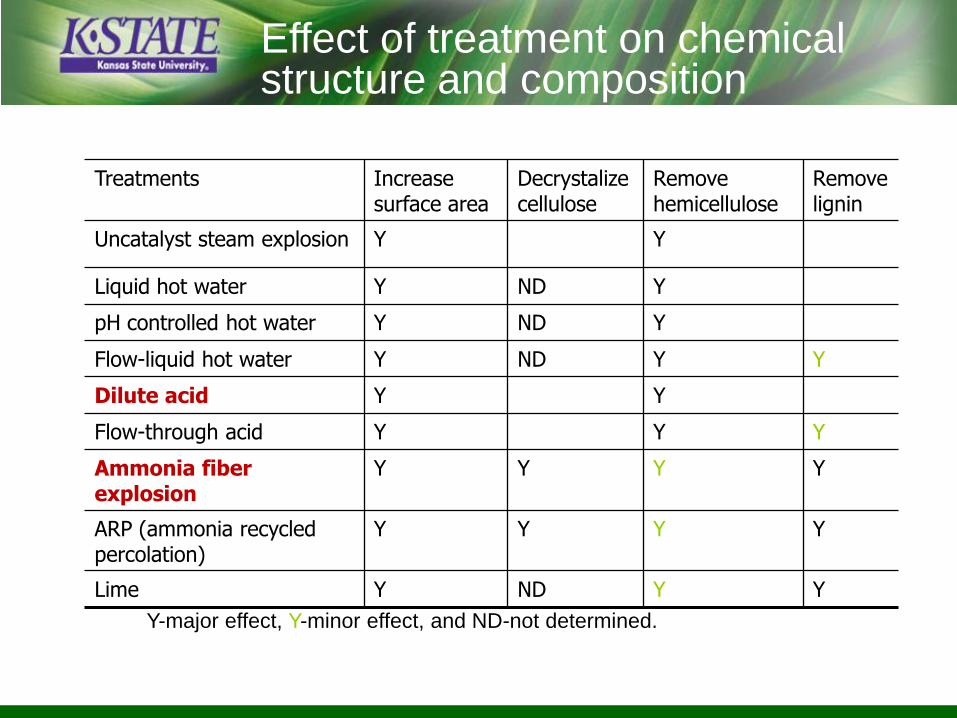
Effect of treatment on chemical structure and composition
Treatments Increase surface area
Decrystalize cellulose
Remove hemicellulose
Remove lignin
Uncatalyst steam explosion Y Y
Liquid hot water Y ND Y
pH controlled hot water Y ND Y
Flow-liquid hot water Y ND Y Y
Dilute acid Y Y
Flow-through acid Y Y Y
Ammonia fiber explosion
Y Y Y Y
ARP (ammonia recycled percolation)
Y Y Y Y
Lime Y ND Y Y
Y-major effect, Y-minor effect, and ND-not determined.
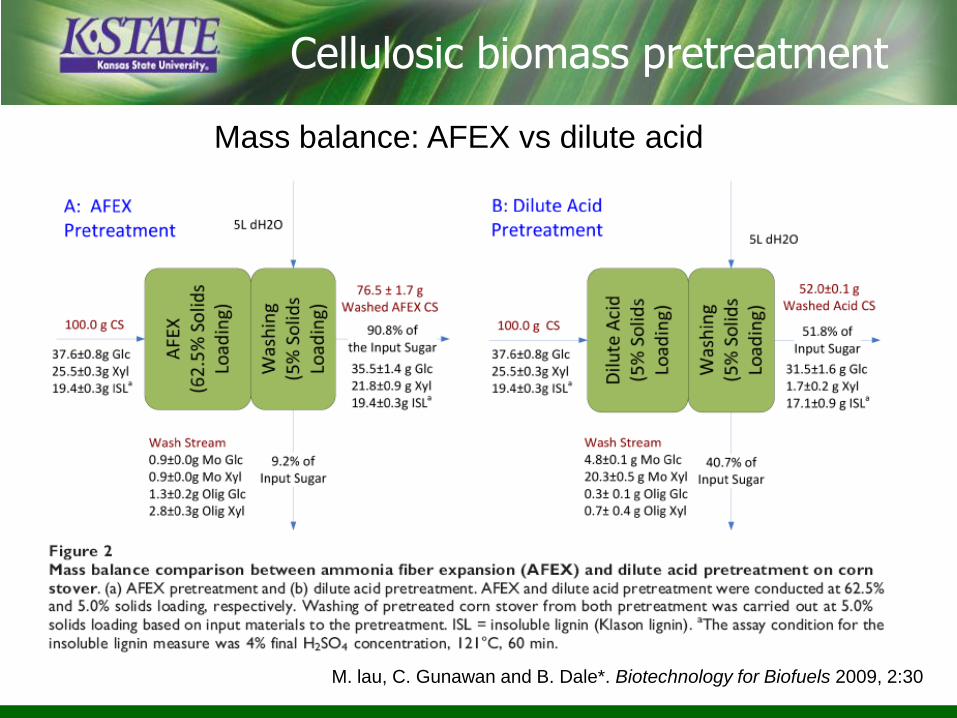
Cellulosic biomass pretreatment
Mass balance: AFEX vs dilute acid
M. lau, C. Gunawan and B. Dale*. Biotechnology for Biofuels 2009, 2:30

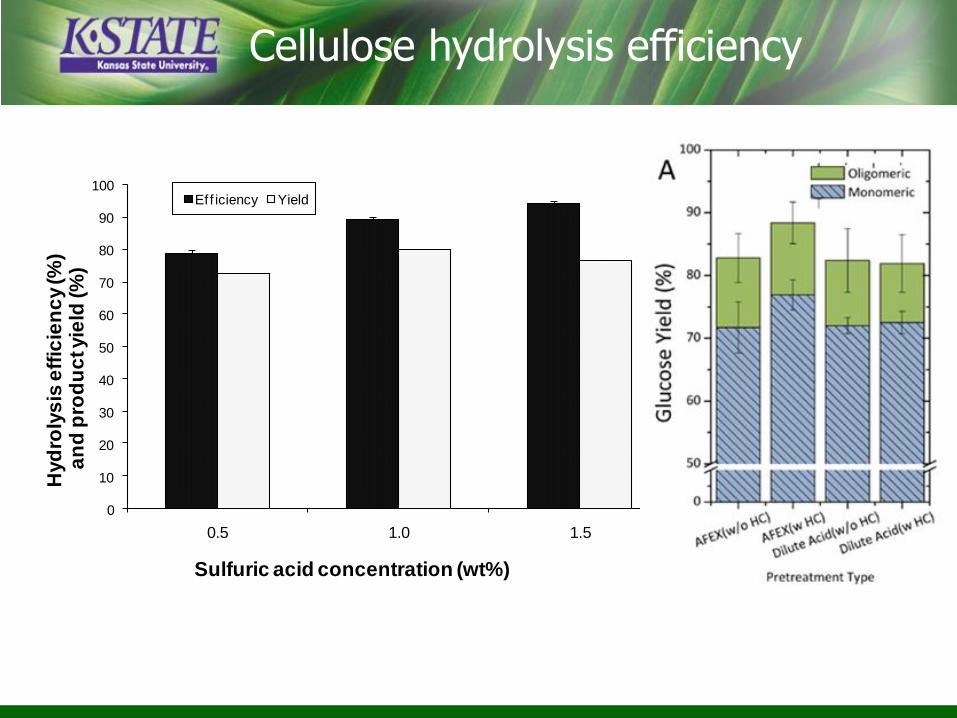
Biomass hydrolysis and sugar yield
Sugar yield: AFEX vs dilute acid
M. lau, C. Gunawan and B. Dale*. Biotechnology for Biofuels 2009, 2:30

Cellulosic biomass pretreatment
Residual solids energy content: AFEX vs dilute acid
M. lau, C. Gunawan and B. Dale*. Biotechnology for Biofuels 2009, 2:30
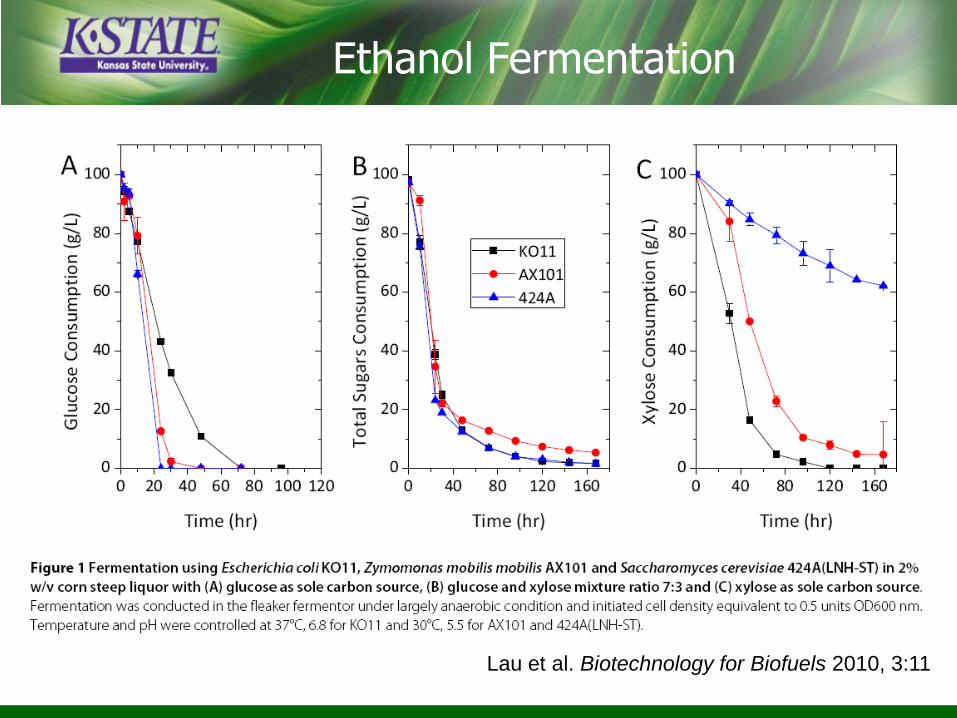
Ethanol Fermentation
Lau et al. Biotechnology for Biofuels 2010, 3:11

Enzymes for ethanol Fermentation
Novozymes said its new Cellic® CTec2 enzymes enable the biofuel industry to produce cellulosic ethanol at a price below US $2.00 per gallon.
Genencor said its Accellerase® DUET product line will achieve higher sugar and biofuel yields, often at 3-fold lower dosing, and it is feedstock- and pretreatment-flexible.
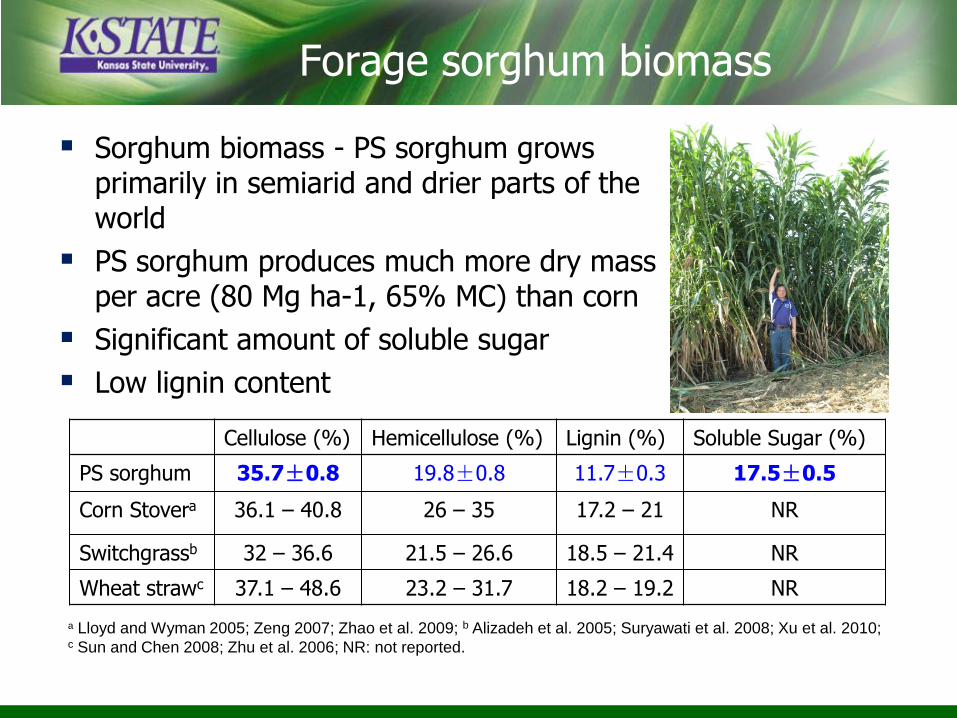
Cellulose (%) Hemicellulose (%) Lignin (%) Soluble Sugar (%)
PS sorghum 35.7±0.8 19.8±0.8 11.7±0.3 17.5±0.5
Corn Stovera 36.1 – 40.8 26 – 35 17.2 – 21 NR
Switchgrassb 32 – 36.6 21.5 – 26.6 18.5 – 21.4 NR
Wheat strawc 37.1 – 48.6 23.2 – 31.7 18.2 – 19.2 NR
a Lloyd and Wyman 2005; Zeng 2007; Zhao et al. 2009; b Alizadeh et al. 2005; Suryawati et al. 2008; Xu et al. 2010; c Sun and Chen 2008; Zhu et al. 2006; NR: not reported.
Forage sorghum biomass
Sorghum biomass - PS sorghum grows primarily in semiarid and drier parts of the world
PS sorghum produces much more dry mass per acre (80 Mg ha-1, 65% MC) than corn
Significant amount of soluble sugar
Low lignin content
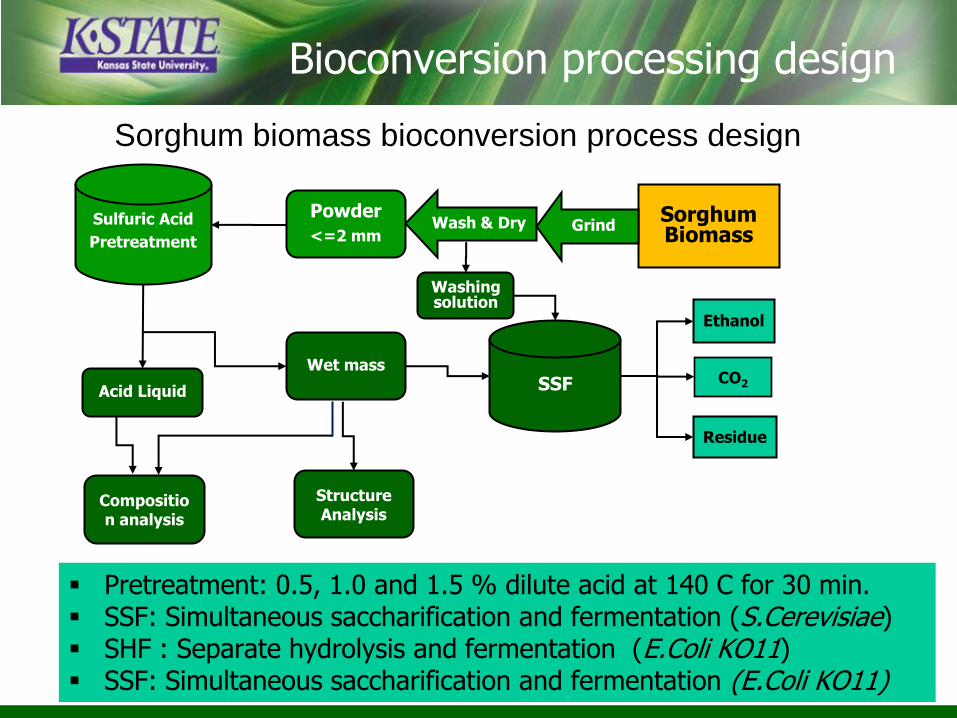
Bioconversion processing design
Acid Liquid
Wet mass
Washing solution
SSF
Ethanol
CO2
Residue
Sulfuric Acid
Pretreatment
Sorghum Biomass
Wash & DryPowder
<=2 mmGrind
Composition analysis
Structure Analysis
Sorghum biomass bioconversion process design
Pretreatment: 0.5, 1.0 and 1.5 % dilute acid at 140 C for 30 min. SSF: Simultaneous saccharification and fermentation (S.Cerevisiae) SHF : Separate hydrolysis and fermentation (E.Coli KO11) SSF: Simultaneous saccharification and fermentation (E.Coli KO11)
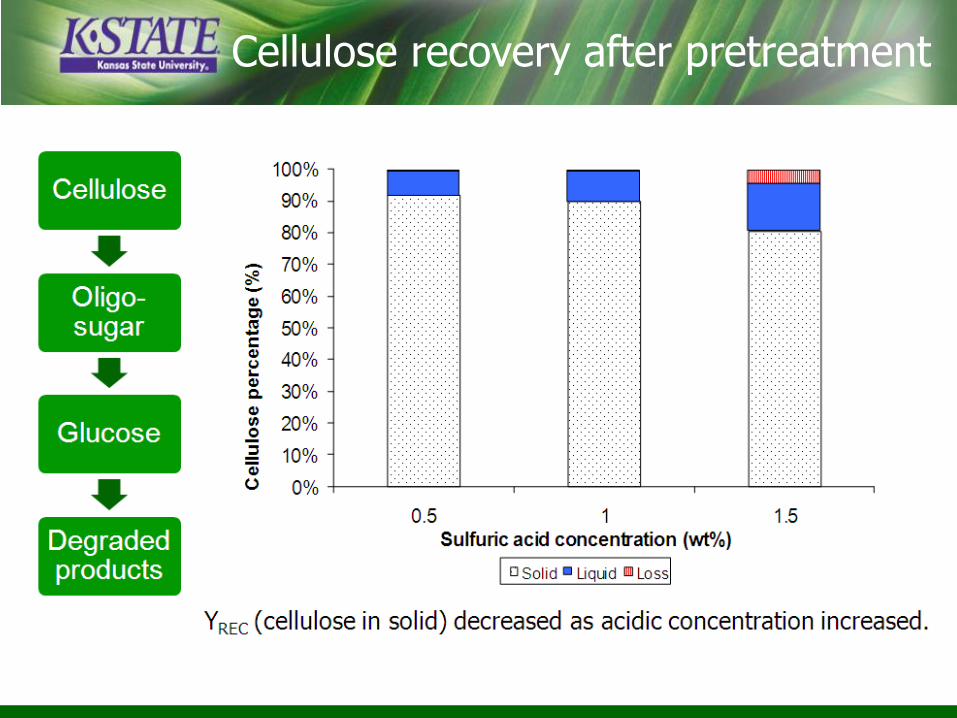
Cellulose recovery after pretreatment
0
10
20
30
40
50
60
70
80
90
100
0.5 1.0 1.5
Hyd
roly
sis
eff
icie
nc
y (%
)a
nd
pro
du
ct yie
ld (%
)
Sulfuric acid concentration (wt%)
Eff iciency Yield
Cellulose hydrolysis efficiency
A
0
100
200
300
400
500
600
700
800
900
1000
0 20 40 60 80 100
Time (h)
Eth
an
ol
Yie
ld (
mg
)
38C 0.2 38C 0.1 38C 0.05
B
0
100
200
300
400
500
600
700
800
900
1000
0 20 40 60 80 100
Time (h)E
than
ol
Yie
ld (
mg
)
50-30C 0.2 50-30C 0.1 50-30C 0.05
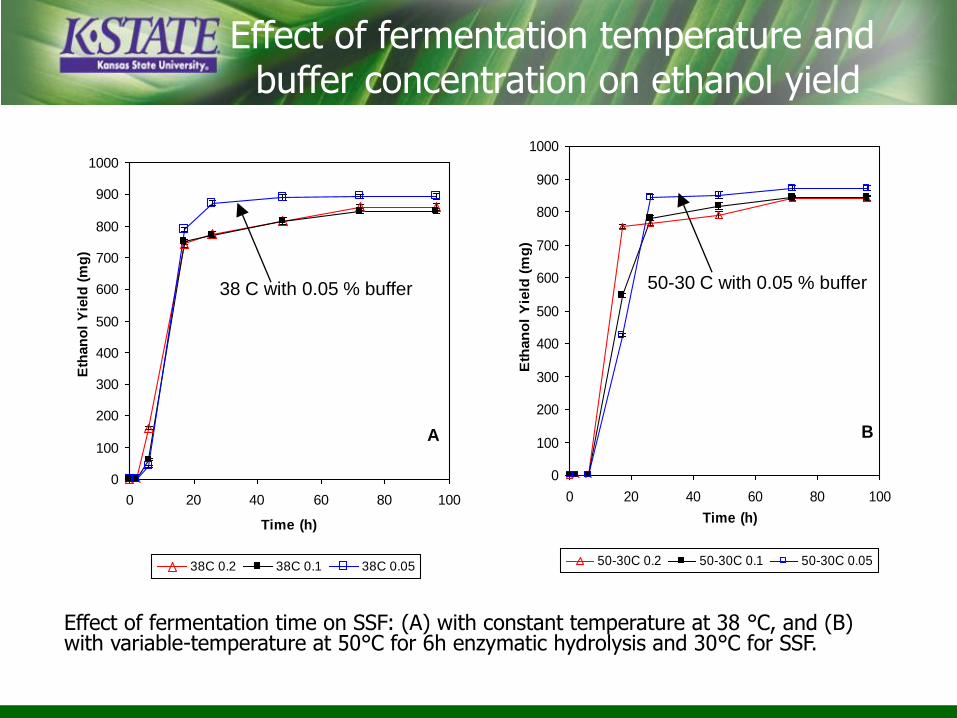
Effect of fermentation time on SSF: (A) with constant temperature at 38 °C, and (B) with variable-temperature at 50°C for 6h enzymatic hydrolysis and 30°C for SSF.
Effect of fermentation temperature and buffer concentration on ethanol yield
38 C with 0.05 % buffer 50-30 C with 0.05 % buffer
500
550
600
650
700
750
800
850
900
950
1000
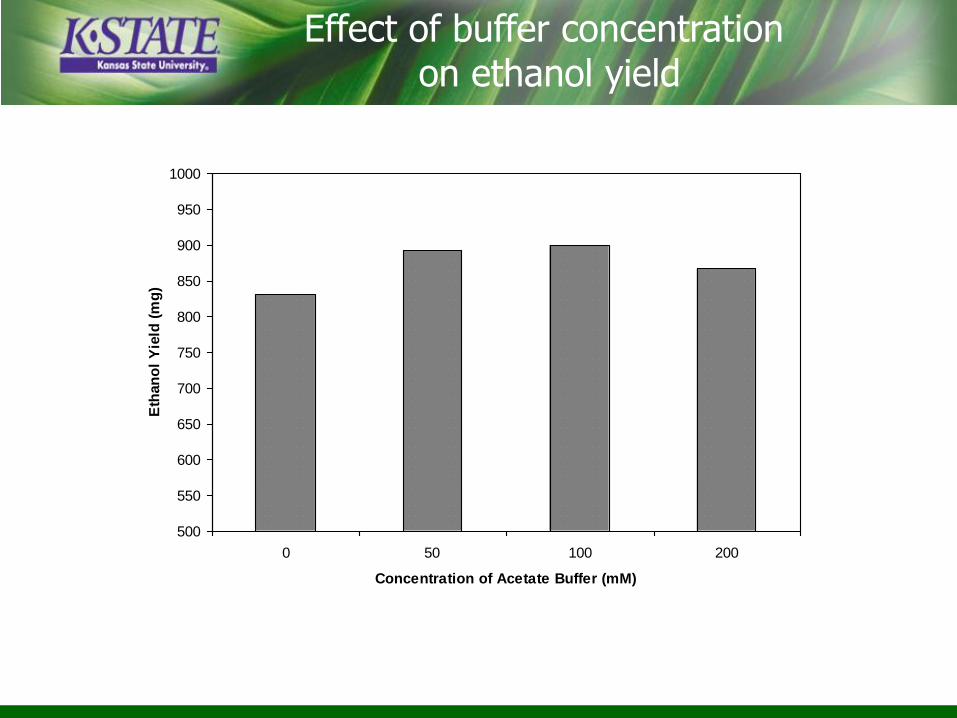
0 50 100 200
Concentration of Acetate Buffer (mM)
Eth
an
ol
Yie
ld (
mg
)
Effect of buffer concentrationon ethanol yield
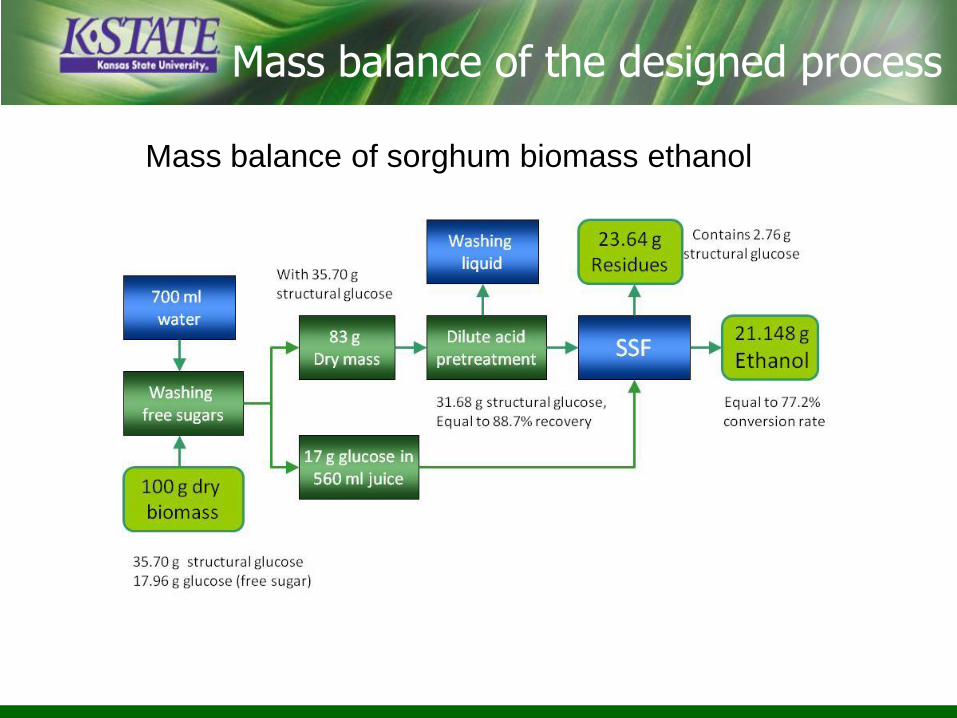
Mass balance of the designed process
Mass balance of sorghum biomass ethanol
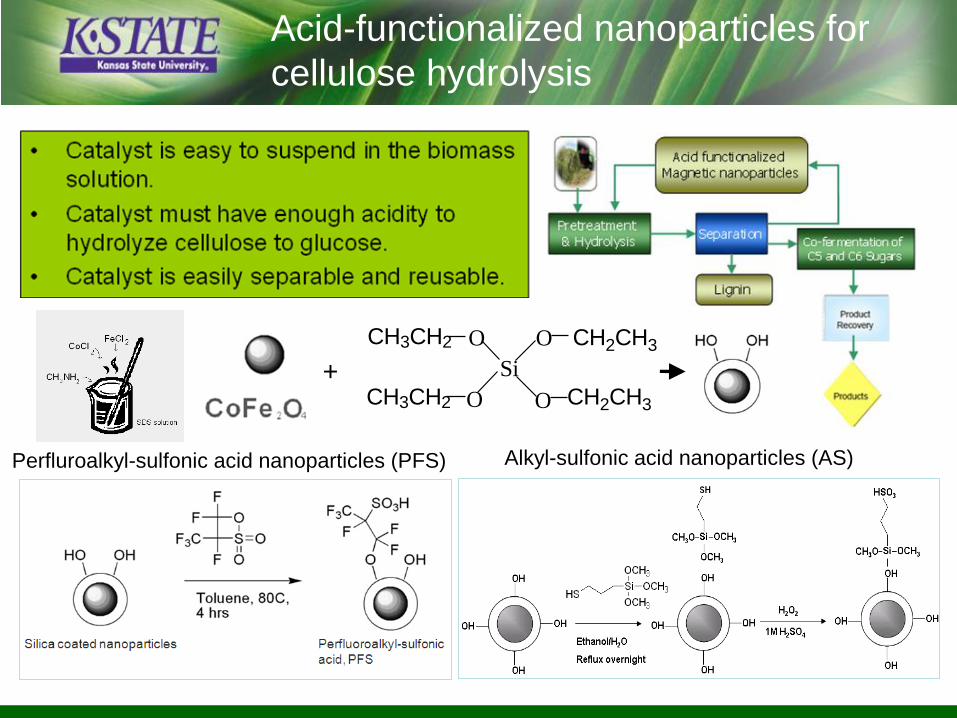
Alkyl-sulfonic acid nanoparticles (AS)Perfluroalkyl-sulfonic acid nanoparticles (PFS)
Si
O O
O O
CH2CH3 CH3CH2
CH3CH2 CH2CH3
+
Acid-functionalized nanoparticles for
cellulose hydrolysis

Performance and reusability of acid-functionalized nanoparticles on cellobiose hydrolysis.
L. Pana et al. 2011
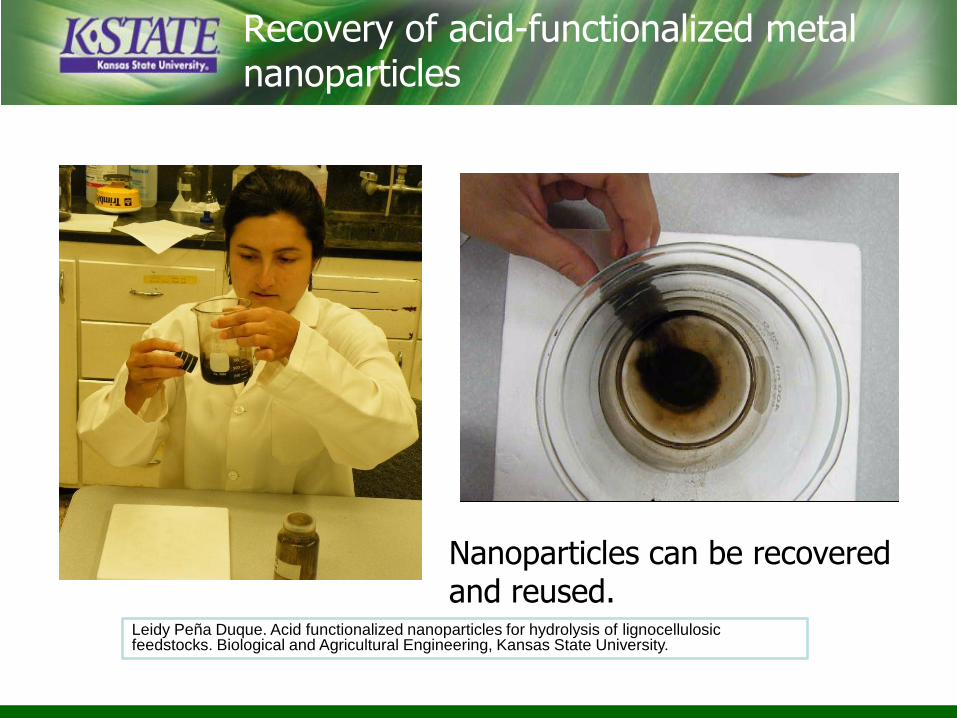
Recovery of acid-functionalized metal nanoparticles
Nanoparticles can be recovered and reused.
Leidy Peña Duque. Acid functionalized nanoparticles for hydrolysis of lignocellulosicfeedstocks. Biological and Agricultural Engineering, Kansas State University.
Acknowledgement
Wang’s research group
Research collaborators: Drs. S. Staggenborg, K. Hohn, R. Madl, Y. Shi, P. Vadlani, R. Nelson, B. Rooney,
Center for Sustainable Energy, KSU
Companies: Novozymes, Inc., Genencor (A DaniscoDivision),