Bioenergy: Land-use and mitigating iLUC · Session 1: Policy background ILUC: STATUS OF EU...
34
E xten siv e la n d u se in M oz a m b iq u e IEA Bioenergy: ExCo: 2015:03 This publication provides the summary and conclusions from the workshop ‘Bioenergy: Land-use and mitigating iLUC’ held in conjunction with the meeting of the Executive Committee of IEA Bioenergy in Brussels, Belgium on 23 October 2014. Bioenergy: Land-use and mitigating iLUC Summary and Conclusions from the IEA Bioenergy ExCo74 Workshop
Transcript of Bioenergy: Land-use and mitigating iLUC · Session 1: Policy background ILUC: STATUS OF EU...
Extensive land use in Mozambique
IEA Bioenergy: ExCo: 2015:03
This publication provides the summary and conclusions from the workshop ‘Bioenergy: Land-use and mitigating iLUC’ held in conjunction with the meeting of the Executive Committee of IEA Bioenergy in Brussels, Belgium on 23 October 2014.
Bioenergy: Land-use and mitigating iLUCSummary and Conclusions from the IEA Bioenergy ExCo74 Workshop

Bioenergy: Land-use and mitigating iLUC1
Summary and Conclusions from the IEA Bioenergy ExCo74 Workshop
Copyright © 2015 IEA Bioenergy. All rights Reserved
Published by IEA Bioenergy
Cover photo: Courtesy of Floor vd Hilst, reference – F. van der Hilst, J.A. Verstegen, D. Karssenberg, A.P.C. Faaij, Spatio-temporal land use modelling for the assessment of land availability for energy crops – illustrated for Mozambique, Global Change Biology – Bioenergy, Volume 4, Issue 6, November 2012, Pages 859-874
IEA Bioenergy, also known as the Implementing Agreement for a Programme of Research, Development and Demonstration on Bioenergy, functions within a Framework created by the International Energy Agency (IEA). Views, findings and publications of IEA Bioenergy do not necessarily represent the views or policies of the IEA Secretariat or of its individual Member countries.
1 Indirect land use change.

EXECUTIVE SUMMARY
Arthur Wellinger, Technical Coordinator, IEA Bioenergy
IEA Bioenergy held its biannual workshop
in Brussels on the 23rd October 2014 in
conjunction with the Executive Committee
meeting (ExCo74). The workshop on ‘Bioenergy: land use and mitigating iLUC’ was prepared
in close collaboration with DG ENER of
the European Commission. More than 100
participants, which included representatives from
various European government ministries and
NGO’s, attended presentations by leading experts
on this important topic. Eleven speakers and a
discussion panel from nine different countries,
including Europe, North America and South
America, made high quality contributions which
fully engaged the audience.
The workshop was opened by Marie Donnelly,
Director of New and Renewable Sources of
Energy, Energy Efficiency and Innovation at the
European Commission. She set a high target for
the workshop to deliver as an outcome: Provide a
clear and scientifically robust message on iLUC
mitigation in an easily accessible format that can
be used to inform politicians. All of the scientific
speakers accepted Marie’s challenge and
formulated the most important messages of their
work in a few bullet points. It was interesting to
note that most of the findings were consistent
even though speakers came from different
parts of the world where they were applying
different approaches and models. The following
is a compilation of the major conclusions drawn
from the presentations:
• Food-versus-fuel reports that initiated the
work on sustainability and iLUC in particular,
which were not scientifically robust, should no
longer be part of the general discourse.
• Even though research has come a long way,
the current iLUC models still cover only
part of the full picture: they do not include
uncertainty (where weak assumptions are
treated as though they are facts in a model)
nor do they take into account improvement
through evolving agricultural practice.
• Agricultural land for food and crop
production has also to be taken into account.
Creation of iLUC is independent of the use
of the product of the land. If iLUC is to be
mitigated, all agricultural production has to
be included and it is important to remember
that biofuel production accounts for only
a small percentage of this.
• A holistic approach, which covers the whole
biomass chain, including food wastage
(according to FAO still one third of all food
is wasted) and the ongoing global change
in diet (less meat consumption means less
iLUC), is mandatory.
• If the current trend of growth intensification
in the industrialized world through improved
crop yield and double cropping can be
extended to developing countries, there is
considerable scope for iLUC free bioenergy
or other biomass production.
• The most important factors in mitigating
iLUC are
– Increasing value chain efficiency
– Bringing under-utilized land into production
The central conclusion of the workshop was
that iLUC could be prevented when food, feed
and fibre production were married to good
agricultural practice, in parallel with the
deployment of bioenergy.
The PowerPoint presentations can be downloaded
from IEA Bioenergy’s website.2
2 http://www.ieabioenergy.com/publications/ws19-bioenergy-land-use-mitigating-iluc/
1

WELCOME SPEECHES
Kees Kwant
NL Enterprise Agency, Ministry of Economic Affairs, the Netherlands
Chair, IEA Bioenergy
Kees Kwant, the newly elected chair, welcomed
all participants and expressed IEA Bioenergy’s
gratitude to the European Commission for its
help in organising the workshop. It was a special
honour, he said, to welcome Marie Donnelly,
Director of New and Renewable Sources of
Energy, Energy Efficiency and Innovation at
the European Commission. He highlighted the
role of IEA Bioenergy, with its 23 contracting
parties, including the Commission. He presented
IEA Bioenergy’s vision of achieving a substantial
bioenergy contribution to future global energy
demands through accelerating the production and
use of environmentally sound, socially accepted
and cost-competitive bioenergy on a sustainable
basis.
Mr Kwant said that IEA Bioenergy provided
an international forum for sharing information
and developing best practice on technology
development, non-technical barriers, and
regulatory and legislative issues, and produced
authoritative information on key strategic issues
affecting deployment. It dealt with the whole
chain of sustainable bioenergy in the Tasks’ work
and especially in dedicated workshops like the
one on iLUC mitigation.
Marie Donnelly
Director of New and Renewable Sources of Energy, Energy Efficiency and Innovation at the European Commission
Marie Donnelly first pointed out that all
European government heads would be meeting
only 200m away from the workshop location to
decide on Europe’s energy and climate package
beyond 2020. The discussion on land use change
(LUC) and iLUC was a highly debated part of
this, she said.
The challenge of land use change was to convince
people that there was actually a problem, even
though it was invisible. There would always
be reasons for not seeing it. The Commission
acknowledged the problem but struggled to find a
solution because every study came to a different
conclusion. There were, in particular, confusions
within political minds: Is food for fuel and iLUC
the same or are these two different things? Do
we solve the iLUC problem when prohibiting or
limiting the use of food for fuel?
The workshop, however, could be a ‘mindsetter’,
and thus clear the way for better understanding.
The sub-target of 10% for transport in the
Renewable Energy Directive (RED), with its
2020 target, had not really been carefully
thought through, in terms of what that target
would really mean at the end of the day. The
10% would have to come mostly from biofuel,
but most politicians thought it would come from
electricity. The truth was that, even after 2020,
electricity would not fulfil the needs of aviation
fuel nor heavy-duty vehicles. The Commission’s
real problem was that it couldn’t make this
understandable to the politicians.
The problem of the scientists, on the other hand,
was their divergence in views, and in the long
and complicated explanations they provided
to politicians. The possible solutions needed to
be described ‘in a nutshell’. Her wish for the
workshop was: Draft a simple message that
can be used by the Commission for formulating
policies.
2

Session 1: Policy background
ILUC: STATUS OF EU LEGISLATION
Paula Marques
DG ENERGY, Head of Unit C1, Renewables & CCS Policy
The Renewable Energy Directive (RED)
(2009/28/EC)3 has set 20% targets (20%
renewable energies, 20% CO2 reduction, 20%
reduction in energy consumption) by 2020,
amended by the 10% target of renewable energy
in transport. The RED is accompanied by the
Fuel Quality Directive (FQD 2009/30/EC)4,
seeking a 6% greenhouse-gas (GHG) reduction
target in carbon intensity of road transport fuels
by 2020.
The large part of the 10% RE in transport is
to be covered by biofuels. However, they have
to be sustainable. Biofuels need to save at least
35% GHG emission compared to fossil fuels,
increasing to 50% in 2017. The RED defines
what sustainability means. The iLUC discussion
gave room for a four-year-long discussion
between Commission, Parliament, Council
and Presidency.
The Commission carried out two public
consultation exercises dealing with iLUC in 2009
and 2010. It commissioned an International
Food Policy Research Institute (IFPRI) study.
In 2010, the Joint Research Centre (JRC)
organised a workshop on ‘The effects of
increased demand for biofuel feedstock on world
agricultural markets and areas’, and initiated an
expert consultation on behalf of the Commission.
3 RED (2009/28/EC) http://eur-lex.europa.eu/legal-content/EN/TXT/PDF/?uri=CELEX:32009L0028&from=EN
4 FQD (2009/30/EC) http://eur-lex.europa.eu/legal-content/EN/TXT/PDF/?uri=CELEX:32009L0030&from=EN
The IFPRI report was considered as the key
study. Since iLUC can neither be observed nor
measured, it is necessary to use modelling that
has inherent uncertainties. IFPRI, JRC IPTS
(Institute for Prospective Technological Studies)
and JRC IE (Institute for Energy and Transport)
published results based on models for the GHG
emissions of biofuels.
The IFPRI study5 came up with the following
technical findings:
• The total land converted globally for the
increased EU biofuels consumption in 2020
is estimated at 1.7MHa, leading to the
release of 500Mt CO2.
• On average, these emissions would negate
around 70% of the direct savings offered by
biofuels, leaving the average biofuel mix at
22% savings (biofuels on average still save
emissions compared to fossil fuels).
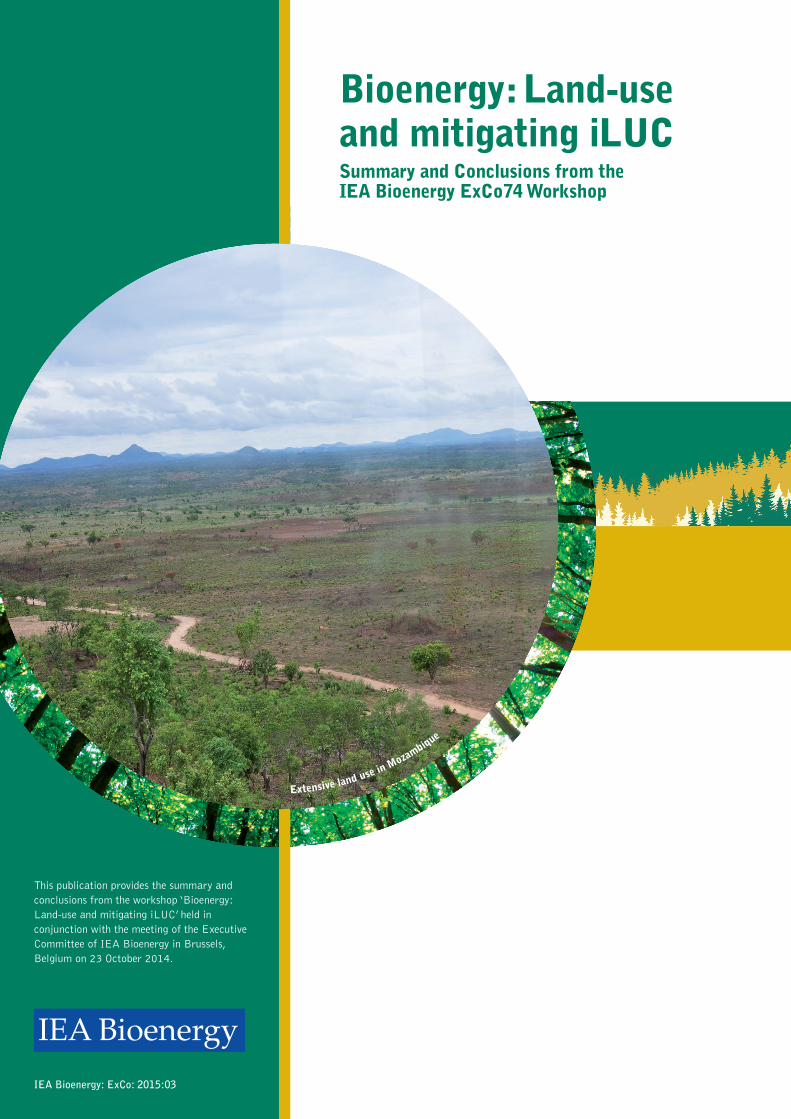
• There are large differences in estimated
iLUC impacts between crop groups, these
being lower for sugars and cereals than for
vegetable oils.
• iLUC is a serious concern, but significant
uncertainties remain (Fig.1).
The report concluded that the minimum GHG
savings from biofuels should be increased.
5 http://www.ifpri.org/publication/assessing-land-use-change-consequences-european-biofuel-policies
3
Source: Figure 18 of IFPRI-report
Vegetable oils
Cereals and sugars
Figure 1: Feedstock-specific results of GHG emissions in gCO2eq/MJ (Source IFPRI)
In 2012 the Commission came out with a
proposal asking for:
• Reporting of iLUC by member states and
by the Commission
• Reduction of GHG emission to min. 60% in
new installations and 50% in existing plants,
starting June 2014
• Cap on first-generation biofuels at 5%
by 2020
• Double or quadruple counting of non-food
or feed crop
• No more subsidies for food and feed based
first-generation biofuels after 2020
However, no agreement was achieved between
Parliament, Council and Presidency by the date
of this workshop.6
6 In April 2015, the European Parliament and the Council reached a political agreement. The ‘iLUC Directive’ is expected to be adopted in September 2015.
PRODUCTION AND PROTECTION: BEYOND DEFORESTATION POLICY IN BRAZIL
Carlos A. Klink, Ministry of the Environment, Brazil
In 2009 the Brazilian Parliament approved
a national policy on climate change. The
programme fighting deforestation has made
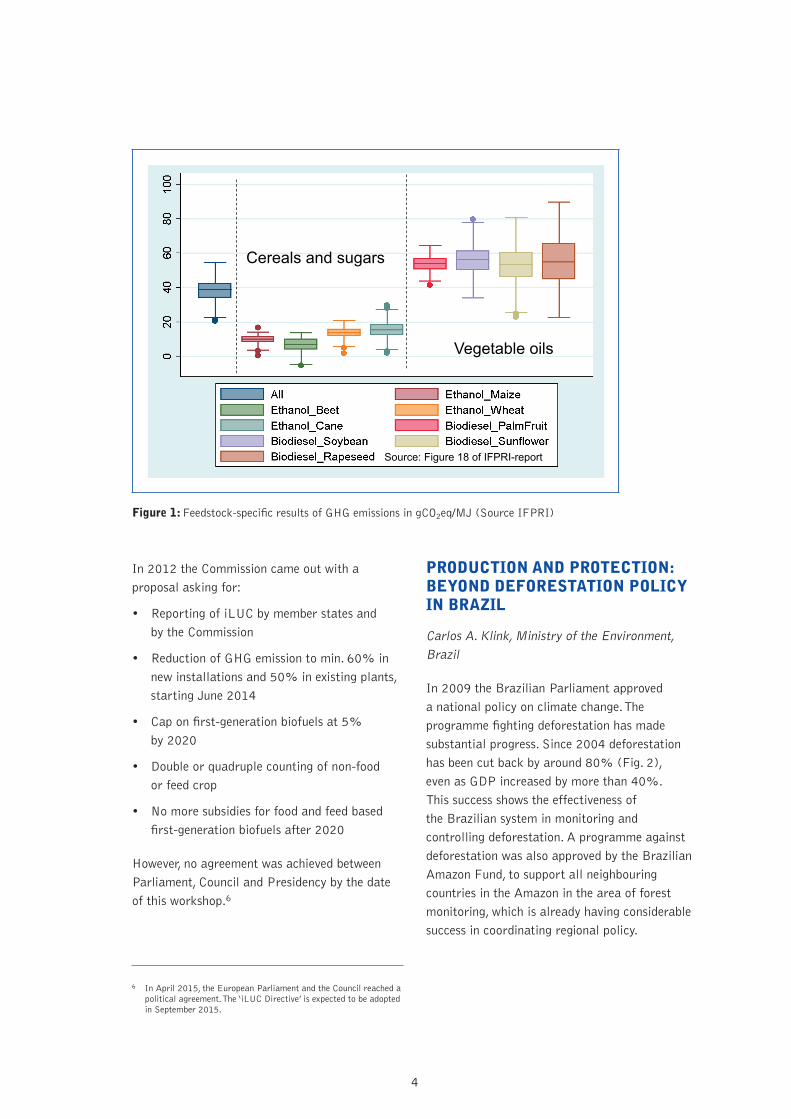
substantial progress. Since 2004 deforestation
has been cut back by around 80% (Fig. 2),
even as GDP increased by more than 40%.
This success shows the effectiveness of
the Brazilian system in monitoring and
controlling deforestation. A programme against
deforestation was also approved by the Brazilian
Amazon Fund, to support all neighbouring
countries in the Amazon in the area of forest
monitoring, which is already having considerable
success in coordinating regional policy.
4
Figure 2: Reduction of deforestation in Brazil since 20047
The avoided emissions increased to 650Mtonnes
CO2 eq. per year on average between 2010
and 2012, a reduction equivalent to the yearly
emission of the UK. Despite the success, the
cutting of trees is still too high; it is extremely
difficult to further reduce deforestation, at
around 30,000 km2/year in the past to the
current 5,000 km2/year.
The new Forest Code is a new opportunity to
reconcile the need for increased food, timber
and bioenergy production with the protection
of Brazil’s unique environmental assets. It
represents the commitment of Brazilian society
to protect and restore a substantial portion of all
Brazilian biomes, combined with the expansion
of production to feed millions in Brazil and
new consumers around the globe. The Brazilian
agriculture, forestry and bioenergy sectors have
been undergoing major structural changes over
the last 15 years. The centuries-old pattern of
agricultural exploitation based on the abundance
7 INPE Brazilian Space Agency & Brazilian Ministry of the Environment.
of cheap land is rapidly being replaced by a
technology-based system that saves on non-
renewable factors and improves yields. Thanks
to more information and physical and human
capital, agricultural production in Brazil rose by
64% between 2005 and 2013, while the area
used for agriculture increased by just 9%.
The climate actions are financed by funds, the
national treasury and international donations.
The climate-change fund, which receives a small
contribution from oil exploration in Brazil,
provides grants to civil society and investments
to the private sector in the area of climate
innovation. The Amazon fund combined with
governmental investments support actions to
curb deforestation. The low-carbon agriculture
programme provides concessional investments
to farmers who use carbon-saving technologies.
The success of an action depends on a number
of factors, as well as innovative business plans
in the field of climate improvement.
5
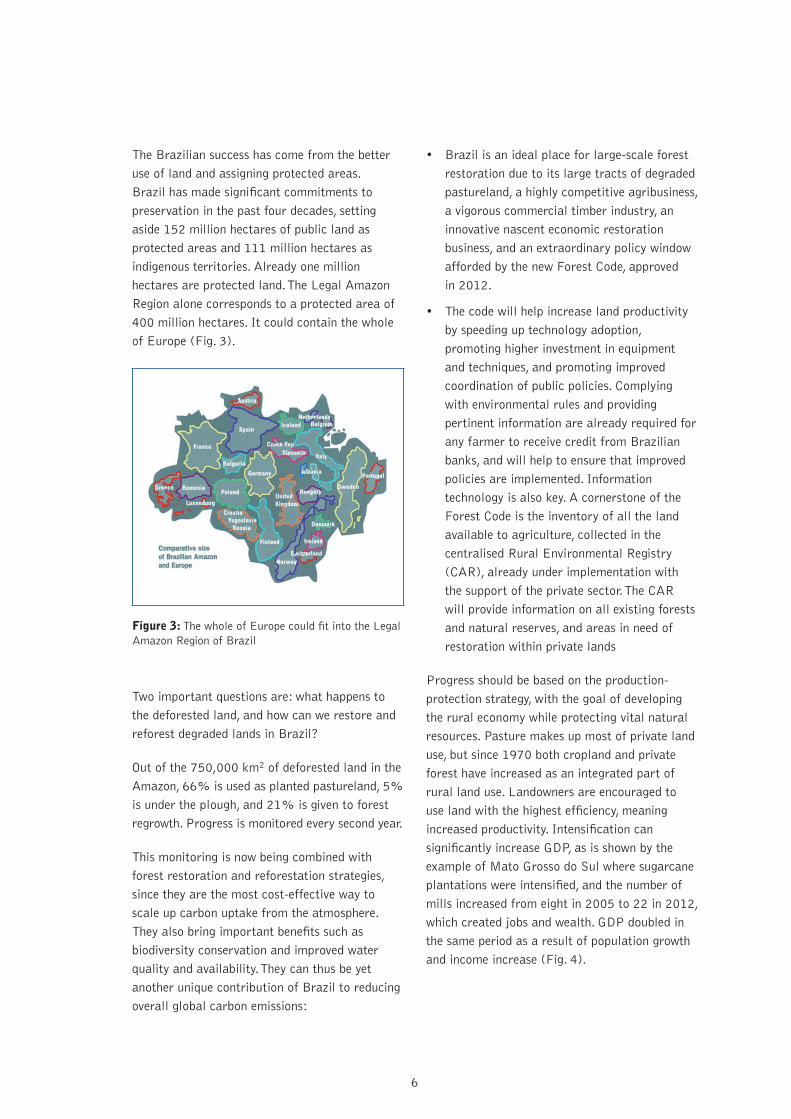
The Brazilian success has come from the better
use of land and assigning protected areas.
Brazil has made significant commitments to
preservation in the past four decades, setting
aside 152 million hectares of public land as
protected areas and 111 million hectares as
indigenous territories. Already one million
hectares are protected land. The Legal Amazon
Region alone corresponds to a protected area of
400 million hectares. It could contain the whole
of Europe (Fig. 3).
Figure 3: The whole of Europe could fit into the Legal Amazon Region of Brazil
Two important questions are: what happens to
the deforested land, and how can we restore and
reforest degraded lands in Brazil?
Out of the 750,000 km2 of deforested land in the
Amazon, 66% is used as planted pastureland, 5%
is under the plough, and 21% is given to forest
regrowth. Progress is monitored every second year.
This monitoring is now being combined with
forest restoration and reforestation strategies,
since they are the most cost-effective way to
scale up carbon uptake from the atmosphere.
They also bring important benefits such as
biodiversity conservation and improved water
quality and availability. They can thus be yet
another unique contribution of Brazil to reducing
overall global carbon emissions:
• Brazil is an ideal place for large-scale forest
restoration due to its large tracts of degraded
pastureland, a highly competitive agribusiness,
a vigorous commercial timber industry, an
innovative nascent economic restoration
business, and an extraordinary policy window
afforded by the new Forest Code, approved
in 2012.
• The code will help increase land productivity
by speeding up technology adoption,
promoting higher investment in equipment
and techniques, and promoting improved
coordination of public policies. Complying
with environmental rules and providing
pertinent information are already required for
any farmer to receive credit from Brazilian
banks, and will help to ensure that improved
policies are implemented. Information
technology is also key. A cornerstone of the
Forest Code is the inventory of all the land
available to agriculture, collected in the
centralised Rural Environmental Registry
(CAR), already under implementation with
the support of the private sector. The CAR
will provide information on all existing forests
and natural reserves, and areas in need of
restoration within private lands
Progress should be based on the production-
protection strategy, with the goal of developing
the rural economy while protecting vital natural
resources. Pasture makes up most of private land
use, but since 1970 both cropland and private
forest have increased as an integrated part of
rural land use. Landowners are encouraged to
use land with the highest efficiency, meaning
increased productivity. Intensification can
significantly increase GDP, as is shown by the
example of Mato Grosso do Sul where sugarcane
plantations were intensified, and the number of
mills increased from eight in 2005 to 22 in 2012,
which created jobs and wealth. GDP doubled in
the same period as a result of population growth
and income increase (Fig. 4).
6
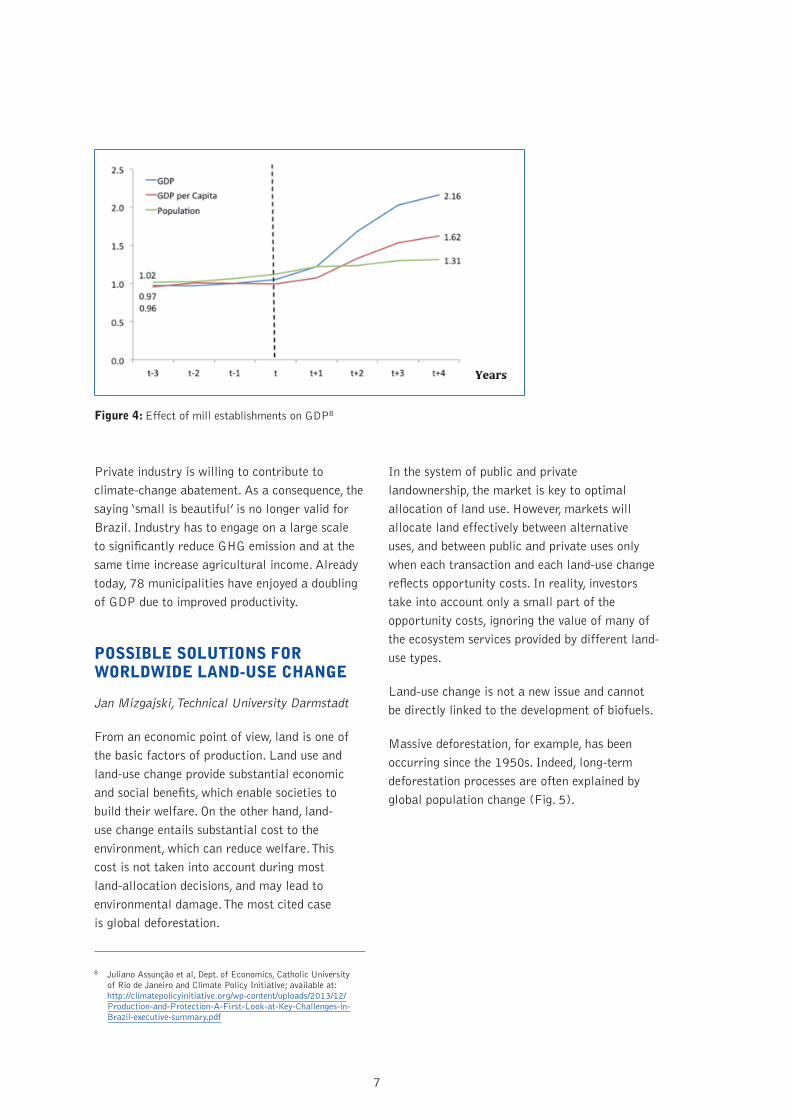
Figure 4: Effect of mill establishments on GDP8
Private industry is willing to contribute to
climate-change abatement. As a consequence, the
saying ‘small is beautiful’ is no longer valid for
Brazil. Industry has to engage on a large scale
to significantly reduce GHG emission and at the
same time increase agricultural income. Already
today, 78 municipalities have enjoyed a doubling
of GDP due to improved productivity.
POSSIBLE SOLUTIONS FOR WORLDWIDE LAND-USE CHANGE
Jan Mizgajski, Technical University Darmstadt
From an economic point of view, land is one of
the basic factors of production. Land use and
land-use change provide substantial economic
and social benefits, which enable societies to
build their welfare. On the other hand, land-
use change entails substantial cost to the
environment, which can reduce welfare. This
cost is not taken into account during most
land-allocation decisions, and may lead to
environmental damage. The most cited case
is global deforestation.
8 Juliano Assunção et al, Dept. of Economics, Catholic University of Rio de Janeiro and Climate Policy Initiative; available at: http://climatepolicyinitiative.org/wp-content/uploads/2013/12/Production-and-Protection-A-First-Look-at-Key-Challenges-in-Brazil-executive-summary.pdf
In the system of public and private
landownership, the market is key to optimal
allocation of land use. However, markets will
allocate land effectively between alternative
uses, and between public and private uses only
when each transaction and each land-use change
reflects opportunity costs. In reality, investors
take into account only a small part of the
opportunity costs, ignoring the value of many of
the ecosystem services provided by different land-
use types.
Land-use change is not a new issue and cannot
be directly linked to the development of biofuels.
Massive deforestation, for example, has been
occurring since the 1950s. Indeed, long-term
deforestation processes are often explained by
global population change (Fig. 5).
7

Bln ha
Weltbevölkerung
Bln
Deforestatio
n
Figure 5: The relationship between cumulative deforestation and world population
However, when considering the causes of
deforestation from a local perspective in
shorter periods of time, there is evidence that
deforestation is a result of different combinations
of various proximate causes and underlying
driving forces.9 The extension of overland
transport infrastructure, followed by commercial
wood extraction, permanent cultivation and
cattle ranching, are the leading proximate causes
of deforestation. The analysis of underlying
levels shows that multiple factors are acting
synergistically, but economic factors are
prominent forces of tropical deforestation.
The unsustainable trend of deforestation is not
the only example of intemperance in today’s
world. The rate of deforestation just reflects
the general incapability of global society to
control its consumption. There is no doubt that
increasing the growth of energy crops carries
some environmental risks. But biofuels cannot be
identified as the most important or single global
9 Geist, H.J. and E.F. Lambin, Proximate Causes and Underlying Driving Forces of Tropical Deforestation: Tropical forests are disappearing as the result of many pressures, both local and regional, acting in various combinations in different geographical locations, BioScience, 2002. 52(2): p. 143-150.
cause of land-use change (LUC). Projected
changes in land use caused by biofuel policies are
very small in comparison to other changes. This is
why the effective solution to LUC should go far
beyond biofuels.
The most evident solutions for mitigating LUC
worldwide can be summarised in two actions:
Land-use conservation measures and decrease of
pressure on land by increasing resource efficiency
on both sides of the market, in production and
consumption.
The basic and most important type of action to
reduce LUC is conservation of land. On the global
scale, conservation measures are often attenuated
by weak governance in land management. Land
protection should be improved by continuous
enhancement of governance and expansion of
land protection policies to new areas.
Direct land conservation measures must
be accompanied by a change in production
and consumption patterns: intensification of
crop yield by optimal cropland management
(plant management, double cropping), grazing
land management (plant, animal and fodder
management) and using integrated agriculture
8

production systems. There is also growing interest
in using abandoned or degraded land, which can
be suitable for agriculture development, including
bioenergy purposes. Sustainable intensification of
agriculture (sustainsification) resulting in higher
yields is the key to iLUC mitigation.
Another opportunity is the use of abandoned or
set-aside land; 8% of current primary energy
demand, based on historical land-use data,
satellite-derived land cover data, and global
ecosystem modelling, could be covered by crops
grown on abandoned land10 of an estimated
global area of 385-472 million hectares (Fig. 6),
corresponding to 66-110% of the areas reported
in previous assessments. The area-weighted mean
production of above-ground biomass is 4.3 tons
of wet biomass per hectare and year, a factor of
two lower than previous assessments assumed. The
potential energy content is still significant, at 10%
of primary energy consumption in industrialised
countries, but it may cover more than the actual
energy demand in some African nations.
Figure 6: Potential biofuel production on abandoned land
10 www.grida.no/graphicslib/detail/indirect-land-use-change-induced-by-increased-biofuels-production_e9af
When it comes to the demand-side solutions, the
focus should be primarily on the change of food
consumption patterns, including change of diets
to less meat, followed by more careful storage
and use of nutrition. According to FAO, globally
one-third of the edible parts of food produced for
human consumption are lost or wasted.11
Session 2: iLUC mitigation models and application
PRECONDITIONS FOR SUSTAINABLE BIOMASS SOURCING, IMPROVED MODELS, MONITORING AND GOVERNANCE
André Faaij, University of Groningen, Energy Academy Europe
When looking at bioenergy, the first questions
are always ‘What is the potential?’ and ‘Can
it be sustainably produced?’. Hence the trigger
point is what we can do to mobilise biomass
in a sustainable way.
As a first step, we need to specify whether the
potential is a technical, economic, implemented
or sustainable potential. Potentials are not
carved in stone; they develop over time and
are always linked to biomass categories and
production systems. They are overlain by the
supply and demand potential of biomass. There
are some decisive parameters on the supply
side such as improvement of agricultural
management, choice of crops, food demand and
human diet, use of degraded land and, last but
not least, competition for water.
11 FAO, Global food losses and food waste – Extent, causes and prevention. 2011, Rome.
9

Figure 7: Bioenergy potentials for 2050 based on expert opinion
In the framework of the Intergovernmental Panel
on Climate Change (IPCC),12 expert opinions
on potential energy supply from biomass were
collated (Fig 7). The relatively high agreement is
rather encouraging. There is high probability that
the sustainable potential for 2050 is a minimum
of 25 EJ per year, with a good chance of covering
at least the actual bioenergy use of 50 EJ/y.
Yield factors are extremely important for
reaching the potential. From 1960 to 2010 the
average yields increased by a factor of about
2.5, even though fertiliser application has been
substantially reduced since the mid-1980s,
to reach levels comparable to those in 1960.
However, as regards the example of wheat in
Western Europe, the values reached are far
higher than in Eastern Europe13 (Fig 8). If
Eastern yields were raised to Western values,
the higher production would be impressive.
12 IPCC – AR5 WGIII, 2014.
13 De Wit et al, Renew Sustain Energy Rev (RSER), 2011. [Not an adequate reference]
Figure 8: Yield development of wheat in different European states
10

Overall, there is considerable feedstock potential
that could be produced on 65 Mha of arable
lands and on 24 Mha of pastures (grass and
wood). The cost of biomass, of course, plays a
substantial role14 (Fig. 9).
Summary baseline 2030
0369
1215182124
0 6 12 18Supply (EJ/year)
Prod
uctio
n C
osts
(€/G
J)
Oil
Summary baseline 2030
0369
1215182124
0 6 12 18Supply (EJ/year)
Prod
uctio
n C
osts
(€/G
J) Starch
Oil
Summary baseline 2030
0369
1215182124
0 6 12 18Supply (EJ/year)
Prod
uctio
n C
osts
(€/G
J) Starch
OilSugar
Summary baseline 2030
0369
1215182124
0 6 12 18Supply (EJ/year)
Prod
uctio
n C
osts
(€/G
J)
Wood
Starch
OilSugar
Summary baseline 2030
0369
1215182124
0 6 12 18Supply (EJ/year)
Prod
uctio
n C
osts
(€/G
J)
GrassWood
Starch
OilSugar
Summary baseline 2030
0369
1215182124
0 6 12 18Supply (EJ/year)
Prod
uctio
n C
osts
(€/G
J)
GrassWood
Starch
OilSugar
GrassWood
1st generation
2nd generation
Figure 9: Crop-specific supply curves
There is a significant difference in supply and
production cost between first- and second-
generation crops. The supply potential is high
when compared to the demand in 2010 (0.78
EJ/yr) and the projected demand in 2020
(1.48 EJ/yr).
Today there are good tools for modelling yields
and corresponding sustainability for regional or
global assessments. They take all kinds of factors
into consideration, such as current land use, soil
suitability, population density, distance to roads
and cities, and distance to water, and they show
us that yields can be increased so as to offer
enough room for biofuel production. The question
is more about whether we really understand the
results.
14 Wit & Faaij, Biomass & Bioenergy, 2010. [Not an adequate reference – same on foll. pages]
The modelling of iLUC mitigation bears
considerable incertitude. This is acceptable
as long as it is shown and explained; e.g.
the comparator (g CO2/MJ) or type of fossil
energy source (tar sands, shale gas, etc). The
improvement of iLUC modelling shows that we
do not know the full reality. A number of key
efforts have still to be made, such as description
of the historic data basis, model shock,
short-term considerations, business as usual
(BAU), current technology. The LUC and GHG
implications (carbon stock) have to be quantified.
We also need bottom-up insights.
Agricultural technology advancements by
biological and bioengineering methods have to
be covered, and changes in land and production
have to be verified. LUC depends also on
zoning, productivity, socio-economic drivers,
the governing of forest and agriculture, and
identification of the ‘best’ lands.
Searchinger et al’s 2008 paper has led to a
large number of partially incomprehensible
political decisions and has, as a result, done a
lot of damage to the development of biofuels.
On a positive note, however, good scientific work
has been initiated, making us confident that
future biomass resources will not be in conflict
with food and feed production if we consider
a number of parameters.
The main improvements in the modelling
(Fig. 10) relate to updates in the global
economic database used in the Global Trade
Analysis Project (GTAP) (from 2001 to
2006): inclusion of pastureland as an option
for bioenergy production, inclusion of animal
feed co-products, crop yields (both for
agricultural crops and bioenergy crops) on
existing agricultural land and newly converted
land, and the fraction of carbon that is stored
for a longer period in wood products.
11

-‐100 -‐50 0 50 100
Searchinger et al. [3]
CARB [13]
EPA [18]
Hertel et al. [14]
Tyner et al. [15] – Group 1
Tyner et al. [15] – Group 2
Tyner et al. [15] – Group 3
Al-‐Riffai et al. [16]
Laborde [17]
Lywood et al. [25]
Tipper et al. [2] – marginal
Tipper et al. [2] – average
LUC-‐related GHG emissions (g CO2e/MJ)
Corn
B: Ethanol
Figure 10: Development of GHG emissions as a function of model improvement15
In real life there are still a number of
opportunities to mitigate iLUC:
• Increasing efficiency in agriculture,
livestock and bioenergy production
• Integrating food, feed and fuel production
• Increasing chain efficiencies
• Minimising degradation and abandonment
of agricultural land
Integrated food, feed and fuel production
is important for increasing overall biomass
production and, at the other end of the chain,
for increasing the efficiency of biomass use.
The modelling of iLUC factors is only half of
the scientific work needed. It is reactive and
retro-oriented work. What is required is the
development of proactive concepts.
The actual biofuel policy is even less than half
of what we need. Interlinked agricultural and
bio-based economy policies (agri, clima, energy,
etc) are required. Integral land-use strategies
15 Wicke et al, Biofuels, 2012.
have to be investigated and implemented to
achieve synergies.
A final thought: If we accept that there are
developments in food and feed production, we
will have very low net iLUC emissions at the end
of the day. When mitigation is properly applied,
results can even be positive.
LANDMARK TEST OF ILUC BIOFUELS THEORY
Tristan Brown, SUNY College of Environmental Science & Forestry
While iLUC has been discussed since the 1990s,
the concept achieved widespread recognition
following the publication in Science16 by Timothy
Searchinger and colleagues in 2008 (see also
André Faaij) that calculated the lifecycle
greenhouse-gas (GHG) emissions of US biofuels
when accounting for emissions from iLUC.
16 T. Searchinger et al, (2008), Use of U.S. Croplands for Biofuels Increases Greenhouse Gases Through Emissions from Land-Use Change, Science 29: Vol. 319 no. 5867, pp. 1238-1240.
12

The paper received immense attention from the
US government, academia and the media, and
influenced the political decision in the USA that
led to tight GHG emission thresholds (Table 1),
even though subsequent analyses found its results
to be very sensitive to the assumptions it made.
Table 1: The Renewable Fuel Standard 2 (RFS2) GHG emission reduction thresholds
RFS2 Biofuel category GHG emission reduction threshold
Renewable fuel (corn ethanol)
20%
Advanced biofuel 50%
Biomass-based diesel 50%
Cellulosic biofuel 60%
In particular, Searchinger et al attributed iLUC,
in the form of the deforestation of primeval
forests in Brazil, to the commercial-scale
production of US maize ethanol. However,
they failed to quantify the lumbering during
the years when US production of ethanol from
maize greatly increased. Annual deforestation
in the Amazon peaked in 2004 at 2.7 million
hectares before falling to 0.5 million hectares
in 2012 (Fig. 11). During the same period,
US ethanol production (virtually all of it from
maize feedstock) increased from 12,869 million
litres to 50,341 million litres. In other words,
while the Searchinger analysis predicted that
an increase in annual US ethanol production by
56,000 million litres would result in two million
hectares of tropical deforestation in Brazil alone,
the annual rate actually fell by the same number
between 2004 and 2012.
0
200
400
600
800
1000
1200
1400
1600
1800
1991
1992
1993
1994
1995
1996
1997
1998
1999
2000
2001
2002
2003
2004
2005
2006
2007
2008
2009
2010
2011
2012
Inde
x (1
991
= 10
0) U.S. EtOH production
Brazilian deforestation
Figure 11: Brazilian deforestation compared to US EtOH production
Much of the decrease in Brazil’s deforestation
rate has been attributed to the country’s
enforcement of anti-deforestation laws, including
an expansion of its space program to include the
monitoring of Amazonian rainforests via satellite.
While the basic mechanism behind the theory
of iLUC remains plausible, Brazil’s experience
with deforestation in the 21st century suggests
that other factors (such as law enforcement)
can override the influence of first-generation
biofuel production in the developed world on
deforestation in developing countries. Brazil’s
experience also demonstrates why accurate
quantification of a particular biofuel’s lifecycle
GHG emissions under iLUC should take into
account actual deforestation in the affected
country.
It is interesting to note that Brazilian sugarcane
ethanol was not of concern. In fact, both growth
areas are regulated and are some 2,000 km
away from the Amazon. The real culprit for
deforestation in the early years of the third
millennium was soya production.
After US policy introduced iLUC into GHG
emission calculations, other studies with more
thorough data bases appeared, showing that the
iLUC effect was far lower, falling from more
than 100g CO2/MJ to values as low as 5g/MJ
(Fig.12).
13

Figure 12: iLUC estimates for corn ethanol since 2008 (source Cooper, 2013)
The EPA’s early calculations attributing large
iLUC impacts to US maize ethanol production
have remained unchanged, however. Soon after
the Brazilian case, deforestation in Indonesia due
to palm-oil production for biofuel became the
evil. Again, the same question has to be raised: is
there really such a simple correlation? Learning
from Brazil tells us to be more careful with snap
judgments. The fact that Searchinger et al’s LUC
emission calculation is lowered by 80% when a
one-time increase to yield is assumed tells us that
the data base is still not robust enough.
We may conclude that the alleged Amazonian
deforestation created by US maize EtOH
production was based on weak data and snap
conclusions. Deforestation has fallen by 83%
since 2004 even as EtOH production from corn
has tripled in volume. Modelled projections have
steadily fallen as flawed assumptions have been
reviewed.
Care should be taken that the Indonesian
deforestation models undergo similar scrutiny
before results are used to develop biofuel
regulations. In addition, this is of high
importance considering multiple deforestation
preventative measures.
PRACTICAL WAYS TO ACHIEVE ILUC-FREE BIOFUELS
Daan Peters, Ecofys
Biofuels and other forms of bioenergy are
expected to play an important role in meeting
future energy demands, especially in sectors
without major alternatives such as aviation,
shipping, long-distance heavy-duty transport, or
industries requiring high-temperature heating.
During a transition period to alternatives,
bioenergy can also play a role in decreasing GHG
emissions from passenger vehicles and heat and
power generation.
Bioenergy feedstock demand and associated land
demand might have direct and indirect impacts
like LUC or iLUC. LUC and other direct impacts
can generally be determined and attributed to
the party that caused them. However, indirect
effects like iLUC and food/feed commodity price
increases are more difficult to attribute to a
given biofuel and generally cannot be measured.
Increased commodity prices in turn can cause
market reactions, some of which have impacts
on LUC: conversion of additional land eventually
including land with high carbon stocks, additional
production through intensification, or price-
induced reduction in consumption.
Both effects – iLUC and impacts on food
security – are so-called indirect impacts, caused
by increased biofuel production. Other indirect
impacts could include additional fertiliser and
water consumption.
The strategy to solve iLUC in the long term is the
prevention of direct LUC. Actually, mainly short-
term solutions are applied, such as expansion
of the use of iLUC-free biofuels, a cap on or
reduction in the use of high iLUC-risk biofuels,
and acceptance of iLUC risks but compensation
of the effect through offsetting.
14

There are numerous options to prevent iLUC:
1. Using non land-using (residue) materials
as biofuel feedstocks available in surplus
quantities
2. Using unused land
3. Increasing crop yields
4. Sugarcane-cattle integration
5. Using fallow land as part of crop rotation
6. Introducing multi-cropping
7. Reducing post-harvest losses
8. Improving the conversion efficiency of biofuel
installations
9. Using land historically used for biofuels
10. Substituting animal feed-co-product
(partly an offsetting option)
To facilitate the options, Ecofys in collaboration
with the World Wide Fund for Nature
(WWF) and the Roundtable on Sustainable
Biomaterials (RSB) have developed the Low
Indirect Impact Biofuels (LIIB) methodology
to describe concepts for mitigation of iLUC and
other indirect impacts of biofuels. It includes
four different approaches: Using non land-
requiring materials (residue and wastes) as
biofuel feedstock available in surplus quantities,
unused land, increase of crop yield and ethanol
sugarcane-cattle integration – i.e. items 1-4
listed above.
All four options have been pilot-tested with
partners and auditors in Brazil for ethanol
sugarcane, oil-palm yield increase in Indonesia,
unused land in Mozambique and biodiesel from
residues in South Africa. In addition, the LIIB
method has been applied in desk studies on
bioenergy projects in Tanzania and Ukraine.
It should be underlined that LIIB is not a model
but a practical implementation method. Nor is it
another voluntary certification scheme, but it can
be used as an add-on to existing schemes; Ecofys
currently develops LIIB compliance indicators
for the RSB certification scheme.
As one of the first options, the option of waste
and residues as raw material for bioenergy has
been examined. Residues only have an iLUC risk
in cases where materials are already used by
other sectors. Other than that, surplus quantities
of residues are iLUC-free. The current system
at the European Commission is a ‘go or no go’
method based on positive lists. In the LIIB
method, we propose to identify the available
surplus per residue material and set caps on
biofuel consumptions per residue feedstock.
Essentially, however, caps should be set at the
EU level to avoid differences among the different
voluntary schemes. In addition, central lists can
be regularly updated.
As a second option, unused land can be
abandoned farmland (e.g. in Eastern Europe) or
low-carbon-stock, low-biodiversity land not used
for agriculture before (e.g. alang grassland in
Indonesia). Biofuel feedstock produced on unused
land is iLUC-free because no existing agricultural
production is displaced. Unused land can be
certified per individual biomass producer, and is
often used extensively (Fig. 13), or, for instance, a
sheep herd may pass through occasionally.
The method has three steps:
1) A farmer or developer identifies land that has
not been used for provisioning services during
the previous three years.
2) An auditor checks ex ante if the land is
currently unused and has been unused for the
last three years, and checks ex post how much
biofuel feedstock production took place on
the land.
3) The sustainability requirements of the
voluntary scheme chosen are applied.
15

Figure 13: Extensively used land can be LIIB-certified if there are viable local alternatives
The third option is additional biofuel feedstock
production on existing agricultural land. The
resulting yield increase does not displace
agricultural production to elsewhere. Yield
increase should be certified per farm. Again,
it’s a three-step process:
1) The baseline yield is established based
on historical yield increases at farm level
combined with regional figures (Fig. 14).
2) Farmers develop measures to achieve above-
baseline yield increases. The yield above the
defined baseline is iLUC-free.
3) The auditor checks the baseline and measures
ex ante and ex post whether the measures
are being implemented, and the difference
between baseline and actual yields.
Possible climatic impacts on current yields can
be reduced by averaging actual yields over several
years and/or by cross-checking with regional yield
data. Again, the sustainability requirements of
the voluntary scheme chosen will apply.
Figure 14: Individual farm-level baseline: historical yield data of farmers in the region compared to historical yield of farmer seeking certification
Future yield baseline created based on past trend.
1a is the current year yield of the LIIB applicant farmer based on the average yield during the last 5 years.
1b is the expected current year yield of farmers of the same crop in the same region.
Red dotted line is yield trend line of the same crop in the same region over the previous 10 years.
The last option is the integration of sugarcane
production and cattle-grazing. The idea is to
use the residues of sugar and EtOH production
as cattle feed and thus to free part of the large
surfaces for grazing for cane production. This
allows increased density of cattle per hectare,
creating more land for sugarcane without
displacement effects. The iLUC-free certification
should be done at the level of an individual
sugarcane mill and the corresponding fields.
The method is slightly more complex than
for the three options above:
1. Convert all sugarcane by-products to Total
Digestible Nutrients (TDNs).
2. Convert TDN to a quantity of animal units (AUs).
3. Convert the AU into a surface required
to produce enough grass to feed them –
the resulting surface corresponds to the
iLUC avoided area.
4. The amount of ethanol the mill produces on
an equivalent area is iLUC-free.
5. Audit the quantity and quality of mill by-products
and their uses, the cattle farmer purchasing
and feeding the by-products, and ultimately
the correct quantification of iLUC-free biofuel.
16
Sugarcane by-products include bagasse,
molasses, yeast, cane straw, filter cake, vinasse
and cane tops. Bagasse is hydrolysed to increase
digestibility.
Only mills where more than 20% of by-products
are fed to ruminants are eligible for certification.
If 20% of by-products instead of 100% are fed
to animals, the amount of iLUC-free biofuel is
adjusted accordingly. This threshold avoids the
inclusion of sugarcane by-product rations with a
marginal contribution to cattle production.
In conclusion, we can say that the method looks
pretty promising and easy to apply in the very
near future. The methodology is a low-cost
addition to existing sustainability models. The
clear and simple message for policymakers is:
there are methods coming to the market that
allow production of iLUC-free first-generation
biofuels.
Session 3 – Case studies of iLUC mitigation
INTEGRATING LINGO-CELLULOSIC CROPS INTO THE AGRICULTURAL LANDSCAPE
Göran Berndes, Chalmers University of Technology, Gothenburg
It is evident that society will continue to set a
large ‘footprint’ on Earth, since our land use
provides food and other products necessary for
sustaining the increasing human population. It
is also evident that the transition to a bio-based
economy requires strategies for efficient use of
biomass from sustainably managed landscapes.
The management of natural resources to provide
needs for human society whilst recognising
environmental balance is the challenge facing
society.
As mentioned by other speakers at the workshop,
best agricultural practice adapted to local
needs is a pre-condition for mitigation of direct
and indirect LUC. However, the promotion
of attractive options for bioenergy expansion
does not require that displacement of food
crop production should always be prevented.
Displacement of food production is a common
way of addressing negative impacts associated
with prevailing agriculture practices. Results of
poor practices include wind erosion, soil runoffs,
salinisation and eutrophication of surface waters
due to excess fertilisation. Biomass production
systems can be integrated into agriculture
landscapes so as to provide other ecosystem
services than the provisioning service, i.e. the
biomass supply.
There are many examples of how bioenergy
systems – through well-chosen site location,
design, management and system integration –
can mitigate the negative impacts of current
agriculture production and promote more
sustainable uses of land and water. New biomass
production systems can also help in improving
habitat heterogeneity in agricultural landscapes
and reverse the negative biodiversity effects
of land abandonment in marginal regions.
Maintenance of landscape components favouring
biodiversity (e.g. wetlands and highly biodiverse
grasslands) can be combined with biomass
production.
Grassed waterways are often used in agricultural
ecosystems as a best management practice to
reduce erosion off fields and within ephemeral
stream channels (Fig. 15). Terraces and other
structures, such as buffer or filter strips
with perennial vegetation, can slow surface
runoff and trap sediments, nutrients and other
contaminants. They can also reduce soil erosion.
Shelterbelt plantations, or windbreaks, slow the
wind to reduce wind erosion, provide shelter from
the wind for livestock and homes, and can also
trap snow (Fig. 16). Riparian buffer strips with
trees, shrubs and grasses adjacent to streams,
lakes and other water bodies provide habitat for
17

wildlife, increase biodiversity and trap sediment
and nutrients that would otherwise reach the
water. The plant roots help to control bank
erosion by holding the soil together.
Plantations can also be used as vegetation
filter systems for the treatment (via irrigation)
of nutrient-bearing water such as wastewater
from households, collected runoff water from
farmlands and leachate from landfills. Sewage
sludge from treatment plants can be used as
fertiliser in vegetation filters, supporting nutrient
recirculation back to soils.
Figure 15: Grassed waterway in Marshall County, Iowa, USA
Photo: USDA NRCS
Figure 16: Field windbreaks in North Dakota
Photo: Public domain
Trees and shrubs can be used to address soil
salinity by reducing groundwater recharge, either
by using water in the root zone and reducing
‘leakage’ to deeper aquifers, or by reducing saline
or potentially saline groundwater levels (putting
them deeper beneath the ground surface) through
roots directly accessing the water table and
increasing discharge.
Phytoextraction is an excellent measure to
remediate soils from heavy metals like cadmium.
In Sweden, willow is used as an excellent crop to
reduce heavy metals.
All these measures involve some degree of
displacement or reduction of food production.
But displacement of unsustainable food
production is essential for obtaining sustainable
land use (Fig. 17).
Figure 17: Measures to make landscape more sustainable
18

The right way of thinking is to integrate
bioenergy systems as an opportunity to design
landscapes that add ecological value. In addition,
there are also direct measures to optimise land
use in relation to biorefineries, such as reduction
of nitrogen and phosphor application by
introducing taxation on mineral fertilisers.
All this has nothing to do with the iLUC
of biofuels. It is a far larger problem of
unsustainable food production. The iLUC of
bioenergy looks at a small individual system and
thus often loses sight of the overall agricultural
dynamics over hundreds of years, which,
influenced by many parameters, are much more
important.
The right, holistic way to go is to displace
unsustainable land use for food, feed and energy
and to establish sustainable land-use systems.
ILUC MITIGATION AS ILLUSTRATED IN REGIONAL CASE STUDIES
Birka Wicke, Copernicus Institute, University of Utrecht
Given the interlinkages between economic
sectors and activities that enhance iLUC, the
key to address ILUC mitigation is a holistic,
integrated view on land use for food, feed, fibre
and fuels. iLUC mitigation measures benefit the
agricultural sector as a whole. It will be shown
below, in several different ways, that we need to
tackle the entire agricultural sector.
We have several options to mitigate and even
prevent iLUC:
• Increase agricultural yields (the focus is on
crops, but also includes livestock)
• Use biofuel co-products and by-products
• Increase chain efficiency
• Bring under-used land into production and
demarcate land that should not be converted
The first and the last option of the four
contribute the most to ILUC prevention and will
primarily be dealt with below. The Copernicus
Institute analysed and demonstrated these
measures in regional case studies in Eastern
Europe and South-East Asia, applying different
scenarios.
Why was the focus put on the regions? The
answer is obvious: if a region can demonstrate
that it can produce additional biofuels while
guaranteeing other production for food, feed and
fibre, and does not expand onto high-carbon-
stock land, then biofuel production in that region
does not cause iLUC. In all case studies, the
potential for increased production is significant,
but not in all scenarios.
The approach chosen accounts for baseline
projections of food, feed and biofuel demand,
and determines how the key iLUC mitigation
measures can contribute to meeting the
additional biofuel demand under the EU biofuels
mandate without undesired land-use change
(Fig. 18).
There are a number of top-down models available
like MIRAGE from the International Food
Policy Research Institute (IFPRI). The applied
bottom-up model not only compares the target
production with the baseline but also with
current production to avoid unsustainable food
production. To calculate the biofuel potential
from iLUC prevention measures (Fig. 18, point
2), a scenario approach was chosen (low, medium
and high) where even the low is better than the
baseline. This is to assess how far improvement is
possible compared to ‘business as usual, and how
these different scenarios compare to the future
demand projected by MIRAGE.
19

Figure 18: Top-down and bottom-up models
Three case studies were carried out in Eastern
Europe: in eastern Romania with rapeseed
biodiesel, in Hungary with corn ethanol, and
in Lublin province, Poland with miscanthus-
based ethanol. A fourth case study was done for
northeast Kalimantan, in the Indonesian part of
Borneo, with palm-oil biodiesel.
Mitigating iLUC while increasing crop yieldsThe potential to mitigate iLUC with increased crop yields was studied in all cases. To illustrate
how the approach works, only the region of
eastern Romania is described below.
The first step of the process is an assessment
of yield developments of all possible cultures.
For 2020 a production volume is fixed based on
MIRAGE projections. Figure 19 illustrates the
varying yields of rapeseed in three scenarios and
how these compare to past yield trends in other
countries. In a second step, the land area that
could be made available for biofuel production
(through yield increases) is calculated.
To provide a range of potential yield increases, a
low, middle and high-yield development scenario
was formulated based on, for example, historic
yield trends in Romania, best counties in eastern
Romania and neighbouring regions, or projections
for the maximum attainable yield. Fig. 19 shows
the yield development of rapeseed in the different
regions as an example. Even a low-yield scenario
has a high effect on available land, whereby 11%
of the National Renewable Energy Action Plan
energy goal could be covered, even though it was
assumed that rapeseed is grown only every fourth
year as part of crop rotation. Similar projections
have been done for all major crops.
All model calculations demonstrated that
increasing yields has a huge potential to
reduce the land area needed for meeting the
baseline demand for food crops; hence there is a
considerable amount of land available for biofuel
production. Of course, the selected case studies
focused on the most promising regions, which are
expected to see large increases in production in
the near future. But regions with already high
yields also have the potential to increase yields
further, albeit with less dramatic changes.
Figure 19: Rapeseed yields in different East European regions
Mitigating iLUC through using underused land and land zoningThe second option evaluated to mitigate iLUC
was the use of underused land and land zoning. The approach is different from the
previous one because it is not about getting
higher yields from existing land. The target is to
find out if non-agricultural land is available and
suitable for biofuel production without touching
excluded land such as forests, wetlands, protected
areas, etc. The effect is showcased for northeast
Kalimantan in Southeast Asia. The approach
included the following steps:
20

1. Assessment of the type of land potentially
available (degraded, abandoned, marginal,
unused, etc)
2. Definition of the optimal plot size (what size
shows the best economy, 2, 5, 10 or more
hectares?)
3. Suitability for growing biofuel crops
4. Land zoning (carbon stocks, protected areas,
current use)
5. Assessment of yields on under-used land
In Kalimantan, degraded land has the highest
potential for biofuel production. Unfortunately,
the Renewable Energy Directive (RED) does not
properly define what degraded land means, hence
it is difficult to measure it in the field. Questions
like ‘Can we use degraded forest, Imperata
grasslands (Cogongrass) or deforested land not
in use?’ had to be answered rather arbitrarily. The
World Resources Institute (WRI) has developed
the Suitability Mapper in order to help identify
potentially suitable sites for sustainable palm oil
production. The tool was applied to assess under-
used land areas in this case study. The criteria
applied are given in Table 2.
Table 2: Criteria for suitability and availability in the Kalimantan case
Scenarios and settings
Low Medium High
Slope and elevation
Optimal growth conditions
Conditions where additional measures are needed
WRI default settings
Rainfall
Soil drainage
Land cover Existing agriculture may not be displaced
Peatland was excluded and, as a buffer of at
least 1000m, a conservation area was applied
in all scenarios. While a tool like the Suitability
Mapper can indicate potential areas for
development, it is important to verify if the area
is really available. The World Resource Institute
has verified the model result of a case study in
west Kalimantan; it found that only 40% of the
calculated area is available in reality. The same
percentage was applied for the case study in
NE Kalimantan. However, the actual proportion
needs to be determined by field checks. Assuming
40% availability, the production increase could
still be very high even in the low scenario;
currently 0.4m tonnes are produced in the region,
which could increase up to 3.4m tonnes on the
additional 0.85m hectares underused land even
in the low development scenario. The models
showed that in Kalimantan underused land has
the highest potential for additional palm oil
production compared to the other measures.
Table 3: Translation of developed free surface into biofuel potential
Hun
gary
(co
rn)
E. R
oman
ia
(rap
esee
d)
NE
Kal
iman
tan
(pal
m o
il/C
PO
)
Current production (Mt)
7.2 0.28 0.4
Additional iLUC free production by 2020: low–high (Mt)
2.5-7.3
0.2-1.9
2.4 – 8.1
MIRAGE projection 2020 for EU biofuel target (Mt)
0.9 0.15 0.18
Ratio iLUC free potential: MIRAGE projected production (low–high)
3–8 1 – 13
13–45
21

Analysis shows that additional biofuels can be
produced without displacing other uses and
functions. However, there is hard work ahead to
achieve the calculated result. Yield development
is a key measure in all case studies, with a focus
on all crops of the entire agricultural sector. It
is essential to increase knowledge and capacity-
building (e.g. seed quality, fertiliser use, and
machinery), and to improve availability and
access to high-yield seeds, planting material,
fertiliser and technology (incl. capital). Without
incentivising investments – e.g. with long-term
contracts or price guarantees – nothing will move
forward.
A pre-condition for increased integration of
unused land is to improve information on land
use, cover and soil (spatially and temporally
detailed), and to improve monitoring so as to
enable more informed decisions on land zoning.
The simple take-home message is: iLUC can be
prevented if an integrated perspective on land
use for food, feed, fibre and fuels is taken, and
productivity and resource efficiency is increased
in the whole production chain.
PASTURE INTENSIFICATION AND DOUBLE-CROPPING AS MECHANISMS TO MITIGATE ILUC
André Nassar, Director Agroicone
The calculations of iLUC factors are based on
two steps: step one is the estimation of iLUC per
surface unit, and step two is the translation of
iLUC into GHG emission. Some models integrate
both steps and others don’t.
The results of step one tend to overstate iLUC
because they are very conservative as regards
yield improvement. In addition, they use global
equilibrium models (general or partial), even
though there are some attempts to use allocation
procedures based on historical data. The models
have been strongly improved, but are still
incomplete.
For step 2, different models are available; some
are spatially explicit, and others not. Since global
models do not always consider the types of land
converted (only the amount of conversion on
forests and pastures), emissions models allocate
‘iLUC per ha’ over types of ‘non-productive’ land.
Independent of calculation models, there are
a number of primary measures (Table 4) that
can significantly mitigate iLUC (with a focus on
Brazil):
• Reducing deforestation over time through
policies, monitoring, command-and-control
sanctions, land-use planning, zoning (but out
of the scope of bioenergy systems)
• Increasing the yields of individual crops,
induced by technological improvement or
price-induced
• Making land more productive by reducing
yield gaps on crops, increasing productivity
in grass-fed cattle systems and integrated
systems: double-cropping and crop-livestock
• Developing crops suitable for marginal,
degraded or low-precipitation lands
The introduction of soy/corn double-cropping
brought essential advantages in Brazil. It
started with the development of short-cycle soy
varieties, allowing corn to be planted after soy;
100% no till is applied in areas where 90% of
the corn-planted area is rain-fed. The system is
very efficient in energy use and carbon footprint
reductions. Potassium and phosphorus use
was optimised with minimal nitrogen fertiliser
addition because soy does not require nitrogen.
Unfortunately, it requires herbicides for the
no-till cultivation. The system has saved around
9M ha in the last 10 years, with reduction of
the first crop area (around 3M ha) and increase
in the second crop (6M ha). Currently, each
additional 1ha of soy leads to a yield reduction
corresponding to 0.17ha in first-crop corn but
to a yield increase corresponding to 0.50ha in
second-crop corn. The improvements of ecological
factors are considerable (Fig. 20).
22

Table 4: Options for mitigating iLUC
Options Opportunities/weaknesses
Reducing deforestation • Very important but long term
• Requires government empowerment
• Much broader agenda than biofuels
• Models are shy in this issue
Increasing the yields of individual crops
• Can bring positive effects in the short term
• But rate of yields increase in crops is decreasing (contribution is low)
• GMO
• Model capture that effect
Reducing yields gaps on crops
• It can have huge effects
• Require capacity building
• Long term
• Models capture but tend to be conservative
Increasing productivity in grass-fed cattle systems
• It can have even larger effects given that 2/3 of agricultural land is used for grazing
• Models are conservative and pasture intensification is a consequence not a driving force (CETs and competition elasticities are not calibrated to achieve real pasture intensification
Integration systems: double-cropping and crop-livestock
• It is a reality but it is not captured by models.• Short term
Developing crops suitable for marginal, degraded or low precipitation lands
• Long term
• Probably will have lower effects than pasture intensification
The second most important factor is pasture
intensification. Roughly two-thirds of the world’s
agricultural area is occupied by pastures and
meadows. The repartition between natural
and planted/managed grassland is not known.
However, there is good data available on
Brazilian regions that can increase pasture
productivity.
Planted/managed pastures in Brazil cover
115M ha (of which 10M is considered degraded
land). In addition there is 60M ha of perennial
grassland used for cattle-raising. Productivity
is growing but is still below the potential.
Pasture intensification means that grass-fed
cattle fattening has the potential to produce
more meat per unit of land, without increasing
cattle herd, but reducing the pasture area. It
is a function of better-breed animals, managed
pasture, rotation grazing and some specialisation
(calf crop, yearling, finishing).
Nevertheless, the results achieved are
considerable. Livestock production (kg meat per
ha) remained constant while the need for pasture
dramatically dropped (Fig. 21).
23

20 30 40 50 60 70 80 90
100 110 120
Soybean Land Use Efficiency
Energy/tons Carbon Intensity/tons
Soybean-‐Corn (2004-‐2006=100) 2004-‐2006
2007-‐2009
2010-‐2012
Figure 20: Soy-corn system environmental indicators
179,000
180,000
181,000
182,000
183,000
184,000
185,000
-
10.00
20.00
30.00
40.00
50.00
60.00
2002 2003 2004 2005 2006 2007 2008 2009 2010 2011 2012Livestock yield Pasture Area
(kg meat / ha) (1000 ha)
Figure 21: Livestock yield improvement in Brazil
Based on this analysis, the message to
policymakers is simple and clear: Instead of
setting a cap, give industry more room for
making improvements towards zero iLUC
emissions.
24

Session 4: Global aspects of iLUC mitigation
MODELLED VS OBSERVED LAND-USE CHANGE – WHY THE DIFFERENCE?
Don O’Connor, (S&T)2 Consultants Inc.
A number of different economic models have
been used to estimate the indirect land-use
emissions from an expansion of biofuel feedstock
production. All of these models project an
increase in cropland and a decrease in forests
and pasture areas in the region that requires
the biofuel and in other parts of the world.
Many modellers have resisted any attempt to
reconcile the model results with the real-world
observations. While this resistance was perhaps
justified in the first few years of expanded biofuel
use, there is now a significant amount of data
available, and it doesn’t match the model results.
Before entering the details we need some
definitions:
• Cropland: Land that has been cleared for
growing crops, including land that may have
been fallow in the past five years – FAO calls
it arable land
• Harvested Area: Cropland that produced a
crop; in a double-crop system, the harvested
area is counted each time a crop is produced
in a year
• Harvest Frequency: Ratio of harvested area
to crop land
• Idle Land: Difference between Cropland
and Harvested Area
Why are models and reality different? Most
iLUC models have used a mixture of land types.
Harvested area is provided by the crop produced.
Most models assume that an increase in
harvested area requires an equivalent increase in
cropland. However, the available data on land-use
change shows that there has been no significant
change in the amount of cropland in those parts
of the developed world where there has been a
significant expansion in biofuel production and
use. The primary reason for the discrepancy
between the models and reality is that the models
have not properly accounted for cropland that is
not being fully used to produce at least one crop
per year. Many models have a full accounting
for cropland and for the harvested area, but do
not reconcile these two different quantifications.
The difference between the two land accountings
is generally idle land. It may be in fallow as
part of a traditional rotation, it may have been
temporarily converted to seeded pasture to
allow the soil to rebuild, or it may be part of a
setaside program. There are a few exceptions,
and the models have been slowly adding some
land categories that fall into the gap between
cropland and harvested area. The model GTAP
added a little bit of idle land in the US and,
no surprise, more land was available for other
uses like biofuels, and iLUC emissions dropped
significantly.
From 1961 to 2009 the harvested area in the
world increased by more than 30%, while the
cropland increased by about 12% only (Fig.
22). Of the increase in harvested area in the
last decade, 75% came from increased harvest
frequency. We are making better use of existing
land through increased double-cropping, reduced
summer fallow, and reduced cropland pasture
(cropland temporarily in pasture).
Since the models equate a change in harvested
area with an equal change in cropland, they
grossly overestimate the real-world impact. We
have to realise that the world land-use change
patterns are not homogenous.
Specific examples from Canada show that
cropland peaked in 1989 (Fig. 23). Since then
it has decreased by 9%, but the harvested area
in annual crops has increased by 6%. There
has been an increase in harvested area due to a
reduction in summer fallow and seeded pasture.
The result coincides with increased adoption of
no-till agriculture and the emergence of canola/
25

rapeseed as a major crop. This has led to a
large build in soil carbon. Double-cropping is
not a factor in Canada due to the short growing
season.
In the United States, cropland decreased in the
past decade despite a large increase in biofuel
production. In addition to changes in seeded
pasture and fallow area, there has been an
increase in double-cropping in the US. Due to
the high crop prices, there has been an economic
advantage to producing two crops on the same
land each year in those areas where the climate
supports double-cropping. Idle land has slightly
decreased.
Changes in diets, increased crop yields and
improved livestock feeding efficiency are
overwhelmingly offsetting population increases
and higher food consumption rates in the US.
Beef-meat consumption peaked in 1978, at over
90 pounds per person, but has declined since by
more than 30%. The net impact is a reduction in
the land required to supply livestock feed. During
the same period, poultry-meat consumption
increased by a factor of two, from 34 to over
70 pounds per person. Until 1978 the land for
livestock feed production remained unchanged
in spite of increased population, due to better
efficiency in livestock production and higher
yields. Since then, the land demand for feed
has decreased due to changing dietary patterns,
and the excess land has been used for biofuel
production.
In conclusion, most iLUC models overestimate
iLUC emissions because they don’t properly
account for cropland that is not fully used. All
regions of the world are making more productive
use of existing cropland, and in consequence, the
surface per person needed to produce enough
food and feed is decreasing (Fig. 24).
In the developed world there is no evidence
of an increase in cropland, but there has been
some increase in harvested area thanks to more
double-cropping, less summer fallow and less
crop pasture/seeded hay.
Figure 22: Global cropland change
Figure 23: Development of agricultural land in Canada (tame hay is the same as cropland pasture in the USA)
Figure 24: Impact of current trends in agricultural practice on land demand
26
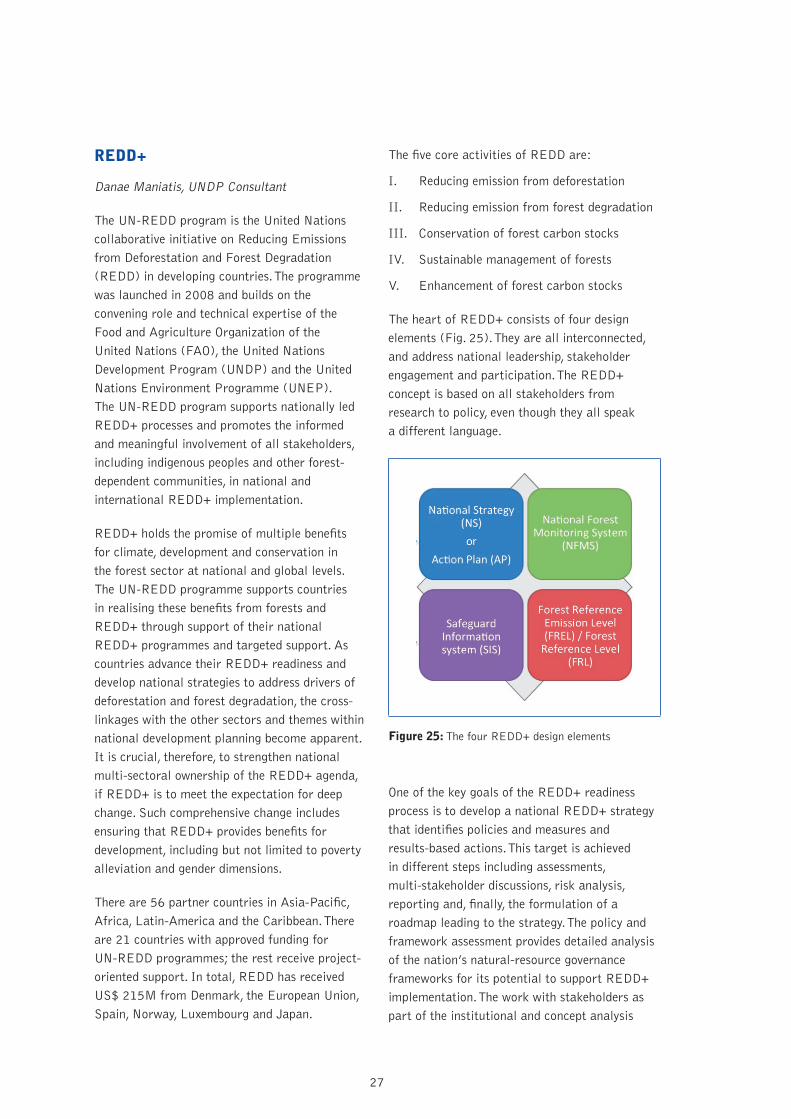
REDD+
Danae Maniatis, UNDP Consultant
The UN-REDD program is the United Nations
collaborative initiative on Reducing Emissions
from Deforestation and Forest Degradation
(REDD) in developing countries. The programme
was launched in 2008 and builds on the
convening role and technical expertise of the
Food and Agriculture Organization of the
United Nations (FAO), the United Nations
Development Program (UNDP) and the United
Nations Environment Programme (UNEP).
The UN-REDD program supports nationally led
REDD+ processes and promotes the informed
and meaningful involvement of all stakeholders,
including indigenous peoples and other forest-
dependent communities, in national and
international REDD+ implementation.
REDD+ holds the promise of multiple benefits
for climate, development and conservation in
the forest sector at national and global levels.
The UN-REDD programme supports countries
in realising these benefits from forests and
REDD+ through support of their national
REDD+ programmes and targeted support. As
countries advance their REDD+ readiness and
develop national strategies to address drivers of
deforestation and forest degradation, the cross-
linkages with the other sectors and themes within
national development planning become apparent.
It is crucial, therefore, to strengthen national
multi-sectoral ownership of the REDD+ agenda,
if REDD+ is to meet the expectation for deep
change. Such comprehensive change includes
ensuring that REDD+ provides benefits for
development, including but not limited to poverty
alleviation and gender dimensions.
There are 56 partner countries in Asia-Pacific,
Africa, Latin-America and the Caribbean. There
are 21 countries with approved funding for
UN-REDD programmes; the rest receive project-
oriented support. In total, REDD has received
US$ 215M from Denmark, the European Union,
Spain, Norway, Luxembourg and Japan.
The five core activities of REDD are:
I. Reducing emission from deforestation
II. Reducing emission from forest degradation
III. Conservation of forest carbon stocks
IV. Sustainable management of forests
V. Enhancement of forest carbon stocks
The heart of REDD+ consists of four design
elements (Fig. 25). They are all interconnected,
and address national leadership, stakeholder
engagement and participation. The REDD+
concept is based on all stakeholders from
research to policy, even though they all speak
a different language.
Figure 25: The four REDD+ design elements
One of the key goals of the REDD+ readiness
process is to develop a national REDD+ strategy
that identifies policies and measures and
results-based actions. This target is achieved
in different steps including assessments,
multi-stakeholder discussions, risk analysis,
reporting and, finally, the formulation of a
roadmap leading to the strategy. The policy and
framework assessment provides detailed analysis
of the nation’s natural-resource governance
frameworks for its potential to support REDD+
implementation. The work with stakeholders as
part of the institutional and concept analysis
27
helps to identify gaps, and to prioritise needs
and options consistent with the REDD+ Strategy
Roadmap. An important outcome of stakeholder
discussion is the identification of the direct
and indirect drivers of deforestation and forest
degradation. If indirect drivers in a country are
not understood, direct drivers are difficult to
understand also.
One of the most laborious and difficult steps
is the creation of national land-use and land-
cover standards. The basis is an overview on
unmanaged and managed land, distinguishing
between the six classes according to the
Intergovernmental Panel on Climate Change
(IPCC): forest land, cropland, grassland,
wetlands, settlements, and other land. An
inventory of forest, biodiversity, agriculture,
and socio-economic data benefits a wider range
of stakeholders than the forest sector alone.
After the land-use inventory has been established,
a reporting system of land-use change is to be
introduced and monitored. Capacity-building
is an important part to assure monitoring.
The road map to a national REDD strategy
could include:
• Description of the respective roles and
responsibilities of the leading institutions
and stakeholders (with a single institution
mandated to direct and supervise the overall
process)
• Identification of the main steps and
corresponding support documents of the
programming process (e.g. issue and option
paper, investment plan), with adequate regular
technical and/or validation processes
• Stakeholder engagement strategy
• Capacity-building plan
• Roadmap of analytical work – integrating
work planned under the % year action plan
• Preliminary vision of the positioning of the
strategy document in the wider national
planning framework (Climate Change,
Development, etc)
• Endorsement by the leading institutions and
stakeholders, with a common understanding
on the way towards the formulation of the
strategy
The formulation of a strategy entails a cross-
sectoral approach across all ministries (Fig. 26).
Only after a strategy has been elaborated and
politically accepted can the country ask for
financial support. To achieve that in a reasonable
amount of time (e.g. within a five-year plan),
countries need help. Some countries got great
support from Brazil, which was the first REDD+
partner to provide data that had been evaluated
and accepted.
It is quite a success for a country when the
reporting of land use can be established. It is an
even greater success when land-use change is
reported and monitored. Addressing iLUC is not
an immediate main priority for a country. Proper
land management together with capacity-building
is already half way to iLUC mitigation and
prevention.
28

Figure 26: REDD+ needs a cross-sectoral approach for success
PANEL DISCUSSION
Moderator: Tat Smith, University of Toronto
Participants: Andreas Pilzecker (European
Commission); Kees Kwant
(Netherlands Enterprise
Agency); Ricardo de Gusmão
Dornelles (Director, Department
of Renewable Fuels, Ministry
of Mines and Energy, Brazil);
Corinne Drennan, Pacific
Northwest National Lab, USA
Tat Smith began by asking the panellists to give
a short statement. He reminded the participants
that the goal of the discussion should be to
draft a clear message ‘in a nutshell’, as initially
requested by Marie Donnelly – and suggested
that they might formulate this as a more personal
question: What message are you bringing back to
your government?
Short statements by panellistsKees Kwant: In the Netherlands, pilot projects
were funded to show that iLUC can be mitigated.
The major message I take home is that we need
a holistic view on the whole biomass production,
and then iLUC can be prevented. But we will
need to prove now to our politicians that it
works. The Low Indirect Impact Biofuels (LIIB)
methodology might be a way to prove it.
However, to start with we need some political
support to allow the bio-economy to grow. The
goal can only be achieved with a market-driven
approach. Agriculture, therefore, has to play an
important role.
Corinne Drennan: It is rather implicit to most
of the iLUC models that certain feedstocks are
excluded. In light of our inability to adequately
measure iLUC on a global scale, we need robust
models. For example, if we want to prove that
iLUC can be prevented by implementing best
agricultural practices, we need improved models
that reflect today’s realities.
29

Ricardo Dornelles: Brazil was some time ago a
bad guy and has come a long way since. We have
reduced deforestation substantially with a variety
of measures such as stringent legislation and
collaboration with REDD+ and NGOs. But still
we have a lot of antagonists to the deployment
of bioenergy. Let’s continue to prove that it is a
success story, with improved agricultural practice
and optimised models, based on the facts we have
learned today; but above all let’s talk about the
success stories.
There is still lots of room to improve, e.g. in
policy. Brazil has a ministry for each and every
topic bioenergy has to deal with. It is important
that there is dialogue at the top level.
There are still too many bad examples of
agricultural practice. Let’s tackle them and
replace them with good practice, and thus
convince our adversaries that they are wrong.
Andreas Pilzecker: The EU is reducing the
pressure on first-generation biofuels for the
time being, but will take the topic up again after
2020. This leaves us some economic room to
develop optimised agricultural systems. There is
a clear role for agriculture in the development.
We have to address biomass as a whole instead
of approaching it from the tail, which is biofuel.
It is just too small and unimportant to have a
significant impact. Best agricultural practice is
key to success.
Models are very important to guide the way, but
the weaknesses they have mean that they restrain
application. Don O’Connor is working on a study
to bring more light into modelling.
Discussion with workshop participantsThe panellists’ statements were followed by an
open discussion with the workshop participants.
It was argued that, if the EU is not introducing a
strong target for transport fuel after 2020, there
might be no need for improved models anymore.
There was a clear statement from the audience
that advanced biofuels also involve an iLUC
risk. Politicians should be made aware that their
simple assumption of second-generation biofuels
being iLUC-free and therefore sustainable is
wrong. Hence, it cannot be taken for granted
that policies such as those of the EU will lead
automatically to iLUC-free fuels. However, it
was argued, the message should be formulated
more positively so as to convince politicians that
not all biofuels are bad, whether first or second-
generation. Legislation should not penalise all of
them. We have to prove that with good and easy-
to-understand examples.
The contributions showed that key to iLUC
prevention is sustainable intensification
(sustainsification) of productivity. But
intensification needs more fertiliser, and how
can we intensify productivity without doing
harm (e.g. through over-fertilisation)? And
what about biodiversity and intensification?
Application of natural fertilisers is mandatory
because of the environment, to close the cycle
and reduce the need for artificial fertilisers. This
also reduces energy consumption due to fertiliser
production. The contribution of Göran Berndes
(see ‘Integrating lingo-cellulosic crops into the
agricultural landscape’, above) showed that,
to ensure sustainable development, including
biodiversity and water, part of the land has to be
‘sacrificed’, as already requested under European
legislation. Ecological areas are an integral part
of best agricultural practice.
Improvement of yield is ultimately leading to
investments. If industry should invest then we
need a long-lasting policy. A clear vision for the
use of biomass has to be formulated, and it has to
be linked to the current situation. This will enable
roadmaps to be drawn up.
30

All stakeholders have to play with open cards
and be fully transparent. There is no secret
that, even in Brazil, there is still a long way to
go. For example, a 20% reduction in land use
for cattle production is excellent, but it is not
enough to avoid ongoing deforestation. One of the
main factors is that the cattle herd is not being
increased, but rather being intensified.
Mato Grasso state could lead the way. It has
developed a model to achieve zero deforestation
by 2020, which can be achieved by 65% cattle
fattening with average cattle yield and by 30%
fattening with low cattle yield. The problem
is how to get this concept across to the very
conservative cattle growers. Some municipalities
are achieving zero deforestation already in
collaboration with NGOs, meatpackers and
slaughterhouses.
ConclusionsAs a result of the workshop, it became clear
that the sustainability discussion cannot be left
to the modellers alone but has to include all
stakeholders. The participants reached general
agreement that any discussion of iLUC should
be based on a holistic approach, including
production of food, feed, fibre and fuel. If this
is accepted, it is evident that agriculture (and
forestry) has to play a central role.
Instead of simple legislative limitations on biofuel
production, room should be given to the whole
biomass production, allowing market-driven,
sustainable development. Models will continue to
play an important role in guiding and monitoring
the sustainable development, but they have to be
improved so as to reflect the real-world situation.
AcknowledgementsThe workshop sessions were facilitated by
Kees Kwant and Tat Smith. The contributions
of Kees, Tat, the invited speakers and the
panelists are gratefully acknowledged.
Arthur Wellinger, the Technical Coordinator,
prepared the draft text. Pearse Buckley, the
Secretary, facilitated the editorial process and
arranged the final design and production.
31
Further Information
IEA Bioenergy Website www.ieabioenergy.com
Contact us: www.ieabioenergy.com/contact-us/