Biochimica et Biophysica Acta - COnnecting REpositories · Regulation of heparanase by albumin and...
8
Regulation of heparanase by albumin and advanced glycation end products in proximal tubular cells Valentina Masola a , Giovanni Gambaro d, ⁎, Elena Tibaldi b , Maurizio Onisto a , Cataldo Abaterusso c , Antonio Lupo c a Department of Experimental Biomedical Sciences, University of Padova, Padova, Italy b Department of Biological Chemistry, University of Padova, Padova, Italy c Department of Medicine, Section of Nephrology, University of Verona, Italy d Division of Nephrology and Dialysis, Institute of Internal Medicine and Medical Specialties, Columbus-Gemelli University Hospital, Renal Program, Catholic University, Rome, Italy abstract article info Article history: Received 18 November 2010 Received in revised form 3 May 2011 Accepted 4 May 2011 Available online 12 May 2011 Keywords: Heparanase Albuminuria AGE PI3K/AKT Syndecan-1 Diabetic nephropathy Diabetic nephropathy is one of the main causes of end-stage renal disease, in which the development of tubular damage depends on factors such as high glucose levels, albuminuria and advanced glycation end- product. In this study, we analyzed the involvement of heparanase, a heparan sulfate glycosidase, in the homeostasis of proximal tubular epithelial cells in the diabetic milieu. In vitro studies were performed on a wild-type and stably heparanase-silenced adult tubular line (HK2) and HEK293. Gene and protein expression analyses were performed in the presence and absence of diabetic mediators. Albumin and advanced glycation end-product, but not high glucose levels, increased heparanase expression in adult tubular cells via the AKT/ PI3K signaling pathway. This over-expression of heparanase is then responsible for heparan sulfate reduction via its endoglycosidase activity and its capacity to regulate the heparan sulfate-proteoglycans core protein. In fact, heparanase regulates the gene expression of syndecan-1, the most abundant heparan sulfate- proteoglycans in tubular cells. We showed that heparanase is a target gene of the diabetic nephropathy mediators albumin and advanced glycation end-product, so it may be relevant to the progression of diabetic nephropathy. It could take part in several processes, e.g. extracellular-matrix remodeling and cell–cell crosstalk, via its heparan sulfate endoglycosidase activity and capacity to regulate the expression of the heparan sulfate-proteoglycan syndecan-1. © 2011 Elsevier B.V. All rights reserved. 1. Introduction End-stage renal disease (ESRD) is increasing in western countries and diabetic nephropathy (DN) is one of the most frequent causes [1]. The pathophysiological changes in DN include glomerular hyperfil- tration, abnormal permeability of the glomerular sieve to albumin, and cellular and extracellular changes in the glomerulus and tubulo- interstititium, which lead to a worsening renal function and ultimately to ESRD [2]. As in most chronic renal diseases, even if the primary damage is restricted to the glomerulus, the renal tubule and interstitium become more and more involved as the disease pro- gresses. It is now recognized that the stage of disease and its prognosis correlate better with the severity of tubulo-interstitial damage than with glomerular sclerosis [3,4]. In diabetes, tubular injury in the kidney is due to several factors, particularly high glucose levels, albuminuria, and the presence of advanced glycation end-product (AGE)-modified proteins. Exposure of the proximal tubular epithelial cells (PTECs) to high albumin concentrations and AGE-modified proteins leads to the activation of multiple signaling cascades, with an ensuing abnormal regulation of several growth factors and cytokines, and an abnormal synthesis and degradation of extracellular matrix (ECM) proteins, giving rise to a pro-fibrotic environment distinctive of the failing kidney [5–7]. Recent findings suggest an involvement of glomerular heparanase-1 (HPSE) in the pathogenesis of proteinuric disorders, including DN [8]. HPSE is a heparan sulfate (HS)-specific endo-β-D-glucuronidase that catalyzes the hydrolytic cleavage of the β(1,4)-glycosidic bond between glucuronic acid and glucosamine residue. HPSE participates in ECM remodeling and degradation, regulating the release of many HS-bonded molecules, such as growth factors, chemokines, cytokines, and enzymes involved in inflammation, wound healing and tumor invasion. Hepar- anase is expressed in numerous cell types and tissues, and it is abundantly expressed by several different tumor cells. Its expression Biochimica et Biophysica Acta 1813 (2011) 1475–1482 ⁎ Corresponding author at: Division of Nephrology and Dialysis, Columbus-Gemelli University Hospital, Renal Program, Catholic University, Via Moscati 31, 00168 Rome, Italy. Tel.: +39 06 3503434; fax: +39 06 3054434. E-mail addresses: [email protected] (V. Masola), [email protected] (G. Gambaro), [email protected] (E. Tibaldi), [email protected] (M. Onisto), [email protected] (C. Abaterusso), [email protected] (A. Lupo). 0167-4889/$ – see front matter © 2011 Elsevier B.V. All rights reserved. doi:10.1016/j.bbamcr.2011.05.004 Contents lists available at ScienceDirect Biochimica et Biophysica Acta journal homepage: www.elsevier.com/locate/bbamcr
Transcript of Biochimica et Biophysica Acta - COnnecting REpositories · Regulation of heparanase by albumin and...

Biochimica et Biophysica Acta 1813 (2011) 1475–1482
Contents lists available at ScienceDirect
Biochimica et Biophysica Acta
j ourna l homepage: www.e lsev ie r.com/ locate /bbamcr
Regulation of heparanase by albumin and advanced glycation end products inproximal tubular cells
Valentina Masola a, Giovanni Gambaro d,⁎, Elena Tibaldi b, Maurizio Onisto a,Cataldo Abaterusso c, Antonio Lupo c
a Department of Experimental Biomedical Sciences, University of Padova, Padova, Italyb Department of Biological Chemistry, University of Padova, Padova, Italyc Department of Medicine, Section of Nephrology, University of Verona, Italyd Division of Nephrology and Dialysis, Institute of Internal Medicine and Medical Specialties, Columbus-Gemelli University Hospital, Renal Program, Catholic University, Rome, Italy
⁎ Corresponding author at: Division of Nephrology aUniversity Hospital, Renal Program, Catholic UniversityItaly. Tel.: +39 06 3503434; fax: +39 06 3054434.
E-mail addresses: [email protected] (V. [email protected] (G. Gambaro), [email protected] (M. Onisto), [email protected] (A. Lupo).
0167-4889/$ – see front matter © 2011 Elsevier B.V. Aldoi:10.1016/j.bbamcr.2011.05.004
a b s t r a c t
a r t i c l e i n f oArticle history:Received 18 November 2010Received in revised form 3 May 2011Accepted 4 May 2011Available online 12 May 2011
Keywords:HeparanaseAlbuminuriaAGEPI3K/AKTSyndecan-1Diabetic nephropathy
Diabetic nephropathy is one of the main causes of end-stage renal disease, in which the development oftubular damage depends on factors such as high glucose levels, albuminuria and advanced glycation end-product. In this study, we analyzed the involvement of heparanase, a heparan sulfate glycosidase, in thehomeostasis of proximal tubular epithelial cells in the diabetic milieu. In vitro studies were performed on awild-type and stably heparanase-silenced adult tubular line (HK2) and HEK293. Gene and protein expressionanalyses were performed in the presence and absence of diabetic mediators. Albumin and advanced glycationend-product, but not high glucose levels, increased heparanase expression in adult tubular cells via the AKT/PI3K signaling pathway. This over-expression of heparanase is then responsible for heparan sulfate reductionvia its endoglycosidase activity and its capacity to regulate the heparan sulfate-proteoglycans core protein. Infact, heparanase regulates the gene expression of syndecan-1, the most abundant heparan sulfate-proteoglycans in tubular cells. We showed that heparanase is a target gene of the diabetic nephropathymediators albumin and advanced glycation end-product, so it may be relevant to the progression of diabeticnephropathy. It could take part in several processes, e.g. extracellular-matrix remodeling and cell–cellcrosstalk, via its heparan sulfate endoglycosidase activity and capacity to regulate the expression of theheparan sulfate-proteoglycan syndecan-1.
nd Dialysis, Columbus-Gemelli, Via Moscati 31, 00168 Rome,
ola),[email protected] (E. Tibaldi),[email protected] (C. Abaterusso),
l rights reserved.
© 2011 Elsevier B.V. All rights reserved.
1. Introduction
End-stage renal disease (ESRD) is increasing in western countriesand diabetic nephropathy (DN) is one of the most frequent causes [1].The pathophysiological changes in DN include glomerular hyperfil-tration, abnormal permeability of the glomerular sieve to albumin,and cellular and extracellular changes in the glomerulus and tubulo-interstititium, which lead to a worsening renal function andultimately to ESRD [2]. As in most chronic renal diseases, even if theprimary damage is restricted to the glomerulus, the renal tubule andinterstitium become more and more involved as the disease pro-gresses. It is now recognized that the stage of disease and its prognosis
correlate better with the severity of tubulo-interstitial damage thanwith glomerular sclerosis [3,4].
In diabetes, tubular injury in the kidney is due to several factors,particularly high glucose levels, albuminuria, and the presence ofadvanced glycation end-product (AGE)-modified proteins. Exposureof the proximal tubular epithelial cells (PTECs) to high albuminconcentrations and AGE-modified proteins leads to the activation ofmultiple signaling cascades, with an ensuing abnormal regulation ofseveral growth factors and cytokines, and an abnormal synthesis anddegradation of extracellular matrix (ECM) proteins, giving rise to apro-fibrotic environment distinctive of the failing kidney [5–7].
Recent findings suggest an involvement of glomerular heparanase-1(HPSE) in the pathogenesis of proteinuric disorders, including DN [8].HPSE is a heparan sulfate (HS)-specific endo-β-D-glucuronidase thatcatalyzes the hydrolytic cleavage of theβ(1,4)-glycosidic bond betweenglucuronic acid and glucosamine residue. HPSE participates in ECMremodeling and degradation, regulating the release ofmanyHS-bondedmolecules, such as growth factors, chemokines, cytokines, and enzymesinvolved in inflammation, wound healing and tumor invasion. Hepar-anase is expressed in numerous cell types and tissues, and it isabundantly expressed by several different tumor cells. Its expression

1476 V. Masola et al. / Biochimica et Biophysica Acta 1813 (2011) 1475–1482
and regulation is cell-type specific [9,10]. It is also emerging that HPSEmay have non-enzymatic activities, playing a part in different signalingcascades, selected protein kinase activation, and gene transcription [11].
While HPSE has been investigatedmainly in the glomeruli, when itcomes to the renal tubule we only know that its tubular expression isfound increased in biopsies from patients with DN and this correlateswith a decline in HS tubular staining [12]. Given the crucial role oftubular cells in the progression of DN, we thoroughly investigated theeffect of the diabetic milieu on HPSE regulation in the tubular cell, andits consequences downstream. In particular, we analyzed: the effect ofhigh glucose, albumin and glycated albumin levels on the expression,synthesis and activity of HPSE; the signaling pathways involved; theeffect of an altered HPSE expression on HS and the abovemechanisms; and the interaction between HPSE, HS and syndecan-1(SDC1), which is the most abundant HSPG in the proximal tubule.
2. Methods
2.1. Cell cultures
HK2 (humankidney 2) is an immortalizedproximal tubule epithelialcell line whereas HEK293 is a human embryonic tubular cell line. HK2cells were grown in DMEM-F15 (EuroClone, Pavia, Italy) (17.5 mMglucose) and HEK293 cells in MEM (EuroClone), supplementedwith 10% fetal bovine serum (Biochrom AG, Berlin, Germany), 2 mML-glutamine, penicillin (100 U/ml) and streptomycin (100 μg/ml), andmaintained at 37 °C in a 5% CO2 water-saturated atmosphere.
2.2. Reagents
Bovine serum albumin (BSA, Sigma, Milano Italy), D-(+)-glucoseand D-(+)-mannitol (Sigma), NF-kB inhibitor ammonium pyrrolidinedithiocarbamate (PDTC, Sigma), PI3 kinase inhibitor LY294002, p38kinase inhibitor SB203580, Jak2 inhibitor AG490, MEK1 and MEK2inhibitors PD98059 and U0126 (Calbiochem, San Diego, USA) were allpurchased commercially. Sulodexide was a kind gift from AlfaWassermann, Bologna, Italy.
2.3. Preparation of albumin-derived AGE
BSA-derived AGE was prepared by incubating 0.5 M glucose with20 mg/ml BSA and 0.05 mg/ml NaN3 in 0.4 M phosphate buffer (pH 7.5)for 15 days at 56 °C under sterile conditions. After incubation, unboundglucose was removed by dialysis against phosphate buffer. AGE proteinconcentration was evaluated using the Bio-Rad Protein Assay (Bio-Rad,Milan, Italy). Themixture turned into a stable viscous brownproduct thatyielded fluorescence of 440 nm following excitation at 370 nm. Thecontrol BSA sample (non-glycated BSA) was incubated under identicalconditions, butwithout any glucose. AGE and control (non-glycated BSA)werefilter sterilized, aliquotedandstoredat−20 °Cuntil theywereused.
2.4. Transfection of HPSE shRNA plasmid
To obtain stably HPSE silenced cell lines, we used four differentshRNAs targeting human heparanase (NM_006665), purchased fromOriGene (Rockville, MD, USA). We performed a transfection reaction foreach plasmid, plus a reaction in which all four plasmids have beentransfected together. As a negative control, we used an shRNA pRS non-effective GFP plasmid (TR30003) and an empty vector, shRNA pRSplasmid (TR20003). The shRNAswere reconstitutedwith 50 μl of RNAse-free water (Gibco, Invitrogen, Milano, Italy) to prepare a 100 ng/μl stocksolution. HK2 cells were seeded in 6-well plates at a density of 1.5×10⁵
cells perwell. After 24 h, the cells had reached 70–80% of confluence. Themediumwas removed and replacedwith twomilliliters per well of freshcomplete growthmedium. Amixture preparedwith 188 μl of serum freemedium and 12 μl of TransIT-LT1 transfection reagent (Mirus, Madison,
WI) was vortexed and incubated at room temperature for 20 min. Threemicrogramsof plasmidsDNAwere added to themixture,whichwas thenincubated at room temperature for another 20 min before adding itdropwise to the cells. Control cellswere treatedwith the same amount ofTransIT-LT1 transfection reagent (Mock). Forty-eight hours after trans-fection, the cells underwent severalweeks of selectionwith 0.75 μg/ml ofpuromycin (Sigma).
2.5. Transfection of AKT1/2 siRNA
To silence AKT1 and AKT2 we use AKT1/2 siRNA (sc43609, SantaCruz Biotechnology Heidelberg, Germany) as well as a control si-RNA.The siRNAs were reconstituted with 330 μl of RNAse-free water toprepare a 100 μM solution. HK2 wt cells were plated in 6-well platesat a density of 1.5×10⁵ cells per well in 2 ml complete growthmedium. After 24 h, we prepared a mixture with 188 μl of serum-freemedium and 12 μl of TransIT-LT1 transfection reagent (Mirus). Thesolution was vortexed and incubated at room temperature for 20 min,then we added 6.6 μl of siRNAs and the mixture was then incubated atroom temperature for another 20 min before adding it dropwise tothe cells. After 24 h the medium was replaced with fresh completegrowth medium. Cells were incubated for an additional 24 h and thenstarved, treated with BSA and AGE and assayed for HPSE geneexpression and AKT protein expression described as follows.
2.6. mRNA expression analysis
The cells were grown to sub-confluence, starved for 24 h in serum-free medium, and then cultured in serum-free medium with thedifferent treatments for another 6 h.
The cells were exposed to normal glucose (17.5 mM), a highmannitol as an osmolarity control (25 mM), high glucose levels(25 mM), and BSA or AGE (30 or 60 μg/ml), with or without theinhibitors: LY294002 (25 μM), SB203580 (20 μM), PD98059 (25 μM),U0126 (10 μM), AG490 (25 μM) and PDTC (10 μM). All theseinhibitors were added 30 min before the BSA and AGE treatments,except for LY294002 (which was added 2 h beforehand).
Total RNAwas extracted from cell monolayers using the “GenEluteMammalian Total RNA Miniprep” Kit (Sigma), including DNAsetreatment (DNASE70, Sigma), according to the manufacturer's in-structions. Yield and purity were checked using Nanodrop (Euro-Clone) and 1 μg of total RNA from each sample was reversetranscribed into cDNA using 500 ng random primers and 200 USuperScript II Reverse Transcriptase (Invitrogen).
Then we performed a quantitative real-time PCR to measure HPSE,SDC1 or GAPDH expression. The assays were performed on 96multi-wellPCR plates in the Applied Biosystems 7500 real-time PCR system, in afinal volume of 12.5 μl containing 10 ng of cDNA, 6.25 μl of Power SYBRGreen Master Mix 2× (Applied Biosystems, Carlsbad, USA), 5 μmol offorward or reverse primers (HPSE: d—ATTTGAATGGACGGACTGC r—GTTTCTCCTAACCAGACCTTC; SDC1: d—GAAGATCAAGATGGCTCTGGG r—GTTCTGGAGACGTGGGAATAG; GAPDH: d—ACACCCACTCCTCCACCTTTr—TCCACCACCCTGTTGCTGTA), and water q.s. The reaction underwentdenaturation at 95 °C for 10 min, followed by 40 cycles of denaturationat 95 °C for 30 s, annealing and elongation at 60 °C for 1 min.
mRNAexpression levelswereevaluatedby relative quantitative real-time PCR and normalized toGAPDH. The comparative Ctmethod (ΔΔCt)was used to quantify gene expression and the relative quantification(RQ)was calculated as 2−ΔΔCt.We performedmelting curves analysis toavoid any interference of aspecific amplification products.
2.7. Western blot
To analyzeHPSE andGAPDHprotein expression, cellswere grown tosubconfluence for 24 h in serum-free medium, then washed with PBS,lysed and scraped in lysis buffer (50 mM Tris–HCl [pH 5.0], 150 mM
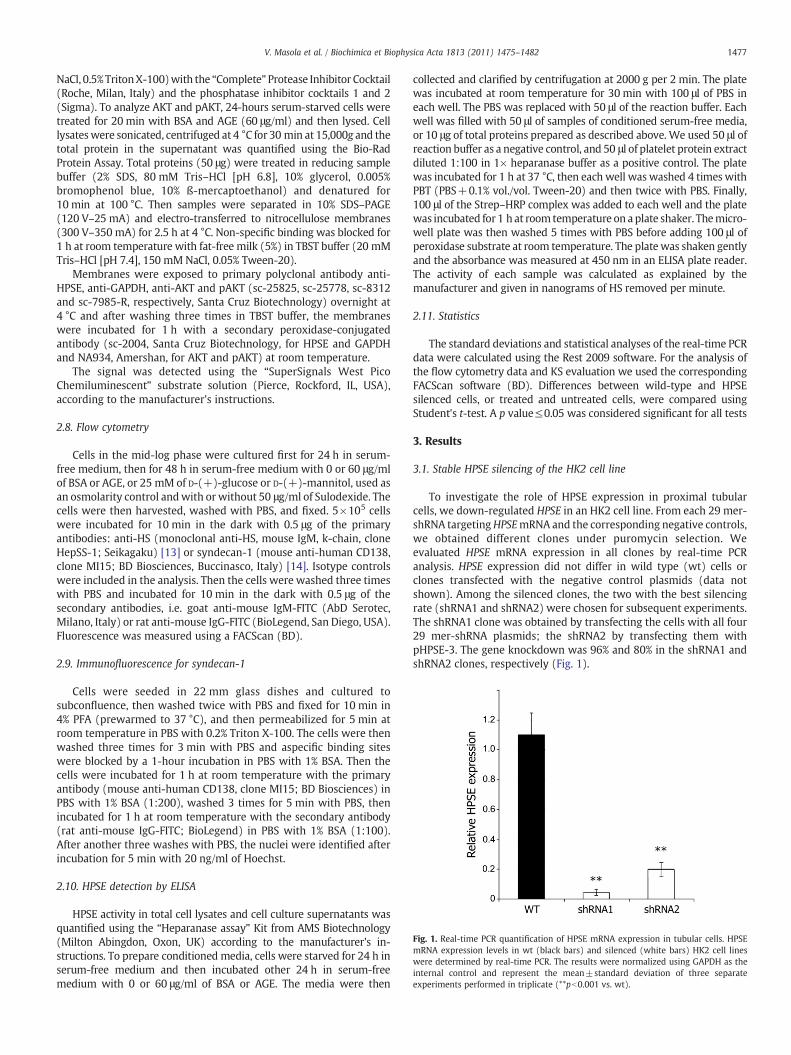
Fig. 1. Real-time PCR quantification of HPSE mRNA expression in tubular cells. HPSEmRNA expression levels in wt (black bars) and silenced (white bars) HK2 cell lineswere determined by real-time PCR. The results were normalized using GAPDH as theinternal control and represent the mean±standard deviation of three separateexperiments performed in triplicate (**pb0.001 vs. wt).
1477V. Masola et al. / Biochimica et Biophysica Acta 1813 (2011) 1475–1482
NaCl, 0.5%TritonX-100)with the “Complete”Protease Inhibitor Cocktail(Roche, Milan, Italy) and the phosphatase inhibitor cocktails 1 and 2(Sigma). To analyze AKT and pAKT, 24-hours serum-starved cells weretreated for 20 min with BSA and AGE (60 μg/ml) and then lysed. Celllysateswere sonicated, centrifuged at 4 °C for 30 min at 15,000g and thetotal protein in the supernatant was quantified using the Bio-RadProtein Assay. Total proteins (50 μg) were treated in reducing samplebuffer (2% SDS, 80 mM Tris–HCl [pH 6.8], 10% glycerol, 0.005%bromophenol blue, 10% ß-mercaptoethanol) and denatured for10 min at 100 °C. Then samples were separated in 10% SDS–PAGE(120 V–25 mA) and electro-transferred to nitrocellulose membranes(300 V–350 mA) for 2.5 h at 4 °C. Non-specific binding was blocked for1 h at room temperature with fat-free milk (5%) in TBST buffer (20 mMTris–HCl [pH 7.4], 150 mM NaCl, 0.05% Tween-20).
Membranes were exposed to primary polyclonal antibody anti-HPSE, anti-GAPDH, anti-AKT and pAKT (sc-25825, sc-25778, sc-8312and sc-7985-R, respectively, Santa Cruz Biotechnology) overnight at4 °C and after washing three times in TBST buffer, the membraneswere incubated for 1 h with a secondary peroxidase-conjugatedantibody (sc-2004, Santa Cruz Biotechnology, for HPSE and GAPDHand NA934, Amershan, for AKT and pAKT) at room temperature.
The signal was detected using the “SuperSignals West PicoChemiluminescent” substrate solution (Pierce, Rockford, IL, USA),according to the manufacturer's instructions.
2.8. Flow cytometry
Cells in the mid-log phase were cultured first for 24 h in serum-free medium, then for 48 h in serum-free medium with 0 or 60 μg/mlof BSA or AGE, or 25 mM of D-(+)-glucose or D-(+)-mannitol, used asan osmolarity control andwith or without 50 μg/ml of Sulodexide. Thecells were then harvested, washed with PBS, and fixed. 5×10⁵ cellswere incubated for 10 min in the dark with 0.5 μg of the primaryantibodies: anti-HS (monoclonal anti-HS, mouse IgM, k-chain, cloneHepSS-1; Seikagaku) [13] or syndecan-1 (mouse anti-human CD138,clone MI15; BD Biosciences, Buccinasco, Italy) [14]. Isotype controlswere included in the analysis. Then the cells were washed three timeswith PBS and incubated for 10 min in the dark with 0.5 μg of thesecondary antibodies, i.e. goat anti-mouse IgM-FITC (AbD Serotec,Milano, Italy) or rat anti-mouse IgG-FITC (BioLegend, San Diego, USA).Fluorescence was measured using a FACScan (BD).
2.9. Immunofluorescence for syndecan-1
Cells were seeded in 22 mm glass dishes and cultured tosubconfluence, then washed twice with PBS and fixed for 10 min in4% PFA (prewarmed to 37 °C), and then permeabilized for 5 min atroom temperature in PBS with 0.2% Triton X-100. The cells were thenwashed three times for 3 min with PBS and aspecific binding siteswere blocked by a 1-hour incubation in PBS with 1% BSA. Then thecells were incubated for 1 h at room temperature with the primaryantibody (mouse anti-human CD138, clone MI15; BD Biosciences) inPBS with 1% BSA (1:200), washed 3 times for 5 min with PBS, thenincubated for 1 h at room temperature with the secondary antibody(rat anti-mouse IgG-FITC; BioLegend) in PBS with 1% BSA (1:100).After another three washes with PBS, the nuclei were identified afterincubation for 5 min with 20 ng/ml of Hoechst.
2.10. HPSE detection by ELISA
HPSE activity in total cell lysates and cell culture supernatants wasquantified using the “Heparanase assay” Kit from AMS Biotechnology(Milton Abingdon, Oxon, UK) according to the manufacturer's in-structions. To prepare conditioned media, cells were starved for 24 h inserum-free medium and then incubated other 24 h in serum-freemedium with 0 or 60 μg/ml of BSA or AGE. The media were then
collected and clarified by centrifugation at 2000 g per 2 min. The platewas incubated at room temperature for 30 min with 100 μl of PBS ineach well. The PBS was replaced with 50 μl of the reaction buffer. Eachwell was filled with 50 μl of samples of conditioned serum-free media,or 10 μg of total proteins prepared as described above. We used 50 μl ofreaction buffer as a negative control, and 50 μl of platelet protein extractdiluted 1:100 in 1× heparanase buffer as a positive control. The platewas incubated for 1 h at 37 °C, then each well was washed 4 times withPBT (PBS+0.1% vol./vol. Tween-20) and then twice with PBS. Finally,100 μl of the Strep–HRP complex was added to each well and the platewas incubated for 1 h at room temperature on a plate shaker. Themicro-well plate was then washed 5 times with PBS before adding 100 μl ofperoxidase substrate at room temperature. The platewas shaken gentlyand the absorbance was measured at 450 nm in an ELISA plate reader.The activity of each sample was calculated as explained by themanufacturer and given in nanograms of HS removed per minute.
2.11. Statistics
The standard deviations and statistical analyses of the real-time PCRdata were calculated using the Rest 2009 software. For the analysis ofthe flow cytometry data and KS evaluation we used the correspondingFACScan software (BD). Differences between wild-type and HPSEsilenced cells, or treated and untreated cells, were compared usingStudent's t-test. A p value≤0.05 was considered significant for all tests
3. Results
3.1. Stable HPSE silencing of the HK2 cell line
To investigate the role of HPSE expression in proximal tubularcells, we down-regulated HPSE in an HK2 cell line. From each 29 mer-shRNA targetingHPSEmRNA and the corresponding negative controls,we obtained different clones under puromycin selection. Weevaluated HPSE mRNA expression in all clones by real-time PCRanalysis. HPSE expression did not differ in wild type (wt) cells orclones transfected with the negative control plasmids (data notshown). Among the silenced clones, the two with the best silencingrate (shRNA1 and shRNA2) were chosen for subsequent experiments.The shRNA1 clone was obtained by transfecting the cells with all four29 mer-shRNA plasmids; the shRNA2 by transfecting them withpHPSE-3. The gene knockdown was 96% and 80% in the shRNA1 andshRNA2 clones, respectively (Fig. 1).

Fig. 2. Detection of HPSE protein. Western blot analysis was used to demonstrate HPSEprotein reduction between wt (black bars) and silenced (white bars) HK2 cell lines.GAPDH was included as the loading control. Bottom: quantitative analysis of threeseparate experiments (**pb0.01 vs. wt).
1478 V. Masola et al. / Biochimica et Biophysica Acta 1813 (2011) 1475–1482
This paralleled the HPSE protein synthesis. In fact, the quantitativeanalysis of the bands obtained by Western blotting and GAPDH-normalized in total cell lysates revealed a 42% and 55% reduction inclones shRNA1 and shRNA2, respectively (Fig. 2).
Since HPSE undergoes a complex and strictly regulated post-transcriptional processing, we also evaluated HPSE activity in wt andsilenced HK2 cell clones. We used an ELISA assay to test total celllysates and conditioned media from wt and shRNA1 HK2 cell lines,finding a significant reduction in HPSE activity, in total cell lysates andconditioned media, respectively (Fig. 3).
Fig. 3. Detection of HPSE activity. Heparanase activity in protein extracts (A) and serum-free conditionedmedium (B) obtained fromHPSE-silenced-HK2, HK2wt and HEK293 celllines. Cellswere treatedwith 60 μg/ml of BSA or AGE (hatchedbars) in serum freemedium(black bars). Enzymatic activity is expressed as nanograms of heparan sulfate (HS)removed perminute. The results represent themean±standard deviation of two separateexperiments performed in triplicate. Platelet extract was used as a positive control (whitebar) (*pb0.05, **pb0.001 vs. HK2 wt control; #pb0.05, ##pb0.001 vs. HEK293 control).
3.2. HPSE expression in PTECs is regulated by BSA and AGE, but not byhigh glucose levels
We performed a relative quantitative real-time PCR analysis onHK2 and HEK293 cell lines to evaluate HPSE expression levels inresponse to different “diabetic stimuli,” such as high glucose levels,albumin overload and glycated albumin.
Fig. 4. HPSE regulation in tubular cells. HPSE mRNA expression levels in control (blackbars) and treated (white and hatched bars) HK2 wt (A), HEK293 (B) and silenced HK2(C) cell lines were determined by real-time PCR. Cells were cultured for 6 h undernormal glucose concentrations (NG: 17.5 mM glucose), with highmannitol levels as theosmolarity control (OC: 25 mM mannitol), with high glucose levels (HG: 25 mMglucose), and with BSA or AGE (30 or 60 μg/ml). The results were normalized usingGAPDH as the internal control and represent the mean±standard deviation of threeseparate experiments performed in triplicate (*pb0.05, **pb0.001 vs. control).

1479V. Masola et al. / Biochimica et Biophysica Acta 1813 (2011) 1475–1482
High glucose levels (and the osmolarity condition used as a control)did not affect HPSE gene expression, whereas treatment with BSA—andevenmore with glycated albumin—triggered a dose-dependent increaseinHPSE expression. Inparticular, 30 and60 μg/mlof BSA induced1.7- and2.8-fold increases, respectively, while 30 and 60 μg/ml of AGE induced a3.6- and 4.1-fold increase, respectively, in HK2wt cells (Fig. 4A). BSA andAGE, likewise, induced a significant increase of HPSE expression inHEK293 cells, respectively, of 1.68 and 2.81 times (Fig. 4B).
The same experiment was conducted in HPSE silenced clones. Highglucose levels (and the osmolarity condition used as a control) did notaffectHPSEgeneexpression, not even in theHPSEsilenced clones.Unlikethe situation inwt HK2 cells, however, BSA and AGE failed to induce anysignificant variation in HPSE expression in HPSE silenced cells (Fig. 4C).
Likewise, the gene expression profile BSA and AGE also modifiedHPSE activity both at the intracellular and extracellular level. As amatterof fact BSA, and mostly AGE, produced an increase of HPSE activity inHK2 wt and HEK293 protein extract and conditioned media,whereasthey had no effects on HPSE-silenced HK2 cells (Fig. 3A and B).
3.3. BSA and glycated albumin regulate HPSE expression via thePI3K/AKT pathway
To investigate the signaling pathways involved in modulating HPSEsynthesis by BSA and glycated albumin, we incubated cells with the
Fig. 5. Signaling pathways analysis involved in HPSE up-regulation. A) HPSE gene expression(hatched bars). mRNA levels were determined by real-time PCR. The wt HK2 cells were prei(25 μM), U0126 (10 μM), AG490 (25 μM) and PDTC (10 μM), then cultured with 60 μg/mlcontrol and represent themean±standard deviation of three separate experiments performeB)Western blot analysis was used to quantify total AKT and pAKT protein in wt and AKT1/2-sanalysis of two separate experiments. C) HPSE gene expression in wt and AKT-silenced HK(hatched bars). Results were normalized using GAPDH as an internal control and represent thwt cells treated with BSA or ##pb0.001 vs. wt cells treated with glycated albumin).
following different kinase inhibitors: the NF-kB inhibitor PDTC (10 μM),the PI3 kinase inhibitor LY294002 (25 μM), the p38 kinase inhibitorSB203580 (20 μM), the Jak2 inhibitor AG490 (25 μM), the MEK1inhibitor PD98059 (25 μM) and the MEK1-2 inhibitor U0126 (10 μM).Our results showed thatonly the LY294002(thePI3K inhibitor)wasableto fully inhibit the increase in HPSE levels in wt HK2 cells treated withBSA or glycated albumin. We also observed that PDTC (the NF-kBpathway inhibitor), AG490 (the Jak2pathway inhibitor) andU0126 (theMEK1-2/ERK pathway inhibitor) upregulated heparanase expression incontrol wt HK2 cells (not incubated with BSA or glycated albumin)(Fig. 5A). To elucidate the role of PI3K/AKT pathway in HPSE regulationwe silenced AKT. We silenced the two isoforms AKT1 and AKT2obtaining a significant decrease of AKT total protein. The stimulationwith albumin and especially with AGE produced a consistent activationof AKT in wt cells whereas in AKT1/2-silenced HK2 cells these factorsinduced aweaker phosphorylation of this kinase (Fig. 5B). The silencingof AKT, like the PI3K inhibitor, prevents HPSE gene expression up-regulation in response to BSA and AGE (Fig. 5C).
3.4. Cell-surface HS degradation by HPSE in PTECs
To investigate the effect of different levels of HPSE expressionon cell-surface HS expression, we examined cell-surface HS in wtvs. HPSE silenced HK2 cell lines by flow cytometry. We used a
in control (black bars) wt HK2 cell line and those treated with BSA or glycated albuminncubated with different inhibitors, i.e. LY294002 (25 μM), SB203580 (20 μM), PD98059BSA or glycated albumin for 6 h. Results were normalized using GAPDH as an internald in triplicate (**pb0.001 vs. cells treated with BSA or ##pb0.001 vs. glycated albumin).ilenced HK2 cell lines. GAPDHwas included as the loading control. Bottom: quantitative2 cells, control (black bars) and treated with 60 μg/ml BSA or glycated albumin for 6 he mean±standard deviation of two experiments performed in triplicate (**pb0.001 vs.

1480 V. Masola et al. / Biochimica et Biophysica Acta 1813 (2011) 1475–1482
monoclonal anti-HS antibody that specifically recognizes an epitopeclosely related to 0-sulfated and N-acetylated glucosamine (cloneHepSS-1). Cell-surface HS was significantly higher in the shRNA1 andshRHA2 clones respect to HK2 wt cells. To see how the different“diabetic stimuli” affect HS expression, we treated wt and silencedcells for 24 h with high mannitol levels as an osmolarity control(25 mM), high glucose levels (25 mM), or BSA or AGE (60 μg/ml).While high glucose levels and the osmolarity control had no effect onHS in any of the cell lines investigated (data not shown), BSA andparticularly AGE prompted a significant reduction in HS in wt HK2cells, but not in HPSE silenced clones (Fig. 6A). To assess thecontribution of HPSE-endoglycosidasic activity to HS degradationwe also incubated HK2wt cells with orwithout Sulodexide (50 μg/ml)as HPSE-inhibitor [15]. The treatment with Sulodexide had no effectson control cells while it partially increased HS staining in BSA- andAGE-treated cells, though it failed to restore this to levels comparablewith those in untreated wt cells (Fig. 6B).
3.5. Syndecan-1 regulation by HPSE in PTECs
To investigate whether cell-surface HS reduction depends on HPSEcleavage of the carbohydrate chains alone, or whether HPSE alsoregulates the core protein synthesis of HSPGs, we analyzed syndecan-1,the most abundant cell membrane HSPG in PTECs.
To quantify the total amount of syndecan-1, we performed a flowcytometric analysis using an anti-syndecan-1 monoclonal antibodythat specifically recognizes the core protein (clone MI15). Ourfindings showed a significant increase in cell-surface syndecan-1 in
Fig. 6. Analysis of HS regulation. A) Cell-surface HS expression in wt (black bars) andsilenced (gray bars) HK2 cells, and in those treated with 60 μg/ml BSA or AGE (hatchedbars), investigated by flow cytometry. B) Cell-surface HS expression in wt HK2 cellsincubated in control media with 60 μg/ml BSA or AGE and treated (white bars) oruntreated (black bars) with 50 μg/ml of the HPSE inhibitor Sulodexide. The resultsrepresent the mean±standard deviation of two separate experiments performed intriplicate (*pb0.05, **pb0.001 vs. control wt cells).
both the HPSE silenced clones. As in the case of HS, while high glucoselevels and the osmolarity control had no effect on syndecan-1 in wt orHPSE silenced cell lines (data not shown), BSA and AGE bothprompted a significant syndecan-1 protein reduction in wt HK2cells, but not in HPSE silenced clones (Fig. 7A).
We confirmed the greater amount of syndecan-1 in HPSE silencedcells by immunofluorescent staining too. The wt HK2 cells showed aprevalent nuclear syndecan-1 staining, while the HPSE silenced cellsstained more intensely at both nuclear and cytoplasmic levels (Fig. 7B).
To establishwhetherHPSE regulates syndecan-1 at transcriptional orpost-transcriptional level, we used real-time PCR to assess syndecan-1gene expression inwt andHPSE silenced clones. By comparisonwith thewt HK2 cells, both the shRNA1 and the shRNA2 clones had a significantgene upregulation. Neither high glucose levels nor the osmolaritycontrol had any effect on syndecan-1mRNA expression in any of the celllines (datanot shown). Inmuch the samewayasat theprotein level, BSAand glycated albumin determined a significant syndecan-1 genedownregulation in wt HK2 cells, but had no effect on syndecan-1mRNA regulation inHPSE silenced clones (Fig. 7C). BSAandAGE exertedthe same effects on HEK293 cells producing significant decrease ofsyndecan-1 gene expression, respectively, of 22 and 51% (Fig.7D).
4. Discussion
Glomerular heparanase is an interesting player in the arena ofproteinuric disease and several investigators have shown, in bothclinical studies and animal models, that HSPGs in the glomerularbasement membrane are severely reduced in DN and that HS isinversely correlated with glomerular HPSE expression. Little is known,however, about its expression, regulation and role in PTEC, particularlyin diabetic conditions. The biology of PTEC is crucial to the developmentand the rate of progression of DN, as in other renal diseases [16]. In thisstudy,wedemonstrate thatHPSE is a keymediator in thehomeostasis ofPTEC in the DN milieu, possibly playing a part in DN pathogenesis.
Our demonstration that HPSE is constitutively expressed in PTECssuggests that it has a physiological role in the homeostasis of bothcells and ECM. In our cell model, HPSE is upregulated by mediatorsinvolved in the pathogenesis of DN, and HPSE in turn affects a numberof pathways relevant to the pathogenesis of DN.
Unlike the case of the glomerular epithelial cells, high glucoselevels do not influence HPSE expression in PTEC; this means that, evenif podocytes and PTECs are cells with the same lineage, and they bothexpress glucose receptors [17,18], they have a different responsive-ness and gene regulation.
High glucose levels do not cause any loss of HS, suggesting that highglucose levels per se do not influence HS biosynthesis and turnover, orHSproteoglycanexpression.Wecan reasonablymake this claimbecausewe used two specific antibodies in our experiments: one recognizing anHS epitope closely related to N-acetylated, O-sulfated glucosaminesensitive to O-desulfation, and one that selectively recognizes the coreprotein of syndecan-1, a prototypic cell-membrane HSPG.
When a glomerular lesion becomes established in DN, theglomerulus loses its permselectivity to proteins and a protein leakconsequently occurs, as reflected by proteinuria. Because of this proteinleakage through the glomerular barrier, the proximal tubular cells areexposed to an array of proteins, particularly albumin and glycatedalbumin. Incubation with these two proteins thus reproduces theenvironment of DN, challenging the proximal tubular cells. Incubationwith albumin, and glycated albumin in particular, induces a dose-dependent increase in HPSE expression in both tubular cell linesanalyzed. Moreover, these two substances produce an increment of theHPSE HS-endoglycosidase-activity at the intracellular level and also inthe extracellular spaces. Thismeans that the increasedHPSE produced iseffectively released outside of the cells in the active form and it could beable to perform its endoglycosidasic activity on tubular HS. This is thefirst demonstration that HPSE is a target of two paradigmaticmediators

Fig. 7. Analysis of syndecan-1 regulation. A) Syndecan-1 protein expressionwas detected by flow cytometry inwt and silenced control (black bars)HK2 cells and in those treatedwith 60 μg/ml BSA or AGE (hatched bars). The results represent the mean±standard deviation of three separate experiments performed in triplicate (**pb0.001 vs. control wt cells). B) Syndecan-1protein localization was evaluated in wt and silenced cells by immunofluorescence analysis: syndecan-1 was detected from the FITC-secondary antibody (green) and the nuclei werecounterstainedwithDAPI (blue). Thepictures arerepresentativeof three separateexperiments. Staining for syndecan-1 is stronger in theshRNA1clonethan in thewtHK2cells. C) Syndecan-1mRNA expression levels inwt, silenced control (black bars) and treated (hatched bars) HK2 cells were determined by real-time PCR. Thewt and silenced cell lineswere culturedwith BSA orAGE (0 or 60 μg/ml) for 6 h, and the results were normalized using GAPDH as the internal control. D) Syndecan-1 mRNA expression levels in HEK293 cells untreated (black bars) or treatedwith 60 μg/ml of BSA or AGE (hatched bars). Gene expression results were normalized using GAPDH as an internal control and represent themean±standard deviation of two experimentsperformed in triplicate (*pb0.05, **pb0.001 vs. control wt cells).
1481V. Masola et al. / Biochimica et Biophysica Acta 1813 (2011) 1475–1482
of DN, albumin and glycated albumin.We investigated themechanismsof these events and their effects downstream.
Albumin and AGE have been shown to activate several signalpathways via a megalin-mediated uptake or RAGE interaction [6]. Weexplored NF-kB, PI3 kinase, p38 MAPK, Jak and MEK1-2 downstreamsignaling, testing the ability of specific inhibitors to reduce theupregulation of HPSE expression triggered by albumin and glycatedalbumin. Only the PI3K pathway was found to mediate the HPSEupregulation induced by albumin and glycated albumin, since itsspecific inhibitor LY294002 restored the HPSE expression to baselinevalues. Xu et al. had already reported that AGE activates PI3K and itsdownstream common effectors, AKT and ERK, in mesangial cells [19].But in PTECs stimulated by glycated albumin (and albumin), thedownstream cascade only partially overlaps with the one observed inmesangial cells because PD98059 and U0126, which inhibit MEK1-2and thereby also the ERK pathways, failed to reduce the HPSEupregulation triggered by albumin and glycated albumin.
We therefore suggest that PI3K/AKT is the main signaling pathwaytriggered by proteinuria and AGE, responsible for HPSE upregulationin PTECs because these factors activate AKT, while silencing the AKT1and AKT2, the two AKT isoforms reportedly activated in response toalbumin and advanced glycation end products [20,21], prevented theHPSE upregulation by BSA and AGE. The PI3K/AKT pathway hasalready been linked to heparanase, since it was shown that HPSE hasthe ability to stimulate AKT in tumoral and endothelial cells [22].Moreover, a recent study on human microvascular endothelial cells(HMVEC) confirmed that AGE induces HPSE expression, thusunderlying that an important diabetic mediator like AGE supervisesHPSE regulation in different tissues. However, the authors of thisstudy showed that HPSE expression is not PI3K-mediated in HMVEC,suggesting that distinct pathway could focus on AGE-induced HPSEregulation in different cellular types [23].
To investigate the effects of HPSE upregulation and distinguish themfrom those caused directly by albumin and glycated albumin, we

1482 V. Masola et al. / Biochimica et Biophysica Acta 1813 (2011) 1475–1482
generated an HK2 cell line that was stably silenced for HPSE. Thissilenced cell line showed a significantly reducedHPSEmRNAexpressionand protein level and also the HPSE activity were significantly impairedboth in the cell lisates and in the extracellular fluid. The apparentdiscrepancies between the HPSE mRNA transcript, the cytoplasmicamount of the HPSE protein and its activity in HPSE-silenced cells couldbe reasonedby the fact that this enzymepresents a complexmechanismof protein maturation, activation and secretion. Indeed, HPSE mRNA istranslated into an inactive protein precursor which is secreted, then it isendocytosed andhence processed to form the active enzyme that can bestored in vesicles or released in the extracellular space [11]. In theHPSE-silenced cell line albumin and glycated albumin were unable toupregulate HPSE gene expression and activity.
Our findings show that albumin and particularly glycated albumincause a significant decrease in HS staining in wt tubular cells. Theseresults are in agreement with the greater HPSE expression and reducedHS in the tubuli of renal biopsies from DN patients [12], pointing to anegative regulation of HS levels byHPSE, as demonstrated in glomerularcells. Otherwise in HPSE silenced cells the HS level was significantlyincreased, and treatment with albumin or glycated albumin had noeffect, suggesting that HPSE per se has a crucial role in determining HSlevels in tubular cells.
To prove whether the reduction in HS induced by albumin and AGEdepends on the increased endoglycosidase activity of HPSE we used anHPSE inhibitor: Sulodexide, a glycosaminoglycan (GAG)-based drugscomposed of 80% heparin and 20% dermatan and used to treatproteinuria [24,25]. The inhibition of HPSE activity reported HS levelstoward the normal amount only partially meaning that heparanaseregulates theHS turnover not only through its endoglycosidasic activity.
Consecutively to this fact, and that BSA and AGE increase the HPSEintracellular protein amount, we supposed that heparanase couldregulate the different levels of HSPGs core proteins too, so we analyzedthe effect of albumin and glycated albumin and HPSE silencing on thePTEC levels of syndecan-1 (one of the HSPG most abundant in PTECs).
Syndecan-1 core protein and gene expression were reduced byalbumin and glycated albumin in HK2 wt and HEK293 cells, but not inHPSE silenced cells. In untreated HPSE silenced cells, moreover,syndecan-1 gene transcription and protein levels were up-regulatedby comparison with wt cells. This means that HPSE in the proximaltubular cells reduces HS levels also as a result of the downregulationof syndecan-1.
It was previously reported that a direct relationship exists inmyeloma cells between HPSE and syndecan-1 shedding and genetranscription [26–28]. Our results contrast with such findings, probablybecause of the very different origin of the two types of cell considered.
Our data show that, in tubular cells at least, the inverserelationship observed between HS levels and HPSE activity dependsalso on a transcriptional activity of the molecule than on a simplepost-transcriptional, extracellular endoglycosidase activity, as previ-ously postulated.
In conclusion, we show that stimulating PTEC with albumin andAGE induces changes in heparanase-1 expression that may berelevant to the progression of chronic nephropathies, including DN,by various mechanisms. For a start, the increased HPSE endoglyco-sidase activity could alter ECM turnover; secondly, by decreasing HSon the cell membrane HSPGs, it may modify cell–cell and cell–matrixcrosstalk; thirdly, by regulating syndecan-1 expression, the intracel-lular overexpression of HPSE could impair the activity of growthfactors such as FGF2 (and possibly others too). Experiments areunderway to investigate these issues.
Acknowledgments
The authors thank Evelyne Tassone for technical support and AnnaMaria Brunati (University of Padova) for kindly providing some of thereagents and for advices.
References
[1] D.T. Gilbertson, J. Liu, J.L. Xue, T.A. Louis, C.A. Solid, J.P. Ebben, A.J. Collins,Projecting the number of patients with end-stage renal disease in the UnitedStates to the year 2015, J. Am. Soc. Nephrol. 16 (2005) 3736–3741.
[2] R.E. Gilbert,M.E. Cooper, The tubulointerstitium inprogressive diabetic kidneydisease:more than an aftermath of glomerular injury? Kidney Int. 56 (1999) 1627–1637.
[3] A. Bohle, M. Wehrmann, O. Bogenschutz, C. Batz, C.A. Muller, G.A. Muller, Thepathogenesis of chronic renal failure in diabetic nephropathy. Investigation of 488cases of diabetic glomerulosclerosis, Pathol. Res. Pract. 187 (1991) 251–259.
[4] S.M. Mauer, M.W. Steffes, E.N. Ellis, D.E. Sutherland, D.M. Brown, F.C. Goetz,Structural–functional relationships in diabetic nephropathy, J. Clin. Invest. 74(1984) 1143–1155.
[5] C.A. Pollock, P. Poronnik, Albumin transport and processing by the proximal tubule:physiology and pathophysiology, Curr. Opin. Nephrol. Hypertens. 16 (2007) 359–364.
[6] M. Gekle, Renal tubule albumin transport, Annu. Rev. Physiol. 67 (2005) 573–594.[7] C. Caruso-Neves, A.A. Pinheiro, H. Cai, J. Souza-Menezes, W.B. Guggino, PKB and
megalin determine the survival or death of renal proximal tubule cells, Proc. Natl.Acad. Sci. U. S. A. 103 (2006) 18810–18815.
[8] M.J. van den Hoven, A.L. Rops, I. Vlodavsky, V. Levidiotis, J.H. Berden, J. van derVlag, Heparanase in glomerular diseases, Kidney Int. 72 (2007) 543–548.
[9] I. Vlodavsky, Y. Friedmann, Molecular properties and involvement of heparanasein cancer metastasis and angiogenesis, J. Clin. Invest. 108 (2001) 341–347.
[10] V. Masola, C. Maran, E. Tassone, A. Zin, A. Rosolen, M. Onisto, Heparanase activityin alveolar and embryonal rhabdomyosarcoma: implications for tumor invasion,BMC Cancer 9 (2009) 304.
[11] N. Ilan, M. Elkin, I. Vlodavsky, Regulation, function and clinical significance ofheparanase in cancer metastasis and angiogenesis, Int. J. Biochem. Cell Biol. 38(2006) 2018–2039.
[12] M.J. van den Hoven, A.L. Rops, M.A. Bakker, J. Aten, N. Rutjes, P. Roestenberg, R.Goldschmeding, E. Zcharia, I. Vlodavsky, J. van der Vlag, J.H. Berden, Increasedexpression of heparanase in overt diabetic nephropathy, Kidney Int. 70 (2006)2100–2108.
[13] S. Kure, O. Yoshie, A syngeneic monoclonal antibody to murine Meth-A sarcoma(HepSS-1) recognizes heparan sulfate glycosaminoglycan (HS-GAG): cell densityand transformation dependent alteration in cell surface HS-GAG defined byHepSS-1, J. Immunol. 137 (1986) 3900–3908.
[14] V. Gattei, C. Godeas, M. Degan, F.M. Rossi, D. Aldinucci, A. Pinto, Characterization ofanti-CD138 monoclonal antibodies as tools for investigating the molecular polymor-phism of syndecan-1 in human lymphoma cells, Br. J. Haematol. 104 (1999) 152–162.
[15] X. Xu, G. Rao, J.B. Maxhimer, R.A. Prinz, E.J. Lewis, Mechanism of action ofsulodexide-mediated control of proteinuria: inhibition of heparanase-1 activity[abstract], J. Am. Soc. Nephrol. 16 (2005) 673A.
[16] A.O. Phillips, The role of renal proximal tubular cells in diabetic nephropathy, Curr.Diab. Rep. 3 (2003) 491–496.
[17] R.J. Coward,G.I.Welsh, J. Yang, C. Tasman,R. Lennon,A.Koziell, S. Satchell,G.D.Holman,D. Kerjaschki, J.M. Tavare, P.W. Mathieson, M.A. Saleem, The human glomerularpodocyte is a novel target for insulin action, Diabetes 54 (2005) 3095–3102.
[18] J.J. Neumiller, J.R. White Jr., R.K. Campbell, Sodium-glucose co-transport in-hibitors: progress and therapeutic potential in type 2 diabetes mellitus, Drugs 70(2010) 377–385.
[19] D. Xu, J.M. Kyriakis, Phosphatidylinositol 3′-kinase-dependent activation of renalmesangial cell Ki-Ras and ERK by advanced glycation end products, J. Biol. Chem.278 (2003) 39349–39355.
[20] B.K. Singh, D.D. Mascarenhas, Bioactive peptides control receptor for advancedglycated end product-induced elevation of kidney insulin receptor substrate 2 andreduce albuminuria in diabetic mice, Am. J. Nephrol. 28 (2008) 890–899.
[21] J. Ma, T. Liu, X. Dong, Advanced glycation end products of bovine serum albumin-induced endothelial-to-mesenchymal transition in cultured human and monkeyendothelial cells viaproteinkinaseB signaling cascades,Mol. Vis. 16 (2010)2669–2679.
[22] N. Ilan, M. Elkin, I. Vlodavsky, Regulation, function and clinical significance ofheparanase in cancer metastasis and angiogenesis, Int. J. Biochem. Cell Biol. 38(2006) 2018–2039.
[23] X.F. An, L. Zhou, P.J. Jiang, M. Yan, Y.J. Huang, S.N. Zhang, Y.F. Niu, S.C. Ten, J.Y. Yu,Advancedglycationend-products induceheparanase expression inendothelial cells bythe receptor for advanced glycation end products and through activation of the FOXO4transcription factor, Mol. Cell. Biochem. (2011), doi:10.1007/s11010-011-0804-7.
[24] T.J. Wijnhoven, J.F. Lensen, A.L. Rops, K.J. McCarthy, J. van der Vlag, J.H. Berden, L.P.van den Heuvel, T.H. Kuppevelt, Anti-proteinuric effects of glycosaminoglycan-based drugs, Curr. Opin. Mol. Ther. 9 (2007) 364–377.
[25] G. Gambaro, I. Kinalska, A. Oksa, P. Pont'uch, M. Hertlova, J. Olsovsky, J. Manitius,D. Fedele, S. Czekalski, J. Perusicova, J. Skrha, J. Taton, W. Grzeszczak, G. Crepaldi,Oral sulodexide reduces albuminuria in microalbuminuric and macroalbuminurictype 1 and type 2 diabetic patients: the Di.N.A.S. randomized trial, J. Am. Soc.Nephrol. 13 (2002) 1615–1625.
[26] Y. Yang, V. MacLeod, Y. Dai, Y. Khotskaya-Sample, Z. Shriver, G. Venkataraman, R.Sasisekharan, A. Naggi, G. Torri, B. Casu, I. Vlodavsky, L.J. Suva, J. Epstein, S. Yaccoby, J.D.Shaughnessy Jr., B. Barlogie, R.D. Sanderson, The syndecan-1 heparan sulfateproteoglycan is a viable target for myeloma therapy, Blood 110 (2007) 2041–2048.
[27] L. Chen, R.D. Sanderson, Heparanase regulates levels of syndecan-1 in the nucleus,PLoS One 4 (2009) e4947.
[28] K. Mahtouk, D. Hose, P. Raynaud, M. Hundemer, M. Jourdan, E. Jourdan, V.Pantesco, M. Baudard, J. De Vos, M. Larroque, T. Moehler, J.F. Rossi, T. Reme, H.Goldschmidt, B. Klein, Heparanase influences expression and shedding ofsyndecan-1, and its expression by the bone marrow environment is a badprognostic factor in multiple myeloma, Blood 109 (2007) 4914–4923.