Biochemical Reactors for Selenium Treatment - CLU-IN · Selenium Passive Treatment Systems: Free...
39
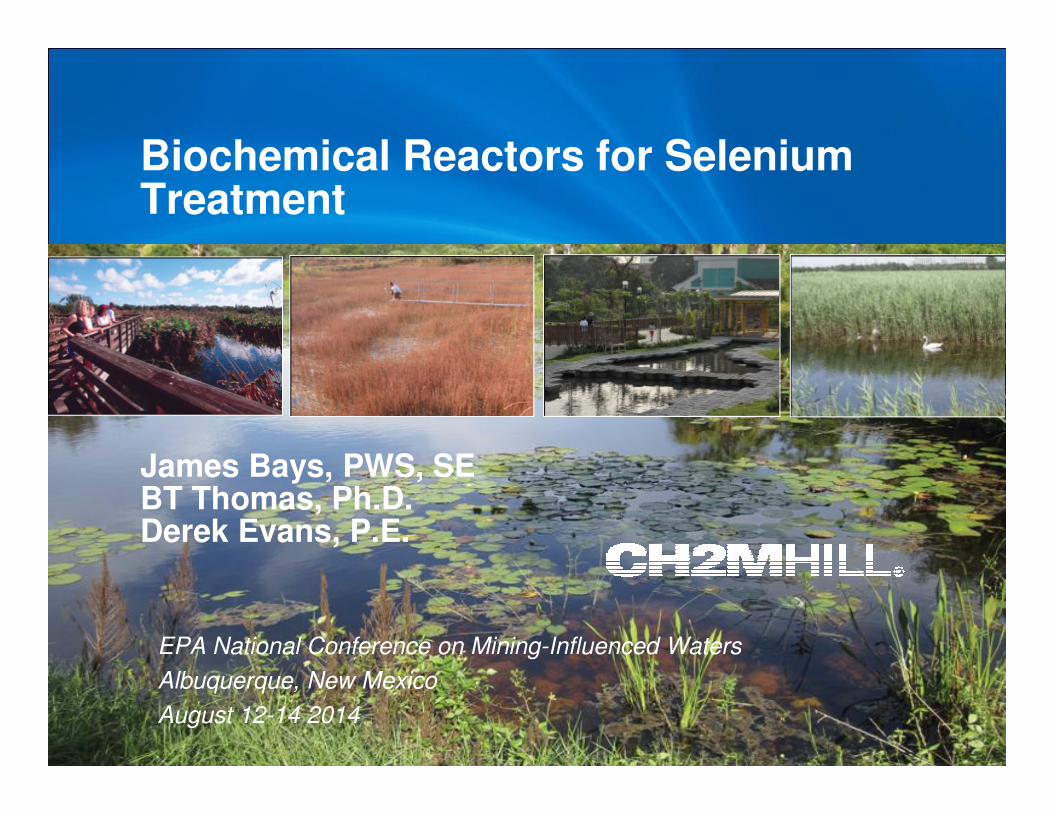
Copyright [insert date set by system] by [CH2M HILL Entity] • Company Confidential Biochemical Reactors for Selenium Treatment James Bays, PWS, SE BT Thomas, Ph.D. Derek Evans, P.E. EPA National Conference on Mining-Influenced Waters Albuquerque, New Mexico August 12-14 2014
Transcript of Biochemical Reactors for Selenium Treatment - CLU-IN · Selenium Passive Treatment Systems: Free...
Copyright [insert date set by system] by [CH2M HILL Entity] • Company Confidential
Biochemical Reactors for Selenium Treatment
James Bays, PWS, SEBT Thomas, Ph.D.Derek Evans, P.E.
EPA National Conference on Mining-Influenced Waters
Albuquerque, New Mexico
August 12-14 2014

Overview of Presentation
Outline
� Selenium Transformations, Wetland Examples
� Selected Recent Pilot Systems
� New Full Scale System Detailed review
� O&M Overview
� Constraints Review
� Summary
NAMC Selenium Report 2010
http://www.namc.org/docs/00062756.PDF
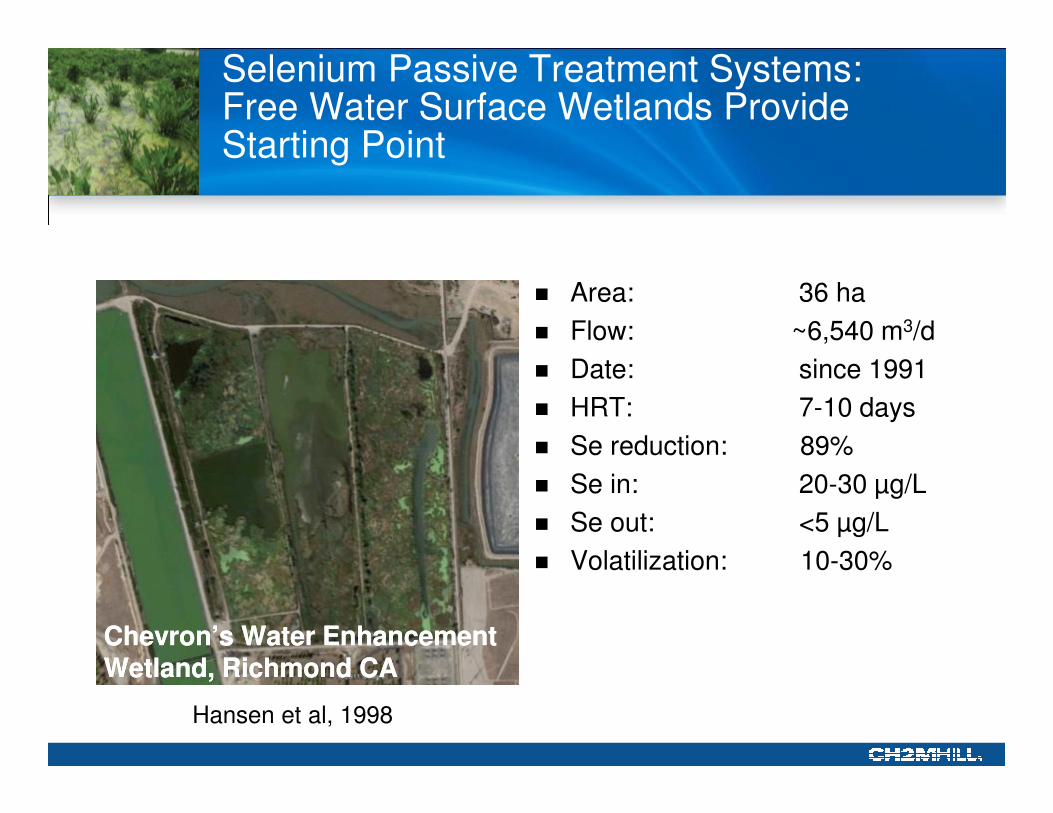
Selenium Passive Treatment Systems:Free Water Surface Wetlands Provide Starting Point
� Area: 36 ha
� Flow: ~6,540 m3/d
� Date: since 1991
� HRT: 7-10 days
� Se reduction: 89%
� Se in: 20-30 µg/L
� Se out: <5 µg/L
� Volatilization: 10-30%
Chevron’s Water Enhancement Wetland, Richmond CAChevron’s Water Enhancement Wetland, Richmond CA
Hansen et al, 1998

Treatment Wetlands: Multiple Processes, Multiple Scales
Surface Water
Plant Uptake & Storage
Adsorption
Nitrification /Denitrification
Decomposition
Burial & Soil Storage
Sedimentation
Volatilization
PrecipitationSediments
Detritus
N, BOD, VolatileOrganics,Selenium
P, Metals
NO3, NH3
ON, NH3, P, Metals, OrganicsDiffusion
Metals, N, P
TSS, Adsorbed Contaminants
Annual Growth Cycle

Natural Oxidation/Reduction Processes in Flooded Organic Soils
� Aerobic respiration
– ½ O2 + 2e- + 2H+ -> H2O
� Denitrification
– 2NO3- + 12 H+ +10e- -> N2+6H2O
� Manganese reduction:
– MnO2 + 4H+ + 2e- ->Mn2+ + 2H2O
� Iron reduction:
– Fe(OH)3 + 3 H+ + 2e- -> Fe2+ + 2H2O
� Sulfate reduction:
– SO42- + 10H+ +8e- -> H2S + 4H2O
� Methane production:
– CO2 + 8 H+ + 8e- -> CH4 +2 H2O
Process Eh (mV)
Aerobic respiration +330
Denitrification +220
Manganese reduction +200
Ferric to ferrous reduction +120
Sulfate reduction -150
Methanogenesis -250
Organic carbon substrate provides electrons via microbial process

Progress in Design ofTreatment Wetlands and Passive Systems
1993 1996 2006 20091989 2000
1990 2000 2010
ASMR
Hedin, R.S., R.W. Nairn, and R. Kleinmann.
Passive treatment of coal mine
drainage.
USBM 9389
Hedin, R.S., R.W. Nairn, and R. Kleinmann.
Passive treatment of coal mine
drainage.
USBM 9389
ASMR
IMWA
v. 36(11)

Biochemical Reactors - Definitions
ITRC 2013
� …engineered treatment
system that uses an
organic substrate to drive
microbial and chemical
reactions to reduce
concentration of metals,
acidity, and sulfate in mine-
impacted water.
Pulles 2009
� A water treatment system
that utilizes naturally
available energy sources
such as topographical
gradient, microbial
metabolic energy,
photosynthesis and
chemical energy and
requires regular but
infrequent maintenance to
operate successfully over
its design life.

Biochemical Reactors – Sustainable Treatment Through Naturally Renewable Components
� Wood
– Chips, sawdust
� Grass
– Hay
� Wetland Plants
– Bulrush, cattail
� Manure and Soil
� Natural Power
– Gravity
– Solar
ITRC 2013

Progress in Biorechemical Reactor Design
Denitrifying Bioreactors for Agricultural Wastewater Treatment
Pilot Projects
Full-Scale Sequential Systems
www.sdcornblog.com
www.nps.gov
Bob Nairn
Mayer Ranch, OK

Wetland Processing and Storage of Selenium
Org-Se
SeO42-
SeO32-
Se0
HSe-1
(CH3) 2Se
Dissimilatory Reduction
SeO42- → SeO3
2- → Se0 → Se2-
� Distribution in wetland sediments:� 0:13:41:46
� 89-92% reduction from selenate to elemental Se in 10 - 16 days
Volatilization
� Organic + SeO32-→ (CH3)2Se
� Volatilized from plant tissues
� 5-30% cumulative loss from sediments and plants
Sorption
� Selenite sorbs to sediments and soil constituents: Fe-, Mn- or Al-
oxyhydroxides and organic matter
Plant Uptake
� Rapid uptake
� Tissue concentrations increase but not detrimental
� No long term storage in plants; Se transferred to sediments
Precipitation
� Abiotic precipitation with S-

BCR Example: Anaerobic “Bioreactor” Wetland Demonstration Showed High Efficiency in Minimal Area
� Source: gravel pit seep
� Volume: 4,380 ft3
� Flow: 2-24 gpm
� Date: 9/08-10/09
� HRT: 2.4 d
� Se in flow 1-34 µg/L
� Se reduction: 98% (90% winter)
� Se removal rate: 16 mg/d/m3
� Se out: 0.5 µg/L
� TCLP <1 µg/L Se
Walker and Golder. 2010. US Bureau of Reclamation
Grand Junction COGrand Junction CO
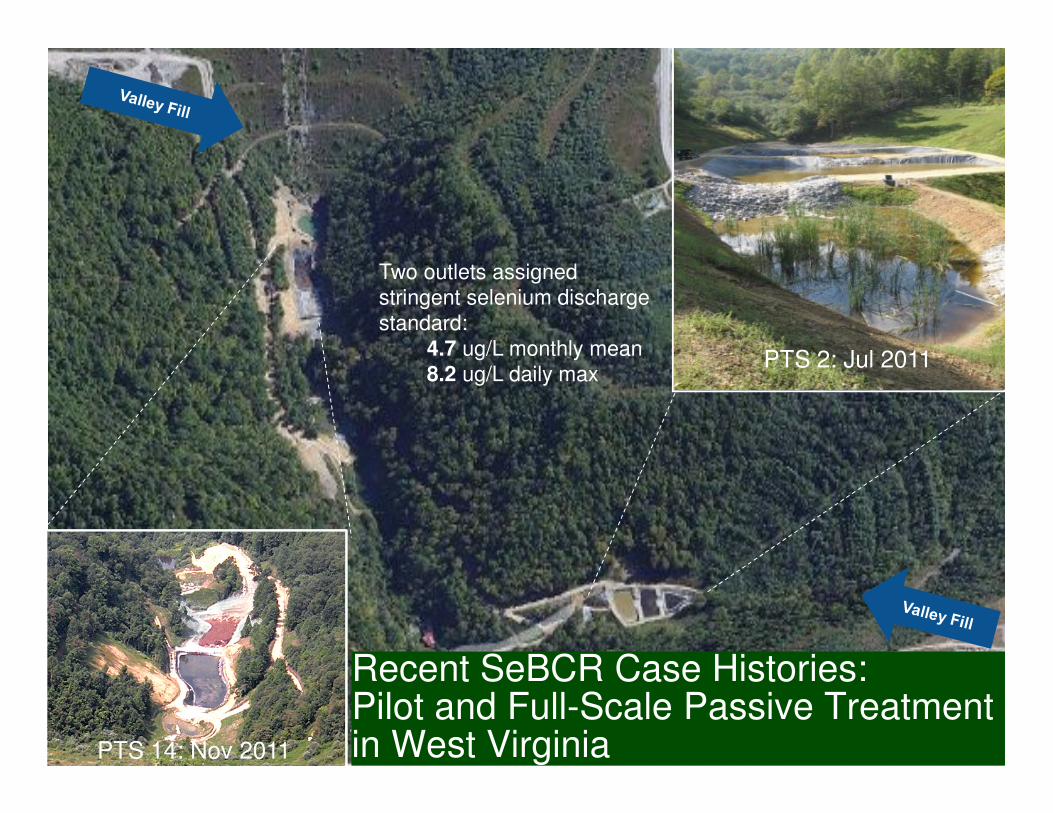
Two outlets assigned stringent selenium discharge standard:
4.7 ug/L monthly mean8.2 ug/L daily max
Recent SeBCR Case Histories: Pilot and Full-Scale Passive Treatment in West Virginia
PTS 2: Jul 2011
PTS 14: Nov 2011

Pilot Study Demonstrated Target Compliance By Media Bioreactors
MaterialPilot Barrel
A B C DWoodchips -- 20% 16% 20%Sawdust -- 20% 47% 30%
Hay -- 15% 16% 20%Organic Peat -- 20% -- --
Sphagnum Moss 100% 20% -- --Composted Manure -- -- 15% 23%
Limestone Chips -- 5% 6% 7%
Total (by volume) 100% 100% 100% 100%
23.5
14.0
3.23.9
2.4
0
5
10
15
20
25
Barrel
Se µ
g/L
Inflow
A (Peat)
B (OM)
C (OM)
D (OM)
Upflow Media Bioreactors (200 L)
4.7µg/L
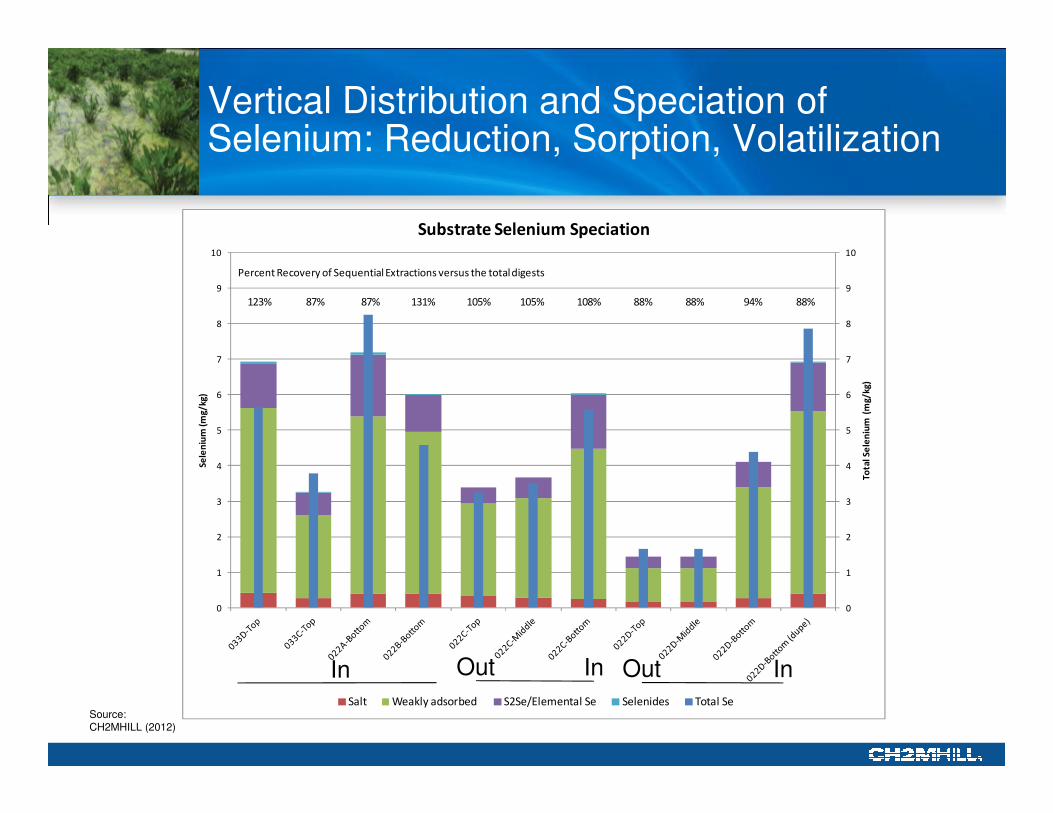
Vertical Distribution and Speciation of Selenium: Reduction, Sorption, Volatilization
0
1
2
3
4
5
6
7
8
9
10
0
1
2
3
4
5
6
7
8
9
10
To
tal
Se
len
ium
(m
g/
kg
)
Se
len
ium
(m
g/
kg
)
Substrate Selenium Speciation
Salt Weakly adsorbed S2Se/Elemental Se Selenides Total Se
123% 88%105%131%87% 88%
Percent Recovery of Sequential Extractions versus the total digests
87% 105% 108% 88% 94%
0
1
2
3
4
5
6
7
8
9
10
0
1
2
3
4
5
6
7
8
9
10
To
tal
Se
len
ium
(m
g/
kg
)
Se
len
ium
(m
g/
kg
)
Substrate Selenium Speciation
Salt Weakly adsorbed S2Se/Elemental Se Selenides Total Se
123% 88%105%131%87% 88%
Percent Recovery of Sequential Extractions versus the total digests
87% 105% 108% 88% 94%
Source:CH2MHILL (2012)
InOutInOutIn

Removal Rates Estimated Based on HRT
Zero-order volumetric
0.0
5.0
10.0
15.0
20.0
25.0
30.0
35.0
12 16 20 24
Sele
niu
m R
em
oval
(mg
/d/m
3)
HRT (hrs)
A
B
C
D
First-order area-based
0
50
100
150
200
250
300
350
400
450
500
12 16 20 24
k1
(m/y
r)
HRT (hrs)
A
B
C
D

PTS 2: Design Flow Set to Capture Load and Account for Inter-annual Variation
54.5
545
5450
5.45
ug/L
; gpm m
3d
-1
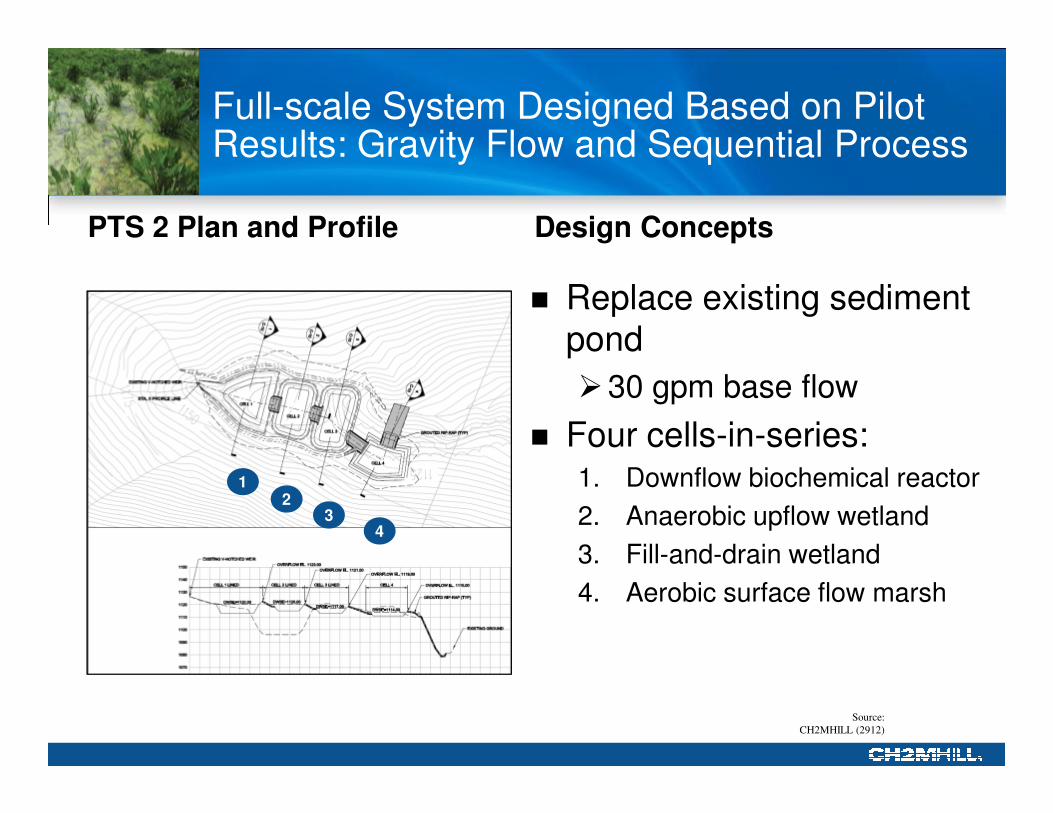
Full-scale System Designed Based on Pilot Results: Gravity Flow and Sequential Process
PTS 2 Plan and Profile Design Concepts
� Replace existing sediment pond
�30 gpm base flow
� Four cells-in-series:1. Downflow biochemical reactor
2. Anaerobic upflow wetland
3. Fill-and-drain wetland
4. Aerobic surface flow marsh
12
34
Source:
CH2MHILL (2912)
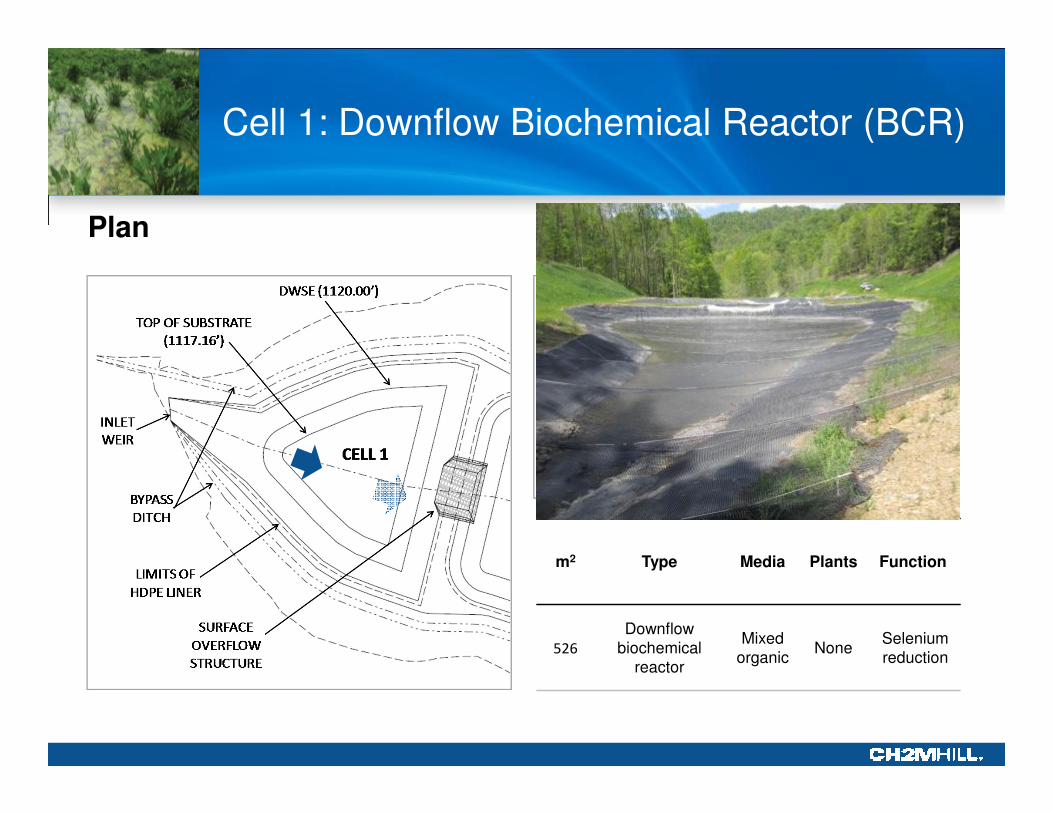
Cell 1: Downflow Biochemical Reactor (BCR)
Plan Profile
m2 Type Media Plants Function
526
Downflow biochemical
reactor
Mixed organic
NoneSelenium reduction

m2 Type Media Plants Function
567Upflow
anaerobicPeat
Sedges, rush
Selenium reduction, Byproduct polishing
Cell 2: Upflow Anaerobic Wetland
Plan Profile

Cell 3: Subsurface Flow Gravel Bed
Plan Profile
m2 Type Media Plants Function
648
Subsurface fill and drain
Limestone gravel
CattailsByproduct polishing

Cell 4: Free Water Surface Wetland
Plan Profile
m2 Type Media Plants Function
445Free water
surface
Topsoil and
pondedwater
CattailsByproduct polishing

PTS 2 Selenium Meeting Daily Criterion Year-Round
µg/L In Ou
t
Average 10.24 1.32
Max 14.47 2.57
Min 5.53 0.90
Range 8.9 1.7
0
5
10
15
20
25
30
0.0
2.0
4.0
6.0
8.0
10.0
12.0
14.0
16.0
F-11 S-11 A-12 O-12 M-13 N-13 J-14
Tem
pera
ture
(˚C)T
ota
l S
e (
µg
/L)
[Se]OUT Daily Max [Se]IN T (C°)
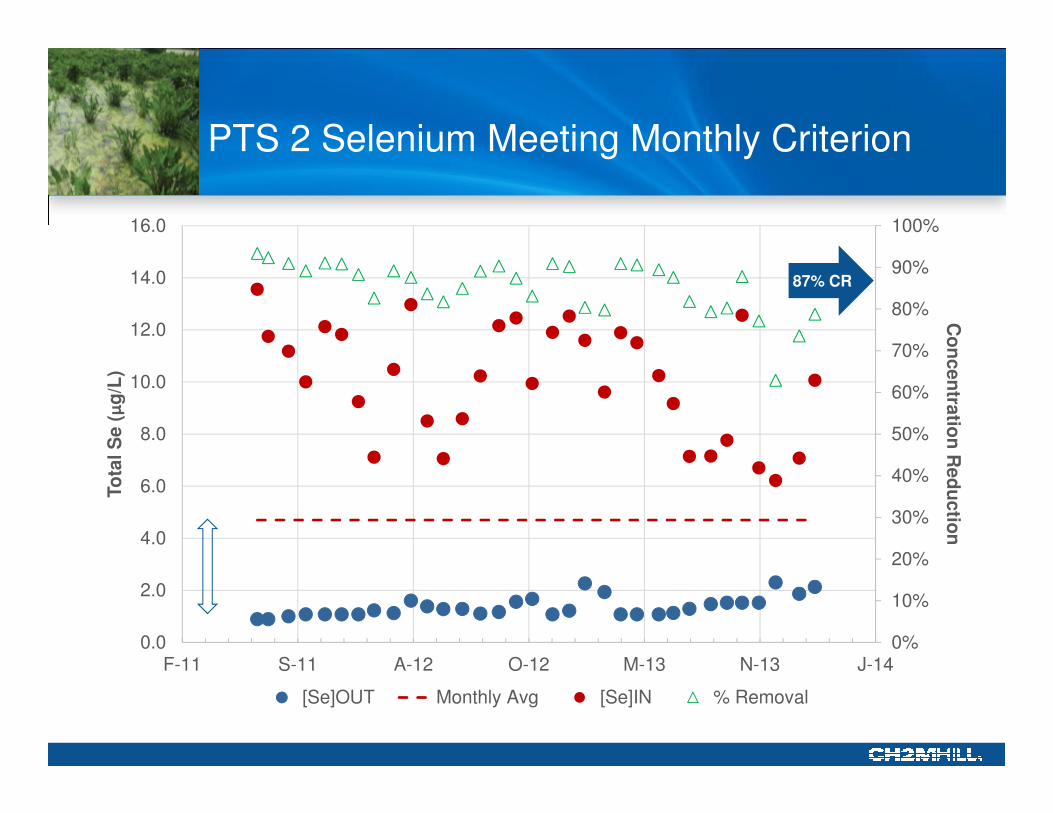
PTS 2 Selenium Meeting Monthly Criterion
0%
10%
20%
30%
40%
50%
60%
70%
80%
90%
100%
0.0
2.0
4.0
6.0
8.0
10.0
12.0
14.0
16.0
F-11 S-11 A-12 O-12 M-13 N-13 J-14
Co
ncen
tratio
n R
ed
uctio
nTo
tal S
e (
µg
/L)
[Se]OUT Monthly Avg [Se]IN % Removal
87% CR

PTS 2 Selenium Not Significantly Affected by Flow
0
20
40
60
80
100
120
0.0
2.0
4.0
6.0
8.0
10.0
12.0
14.0
16.0
D-11 A-12 J-12 O-12 J-13 M-13 A-13 N-13 M-14 J-14
Flo
w (g
pm
)To
tal S
e (
µg
/L)
[Se]OUT Q (gpm)
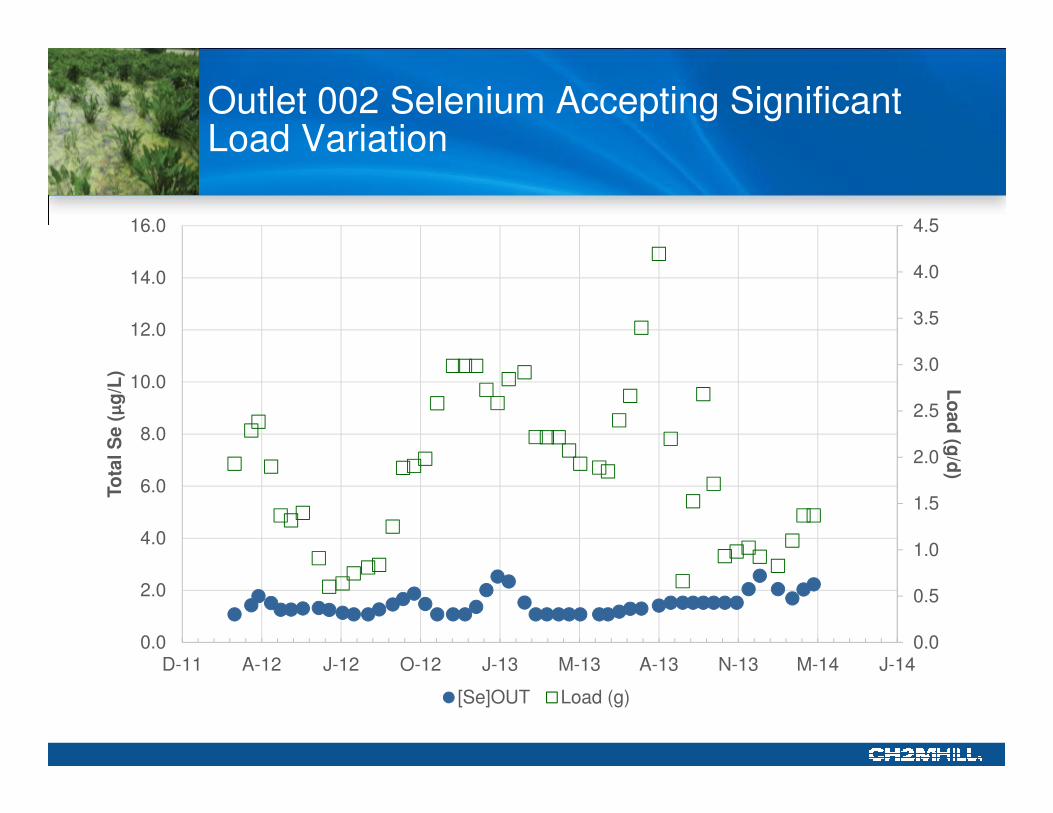
Outlet 002 Selenium Accepting Significant Load Variation
0.0
0.5
1.0
1.5
2.0
2.5
3.0
3.5
4.0
4.5
0.0
2.0
4.0
6.0
8.0
10.0
12.0
14.0
16.0
D-11 A-12 J-12 O-12 J-13 M-13 A-13 N-13 M-14 J-14
Lo
ad
(g/d
)To
tal S
e (
µg
/L)
[Se]OUT Load (g)
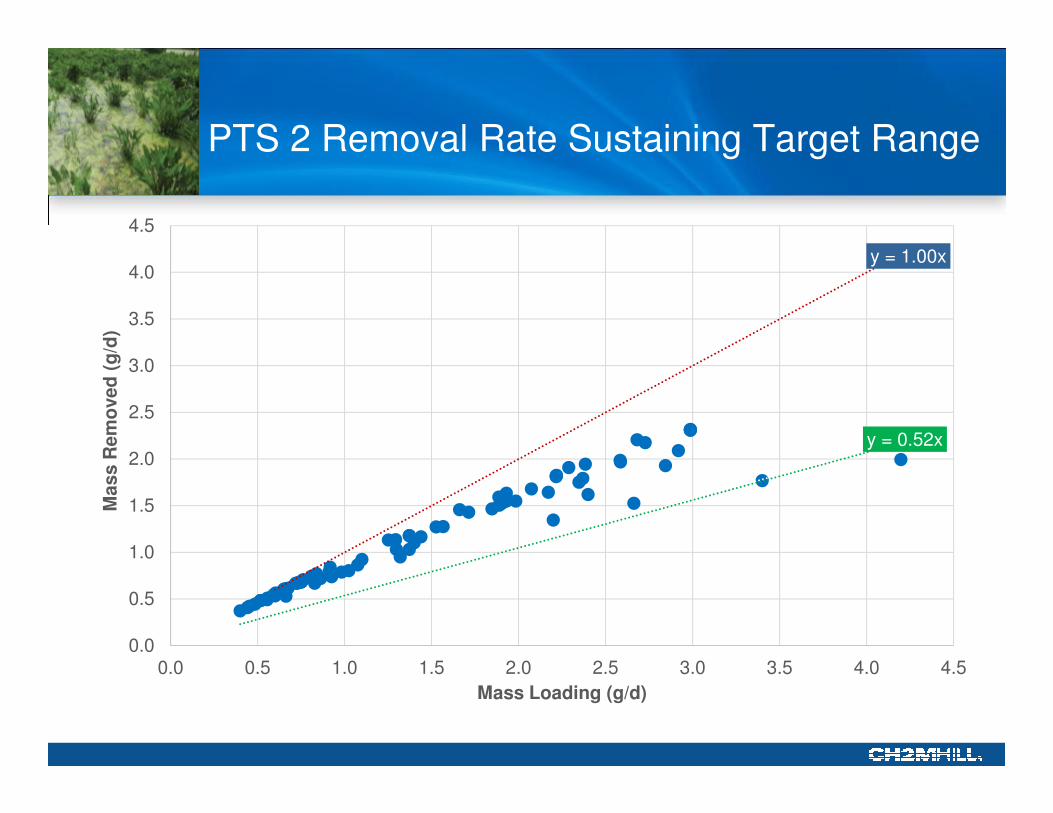
PTS 2 Removal Rate Sustaining Target Range
y = 1.00x
y = 0.52x
0.0
0.5
1.0
1.5
2.0
2.5
3.0
3.5
4.0
4.5
0.0 0.5 1.0 1.5 2.0 2.5 3.0 3.5 4.0 4.5
Mass R
em
oved
(g
/d)
Mass Loading (g/d)
Polishing Wetlands Reduced Turbidity by 83%
1
10
100
1000
J A S O N D
Tu
rbid
ity (
NT
U)
Inf Cell 2 Cell 4
Cell 2
Cell 3 into Cell 4
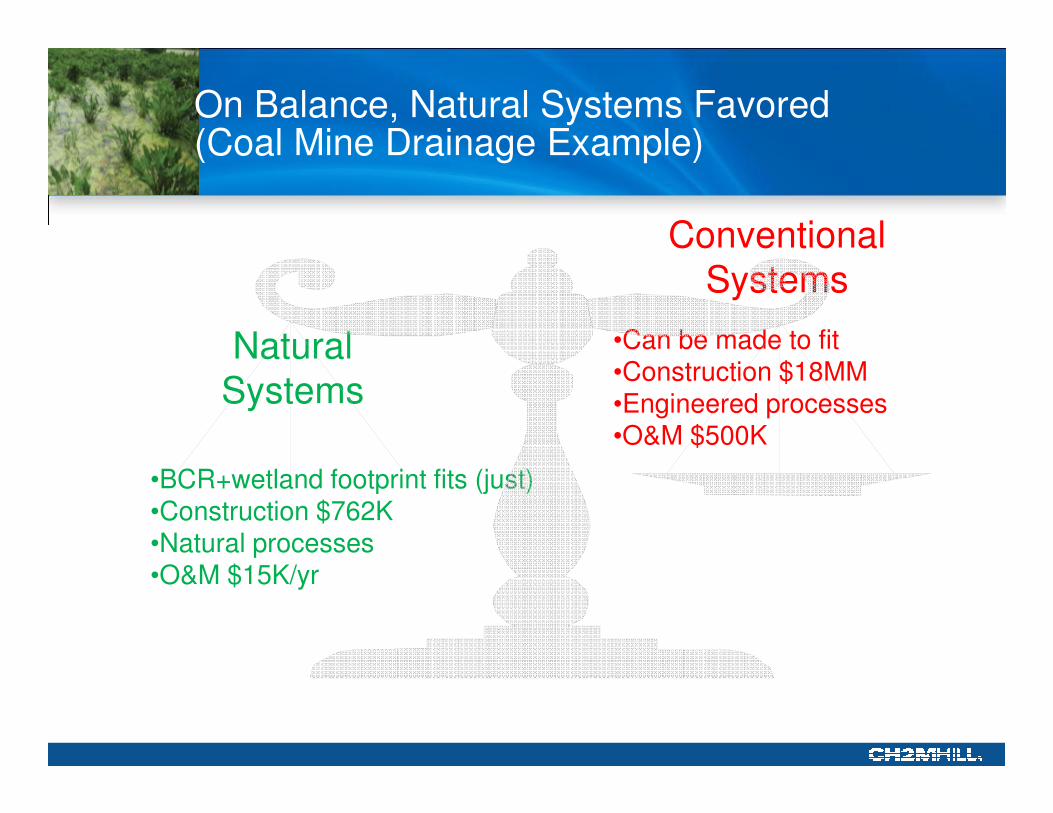
On Balance, Natural Systems Favored(Coal Mine Drainage Example)
NaturalSystems
ConventionalSystems
•BCR+wetland footprint fits (just)•Construction $762K•Natural processes•O&M $15K/yr
•Can be made to fit•Construction $18MM•Engineered processes•O&M $500K

PTS 14: Higher Flow, Higher Concentration, Still Compliant with Criteria
� Five cells-in-series:1. 0.12 ac Head tank
2. 0.48 ac Upflow BCR
3. 0.30 ac Upflow BCR
4. 0.23 ac Surface flow marsh
5. 0.38 ac Sedimentation pond
�230 gpm base flow
�24 µg/L mean Se to <4.7
Source:CH2MHILL (2011)

Passive Treatment Operations & Maintenance:Basic Expectations
� Safety
– Access, walkway, railings
� Hydraulic Control
– Control structures, pipes, valves
� Process Performance Monitoring
– Intermediate sampling
� Site Maintenance
– Berms, liner & drainage
� Media
– Long-term replacement
• Can assume 20 yrs
• Cap in place an option
– Can supplement media/carbon
– TCLP – not hazardousImage Source
Bays, J. (2012)
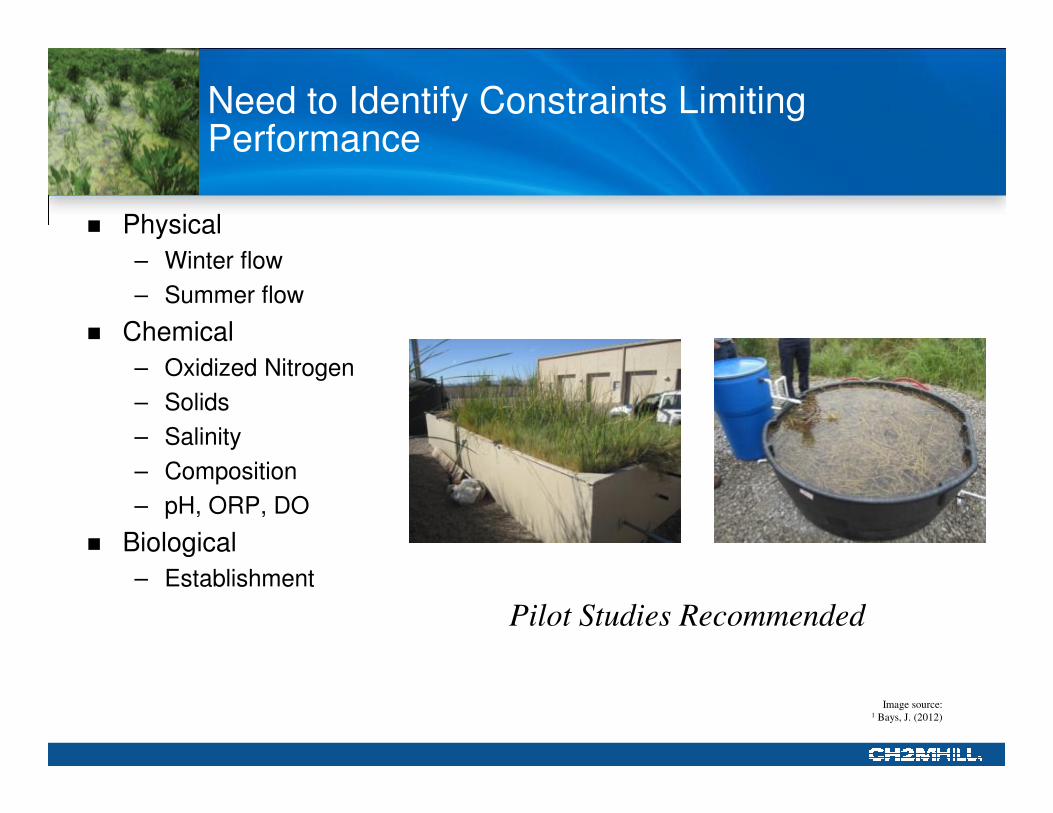
� Physical
– Winter flow
– Summer flow
� Chemical
– Oxidized Nitrogen
– Solids
– Salinity
– Composition
– pH, ORP, DO
� Biological
– Establishment
Need to Identify Constraints Limiting Performance
Pilot Studies Recommended
Image source: 1 Bays, J. (2012)

Prospects Reasonable for Passive Treatment of Seleniferous Wastewaters
� Minewater quality
– Amenable to passive treatment with appropriate design
– Pilot studies recommended
� Reliable, natural anaerobic biological process
– Selenium will be reduced, sequestered year-round
� Learn from real-world examples
– Agriculture, mine-water, water treatment, power
� Cost-effective
– Small footprint, lower cost, less maintenance effort
Sources of Additional Information
ITRC Bioreactor Guidance 2013
NAMC Selenium Technology 2010 (update 2012)
http://www.namc.org/docs/00062756.PDFhttp://www.itrcweb.org/miningwaste-guidance/to_bioreactors.htm

Acknowledgements
Thanks to all of our collaborating private & public partners in the mining and power generation industries.
Contact: Jim Bays
813-281-7705
Email: [email protected]

Sequential Systems Total Installed Cost1
Cost Considerations (Class 5 AACEI)Scenario: 200 gpm, 50 ug/L Sein, 5 ug/L
Seout
Biochemical Reactors (0.76 ac)
Subsurface Flow Beds
(0.77 ac)
y = 0.0812x0.6
0
1
10
10 100 1000
Capital C
ost ($
Mill
ion)
Flow Rate (GPM)
200 gpm~$2 MM
Sources: 1 CH2MHILL (2013) NAMC Update
1600
gpm
1800
gpm
Full scale Se

Cost Curve1
y = 2.123x0.6
1
10
100
1000
10 100 1000 10000
Cost per
Year
($ T
housand)
Flow Rate (GPM)
Cost Component
0%0% 3%
48%
8%
40%
Organic media, Cell 1. supplement
P media
Organic media, Cell 1. removal
Labor - Zone
Conceptual O&M Costs (Class 5 AACEI)200 gpm, 50 ug/L Se
200 gpm$51k/yr
Sources: 1 CH2MHILL (2013) NAMC Update
Full scale Se
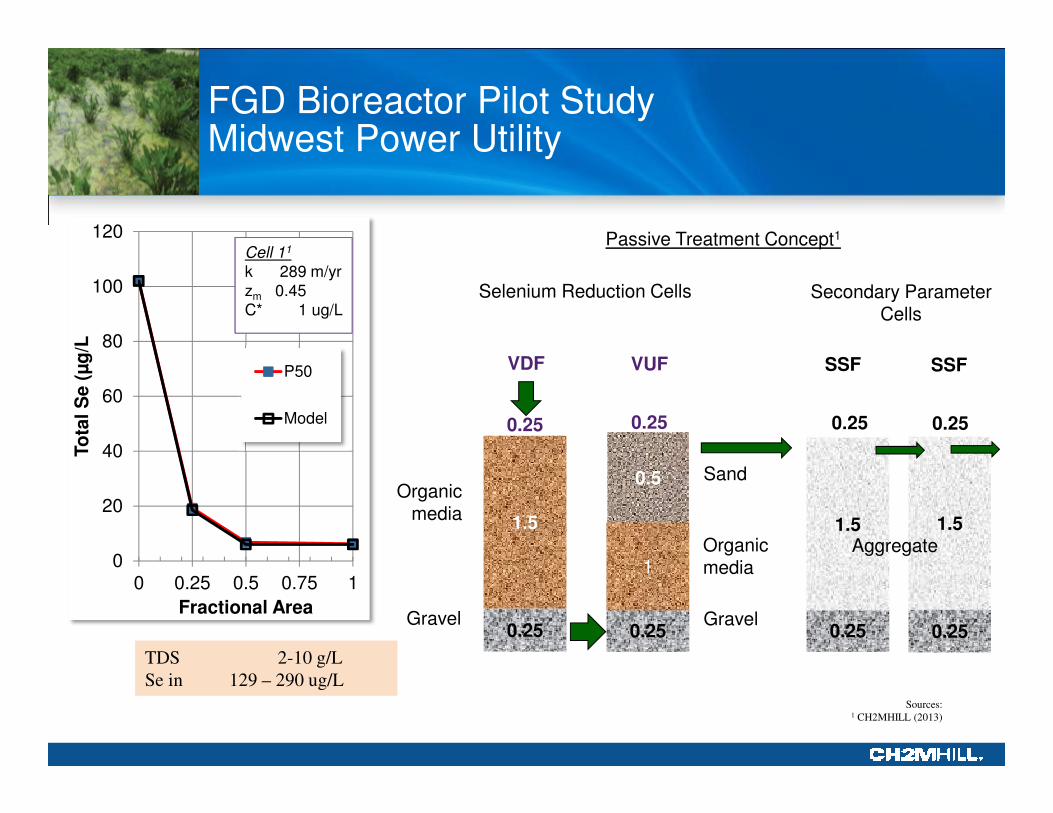
FGD Bioreactor Pilot StudyMidwest Power Utility
0
20
40
60
80
100
120
0 0.25 0.5 0.75 1
To
tal S
e (
µg
/L
Fractional Area
P50
Model
Cell 11
k 289 m/yrzm 0.45C* 1 ug/L
0.250.25
0.50.5
1.51.5
0.25
VDF
0.250.25
11
0.25
VUF
Organic media
Gravel
Organic media
Sand
Gravel0.250.25
1.51.5
0.250.25
1.51.5
SSF SSF
0.25 0.25
Aggregate
Selenium Reduction Cells Secondary Parameter Cells
Sources: 1 CH2MHILL (2013)
Passive Treatment Concept1
TDS 2-10 g/L
Se in 129 – 290 ug/L
TDS 2-10 g/L
Se in 129 – 290 ug/L
FGD Ash Pond
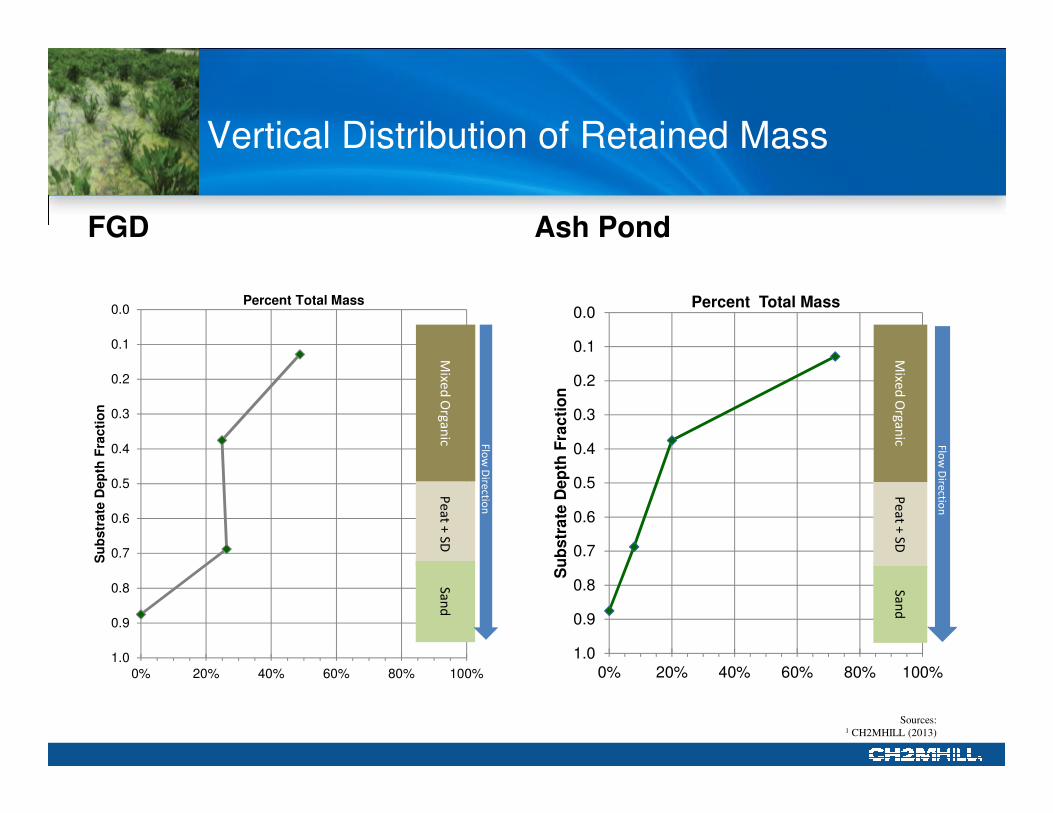
Vertical Distribution of Retained Mass
0.0
0.1
0.2
0.3
0.4
0.5
0.6
0.7
0.8
0.9
1.00% 20% 40% 60% 80% 100%
Su
bstr
ate
Dep
th F
racti
on
Percent Total Mass
Mixe
dO
rga
nic
Pe
at +
SD
Sa
nd
Flo
wD
irectio
n
0.0
0.1
0.2
0.3
0.4
0.5
0.6
0.7
0.8
0.9
1.00% 20% 40% 60% 80% 100%
Su
bs
tra
te D
ep
th F
rac
tio
n
Percent Total Mass
Mixe
dO
rga
nic
Pe
at +
SD
Sa
nd
Flo
wD
irectio
n
Sources: 1 CH2MHILL (2013)

Saline Example: Continuous Se Removal BDL in Mixed Organic Media for RO Membrane Concentrate
0.000
0.005
0.010
0.015
0.020
0.025
0.030
0.035
0.040
0.045
0.050
Co
ncen
trati
on
(m
g/L
)
Bin 2 Influent (RO Conc.) Bin 2 Effluent
TDS ~8 g/L
Se in 20 µg/L
Nitrate-N in 55 mg/L
TDS ~8 g/L
Se in 20 µg/L
Nitrate-N in 55 mg/L
Sources:
CH2MHILL (2012)
Image Source:
Bays, J. (2012)


![Copyright [insert date set by system] by [CH2M HILL Entity] Company Confidential Passive Treatment Systems for the Removal of Selenium: Selenium Removal.](https://static.fdocuments.net/doc/165x107/551abac9550346856e8b541e/copyright-insert-date-set-by-system-by-ch2m-hill-entity-company-confidential-passive-treatment-systems-for-the-removal-of-selenium-selenium-removal.jpg)