Bio-ethanol from cassava waste (ETAVEN, Carabobo, Venezuela)
Ecofys Netherlands BV
P.O. Box 8408
NL-3503 RK Utrecht
Kanaalweg 16-G
NL-3526 KL Utrecht
The Netherlands
W: www.ecofys.com
T: +31 (0)30 280 83 00
F: +31 (0)30 280 83 01
Leen Kuiper
Burcu Ekmekci
Carlo Hamelinck
Willem Hettinga
Sebastian Meyer
Klaas Koop
November 2007
Project number: PBIONL062937
B IO- ETHA NOL FROM CA SSAVA
ETHANOL FROM CASSAVA final version, 04 DECEMBER 2007 II
Preface
The Biomass Upstream Committee (BUS) has organized an annual meeting on No-
vember 20, 2007, to discuss a number of interesting opportunit ies in the field of up-
stream biomass. Topics have been selected by the BUS participants themselves.
The selected themes will contribute to a better understanding of the supply-side of
the emerging market for bio-energy and they will be presented in such a way to
stimulate an open and lively discussion about the feasibility, sustainabi lity and pos-
sible impacts that thei r deployment may have on the envi ronment.
Ecofys has selected the topic “ Bio-ethanol from cassava”. Cassava is grown in
many countries with a warm and moist tropical climate. Cassava yields well on
soils of relatively low fertility where the cultivation of other crops would be uneco-
nomical. Such growth condi tions are widely available throughout the Tropics, es-
pecially in Africa. Cassava is the thi rd largest source of carbohydrates for human
consumption in the world, due to its efficient growth, year round availability, its
tolerance to ext reme stress and its suitability to be incorporated into t raditional low-
input farming systems, which predominate in Africa. Recently, the cultivation of
cassava for the production of ethanol has been intensi fied. In situations where water
availability is limited (i. e. not enough for the cultivation of sugar cane), cassava is
the preferred feedstock for ethanol production.
This new use to make bio-fuels from cassava may affect the development of rural
Africa both in a positive and in a negative way, which was the main reason why
this quick-scan report looks at cassava cropping and utilisation from di fferent an-
gles: general agronomy, suitability as a feedstock for ethanol production, use of co-
products, current status and markets, its economic feasibility in comparison wi th
other ethanol crops and aspects of sustainability. It is the result of a limited quick-
scan performed by 6 members of the Bio Energy group at Ecofys, which implies
that just an overview of the main issues is presented, without going into much de-
tail.
Utrecht, 30 November 2007
ETHANOL FROM CASSAVA final version, 04 DECEMBER 2007 III
Summary
This paper examines the possibilities for ethanol production from cassava: the
cropping system, the technological design of a cassava ethanol plant, the use of
waste st reams for biogas production, the economics of production, current market
and potential for cassava ethanol production and sustainability issues have been ad-
dressed.
Cassava cropping
Cassava is a major source of low costs carbohydrates and a staple food for 500 mil -
lion people in the humid tropics. On infertile land where the cultivation of other
crops is difficult cassava still has a reasonable yield. Numerous cassava cultivar ex-
ist with differences in e.g. size, yield, shape and starch content. Although cassava
can produce a crop with minimal inputs, optimal yields are recorded from fields
with average soil fertility levels (suitable for most food crops) and regular moisture
availability. Young tubers contain much less starch than older tubers, so harvesting
must be delayed until a certain amount of starch is accumulated in the tubers. Be-
cause fresh cassava roots deteriorate rapidly and can only be kept in good condition
for one or two weeks after harvest ing, cassava fields are rarely harvested in one
pass.
Technology
The technology of producing ethanol from starch is internationally well developed.
Cassava i s performing average to good on all processing steps. Under optimal con-
ditions ethanol yield from cassava is the highest of all the main ethanol crops (up to
6 t/ha). M oreover, a cassava ethanol plant requi res less complex processing equip-
ment resulting in lower investments.
Waste streams to biogas
Waste st ream of cassava-ethanol production can be used for the production of bio-
gas. Root fiber represents 30% of the dry weight organic matter and 20% ends up in
the wastewater (stillage). These two sources can be used for biogas production. Per
tonne of fresh cassava root theoretically 42 m3 methane can be ext racted and 28 m
3
from the wastewater. The global potential of biogas production from cassava etha-
nol facili ties is approximately 3,000 million m3 (when assuming theoretically that
all ‘industrial’ cassava is used for ethanol production only). This is equal to 105 PJ
per year.
ETHANOL FROM CASSAVA final version, 04 DECEMBER 2007 IV
Economics
The final costs of ethanol from cassava i s the sum of cassava cultivation, cassava
processing into dried chips and ethanol conversion. Total ex distillery costs are
€0.47 per litre which is about the same as for wheat ethanol. Costs for cassava tuber
production cont ribute most to overall production costs. Taking into account that
imports from APC countries face no import tari ff, cassava ethanol could sell at
competit ive prices in Europe.
Markets
The largest cassava market by far is in Nigeria, responsible for 18% of world cas-
sava production. Other important cassava producing countries are Brazil (upcom-
ing), Indonesia, Thailand, Congo and Mozambique (upcoming). Approximately 2%
of world cassava is traded, mostly in the form of dried chips or pellets. Cassava is
mostly used for food (53%). Feed and seed uses cont ribute 24% and 22% is used
for ‘other uses’ (mainly industrial uses). The latter cassava volumes could be used
for ethanol production in the future. This would avoid compet ition with food. Most
countries that have a large potential for cassava growing, already show industrial
uses of cassava. These countries are: Benin, Mozambique, Ghana, Nigeria, Indone-
sia and Thailand. In these countries also cassava ethanol initiatives have been iden-
ti fied, either existing or planned. Currently approximately 100 kton of cassava etha-
nol is being produced. In the short term this could increase up to 2000 kton i f large
production facilities in Thailand and China start operating and i f Nigeria imple-
ments its ambitious plans for future ethanol product ion. On a global scale 6000
kton of cassava ethanol could be produced per year, when rest ricting to the share of
cassava that is now being used for other indust rial purposes.
Sustainability
In order to assure a sustainable supply chain for ethanol from cassava, price in-
creases of cassava for food purposes have to be avoided. This could take place i f
demand for feed would decrease, but this is not likely to happen. Ethanol produc-
tion could make additional cassava volumes available by drying the volumes which
are now lost due to storage problems. Increasing the yield of exist ing plantat ions or
the planting of cassava on idle land could provide additional cassava volumes des-
ignated to ethanol. For a truly sustainable supply chain ecological criteria have to
be addressed, such as carbon storage in previous land use systems, decreased biodi -
versity, soil quality, water use and water pollution and ai r qual ity. Social criteria,
such as labour conditions and respect to land right. have to be taken into account as
well.
ETHANOL FROM CASSAVA final version, 04 DECEMBER 2007 V
Table of contents
1 In tr od uc t io n 1
1.1 Cassava 1
1.2 Conversion factors 3
1.3 Structure of the report 3
2 C r o pp ing s ys t ems and yi e ld s 3
2.1 Cassava growing 3
2.2 Harvesting 3
2.3 Processing 3
2.4 Agronomic Research & Development 3
3 E t hano l pr o duc t io n t ec hn olo g y 3
3.1 Int roduction 3
3.2 Process description 3
3.3 Comparison with current commercial crops 3
3.4 Green house gas performance 3
4 C as s av a etha no l w as t e to b io g a s 3
4.1 Characteristics and load of waste st reams 3
4.2 Biogas production from stillage 3
4.3 Biogas production from cassava pulp 3
5 E c onom ics 3
5.1 Cassava ethanol production costs 3
5.2 Comparison with ethanol from other feedstock 3
5.3 Ethanol import to the EU from APC countries 3
6 Cu r r en t st a tu s an d m ar k ets 3
6.1 Cassava markets and countries 3
6.2 Status of ethanol production from cassava 3
ETHANOL FROM CASSAVA final version, 04 DECEMBER 2007 VI
6.3 Potential volumes of cassava ethanol 3
7 Sus t ain a bi l i t y i ss ues 3
7.1 Competition between food and ethanol 3
7.2 Ecological and social sustainability aspects 3
8 Co ncl u s ion s 3
Re f er en c es 3
ETHANOL FROM CASSAVA final version, 04 DECEMBER 2007 1
1 I ntr oduc t io n
1 . 1 C as s a va
Cassava (Manihot esculenta), sometimes also called manioc, is the thi rd largest source of
carbohydrates for human consumption in the world, with an estimated annual world pro-
duction of 208 million tonnes. In Africa, which is the largest centre of cassava produc-
tion, it is grown on 7.5 million ha and produces about 60 million tonnes per year. It is a
major source of low cost carbohydrates and a staple food for 500 million people in the
humid t ropics. On infertile land where the cultivation of other crops is difficult, unless
considerable inputs are applied, cassava still has a reasonable yield.
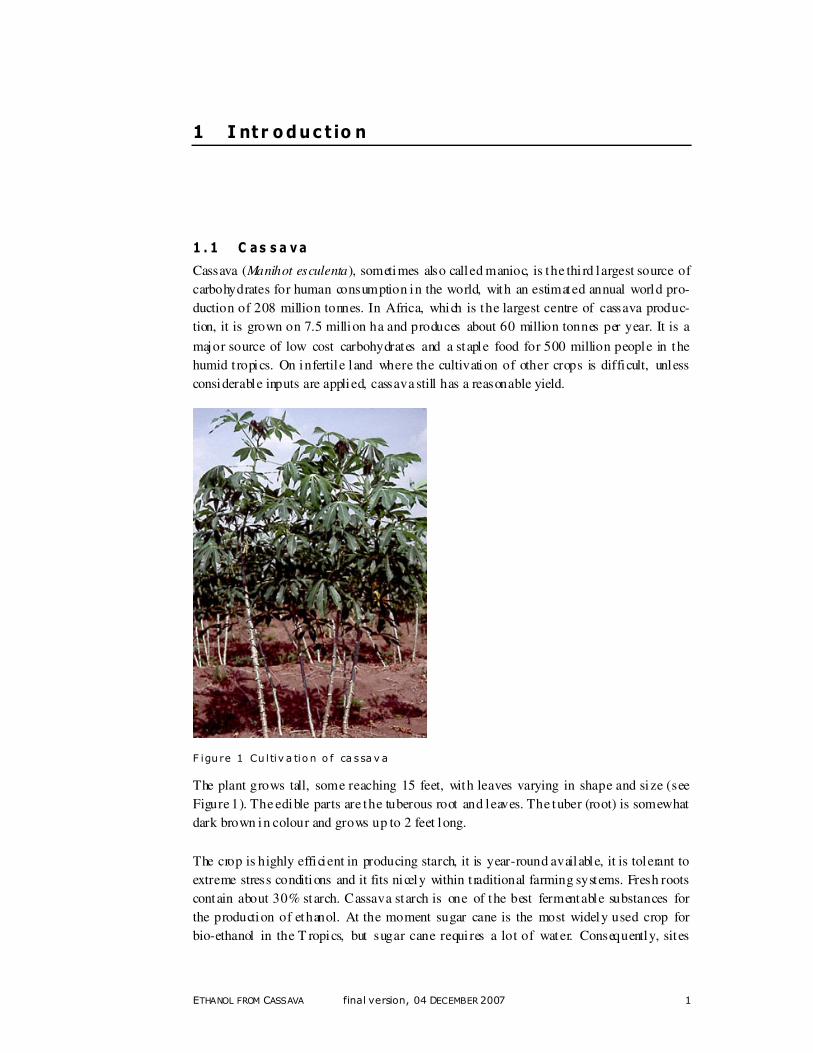
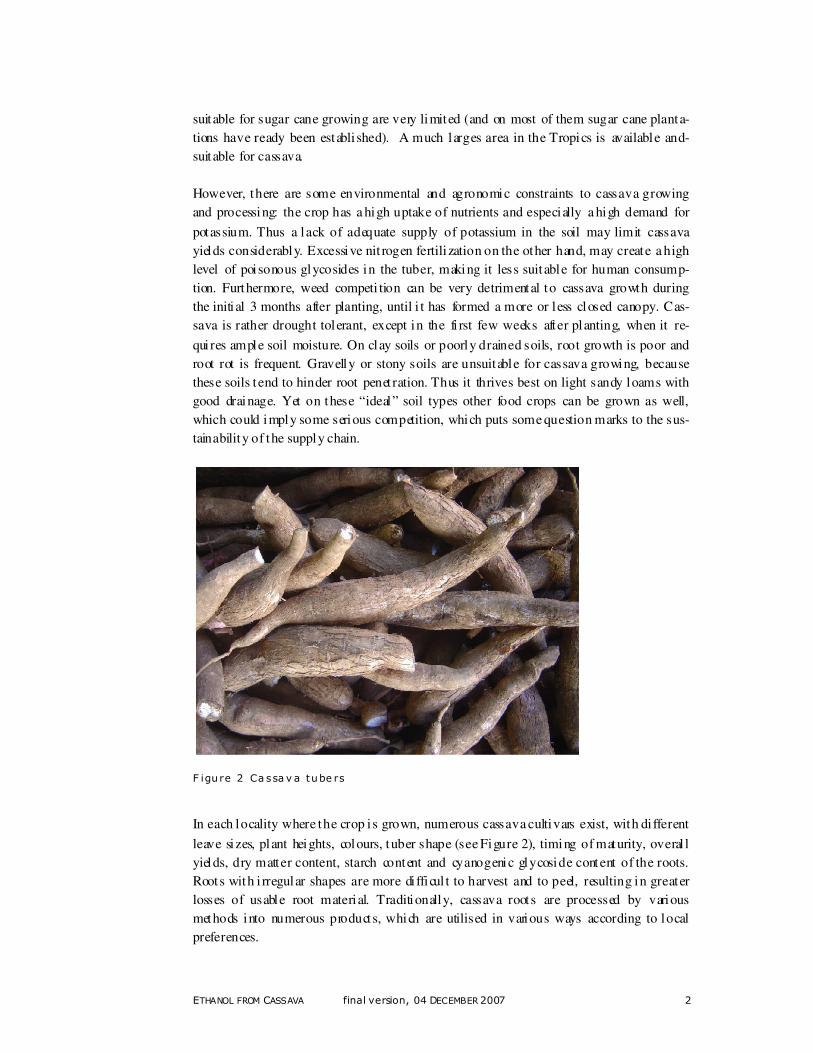
F igu re 1 Cu ltiv a tio n o f ca ssa v a
The plant grows tall, some reaching 15 feet, with leaves varying in shape and size (see
Figure 1). The edible parts are the tuberous root and leaves. The tuber (root) is somewhat
dark brown in colour and grows up to 2 feet long.
The crop is highly efficient in producing starch, it is year-round available, it is tolerant to
extreme stress conditions and it fits nicely within t raditional farming systems. Fresh roots
contain about 30% starch. Cassava starch is one of the best fermentable substances for
the production of ethanol. At the moment sugar cane is the most widely used crop for
bio-ethanol in the T ropics, but sugar cane requi res a lot of water. Consequently, sites
ETHANOL FROM CASSAVA final version, 04 DECEMBER 2007 2
suitable for sugar cane growing are very limited (and on most of them sugar cane planta-
tions have ready been establi shed). A much larges area in the Tropics is available and-
suitable for cassava.
However, there are some environmental and agronomic constraints to cassava growing
and processing: the crop has a high uptake of nutrients and especially a high demand for
potassium. Thus a lack of adequate supply of potassium in the soil may limit cassava
yields considerably. Excessive nit rogen fertilization on the other hand, may create a high
level of poisonous glycosides in the tuber, making it less suitable for human consump-
tion. Furthermore, weed competi tion can be very detrimental to cassava growth during
the initial 3 months after planting, until i t has formed a more or less closed canopy. Cas-
sava is rather drought tolerant, except in the fi rst few weeks after planting, when it re-
qui res ample soil moisture. On clay soils or poorly drained soils, root growth is poor and
root rot is frequent. Gravelly or stony soils are unsuitable for cassava growing, because
these soils tend to hinder root penet ration. Thus it thrives best on light sandy loams with
good drainage. Yet on these “ideal” soil types other food crops can be grown as well,
which could imply some serious competition, which puts some question marks to the sus-
tainability of the supply chain.
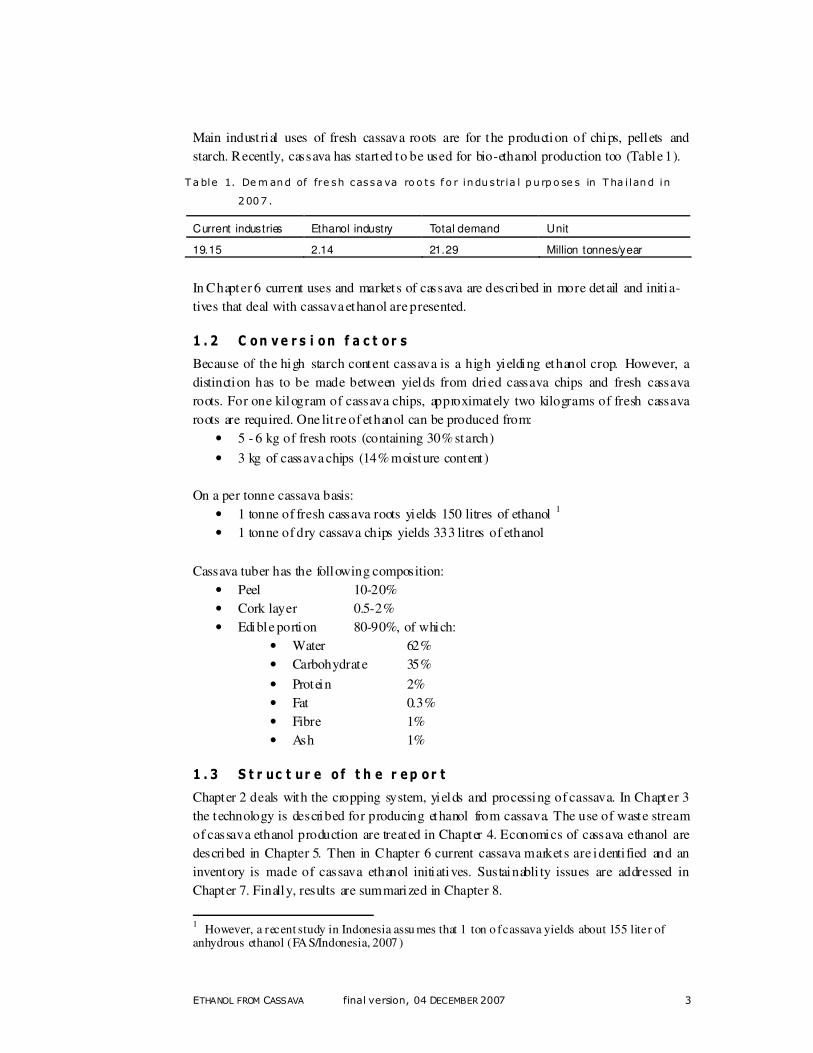
F igu re 2 Ca ssa v a tube rs
In each locality where the crop i s grown, numerous cassava cultivars exist, with di fferent
leave sizes, plant heights, colours, tuber shape (see Figure 2), timing of maturity, overal l
yields, dry matter content, starch content and cyanogenic glycoside content of the roots.
Roots with i rregular shapes are more di fficul t to harvest and to peel, resulting in greater
losses of usable root material. Traditionally, cassava roots are processed by various
methods into numerous products, which are utilised in various ways according to local
preferences.
ETHANOL FROM CASSAVA final version, 04 DECEMBER 2007 3
Main indust rial uses of fresh cassava roots are for the production of chips, pellets and
starch. Recently, cassava has started to be used for bio-ethanol production too (Table 1).
Ta ble 1. Dem and of fre sh cassa va ro o ts f o r industria l p u rpo se s in T ha i land in
2007 .
Current industries Ethanol industry Total demand Unit
19.15 2.14 21.29 Million tonnes/year
In Chapter 6 current uses and markets of cassava are described in more detail and initia-
tives that deal with cassava ethanol are presented.
1 . 2 C on ve r s i on f a c t or s
Because of the high starch content cassava is a high yielding ethanol crop. However, a
distinction has to be made between yields from dried cassava chips and fresh cassava
roots. For one kilogram of cassava chips, approximately two kilograms of fresh cassava
roots are required. One lit re of ethanol can be produced from:
• 5 - 6 kg of fresh roots (containing 30% starch)
• 3 kg of cassava chips (14% moisture content )
On a per tonne cassava basis:
• 1 tonne of fresh cassava roots yields 150 litres of ethanol 1
• 1 tonne of dry cassava chips yields 333 litres of ethanol
Cassava tuber has the following composition:
• Peel 10-20%
• Cork layer 0.5-2%
• Edible portion 80-90%, of which:
• Water 62%
• Carbohydrate 35%
• Protein 2%
• Fat 0.3%
• Fibre 1%
• Ash 1%
1 . 3 S t r uc t ur e o f t h e r ep or t
Chapter 2 deals with the cropping system, yields and processing of cassava. In Chapter 3
the technology is described for producing ethanol from cassava. The use of waste stream
of cassava ethanol production are treated in Chapter 4. Economics of cassava ethanol are
described in Chapter 5. Then in Chapter 6 current cassava markets are identi fied and an
inventory is made of cassava ethanol initiatives. Sustainabli ty issues are addressed in
Chapter 7. Finally, results are summarized in Chapter 8.
1 However, a recent study in Indonesia assu mes that 1 ton o f cassava yields about 155 liter of
anhydrous ethanol (FA S/Indonesia, 2007 )

ETHANOL FROM CASSAVA final version, 04 DECEMBER 2007 4
2 Cro pp in g s ys tems a nd yi e l ds
Cassava, sometimes called manioc, is a t ropical root crop. Traditionally it is grown in a
savannah climate, but is can grow in a wide range of rainfall conditions (1000-2000
mm/a). In dry areas it looses its leaves to conserve moisture and produces new leaves
when rains resume. Under adverse growth conditions it takes about 18 months to produce
a crop; under favourable conditions i t takes 8 months. Cassava tolerates a wide range of
soil pH (4.0 to 8.0). It grows best in the full sun. Under most favourable conditions,
yields of fresh roots can reach 40 tonnes/ha2, while average yields from low-input subsis-
tence agricul ture are 10 tonnes/ha.
2 . 1 C as s a va g r ow i n g
In t raditional agriculture, the most common form of seedbed preparation for cassava
planting i s on mounts or on unploughed land. On unploughed land, no tillage is done
other than requi red to insert the stem cuttings into the soil. The soil can e.g. be opened up
with a machete or hue. In improved agriculture, the land is first ploughed and than har-
rowed. T hereafter cassava may be planted on the flat, on ridges or in furrows. Flat plant -
ings of cassava seem to produce higher yields of tuber than ridge or furrow plantings.
However, flat planting is unsuitable on heavy clay soils, because the tubers tend to rot.
Cassava i s propagated vegetatively as clones. Generally, cuttings are taken from the ma-
ture parts of the stems, which give a better yield than those taken from the younger por-
tion of the stems. The cuttings should have at least 3 nodes, which serve as origins of
shouts and of roots. Recent releases from agricultural breeding programmes include
clones with resistance to many of the major diseases and pests. Cultivar names are usu-
ally based on pigmentation and shape of the leaves, stems and roots. Cultivars may vary
in yield, root diameter and length, disease and pest resistance levels, time to harvest,
temperature adaptation. Storage root colour is usually white, but a few clones have yel -
low-fleshed roots. Each region has its own special clones. Most farmers grow several
clones in a field.
Cassava is planted using 10-30 cm portions of the mature stem as propagules. These stem
cutt ings are sometimes referred to as “ stakes”. The cuttings are planted by hand in moist,
prepared soi l, burying the lower hal f. In Brazil mechanical planters have been developed
to reduce labour costs. Obviously, the top of the cuttings has to be placed up. Typical
plant spacing is 1 x 1 m (i. e. 10,000 plants/ha). In areas of high soil fertility and high
rainfall the plants should be spaced further apart. In Kenya and Uganda, cassava is al -
2 In Brazil, in intensely managed field trial even yields of 80 tonnes of tubers/ha have been reported
ETHANOL FROM CASSAVA final version, 04 DECEMBER 2007 5
ways accompanied by intercrops such as maize, beans, millet and sesame. In traditional
agriculture where intercropping is practised, planting i s often delayed until the later part
of the rainy season when the intercrops are nearly ready for harvest.
Cuttings produce roots within a few days and new shoots appear soon afterwards. Early
growth i s relatively slow, thus weeds must be cont rolled during the fi rst few months. Al-
though cassava can produce a crop with minimal inputs, optimal yields are recorded from
fields with average soil fertility levels (suitable for most food crops) and regular moisture
availability.
Cassava responds well to P and K fertilisation. Vascular-arbuscular mycorrhizae benefit
cassava by supplying phosphorus to the roots. High N fert ilizat ion (more than 100 kg
N/ha), however, may result in excessive foliage production at the expense of root devel -
opment. Fertilizer is only applied during the fi rst few months of growth. Plants are ready
for harvest as soon as the storage roots are large enough to meet the requi rements of the
consumer. Typically, harvesting can begin eight months after planting. In the t ropics,
plants can remain unharvested for more than one growing season, allowing the storage
roots to enlarge further. However, as the roots age, the cent ral portion becomes woody
and inedible.
2 . 2 H a r ve s t i n g
Most cassava is harvested by hand, li fting the lower part of the stem and pulling the roots
out of the ground. The roots are than removed from the base of the stem by hand. Fre-
quently before harvest, the upper parts of the stems with the leaves are cut off to a few
centimetres from the ground. In Brazil and M exico a mechanical harvester has been de-
veloped and mechanical harvesters are being tested out in other parts of the world as
well. It grabs onto the stem and lifts the roots from the ground. During the harvest ing
process, care must be taken to minimize damage to the roots, as this greatly reduces shel f
li fe. During the harvesting process, the stem cuttings for the next crop are selected.
Young tubers contain much less starch than older tubers, so harvesting must be delayed
until a certain amount of starch is accumulated in the tubers. Because fresh cassava roots
deteriorate rapidly and can only be kept in good condition for one or two weeks after har-
vesting, cassava fields are rarely harvested in one pass. The best timing of harvest ing
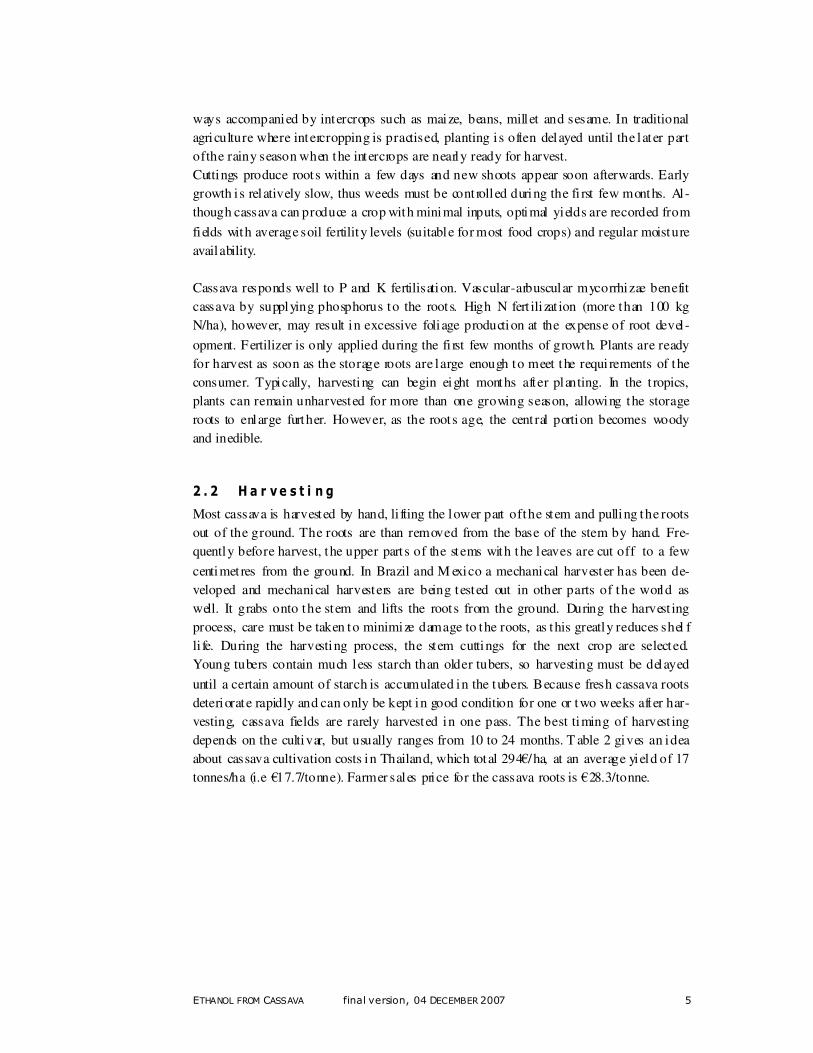
depends on the cultivar, but usually ranges from 10 to 24 months. T able 2 gives an idea
about cassava cultivation costs in Thailand, which total 294€/ha, at an average yield of 17
tonnes/ha (i.e €17.7/tonne). Farmer sales price for the cassava roots is €28.3/tonne.
ETHANOL FROM CASSAVA final version, 04 DECEMBER 2007 6
Ta b le 2 . C o sts of cassav a g rowing in T hai la nd in 2005 ( So urce: Of f ice of Ag ri
cu l tura l E conomics, 20053)
Variable costs 255
1. Labour costs 150
- land preparation 37
- planting 18
- weed control 45
- harv esting 50
2. Material costs 82
- planting stock 25
- fertilisers 36
- herbicides 18
- fuel 0.8
- other 0.5
3. Miscellaneous costs 23
- maintenance and reparation 0.2
- interest 23
Fixed costs 39
- Land rent 36
- Depreciation 2
- Interest 1
Total production costs (€/ha) 294
Production cost per tonne 17.7
Yield in tonnes/ha 17
Sales price/tonne 28.3
2 . 3 P r o c e s s i n g
The shel f li fe of fresh cassava roots i s only a few days. Removing the leaves two weeks
before harvest, increases the shel f l i fe to two weeks. Traditional methods to keep the
roots in good condition include packing the roots in moist mulch. The roots can also be
dipped in paraffin or in wax or stored in plastic bags. Fresh roots for human consumpt ion
can be peeled and frozen. Fresh roots can be sliced thinly and deep fried to make a prod-
uct similar to potato chips. Dried roots can be milled into flour, which can be used for
baking breads. Typically, cassava four may be used as partial substitute for wheat flour in
making bread.
Cassava chips industry
In Thailand, which exploits the indust rial prospects of cassava on a large scale, cassava
chip factories usually are small-scale enterprises, located in close proximity to the cas-
3 Sriroth, K et al. 2006. Present situation and future potential of cassava in Thailand.
ETHANOL FROM CASSAVA final version, 04 DECEMBER 2007 7
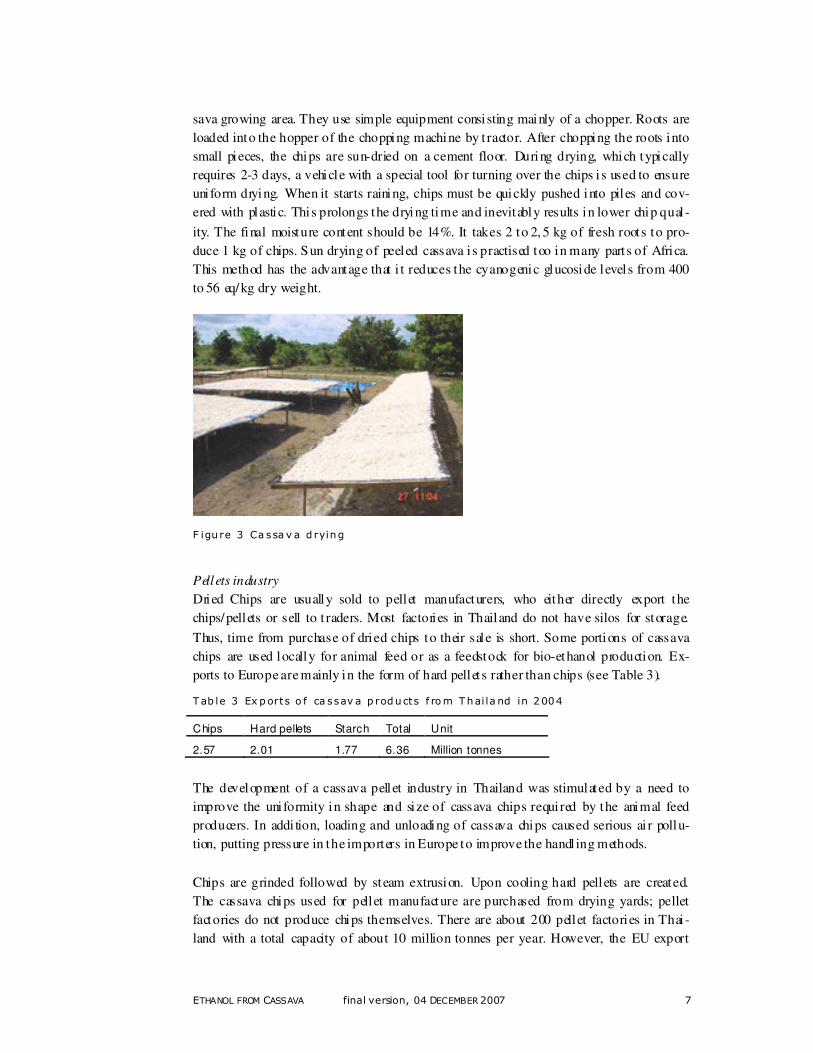
sava growing area. They use simple equipment consisting mainly of a chopper. Roots are
loaded into the hopper of the chopping machine by t ractor. After chopping the roots into
small pieces, the chips are sun-dried on a cement floor. During drying, which typically
requires 2-3 days, a vehicle with a special tool for turning over the chips i s used to ensure
uni form drying. When it starts raining, chips must be quickly pushed into piles and cov-
ered with plastic. This prolongs the drying time and inevitably results in lower chip qual -
ity. The final moisture content should be 14%. It takes 2 to 2, 5 kg of fresh roots to pro-
duce 1 kg of chips. Sun drying of peeled cassava i s practised too in many parts of Africa.
This method has the advantage that i t reduces the cyanogenic glucoside levels from 400
to 56 eq/kg dry weight.
F igu re 3 Ca ssa v a d rying
Pellets industry
Dried Chips are usually sold to pellet manufacturers, who either directly export the
chips/pellets or sell to t raders. Most factories in Thailand do not have silos for storage.
Thus, time from purchase of dried chips to their sale is short. Some portions of cassava
chips are used locally for animal feed or as a feedstock for bio-ethanol production. Ex-
ports to Europe are mainly in the form of hard pellets rather than chips (see Table 3).
Tab le 3 Ex ports o f ca ssav a p roducts f rom Thai la nd in 2004
Chips Hard pellets Starch Total Unit
2.57 2.01 1.77 6.36 Million tonnes
The development of a cassava pellet industry in Thailand was stimulated by a need to
improve the uni formity in shape and size of cassava chips requi red by the animal feed
producers. In addi tion, loading and unloading of cassava chips caused serious ai r pollu-
tion, putting pressure in the importers in Europe to improve the handl ing methods.
Chips are grinded followed by steam extrusion. Upon cooling hard pellets are created.
The cassava chips used for pellet manufacture are purchased from drying yards; pellet
factories do not produce chips themselves. There are about 200 pellet factories in Thai -
land with a total capacity of about 10 million tonnes per year. However, the EU export
ETHANOL FROM CASSAVA final version, 04 DECEMBER 2007 8
quota is only 5 mill ion tonnes and this is the sole market for the product. Thus the T hai
pellet factories are only working at 50% of their capacity.
Starch industry
Cassava starch may be produced from fresh roots, by grating the roots, mixing with wa-
ter, followed by sedimentat ion and sun-drying or by conductive heating. The st rong in-
creased demand for cassava starch has lead to a modern starch manufacturing process, in
which the processing time from the grating of fresh roots to dried starch is less than 30
minutes. About 4.8 tonnes of fresh roots produce one tonne of dry starch. 40 percent of
the cassava starch produced in Thai land is used domestically (800,000 tonnes) and 60 %
is exported by the Thai T apioca Flour Indust ries Association. In 2004 about 1.77 mill ion
tonnes of starch was exported. Of the various cassava-based products mainly cassava
starch and pellets are exported. In the future, starch exports are expected to increase in
volume due to the internat ional starch market expansion.
Diseases
About 30 diseases of cassava are known. In many regions cassava is normally not much
affected by diseases or pests. However, in other areas it may be attacked by virus dis-
eases (mosaic, brown st reak and leaf curl viruses) and bacterial diseases such as Phyto-
monas manihotis, Bacterium cassava and Bacterium solanacearum. In Africa the cassava
mealybug (Phenacoccus manihoti ) and cassava green mite (Mononychellus tanajoa) can
cause up to 80% crop loss, which is ext remely det rimental to the production of
subsistence farmers. These pests were rampant in the 1970s and 1980s but were brought
under control following the establi shment of the Biological Control Centre for Africa.
The cassava mosaic virus causes the leaves of the cassava plant to wither, limiting the
growth of the root. The virus is spread by the whitefly and by the transplanting of dis-
eased plants into new fields. Sometime in the late 1980s, a mutat ion occurred in Uganda
that made the vi rus even more harmful, causing the complete loss of leaves. This mutated
virus has been spreading at a rate of 50 miles per year, and as of 2005 may be found
throughout Uganda, Rwanda, Burundi and Congo.
2 . 4 A g r on o m i c R e s e a r c h & D e v e l o p m en t
The development of high-yielding variet ies of cassava has significantly increased produc-
tion in many countries. In Ghana, the int roduction of improved varieties helped boost the
cassava harvest by nearly 40 percent between 1980 and 1996. The International Center
for T ropical Agriculture (CIAT) and the International Institute of T ropical Agriculture
(IIT A) are playing a leading role in developing improved cassava varieties and preserv-
ing the genetic diversity of this important staple crop4. On average, African farmers pro-
duce about 10 tonnes of cassava per hectare, but yields can reach as high as 40 tonnes per
hectare. It i s estimated that the introduction of high-yielding varieties, improved pest and
disease control and better processing methods could increase cassava production in Af-
4 http://www.fao.org/N EWS/2000/000405-e.ht m
ETHANOL FROM CASSAVA final version, 04 DECEMBER 2007 9
rica by 150 percent. In a recent article in Plant Biotechnology Journal5 it was reported
that cassava has one of the highest rates of CO2 fixation and sucrose synthesis for any C3
plant. With this in mind, researchers from Ohio State University develop t ransgenic cas-
sava with starch yields up 2.6 times higher than normal plants by increasing the sink
strength for carbohydrate in the crop. This means cassava makes a 'super crop' when it
comes to both CO2 fixation and carbohydrate production. Commercial cassava producers
and processors need to find ways of increasing production, reducing labour costs and im-
proving product quality in order to be able to compete with grains.
In Africa and Latin America, the domestic market for cassava-based animal feed shows
potent ial for growth. More than 30 percent of the cassava produced in Latin America is
used for domestic animal feed, compared to less than 2 percent in Africa. Research in
Cameroon has shown that poult ry breeders could lower thei r production costs by 40 per-
cent by incorporating cassava into their chicken feed.
In Asia, Thailand leads the way in the production of starches derived from cassava. Cas-
sava starch has unique properties, such as its high viscosity and its resistance to freezing,
which make it competitive with other indust rial starches.
5 Plant Biotechnology Journ al, Volu me 4/Issue 4, July 2006
ETHANOL FROM CASSAVA final version, 04 DECEMBER 2007 10
3 E than ol p r odu ct i o n te ch nolo gy
3 . 1 I nt r o d u c t i on
Ethanol is t radit ional ly produced from feedstock high in sugar and/or starch content. A
third possible feedstock is lingo-cellulose. These obsolete feedstocks are attractive, but
the technology to convert cellulosic material to ethanol (sometimes referred to as ‘second
generation’) is not yet commercially available. Most used feedstocks for fuel ethanol are
wheat, corn, sugar cane and sugar beet. The sugars can be fermented to ethanol, while
starch fi rst has to be hydrolyzed to obtain free sugars. Next, the sugars are fermented to
ethanol which is followed by a purification step yielding pure ethanol.
The process of extracting starch from cassava is a well-known technology. Cassava has
been used as source of starch for decades. Cassava is high in starch content (70 – 85%,
dry base / 28 – 35% wet base) and the starch from cassava is of a high quality compared
to other starch sources. Cassava starch is used as raw material in many indust ries, among
which paper-, food- and texti le indust ries. Also the technology of producing ethanol from
starch is internationally well -developed.
3 . 2 P r o c e s s d e s c r i p t i o n
After harvesting, the roots are chopped into chips and t ransported to drying floors. The
roots are usually dried in the sun. Once the chips are dried, they can be stored for months.
However, during storage, the starch yield decreases somewhat, depending on storage
temperature: typical ly 5% reduction of starch yield in 8 month storage (Abera et al,
2007). Another advantage of chips i s the easy transport.
A big advantage of cassava over many other t raditional crops is that it can be grown and
harvested throughout the year. T his results in a constant supply of cassava to the ethanol
production facility in contrast to more seasonally crops.
The ethanol production process consists of three basic steps are (T able 4).
Tab le 4 : M a in s te p s in ethano l p roductio n f rom sta rch
Step Goal Type of process
Milling and liquef action Breaking down starch molecules into
its building block molecules: glucose
Enzy matic
Fermentation Convert glucose to ethanol Y east
Purif ication Separate ethanol from other reaction
products and inert materials
Distillation
ETHANOL FROM CASSAVA final version, 04 DECEMBER 2007 11
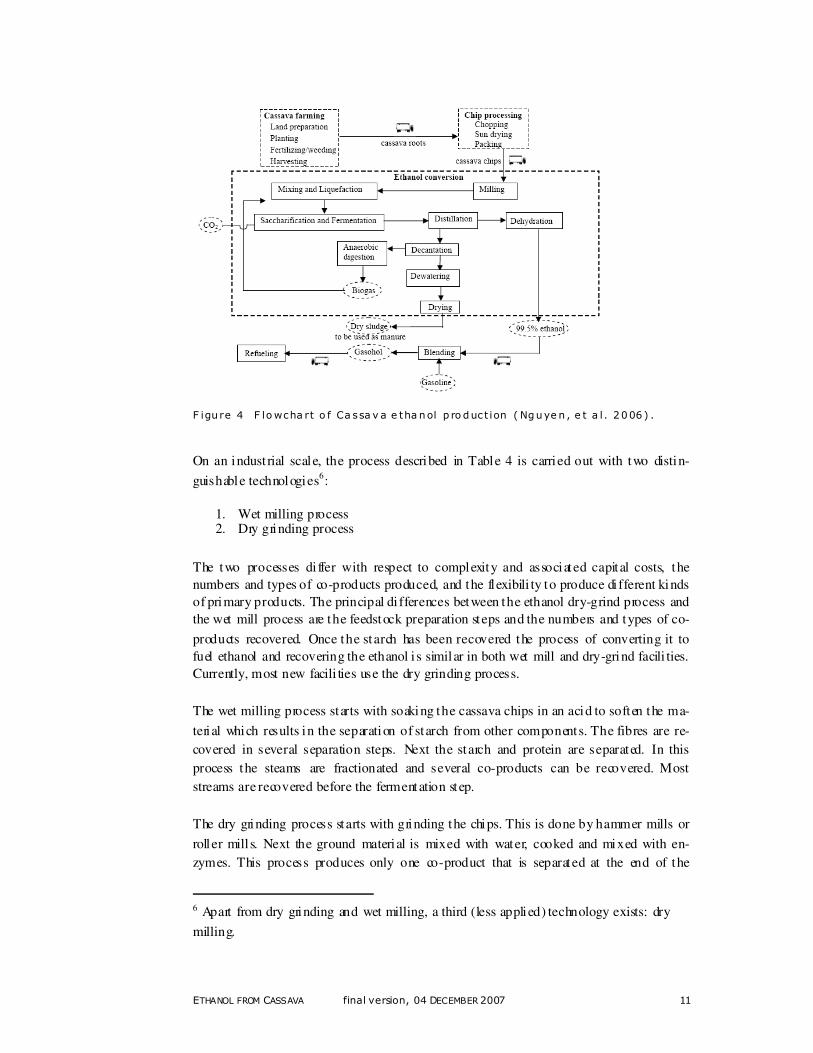
F igu re 4 F lowcha rt o f Ca ssa v a e tha nol p ro duct ion ( Nguye n , e t a l . 2006) .
On an indust rial scale, the process described in Table 4 is carried out with two distin-
guishable technologies6:
1. Wet milling process 2. Dry grinding process
The two processes di ffer with respect to complexity and associated capital costs, the
numbers and types of co-products produced, and the flexibili ty to produce di fferent kinds
of primary products. The principal di fferences between the ethanol dry-grind process and
the wet mill process are the feedstock preparation steps and the numbers and types of co-
products recovered. Once the starch has been recovered the process of converting it to
fuel ethanol and recovering the ethanol i s similar in both wet mill and dry-grind facili ties.
Currently, most new facili ties use the dry grinding process.
The wet milling process starts with soaking the cassava chips in an acid to soften the ma-
terial which results in the separation of starch from other components. The fibres are re-
covered in several separation steps. Next the starch and protein are separated. In this
process the steams are fractionated and several co-products can be recovered. Most
streams are recovered before the fermentation step.
The dry grinding process starts with grinding the chips. This is done by hammer mills or
roller mill s. Next the ground material is mixed with water, cooked and mixed with en-
zymes. This process produces only one co-product that is separated at the end of the
6 Apart from dry grinding and wet milling, a third (less applied) technology exists: dry
milling.
ETHANOL FROM CASSAVA final version, 04 DECEMBER 2007 12
whole process, after fermentation: distiller dried grains with solubles. This is mostly used
as animal feed. The use as animal feed is, however, limited due to the high fibre content.
3 . 3 C o mp ar i s o n wi t h c u r r e nt c o mm e r c i al c r o p s
The process of producing ethanol from cassava i s almost the same as for starchy crops
like corn and wheat. However, there are also some di fferences in the processing.
The ethanol yield is determined by the efficiencies of several consecutive processing
steps along the production chain. These factors di ffer from crop to crop. There is not a
single crop performing best at all these steps. Cassava is performing average to good on
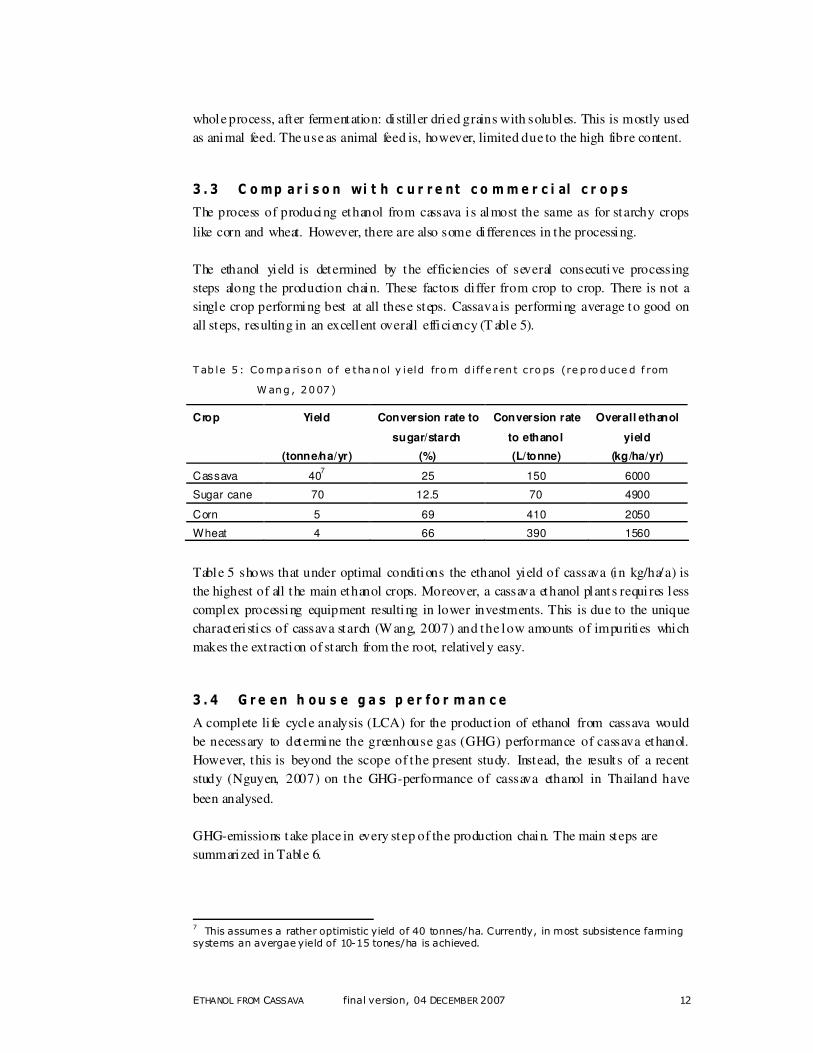
all steps, resulting in an excellent overall efficiency (T able 5).
Tab le 5 : Compa riso n o f e tha nol y ield from d i ff e ren t c ro ps (re p ro duce d f rom
Wang , 2007)
Crop Yield
(tonne/ha/yr)
Conversion rate to
sugar/starch
(%)
Conversion rate
to ethanol
(L/tonne)
Overall ethanol
yield
(kg/ha/yr)
Cassava 407 25 150 6000
Sugar cane 70 12.5 70 4900
Corn 5 69 410 2050
Wheat 4 66 390 1560
Table 5 shows that under optimal conditions the ethanol yield of cassava (in kg/ha/a) is
the highest of all the main ethanol crops. Moreover, a cassava ethanol plants requi res less
complex processing equipment resulting in lower investments. This is due to the unique
characteri stics of cassava starch (Wang, 2007) and the low amounts of impurities which
makes the ext raction of starch from the root, relatively easy.
3 . 4 G r e en h ou s e g a s p e r f o r m an c e
A complete li fe cycle analysis (LCA) for the product ion of ethanol from cassava would
be necessary to determine the greenhouse gas (GHG) performance of cassava ethanol.
However, this is beyond the scope of the present study. Instead, the result s of a recent
study (Nguyen, 2007) on the GHG-performance of cassava ethanol in Thailand have
been analysed.
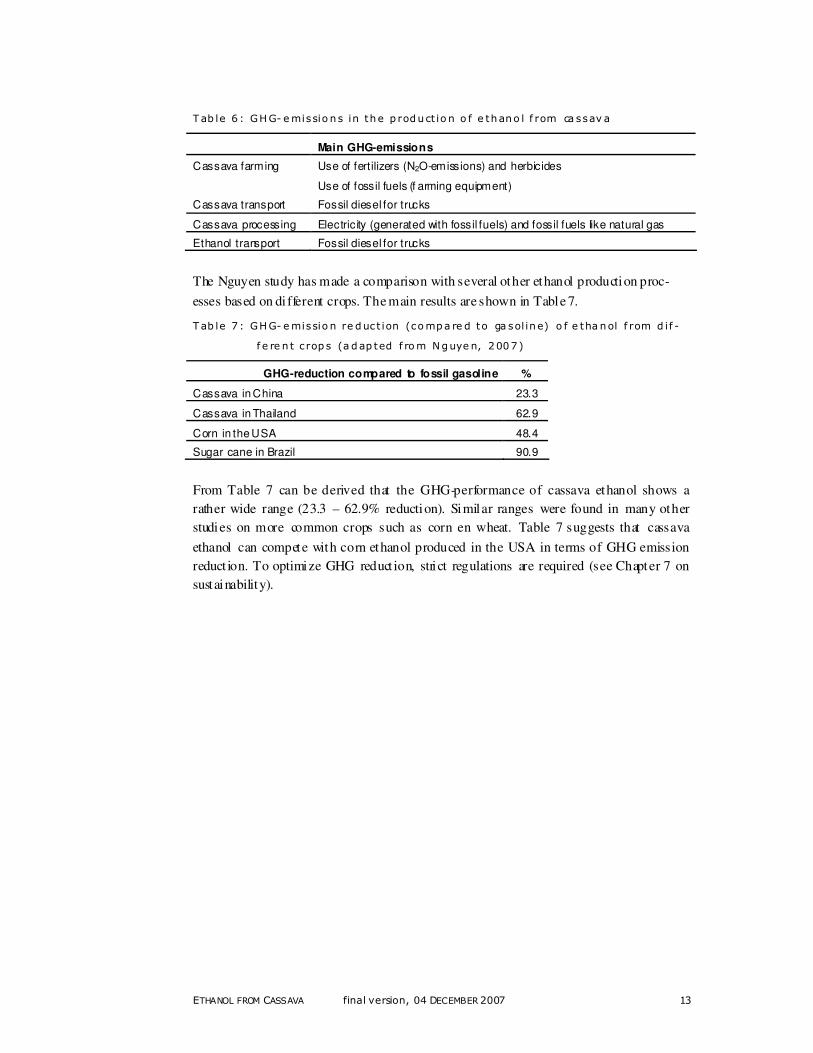
GHG-emissions take place in every step of the production chain. The main steps are
summarized in Table 6.
7 This assumes a rather optimistic yield of 40 tonnes/ha. Currently, in most subsistence farming systems an avergae yield of 10-15 tones/ha is achieved.
ETHANOL FROM CASSAVA final version, 04 DECEMBER 2007 13
T ab le 6 : GHG- emissio ns in the p roduct io n o f e thano l f rom ca ssav a
Main GHG-emissions
Cassava farming Use of fertilizers (N2O-emissions) and herbicides
Use of fossil fuels (f arming equipment)
Cassava transport Fossil diesel for trucks
Cassava processing Electricity (generated with fossil fuels) and fossil fuels like natural gas
Ethanol transport Fossil diesel for trucks
The Nguyen study has made a comparison with several other ethanol production proc-
esses based on di fferent crops. The main results are shown in Table 7.
Tab le 7 : GHG- emissio n re duct ion (compa re d to ga sol ine) o f e tha nol f rom d i f -
f e re n t c rop s (a dap ted f rom Nguye n, 2007)
GHG-reduction compared to fossil gasoline %
Cassava in China 23.3
Cassava in Thailand 62.9
Corn in the USA 48.4
Sugar cane in Brazil 90.9
From Table 7 can be derived that the GHG-performance of cassava ethanol shows a
rather wide range (23.3 – 62.9% reduction). Similar ranges were found in many other
studies on more common crops such as corn en wheat. Table 7 suggests that cassava
ethanol can compete with corn ethanol produced in the USA in terms of GHG emission
reduct ion. To optimize GHG reduct ion, strict regulations are required (see Chapter 7 on
sustainability).
ETHANOL FROM CASSAVA final version, 04 DECEMBER 2007 14
4 Cassa va e thano l was te to bi oga s
This chapter explores the possibilities of using cassava ethanol waste streams for biogas
production. Two options are assessed: biogas from ethanol stillage and biogas from root
cake (cassava pulp).
4 . 1 C h a r a c t e r i s t i c s o f w as t e s t r ea ms
The production of ethanol from biomass, whether from sugar crops (sugar beets, sugar
cane, molasses, etc.), starch crops (corn, wheat, rice, cassava, etc. ), dairy products (whey)
or cellulosic materials (crop residues, herbaceous energy crops, bagasse, wood, or mu-
nicipal solid waste) causes the concurrent production of stillage that shows a considerable
pollution potential (Sheehan and Greenfield, 1980; Wilkie et al., 2000). Stillage (also
termed distillery waste water, distillery pot ale, distillery spent wash, dunder, mosto, vi -
nasse and thin stillage), i s the aqueous by-product from the distillation of ethanol follow-
ing fermentation of carbo-hydrates.
A mass balance for cassave shows the following result s with respect to available organic
material from the processing of cassava roots: 1 ton of fresh root contains 400 kg dry
mat ter. During processing about hal f of this amount is recovered as starch. Root fiber
represents 30% of the organic matter and 20% ends up in the wastewater (stillage).
When assuming a COD8 to dry matter ratio of about 1:1, per ton raw cassava root theo-
retical ly 42 m3 methane (1. 5 GJ) can be ext racted and 28 m
3 from the wastewater (1.0
GJ). Of course, we have to take into consideration that the root fiber is more ‘ digestible’
than the wastewater, with COD conversion efficiencies ranging from 60-90% for the
stillage (depending on composition and other factors) and up to 95% for the root fiber.
For each liter of ethanol produced, up to 20 liters of stillage may be generated (Wilkie et
al., 2000). The characteristics of the stillage vary considerably according to the fermenta-
tion feedstock and to location. In addition to this, wash water used to clean the ferment-
ers, cooling water blow down might cont ribute as well to stillage variability (Wilkie et
al., 2000; Sheehan and Greenfield, 1980; Pant and Adholeya, 2007).
In general, stillage has low pH, high temperature, dark brown colour, high ash content
and high percentage of dissolved organic and inorganic matter (Belt ran et al., 2001). The
biochemical oxygen demand (BOD) and chemical oxygen demand (COD) range between
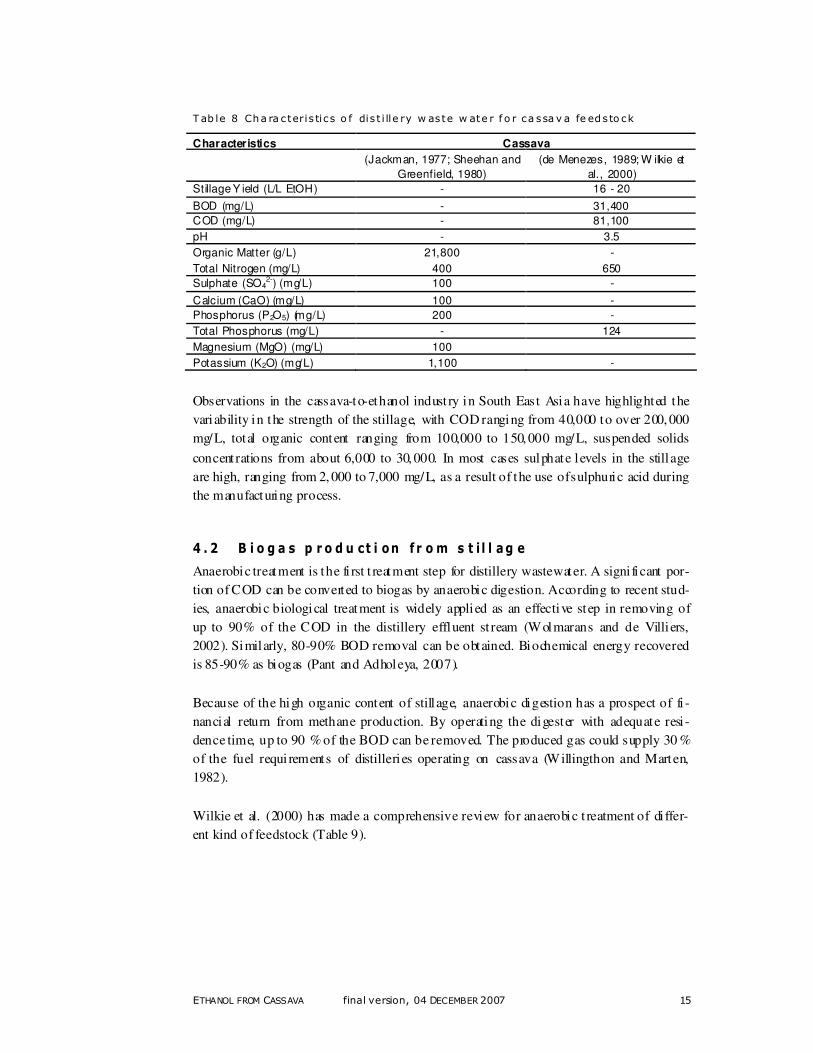
35,000 – 50, 000 and 100,000-150,000 mg/L, respect ively (Nandy et al., 2002). Table 8
shows the distil lery wastewater characteristics for cassava.
8 COD= cemical oxigen demand; BOD = bio-chemican oxigen demand
ETHANOL FROM CASSAVA final version, 04 DECEMBER 2007 15
T ab le 8 Cha ra c teris tics o f dis t i lle ry w aste w ate r f o r ca ssa v a fe ed sto ck
Characteristics Cassava
(Jackman, 1977; Sheehan and
Greenfield, 1980)
(de Menezes, 1989; W ilkie et
al., 2000)
Stillage Y ield (L/L EtOH) - 16 - 20
BOD (mg/L) - 31,400
COD (mg/L) - 81,100
pH - 3.5
Organic Matter (g/L) 21,800 -
Total Nitrogen (mg/L) 400 650
Sulphate (SO42-) (mg/L) 100 -
Calcium (CaO) (mg/L) 100 -
Phosphorus (P2O5) (mg/L) 200 -
Total Phosphorus (mg/L) - 124
Magnesium (MgO) (mg/L) 100
Potassium (K2O) (mg/L) 1,100 -
Observations in the cassava-to-ethanol indust ry in South East Asia have highlighted the
variability in the strength of the stillage, with COD ranging from 40,000 to over 200, 000
mg/L, total organic content ranging from 100,000 to 150, 000 mg/L, suspended solids
concent rations from about 6,000 to 30, 000. In most cases sulphate levels in the stillage
are high, ranging from 2, 000 to 7,000 mg/L, as a result of the use of sulphuric acid during
the manufacturing process.
4 . 2 B i o g a s p r o d u ct i on f r o m s t i l l ag e
Anaerobic treatment is the fi rst t reatment step for distillery wastewater. A signi ficant por-
tion of COD can be converted to biogas by anaerobic digestion. According to recent stud-
ies, anaerobic biological treatment is widely applied as an effective step in removing of
up to 90% of the COD in the distillery effluent st ream (Wolmarans and de Villiers,
2002). Similarly, 80-90% BOD removal can be obtained. Biochemical energy recovered
is 85-90% as biogas (Pant and Adholeya, 2007).
Because of the high organic content of stillage, anaerobic digestion has a prospect of fi -
nancial return from methane production. By operating the digester with adequate resi -
dence time, up to 90 % of the BOD can be removed. The produced gas could supply 30 %
of the fuel requi rements of distilleries operating on cassava (Willingthon and Marten,
1982).
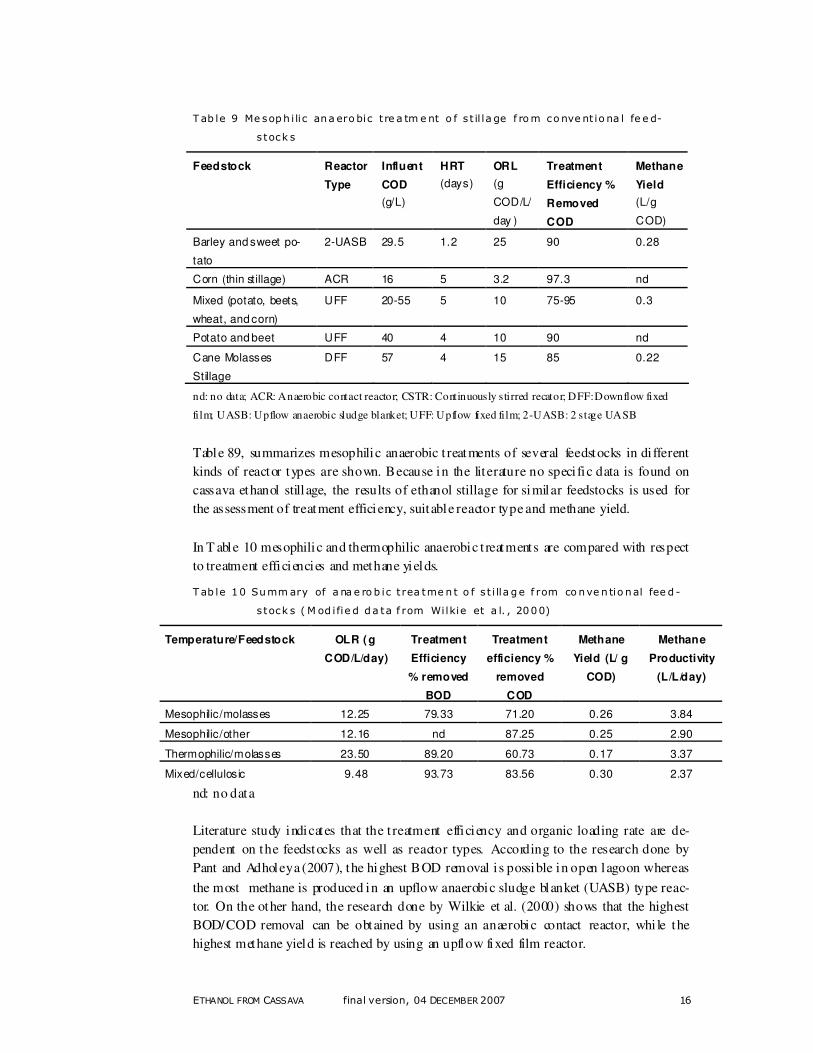
Wilkie et al. (2000) has made a comprehensive review for anaerobic t reatment of di ffer-
ent kind of feedstock (Table 9).
ETHANOL FROM CASSAVA final version, 04 DECEMBER 2007 16
T ab le 9 Me soph i lic ana ero bic t re a tm e nt o f s t il la ge f rom co nve nt io na l fe e d-
s tock s
Feedstock Reactor
Type
Influent
COD
(g/L)
HRT
(days)
ORL
(g
COD/L/
day )
Treatment
Efficiency %
Removed
COD
Methane
Yield
(L/g
COD)
Barley and sweet po-
tato
2-UASB 29.5 1.2 25 90 0.28
Corn (thin stillage) ACR 16 5 3.2 97.3 nd
Mixed (potato, beets,
wheat, and corn)
UFF 20-55 5 10 75-95 0.3
Potato and beet UFF 40 4 10 90 nd
Cane Molasses
Stillage
DFF 57 4 15 85 0.22
nd: no data; ACR: Anaerobic contact reactor; CSTR: Continuously stirred recator; DFF: Downflow fixed
film; UASB: Upflow anaerobic sludge blanket; UFF: Upflow fixed film; 2-UASB: 2 stage UASB
Table 89, summarizes mesophilic anaerobic t reatments of several feedstocks in di fferent
kinds of reactor types are shown. Because in the literature no speci fic data is found on
cassava ethanol stillage, the results of ethanol stillage for similar feedstocks is used for
the assessment of treatment efficiency, suitable reactor type and methane yield.
In T able 10 mesophilic and thermophilic anaerobic t reatments are compared with respect
to treatment efficiencies and methane yields.
Tab le 10 Summ ary of a na e ro b ic t rea tme n t o f s t i lla g e f rom co nve n tio nal fee d -
s tock s ( M od i fie d d a ta f rom Wi lkie et a l. , 2000)
Temperature/Feedstock OLR ( g
COD/L/day)
Treatment
Efficiency
% removed
BOD
Treatment
efficiency %
removed
COD
Methane
Yield (L/ g
COD)
Methane
Productivity
(L/L/day)
Mesophilic/molasses 12.25 79.33 71.20 0.26 3.84
Mesophilic/other 12.16 nd 87.25 0.25 2.90
Thermophilic/molasses 23.50 89.20 60.73 0.17 3.37
Mixed/cellulosic 9.48 93.73 83.56 0.30 2.37
nd: no data
Literature study indicates that the t reatment efficiency and organic loading rate are de-
pendent on the feedstocks as well as reactor types. According to the research done by
Pant and Adholeya (2007), the highest BOD removal i s possible in open lagoon whereas
the most methane is produced in an upflow anaerobic sludge blanket (UASB) type reac-
tor. On the other hand, the research done by Wilkie et al. (2000) shows that the highest
BOD/COD removal can be obtained by using an anaerobic contact reactor, whi le the
highest methane yield is reached by using an upflow fixed film reactor.
ETHANOL FROM CASSAVA final version, 04 DECEMBER 2007 17
The methane yield of the stillage ranges between 0.22 and 0. 30 for mesophilic anaerobic
treatment. The methane yield and treatment efficiency for thermophilic anaerobic t reat -
ment is lower than mesophilic ones.
4 . 3 B i o g a s p r o d u ct i on f r o m c as s av a p u l p
Cassava pulp (also called root cake) is a residue which remains after the extraction of
starch from the grinded root. The material consists of fine part icles and can be easily di -
gested. Root cake has a dry matter content of about 20%. Own research has shown that
the COD equivalent of pulp ranges between 1.0 and 1.3 kg per kg dry matter. This would
translate in about 350-450 m3 methane per ton dry matter or 580-750 m3 biogas. In other
words, the calculation suggests that 70 m3 methane can be extracted from one ton cassava
pulp.
Based on a literature study and practical experience of Ecofys, the potential of biogas
production from cassava with respect to the cassava growing region has been analysed.
The biogas potential is estimated by taking the share of cassava production that goes to
‘other purposes’ (see Chapter 6), which is mostly for industrial uses. In the future these
amounts of cassava could become available for ethanol production. In this way ethanol
can compete with other industrial uses (e.g. starch production) and wil l not compete with
uses for food and feed, which would have consequence for the sustainability (see Chapter
7). Countries have been selected that show large cassava-ethanol potential. With these
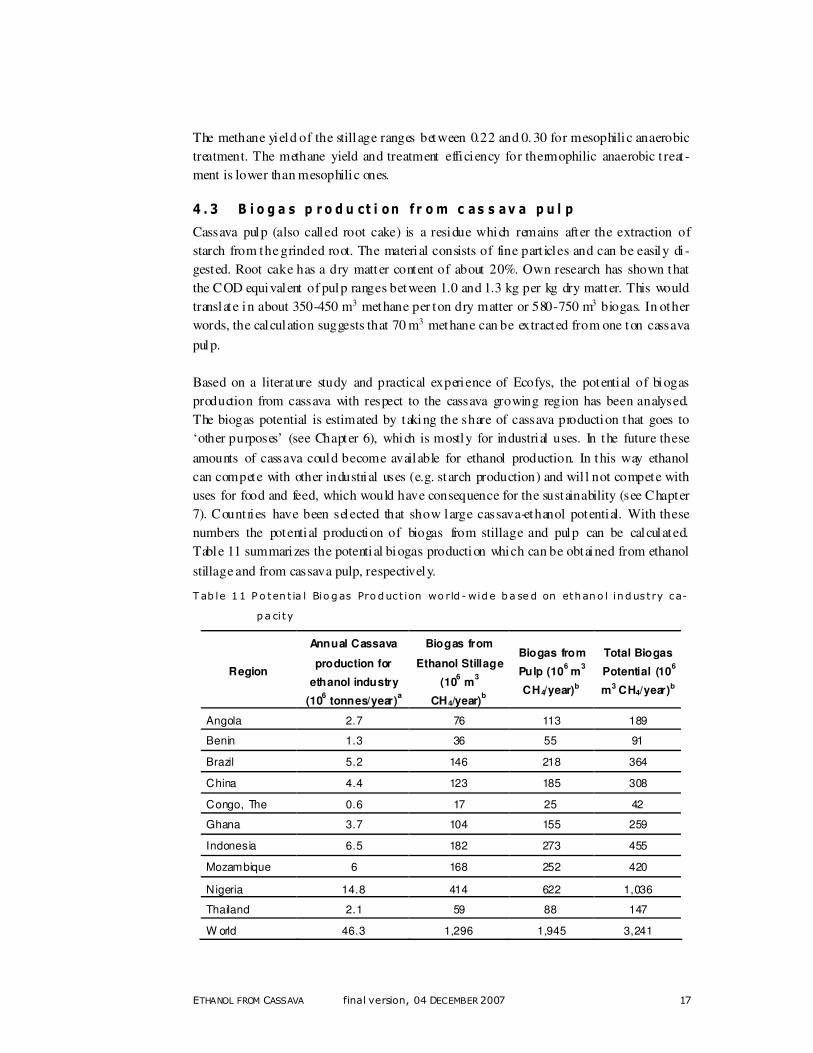
numbers the potential production of biogas from stillage and pulp can be calculated.
Table 11 summarizes the potential biogas production which can be obtained from ethanol
stillage and from cassava pulp, respectively.
Tab le 11 P o ten t ia l Bio gas Pro duct ion wo rld - wid e ba se d on ethano l indust ry ca-
pa ci ty
Region
Annual Cassava
production for
ethanol industry
(106 tonnes/year)
a
Biogas from
Ethanol Stillage
(106 m
3
CH4/year)b
Biogas from
Pulp (106 m
3
CH4/year)b
Total Biogas
Potential (106
m3 CH4/year)b
Angola 2.7 76 113 189
Benin 1.3 36 55 91
Brazil 5.2 146 218 364
China 4.4 123 185 308
Congo, The 0.6 17 25 42
Ghana 3.7 104 155 259
Indonesia 6.5 182 273 455
Mozambique 6 168 252 420
Nigeria 14.8 414 622 1,036
Thailand 2.1 59 88 147
W orld 46.3 1,296 1,945 3,241
ETHANOL FROM CASSAVA final version, 04 DECEMBER 2007 18
a The annual cassava production for ethanol industry is based on the data from Chapter 4 (Table 1). The data listed as “ other uses” is assumed to be used entirely for ethanol production.
b The conversion efficiencies are not considered in this calculation.
Table 11 indicates that potential biogas production from cassava pulp i s higher
than biogas from stillage due to the higher methane yield from the pulp frac-
tion. The global potential of biogas which can be obtained from cassava ethanol
production facili ties is approximately 3,000 million m3. Nigeria has the highest
relative cont ribution with 1,000 million m3 / a of biogas potential, which is fol -
lowed by Indonesia and Mozambique with a 455 and 420 million m3 /a of bio-
gas potential, respectively.
ETHANOL FROM CASSAVA final version, 04 DECEMBER 2007 19
5 Economic s
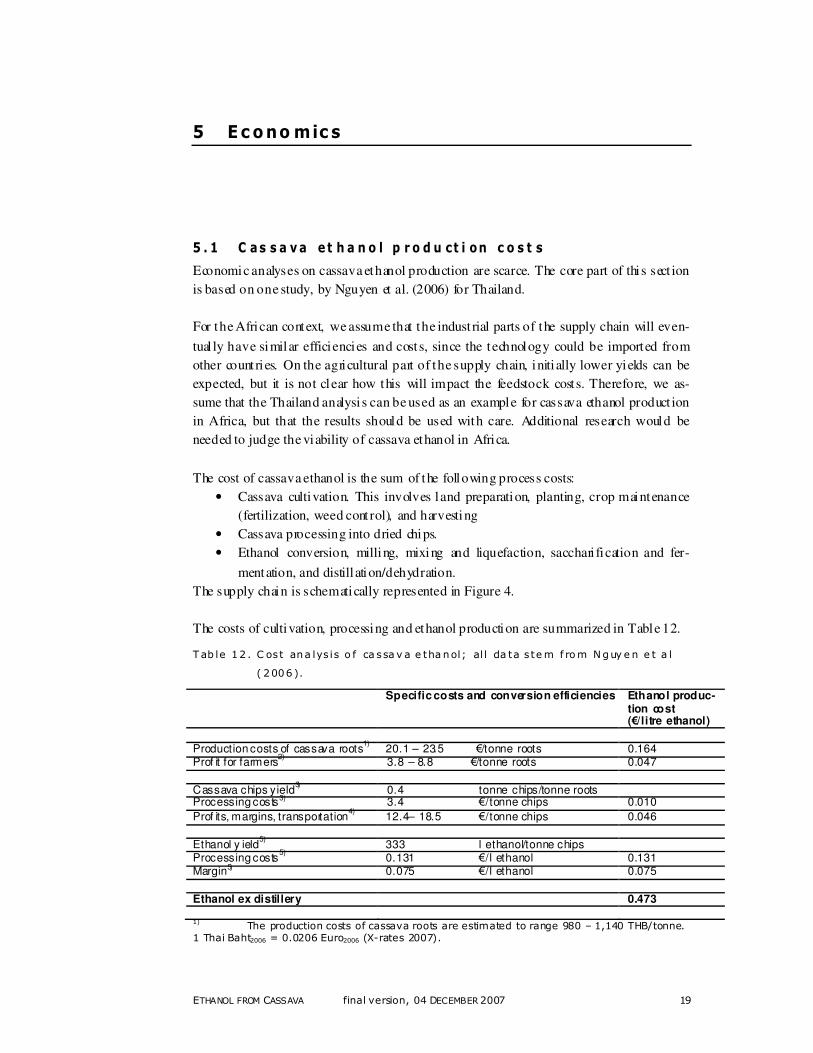
5 . 1 C as s a va e t h a n o l p r o d u ct i on c o s t s
Economic analyses on cassava ethanol production are scarce. The core part of this sect ion
is based on one study, by Nguyen et al. (2006) for Thailand.
For the African context, we assume that the indust rial parts of the supply chain will even-
tual ly have similar efficiencies and costs, since the technology could be imported from
other countries. On the agricultural part of the supply chain, initially lower yields can be
expected, but it is not clear how this will impact the feedstock costs. Therefore, we as-
sume that the Thailand analysis can be used as an example for cassava ethanol product ion
in Africa, but that the results should be used with care. Additional research would be
needed to judge the viability of cassava ethanol in Africa.
The cost of cassava ethanol is the sum of the following process costs:
• Cassava cultivation. This involves land preparation, planting, crop maintenance
(fertilization, weed cont rol), and harvesting
• Cassava processing into dried chips.
• Ethanol conversion, milling, mixing and liquefaction, sacchari fication and fer-
mentation, and distillation/dehydration.
The supply chain is schematically represented in Figure 4.
The costs of cultivation, processing and ethanol production are summarized in Table 12.
Tab le 12 . C ost ana lys is o f ca ssa v a e tha nol; al l da ta s tem f rom Nguy e n e t a l
( 2006).
Specific costs and conversion efficiencies Ethanol produc-tion cost (€/litre ethanol)
Production costs of cassava roots1)
20.1 – 23.5 €/tonne roots 0.164 Prof it for farmers
2) 3.8 – 8.8 €/tonne roots 0.047
Cassava chips yield
3) 0.4 tonne chips/tonne roots
Processing costs3) 3.4 €/tonne chips 0.010
Prof its, margins, transportation4)
12.4– 18.5 €/tonne chips 0.046
Ethanol y ield5)
333 l ethanol/tonne chips Processing costs
5) 0.131 €/l ethanol 0.131
Margin5) 0.075 €/l ethanol 0.075
Ethanol ex distillery 0.473 1) The production costs of cassava roots are estimated to range 980 – 1,140 THB/tonne.
1 Thai Baht2006 = 0.0206 Euro2006 (X-rates 2007).
ETHANOL FROM CASSAVA final version, 04 DECEMBER 2007 20
2) Farmers get an average profit of about 183 to 427 THB/tonne depending on product
market price 3) The total production cost of cassava chips is 3,300 THB/tonne; 95% of this cost is due
to the cost of 2.5 tonne of cassava roots, whereas processing cost makes just 5% . 4) The price of cassava chips ranges 3,700 - 4,000 THB/tonne on the open market, after
adding profit margin, taxes, etc. When including transportation cost, the feedstock at plant gate
costs 3,900 - 4,200 THB/tonne chips. 5) Conversion rate is 333 litres of ethanol per tonne of cassava chips according to Ngyuen
et al. USDA mentions 155 liter of anhydrous ethanol per tonne (USDA 2007), but considering that
Cassava is one of the starch-richest crops, we assume that the estimation of Ngyuen et al. is cor-rect.
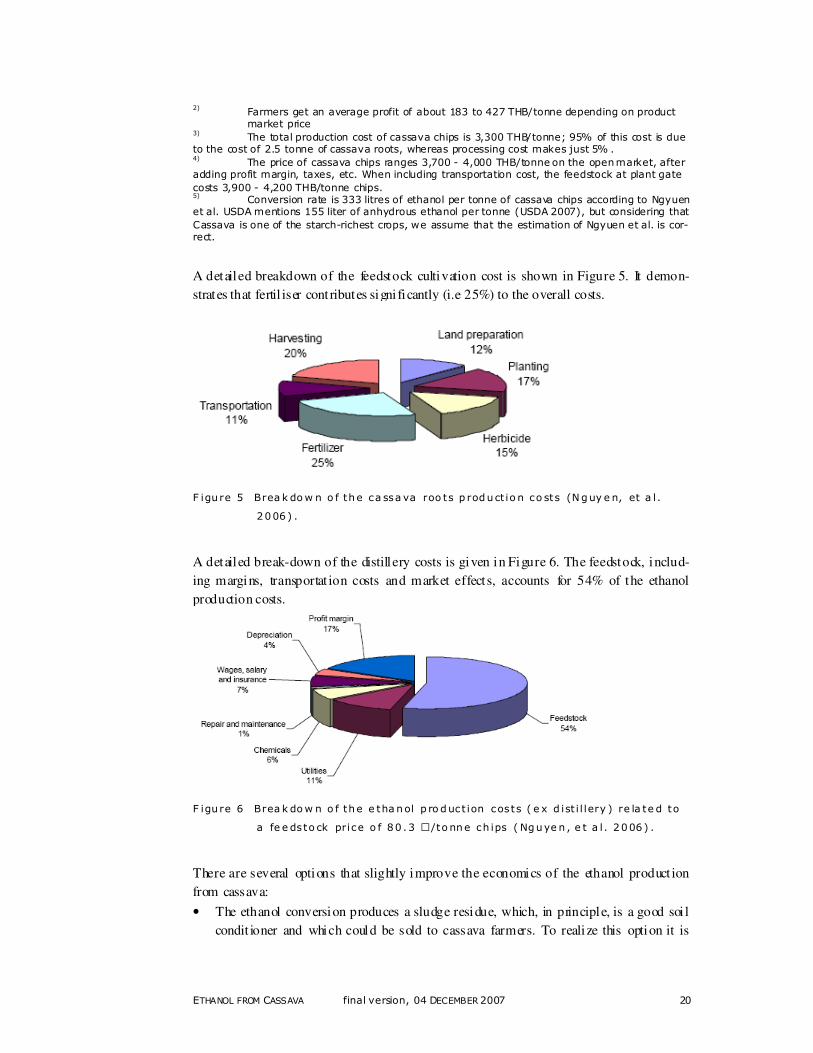
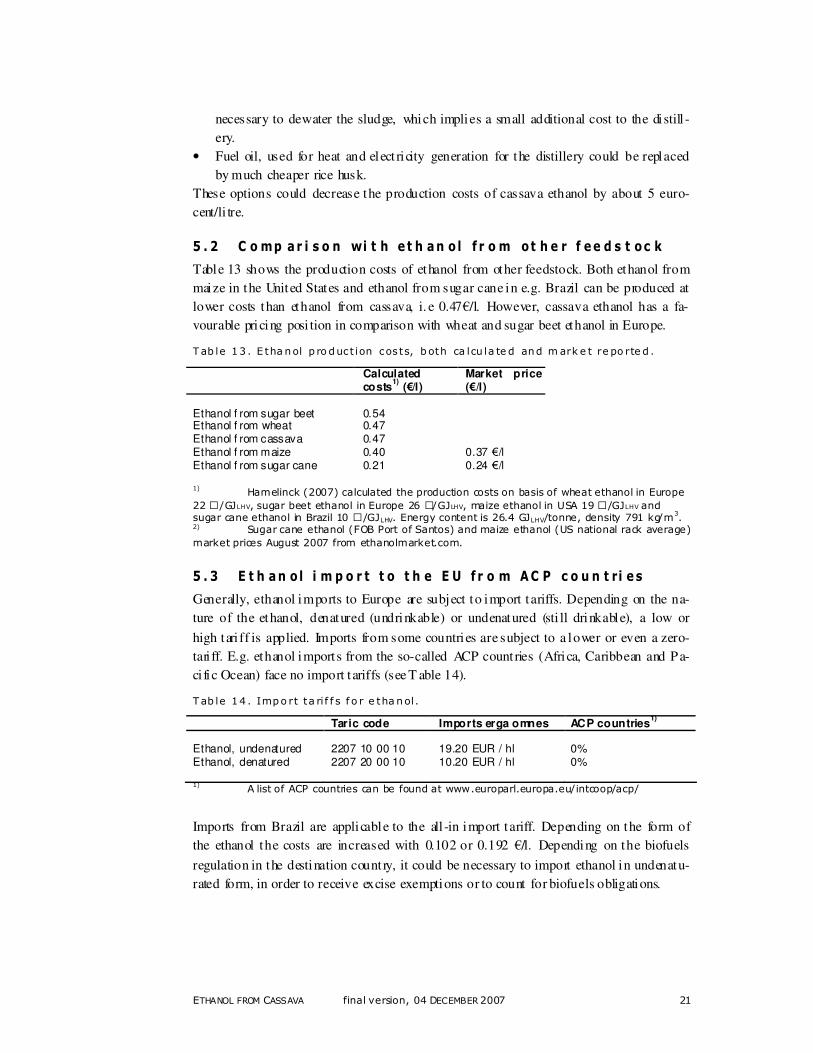
A detailed breakdown of the feedstock cultivation cost is shown in Figure 5. It demon-
strates that fertil iser cont ributes signi ficantly (i.e 25%) to the overall costs.
F igu re 5 Brea k dow n o f the ca ssa va roo ts p roduct io n co sts (Nguy e n, et a l .
2006) .
A detailed break-down of the distillery costs is given in Figure 6. The feedstock, includ-
ing margins, transportat ion costs and market effects, accounts for 54% of the ethanol
production costs.
F igu re 6 Brea k dow n o f the e tha nol p ro duct ion cos ts ( e x d ist i l lery ) re la te d to
a fe e dsto ck price o f 80 .3 F/to nne ch ips ( Nguye n , e t a l . 2006) .
There are several options that slightly improve the economics of the ethanol product ion
from cassava:
• The ethanol conversion produces a sludge residue, which, in principle, is a good soi l
condit ioner and which could be sold to cassava farmers. To realize this option it is
ETHANOL FROM CASSAVA final version, 04 DECEMBER 2007 21
necessary to dewater the sludge, which implies a small additional cost to the distill -
ery.
• Fuel oil, used for heat and elect ricity generation for the distillery could be replaced
by much cheaper rice husk.
These options could decrease the production costs of cassava ethanol by about 5 euro-
cent/li tre.
5 . 2 C o mp ar i s o n wi t h e t h an o l f r o m ot h e r f ee d s t oc k
Table 13 shows the production costs of ethanol from other feedstock. Both ethanol from
maize in the United States and ethanol from sugar cane in e.g. Brazil can be produced at
lower costs than ethanol from cassava, i. e 0.47€/l. However, cassava ethanol has a fa-
vourable pricing posi tion in comparison with wheat and sugar beet ethanol in Europe.
Tab le 13 . E tha nol p ro duct ion cos ts, b oth ca lcu la te d and m ark e t re po rte d .
Calculated costs
1) (€/l)
Market price (€/l)
Ethanol f rom sugar beet 0.54 Ethanol f rom wheat 0.47 Ethanol f rom cassava 0.47 Ethanol f rom maize 0.40 0.37 €/l Ethanol f rom sugar cane 0.21 0.24 €/l 1) Hamelinck (2007) calculated the production costs on basis of wheat ethanol in Europe
22 F/GJLHV, sugar beet ethanol in Europe 26 F/GJLHV, maize ethanol in USA 19 F/GJLHV and sugar cane ethanol in Brazil 10 F/GJLHV. Energy content is 26.4 GJLHV/tonne, density 791 kg/m
3.
2) Sugar cane ethanol (FOB Port of Santos) and maize ethanol (US national rack average)
market prices August 2007 from ethanolmarket.com.
5 . 3 E t h an o l i m p o r t t o t h e E U f r o m AC P c o u n t ri e s
Generally, ethanol imports to Europe are subject to import tariffs. Depending on the na-
ture of the ethanol, denatured (undrinkable) or undenatured (sti ll drinkable), a low or
high tari ff is applied. Imports from some countries are subject to a lower or even a zero-
tari ff. E.g. ethanol imports from the so-called ACP countries (Africa, Caribbean and Pa-
ci fic Ocean) face no import tariffs (see T able 14).
Tab le 14 . Impo rt ta ri f f s f o r e tha nol .
Taric code Imports erga omnes ACP countries1)
Ethanol, undenatured 2207 10 00 10 19.20 EUR / hl 0% Ethanol, denatured 2207 20 00 10 10.20 EUR / hl 0% 1) A list of ACP countries can be found at www.europarl.europa.eu/intcoop/acp/
Imports from Brazil are applicable to the all -in import tariff. Depending on the form of
the ethanol the costs are increased with 0.102 or 0.192 €/l. Depending on the biofuels
regulation in the destination country, it could be necessary to import ethanol in undenatu-
rated form, in order to receive excise exemptions or to count for biofuels obligations.

ETHANOL FROM CASSAVA final version, 04 DECEMBER 2007 22
From table 14 it can be deduced that ethanol imports from ACP countries are favourable.
Ethanol produced from cassava in these countries is likely to be sold in Europe at a com-
peti tive price.
ETHANOL FROM CASSAVA final version, 04 DECEMBER 2007 23
6 C ur r e nt s ta tus an d m arke ts
6 . 1 C as s a va m ar k e t s a n d c ou n t r i e s
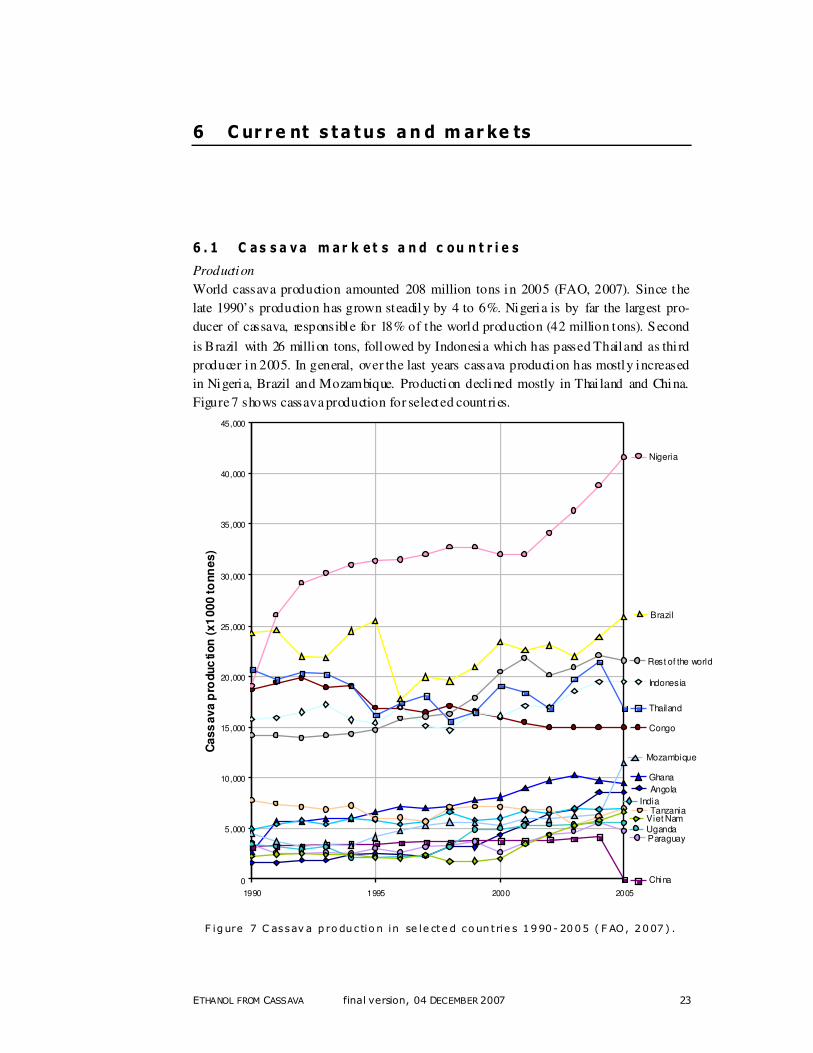
Production
World cassava production amounted 208 million tons in 2005 (FAO, 2007). Since the
late 1990’s production has grown steadily by 4 to 6%. Nigeria is by far the largest pro-
ducer of cassava, responsible for 18% of the world production (42 million tons). Second
is Brazil with 26 million tons, followed by Indonesia which has passed Thailand as thi rd
producer in 2005. In general, over the last years cassava production has mostly increased
in Nigeria, Brazil and Mozambique. Production declined mostly in Thai land and China.
Figure 7 shows cassava production for selected countries.
Angola
Brazil
China
Congo
Ghana
India
Indonesia
Mozambique
Nigeria
Paraguay
Tanzania
Thailand
UgandaViet Nam
Rest of the world
0
5,000
10,000
15,000
20,000
25,000
30,000
35,000
40,000
45,000
1990 1995 2000 2005
Ca
ss
av
a p
rod
uc
tio
n (
x1
00
0 t
on
ne
s)
F igure 7 C assav a p ro ductio n in se le cte d co un trie s 1990- 2005 ( F AO, 2007) .
ETHANOL FROM CASSAVA final version, 04 DECEMBER 2007 24
Import and export
Approximately 2% of world cassava product ion is being traded. Exports have decreased
rapidly in the late 1990’s and have remained fai rly constant since than. M ajor export ing
countries are (in absolute numbers): Thailand, Vietnam and Indonesia. The Netherlands
and Germany also export (or rather through-port ) signi ficant volumes of cassava (after
first having imported it). China is the largest importer (3.3 million tons in 2005), fol -
lowed by The Netherlands (0.9 million tons). Other European countries have much lower
trade volumes. Trade in cassava consists of the fol lowing product categories:
� Fresh cassava roots: International trade in fresh cassava roots is mostly confined to
transactions between neighbouring countries and is not usually recorded in the offi -cial stati stics. Some demand exists in developed countries caused by an increasing population that originates from ‘cassava producing countries’.
� Dry cassava chips and pellets: Cassava can be chipped or pelleti sed in order to in-crease shelf li fe and to make export available for animal feed uses. The EU is the main market for cassava feed products, as it accounts for about 80% of global im-ports. The other 20% of trade find their way to China, Indonesia, Japan, the Republic of Korea, the United States, Aust ralia, New Zealand, Malaysia and the Philippines. EU demand for feed cassava products was met mainly by Asian countries, in particu-lar Thailand. Thailand is the most dynamic in meeting the requi rements for t rade ex-pansion. In recent years, however, falling grain prices following the 1992 CAP re-form have decreased demand for cassava feed products in the EU and stalled much of the growth of production in Thailand, where the sector was highly dependent on ex-ternal markets as its main outlet.
� Starches and flours: Trade in cassava flour and starch, which represents some 15 % of overall cassava products t rade, expanded in recent years. The major cassava starch and flour importers are, by order of importance, Japan, the Chinese P rovince of T ai -
wan, Hong Kong, China, Indonesia, Malaysia, Singapore, the United States and the Philippines.
Cassava pellets have been sold to other destinations at prices much lower than those ob-
tained in the EU. This pattern reflects the export policies implemented by Thailand and
Indonesia since the mid-1980s to encourage a diversi fication of markets. Both countries
introduced a “bonus scheme”, under which t raders were awarded a given amount of the
profitable export quota to the EU for each tonne sold elsewhere. Such a scheme encour-
aged traders to offer very cheap prices to non-EU customers as they endeavoured to in-
crease their entitlements for sale to high-price markets in the EU. As a result, the interna-
tional cassava pellet market was characterized by a two-tier pricing system that contrib-
uted to the expansion of cassava exports to non-EU destinations in the 1980s and early
1990s. (FAO, 2003)
Uses
Worldwide cassava is mostly used for food: 53% of world cassava production was used
for food in 2005. Secondly, feed uses amounted to 24%. 22% was used for other pur-
poses. The latter include post-harvest losses and industrial uses. The share of cassava
losses was much smaller for Latin America and the Caribbean and for Asia, at 10% and
8% respectively, while it was of the order of 29% in Africa (FAO, 2000). Industrial uses
ETHANOL FROM CASSAVA final version, 04 DECEMBER 2007 25
of cassava include utilisation in the manufacturing of paper, cardboard, glues, texti le, res-
ins, composite woods, pharmaceuticals and ethanol production. Some large-scale, inte-
grated, cassava starch plants have been reported in Venezuela, whereas in Brazil the scale
is generally small. A major constraint of the industry is the unavailability of a regular
flow of roots for processing. In Brazil, for instance, cassava starch indust ries had to stop
working for more than four months a year, because of a lack of fresh cassava roots (FAO,
2003).
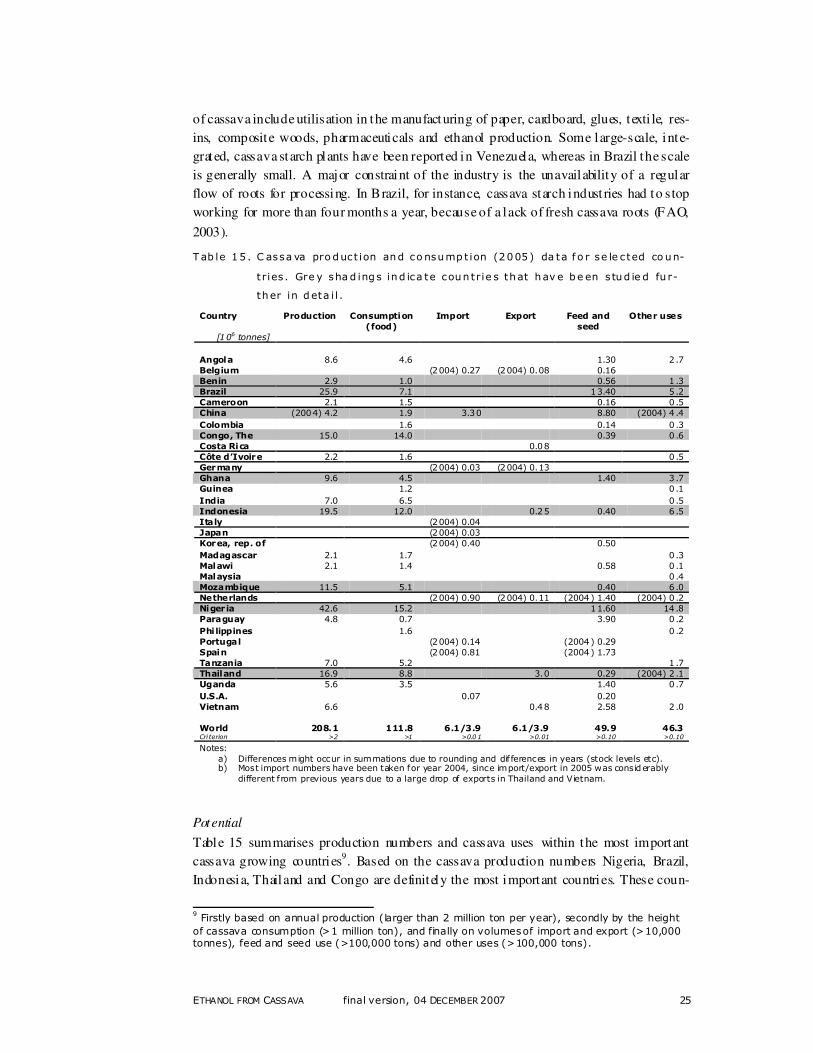
Tab le 15 . C assa va pro duct ion and co nsump t ion (2005) da ta f o r se le c ted co un-
t ries . Gre y sha d ing s ind ica te coun trie s that hav e be en s tud ie d fu r-
ther in d eta i l .
Country Production Consumption (food)
Import Export Feed and seed
Other uses
[106 tonnes]
Angola 8.6 4.6 1.30 2 .7
Belgium (2004) 0.27 (2004) 0.08 0.16
Benin 2.9 1.0 0.56 1 .3
Brazil 25.9 7.1 13.40 5 .2
Cameroon 2.1 1.5 0.16 0 .5
China (2004) 4.2 1.9 3.30 8.80 (2004) 4 .4
Colombia 1.6 0.14 0 .3
Congo, The 15.0 14.0 0.39 0 .6
Costa Rica 0.08
Côte d’Ivoire 2.2 1.6 0 .5
Germany (2004) 0.03 (2004) 0.13
Ghana 9.6 4.5 1.40 3 .7
Guinea 1.2 0 .1
India 7.0 6.5 0 .5
Indonesia 19.5 12.0 0.25 0.40 6 .5
Italy (2004) 0.04
Japan (2004) 0.03
Korea, rep. of (2004) 0.40 0.50
Madagascar 2.1 1.7 0 .3
Malawi 2.1 1.4 0.58 0 .1
Malaysia 0 .4
Mozambique 11.5 5.1 0.40 6 .0
Netherlands (2004) 0.90 (2004) 0.11 (2004) 1.40 (2004) 0 .2
Nigeria 42.6 15.2 11.60 14.8
Paraguay 4.8 0.7 3.90 0 .2
Philippines 1.6 0 .2
Portugal (2004) 0.14 (2004) 0.29
Spain (2004) 0.81 (2004) 1.73
Tanzania 7.0 5.2 1 .7
Thailand 16.9 8.8 3.0 0.29 (2004) 2 .1
Uganda 5.6 3.5 1.40 0 .7
U.S.A. 0.07 0.20
Vietnam 6.6 0.48 2.58 2 .0
World 208.1 111.8 6.1/3.9 6.1/3.9 49.9 46.3 Cri terion >2 >1 >0.0 1 >0.01 >0.10 >0.10
Notes:
a) Differences might occur in summations due to rounding and dif ferences in years (stock levels etc). b) Most import numbers have been taken for year 2004, since import/export in 2005 was considerably
different from previous years due to a large drop of exports in Thailand and Vietnam.
Potential
Table 15 summarises production numbers and cassava uses within the most important
cassava growing countries9. Based on the cassava production numbers Nigeria, Brazil,
Indonesia, Thailand and Congo are definitely the most important countries. These coun-
9 Firstly based on annual production (larger than 2 million ton per year), secondly by the height
of cassava consumption (>1 million ton), and finally on volumes of import and export (>10,000 tonnes), feed and seed use (>100,000 tons) and other uses (>100,000 tons).
ETHANOL FROM CASSAVA final version, 04 DECEMBER 2007 26
tries inherently have high (food) consumption rates of cassava. By looking at the con-
sumption rate (food consumption divided by production + imports), the relative impor-
tance of cassava for food is indicated. F rom the largest cassava producing countries, In-
donesia, Thailand and The Congo have highest food consumption shares; resp. 62%, 52 %
and 93%. Lowest shares are observed in Mozambique (45%), Nigeria (36%) and Brazi l
(28%). Furthermore, the share of ‘other uses’ is important, mostly because this indicated-
sthe share of industrial uses that could become available for ethanol production in the
near future. Countries with high shares of other uses are Mozambique (52%), Benin
(45%), Ghana (38%), Nigeria (36%) and Indonesia (34%)10
. The countries which have a
large potential for ethanol from cassava, are described in detail in the next paragraphs.
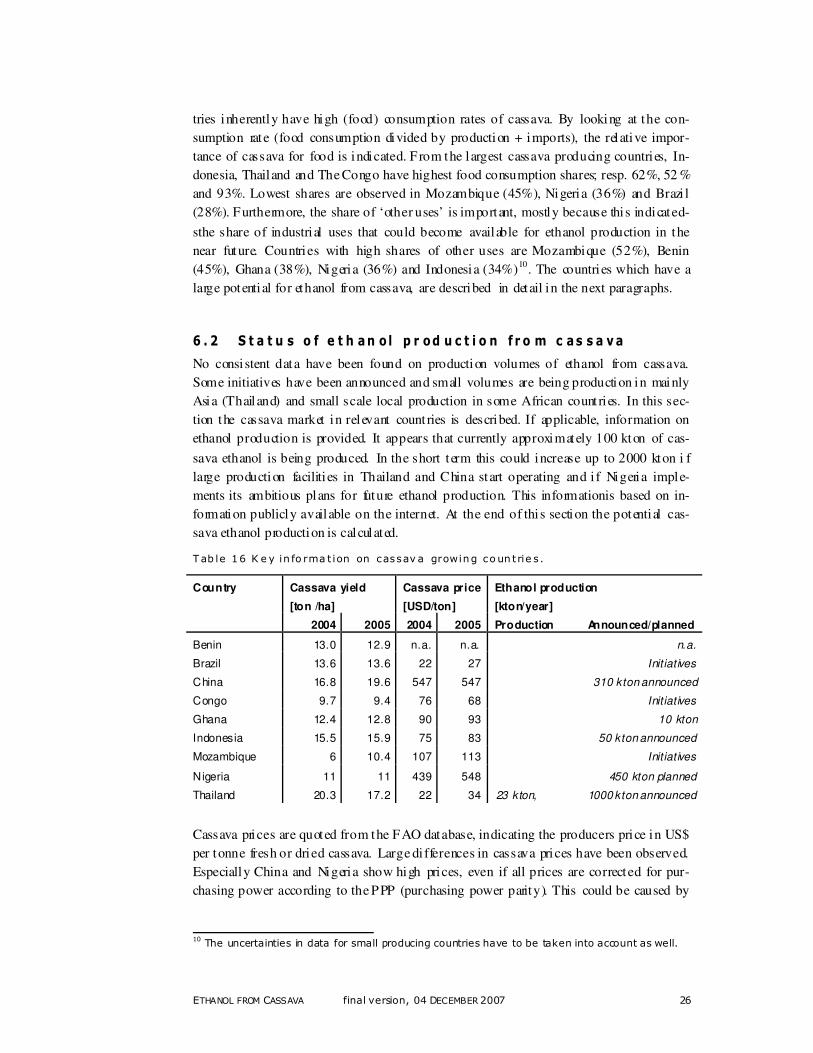
6 . 2 S t a t u s o f e t h an o l p r od u c t i o n f r o m c as s a va
No consistent data have been found on production volumes of ethanol from cassava.
Some initiatives have been announced and small volumes are being production in mainly
Asia (Thailand) and small scale local production in some African countries. In this sec-
tion the cassava market in relevant countries is described. If applicable, information on
ethanol production is provided. It appears that currently approximately 100 kton of cas-
sava ethanol is being produced. In the short term this could increase up to 2000 kton i f
large production facilities in Thailand and China start operating and i f Nigeria imple-
ments its ambitious plans for future ethanol production. This informationis based on in-
formation publicly available on the internet. At the end of this section the potential cas-
sava ethanol production is calculated.
Tab le 16 K e y in fo rma t ion on cassav a growing co un trie s .
Country Cassava yield
[ton /ha]
Cassava price
[USD/ton]
Ethanol production
[kton/year]
2004 2005 2004 2005 Production Announced/planned
Benin 13.0 12.9 n.a. n.a. n.a.
Brazil 13.6 13.6 22 27 Initiatives
China 16.8 19.6 547 547 310 kton announced
Congo 9.7 9.4 76 68 Initiatives
Ghana 12.4 12.8 90 93 10 kton
Indonesia 15.5 15.9 75 83 50 kton announced
Mozambique 6 10.4 107 113 Initiatives
Nigeria 11 11 439 548 450 kton planned
Thailand 20.3 17.2 22 34 23 kton, 1000 kton announced
Cassava prices are quoted from the FAO database, indicating the producers price in US$
per tonne fresh or dried cassava. Large di fferences in cassava prices have been observed.
Especially China and Nigeria show high prices, even if all prices are corrected for pur-
chasing power according to the PPP (purchasing power parity). This could be caused by
10 The uncertainties in data for small producing countries have to be taken into account as well.
ETHANOL FROM CASSAVA final version, 04 DECEMBER 2007 27
differences in the defini tion of cassava (fresh or dried, the latter probably having a pre-
mium price). Time was too limited to identify the reasons behind the di fferences.
The following countries have been identi fied as having a high potential for future cassava
based ethanol production. As stated before, no large scale cassava ethanol production is
currently existing, but countries having high shares of industrial cassava use and relative
low feed use have been studied in detail. Countries which have ethanol initiatives or am-
bitious governmental plans, have also been included.
� Benin
Between 1996 and 2003, cassava production doubled to reach a total output of 2.9 mil -
lion tonnes, while the per-ha yield increased by 25%. This st rong performance was
largely the result of the government scheme “ a billion for cassava” which offered credits,
fertili ser and cuttings of improved varieties to producers to encourage them to increase
production. However, not much was done to improve marketing at the same time (T he
Bahama Journal, 2007).
� Brazil
Cassava is grown in the regions of Sao Paulo (6%), Mata Grosso do Sul (17%), Parana
(75%) and Goias (2%). These regions are also know for thei r large sugarcane and ethanol
production. Cassava is mostly used for starch production; 36% is cassava derived starch.
However, corn is still the most important feedstock for starch production (63. 8%) (Henry
and Cardoso, 2003). In Brazil cassava is currently not being used for ethanol production.
Negative experiences with cassava in Brazil have been quoted by FAS: Large-scale farm-
ing of cassava failed because of pests and diseases and manual harvesting appeared very
labour intensive and time consuming. High ethanol demand could increase interest in
cassava as possible feedstock. However, this seems unlikely due to the fact that Brazil is
mainly focussing on sugarcane and there appears to be no need for alternative feedstocks
(besides soy for biodiesel ).
� China
China’s current cassava production is estimated at 7. 5 million tons per year. Increasing
land area planted to cassava (it can grow on marginal land) and technological advances
could eventually add 21 million tons to cassava production. In the meantime, cassava im-
ports from Thailand, Vietnam, and Indonesia are surging, up from 257,000 tons in 2000
to more than 3.3 million tons in 2005. Semi-t ropical Guangxi region offers an ideal mix
of climate and soil conditions for growing cassava (FAS/China, 2006).
A subsidiary of China National Cereals, Oils & Foodstuffs Corporation recently reached
a deal with the government of southern Guangxi Zhuang Autonomous Region to con-
struct a 200,000-ton cassava ethanol plant in the capi tal Nanning. The Nanning plant, the
first phase of the project, will be finished by mid-2007. Another ethanol plant in southern
China, which is a joint venture of the provincial and national governments, will open in
October 2007 with production capaci ty of 110,000 tons of ethanol per year. With cassava
ETHANOL FROM CASSAVA final version, 04 DECEMBER 2007 28
as the main input, the plant i s expected to supply much of southern China when it reaches
production of 1 million tons per year in 2010 (Worldwatch Institute, 2007).
� Congo
Cassava is a very important food crop in Congo, with 93% of total production being used
for food consumption. Also the leaves are used as a vegetable. As of October 2007, Bra-
zil has signed two agreements to help Congo with training, technology and financing to
produce ethanol (Reuters). Drawbacks for small scale cassava/ethanol production in
Congo are the civil stability, poor road access and the existence of import subsidies on
rice and wheat.
� Ghana
In Ghana, the cassava transformation has lagged behind Nigeria by about a decade. For
example, the dramatic increase in cassava production occurred in Nigeria from 1984 to
1992 and in Ghana from 1990 to 2001. In Ghana, unti l the drought which occurred in the
early 1980s and resulted in the failure of most food crops except cassava, government ag-
ricultural policies emphasized on stimulating large scale production of grains by the pub-
lic sector and neglected cassava as an inferior food whose consumption was destined to
decline as incomes increased.
Caltech Ventures Ghana Limited, a biofuel company founded by members of the
Ghanese diaspora, will begin the production of ethanol from cassava at Hodzo, near the
city of Ho, in 2007 when it s $6.5 million production plant will be ready. The company's
total investment in the venture is $10 million. Caltech Ventures Ghana Limited has estab-
lished a 162 hectare cassava seed plantation with plans to expand it to 486 hectares next
year. 60 percent of the six million litres of ethanol to be produced yearly will be ex-
ported. It has also organised a corps of cassava out-growers to provide the needed raw
material for take-off. The project has the potential to provide 600 jobs, when its ethanol
plant comes to full production (Biopact 2007).
� Indonesia
Relative small amounts of Indonesia’s cassava production are used for food consumption.
In Indonesia two ethanol plants are currently operating, both using molasses as raw mate-
rial. The industry is also looking at cassava as a feedstock. Since molasses is also used to
produce monosodium glutamate, cassava may be an att ractive alternative. At least two
companies are currently making plans to use cassava as an feedstock (FAS/Indonesia,
2007). Indonesia's largest-l isted energy fi rm, PT Medco Energi Internasional, plans to
spend $135-$144 mill ion on three ethanol plants. Each ethanol plant needing an invest -
ment of $45 million. One plant in Sumatra's Lampung will have a capacity of 60 mill ion
litres of cassava-based ethanol a year, which is going to be exported to India, Korea, T ai -
wan and China (Reuters).
� Mozambique
Compared to other African countries Mozambique uses only 45% of the cassava supply
for food consumption, whereas 52% is being used for other purposes. Recently, a panel
ETHANOL FROM CASSAVA final version, 04 DECEMBER 2007 29
of scientists has put efforts in the development of using cassava for ethanol production. A
cassava-based ethanol indust ry wil l be adding value to the crop and provide major oppor-
tunities for poverty reduction amongst the country's small subsistence farmers. The Mo-
zambique Bio-Fuels Indust ries is also promoting the use of cassava (and jatropha) for
biofuel production (Biopact, 2007).
� Nigeria
Yields were boosted when high yielding ‘TMS’ varieties were int roduced and supported
by the government. In 2002, cassava suddenly gained national prominence following the
pronouncement of a P residential Initiative. The intent of the initiative was to use cassava
as the engine of growth in Nigeria. To put Nigeria in the global context for competit ion
the country needs to upgrade the use of cassava into primary indust ries such as starch,
ethanol, chips and flour in order to provide an indust rial base for further diversi ficat ion of
its national economy (Knowledge for Development, 2007). This initiative aimed to pro-
duce 107 million tons of cassava in 2007 with 78% destinated for export. The majority of
cassava will be used for animal feed (85%) and 3% will be dedicated for ethanol produc-
tion (FAO, 2004). Highest potential for future increased cassava production and process-
ing facilities is in the southwest of Nigeria. FAO (2004) has made the following recom-
mendations in order to enable Nigeria to exploit its large cassava potential. The cassava
indust ry throughout Nigeria has long been neglected as a valued and respected cont ribu-
tor to modern agriculture. Yet cassava product ion is greater than the ‘more respected’ and
‘more organized’ agricultural commodities in Nigeria. For the cassava indust ry to mature
in Nigeria it must organize itsel f. Compet itive funding in support of excellence and inno-
vation within the cassava industry should be given priority.
In 1994, NIYAMCO (Nigerian Yeast and Alcohol Manufacturing Company) began look-
ing for an alternative source of raw material. Dried cassava chips was selected as a suit -
able raw material for the production of ethanol. The production facility of NIYAMCO
required about 30 tons of dried cassava roots per day. Because of problems in organizing
the collection of dried cassava chips from scattered smallholders, NIYAMCO had to
close its ethanol plant. If the 88 mil lion liters of alcohol currently imported each year for
the liquor industry were produced with cassava roots in Nigeria, it would open up a mar-
ket for about 600,000 tons of cassava roots, or about two percent of national cassava pro-
duction (Nweke, 2003).
� Thailand
Production and export of cassava has dropped signi ficant ly in 2005, whereas more cas-
sava was used for food production. Most cassava in Thailand was exported as cassava
chips and pellets to Europe, to be used in the animal feeding indust ry. During the late
1980s, Thailand' s cassava-production area covered 1.6 million ha. Almost all of this was
destined for the lucrative export market for cassava pellets in Europe. However, changes
in the EU's agricultural policies in 1993 lowered the support price of thei r own grain
crops, and made Thailand's cassava pellets no longer competitive as a cheap source of
animal-feed. Thus, the amount of cassava pellets Thailand exported to the EU began to
drop. Foreseeing the problem of overproduction, the Thai government t ried to decrease
ETHANOL FROM CASSAVA final version, 04 DECEMBER 2007 30
the cassava-growing area by encouraging farmers to plant other crops. However, none of
these were as well adapted to the climatic conditions in the Northeast as cassava. As a re-
sult, farmers cont inued to grow cassava, albei t on a reduced area of about 1 million ha.
While the area was reduced, cassava yields started to increase substantially from about
14t/ha in 1995 to 22t/ha in 2006/2007. The result was that total cassava production de-
creased only marginally from a peak of 24 million tons in 1989 to about 16 million tons
in 1998/1999 and back up to 25 million tons in 2006/2007. The Thai cassava indust ry
changed from making mainly cassava pellets for export to making more and more cas-
sava starch for both the domestic and export markets. Currently, cassava starch and
modified starch industry absorbs over 50% of all cassava roots produced in the country.
Chinese neighbours to the north have also built more and more starch factories, to the
point that domestic production could not keep up with demand. Thus, in 2001, they
started importing dry cassava chips from Thailand, fi rstly in very modest amounts, but
increasing every year to four million tonnes in 2006.
Presently there is only one ethanol factory in the country using cassava as its raw mate-
rial and producing about 80, 000 litres per day. However, two additional factories are
ready to start operation and another 12 factories should be completed by the end of 2008,
producing a total of 3.4 mill ion litres of ethanol per day. This will requi re an additional
six million tons of fresh roots, on top of the 25 million tons currently being produced.
Since the cassava growing area cannot increase substant ial ly due to competition from
other crops, the increased supply can only be met through increases in yield (Biopact,
2007).
In T hailand, ethanol production from cassava will not necessarily cause an over-demand
to the existing cassava indust ries, since the starch indust ry i s not expected to grow much
further and the pellets indust ry will decline somewhat. At an annual production of 20
million tonnes of fresh roots in 2005, there was 4 million tonnes of roots available as a
surplus to the feed industry and to make ethanol from. The Thai agricultural policy
strives to increase yields without increasing the area planted with cassava (which is now
rest ricted to 1 million ha). Due to continuous research and development on cassava vari -
ety improvement and cropping efficiency, Thailand has been able to increase cassava
yields from 13 tonnes/ha in 1995 to an average of 17.2 tons/ha in 2005.
6 . 3 P ot en t i a l v o l u m es o f c a s s av a e t h an o l
The potential of cassava ethanol can be estimated by taking the production share of ‘other
uses’ in a selected country. Within the category “ other uses” a large share is used for in-
dust rial purposes. Industrial parties may have to compete with future ethanol production.
This avoids direct competition with cassava used in food and feed (see next chapter on
sustainability). T able 17 summarises the cassava-ethanol production potential for various
countries. It appears that in total 6.6 million tonnes of ethanol can be produced from cas-
sava annually. This represents a share of 16% in current world fuel ethanol production.
Nigeria and Indonesia show the largest potential of cassava ethanol production, which is
e.g. reflected in the ambitious ethanol policy plans in Nigeria. Also in Indonesia, several
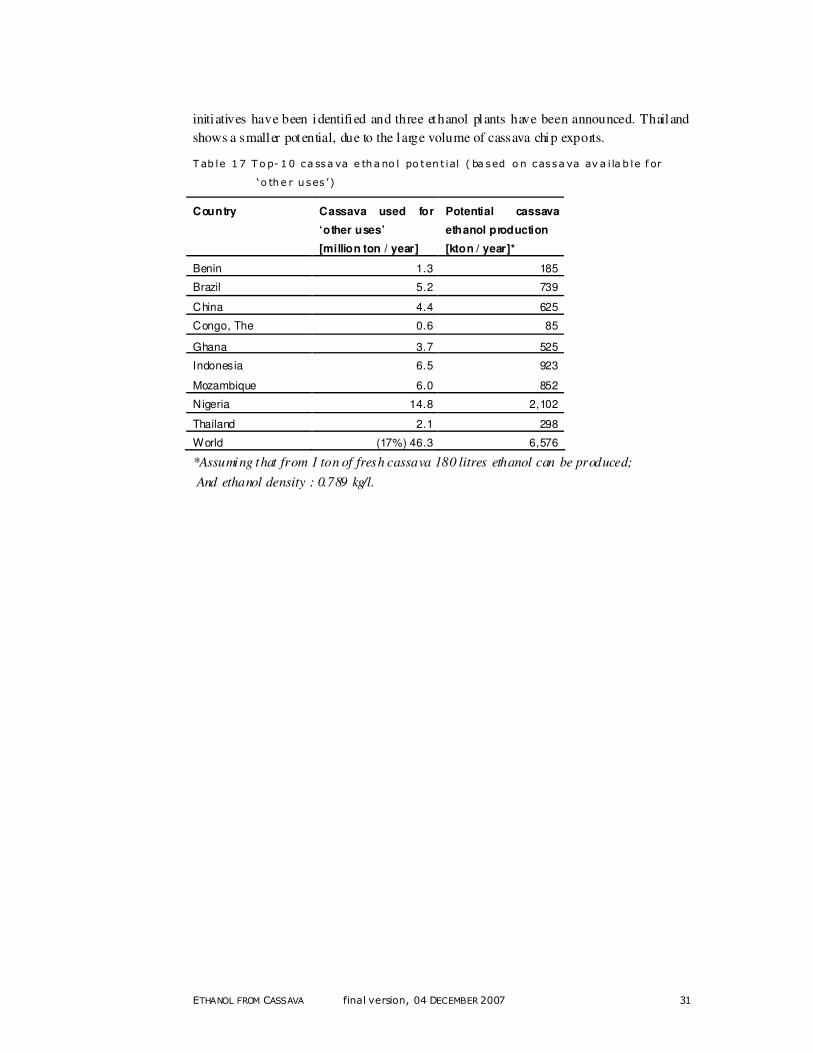
ETHANOL FROM CASSAVA final version, 04 DECEMBER 2007 31
initiatives have been identified and three ethanol plants have been announced. Thailand
shows a smaller potential, due to the large volume of cassava chip exports.
Tab le 17 T o p- 10 ca ssa va e tha no l po ten t ial ( ba sed o n cassa va av a i la b le f or
‘o the r u ses ’)
Country Cassava used for
‘other uses’
[million ton / year]
Potential cassava
ethanol production
[kton / year]*
Benin 1.3 185
Brazil 5.2 739
China 4.4 625
Congo, The 0.6 85
Ghana 3.7 525
Indonesia 6.5 923
Mozambique 6.0 852
Nigeria 14.8 2,102
Thailand 2.1 298
World (17%) 46.3 6,576
*Assuming that from 1 ton of fresh cassava 180 litres ethanol can be produced;
And ethanol density : 0.789 kg/l.
ETHANOL FROM CASSAVA final version, 04 DECEMBER 2007 32
7 S us ta in ab il i ty i ss ue s
7 . 1 C o mp e t i t i o n b e t w e e n f oo d a n d e t h a n o l
Cassava i s a staple food for 500 mill ion people in the humid t ropics. Thus, cassava price
increases caused by a rising cassava demand for ethanol production are likely to have
effects on the food access of poor people which do not produce cassava themselves.
However, cassava price increase on the existing cassava market are not to be expected, if:
� The demand for cassava within other indust ry sectors (e.g. the fodder market ) is di -
minishing by the same volume needed for ethanol product ion. To our knowledge,
however, there are no indications that such a development is currently taking place or
is to be expected in the near future.
� According to Horizonte (2003) a substantial proportion of the cassava harvest in
tropical regions is lost. By using heat produced out of cassava residues, cassava
losses can be reduced considerably. Thus, using improved conservation processes
could make cassava available for ethanol production that would have been lost oth-
erwise.
� The increasing demand for ethanol production i s covered exclusively by cassava
which has been produced in addition to the current cassava production. This can be
achieved without severe negative ecological consequences by increasing the yields of
existing plantations using sustainable production methods or by setting up new cas-
sava plantations on “ idle” land (see textbox). Cassava could be especially appropriate
for the cultivation on idle lands, as these lands often do not have the best soil quali -
ties and cassava still has reasonable yield on land where other crops cannot be pro-
duced.
Doing so, a new market for cassava from additional production is set up. The increasing
demand from the ethanol indust ry will only become effective on this market. Thus, the
existing market for cassava will not be influenced by the increasing cassava demand of
the ethanol indust ry. However, i f the cassava demand for the food sector would increase
in the future, additional cassava will have to be supplied by the new ethanol market for
cassava from additional production.
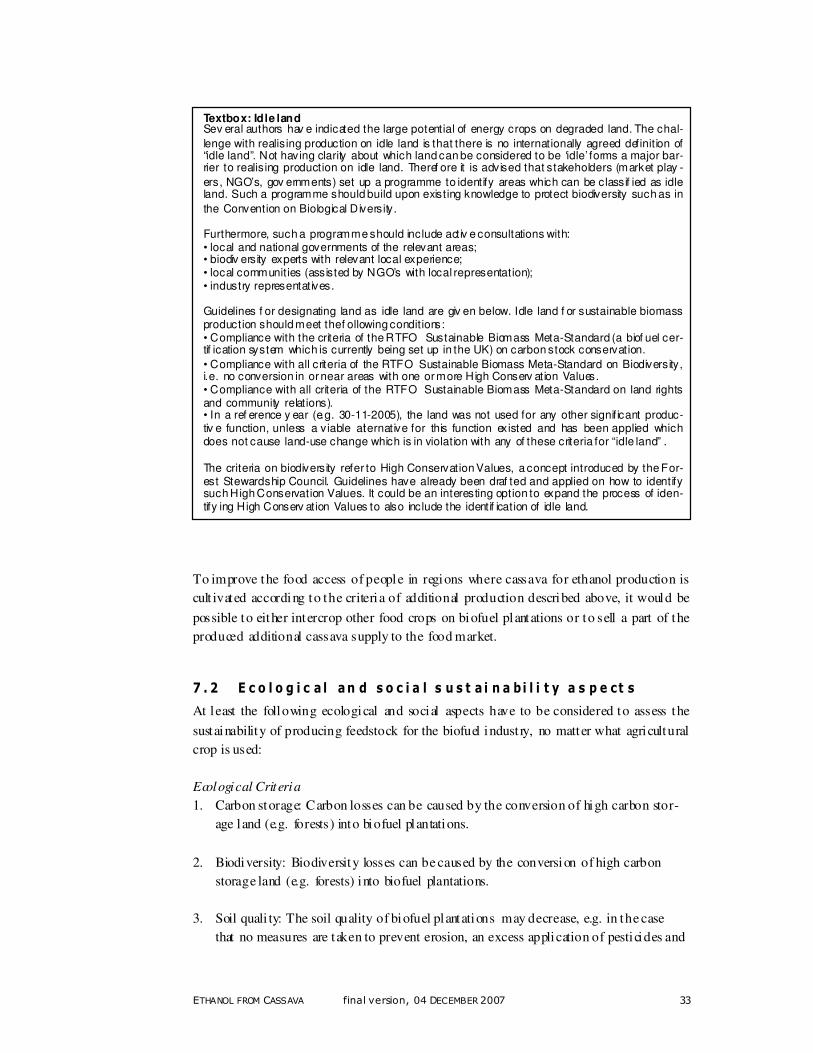
ETHANOL FROM CASSAVA final version, 04 DECEMBER 2007 33
To improve the food access of people in regions where cassava for ethanol production is
cult ivated according to the criteria of additional production described above, it would be
possible to either intercrop other food crops on biofuel plantations or to sell a part of the
produced additional cassava supply to the food market.
7 . 2 E c o l o g i c a l an d s o c i a l s u s t a i n a bi l i t y a s p e ct s
At least the following ecological and social aspects have to be considered to assess the
sustainability of producing feedstock for the biofuel indust ry, no matter what agricultural
crop is used:
Ecological Criteria
1. Carbon storage: Carbon losses can be caused by the conversion of high carbon stor-
age land (e.g. forests) into biofuel plantations.
2. Biodiversity: Biodiversity losses can be caused by the conversion of high carbon
storage land (e.g. forests) into biofuel plantations.
3. Soil quali ty: The soil quality of biofuel plantations may decrease, e.g. in the case
that no measures are taken to prevent erosion, an excess application of pesticides and
Textbox: Idle land Sev eral authors hav e indicated the large potential of energy crops on degraded land. The chal-
lenge with realising production on idle land is that there is no internationally agreed definition of “idle land”. Not having clarity about which land can be considered to be ‘idle’ forms a major bar-rier to realising production on idle land. Theref ore it is advised that stakeholders (market play -
ers, NGO’s, gov ernments) set up a programme to identify areas which can be classif ied as idle land. Such a programme should build upon existing knowledge to protect biodiversity such as in
the Convention on Biological Diversity. Furthermore, such a programme should include activ e consultations with: • local and national governments of the relevant areas; • biodiv ersity experts with relevant local experience; • local communities (assisted by NGO’s with local representation); • industry representatives. Guidelines f or designating land as idle land are giv en below. Idle land f or sustainable biomass production should meet the f ollowing conditions: • Compliance with the criteria of the RTFO Sustainable Biomass Meta-Standard (a biof uel cer-tif ication system which is currently being set up in the UK) on carbon stock conservation.
• Compliance with all criteria of the RTFO Sustainable Biomass Meta-Standard on Biodiversity, i.e. no conversion in or near areas with one or more High Conserv ation Values. • Compliance with all criteria of the RTFO Sustainable Biomass Meta-Standard on land rights and community relations). • In a ref erence y ear (e.g. 30-11-2005), the land was not used for any other significant produc-tiv e function, unless a viable alternative for this function existed and has been applied which does not cause land-use change which is in violation with any of these criteria for “idle land” . The criteria on biodiversity refer to High Conservation Values, a concept introduced by the For-est Stewardship Council. Guidelines have already been draf ted and applied on how to identify such High Conservation Values. It could be an interesting option to expand the process of iden-tify ing High Conserv ation Values to also include the identif ication of idle land.
ETHANOL FROM CASSAVA final version, 04 DECEMBER 2007 34
fertilizers (an overuse of nit rogen decreases the cassava crop quality for food con-
sumption as wel l) and a decrease of soil fertility due to an excessive export of nut ri-
ents (especially potassium in the case of cassava)
4. Water use: The water quality in the production regions might deteriorate in the case
of an overuse of pesticides and fertilizers. A sustainable water use has to take the
natural ground water level regeneration rates into account.
5. Air quality: The air quality in the production regions might deteriorate in the case of
burning of residues or the use of fires to burn forest with the aim of setting up new
biofuel plantations
Social Criteria
6. Labour conditions: P roper labour conditions on the biofuel plantations include e.g.
the prohibition of child labour and forced labour as wel l as the workers right to or-
ganize themselves.
7. Land rights: T aking existing land rights into account is especially problematic in
countries where companies set up large scale biofuel crop plantations and do not
comply with the existing legislation.
Currently, a number of European countries (United Kingdom, The Netherlands and Ger-
many) and the European Commission are setting up certifications systems to assure a
sustainable production of biofuels. These certi ficat ion systems are mostly based on exist -
ing, voluntary certi fication system for di fferent agricultural crops and forest products.
However, there is currently no certification system for cassava production in place.
Sustainable cassava production for the ethanol indust ry may be guaranteed by setting up
a sustainability certi fication system for cassava. In addition to the ecological and social
sustainability criteria mentioned above, it is recommended to add a criterion on “addi -
tional production” in the certification system. Thus, increasing prices on the exist ing
market for cassava could be prevented. Doing so, the displacement of current agricultural
production with possible negative ecological consequences could be prevented as well.
Although cert ification would be desi rable also for the cassava food market from an eco-
logical point of view, it is not recommended to include the food sector in the certi ficat ion
system, as the costs of certi fication would be imposed on the users of cassava food who
often have a very low income.
ETHANOL FROM CASSAVA final version, 04 DECEMBER 2007 35
8 C oncl us i o ns
1. About 54% of the world’s cassava is produced in Africa, 29% in Asia and only
14% in Latin America (FAO, 2007).
2. Growing and harvesting cassava is a manually intensive act ivity and thus lends
itsel f to small scale production units.
3. Post harvesting activities are not very capital intensive either and can therefore
be conducted at the farm level.
4. Other activities in the supply chain (e.g. refining, extracting, marketing and
packaging) tend to be more capital and knowledge intensive and thus benefi t
from economies of scale.
5. The supply chain provides possibilities for small -scale farmers on marginal lands
to become involved in producing a cash crop.
6. According to TIPS (2007), on the long-term, cassava best potential growth mar-
ket i s its application in starch and starch-based products.
7. Countries that have the greatest potential for future ethanol production are coun-
tries such as Thailand, Nigeria and Ghana, which produce cassava for higher
value added products, such as for animal feed or for industrial starch production.
This avoids a di rect competition with food uses of cassava.
8. Possible drawbacks could be the limitations of T hai exports, and pol itical insta-
bility in Nigeria and Ghana.
9. The worldwide growth in ethanol production has resulted in increased awareness
of the possibilit ies of African cassava.
10. More developed countries such as Thailand have made the step towards higher
added value uses of cassava in the past and have become leading exporter of cas-
sava chips and pellets. This development could very well indicate the future di -
rect ion of selected African countries.
11. Cassava could be especially be appropriate for the cultivation on idle lands, as
these land often do not have the best soil qualities and cassava still has reason-
able yield on land where other crops cannot be produced.
12. Large opportunit ies exist for cassava ethanol production. Due to its high avail -
abil ity, its large potential to optimise yields and due to its integration in smal l
scale communities, ethanol can be produced in a viable way.
13. Drawbacks may result from the competitive pressure that co-markets of ethanol,
such as the starch market, could exercise.
14. Also, the application of cassava in African animal feed market could potentially
interfere with large scale ethanol production.
15. The current development of sustainability criteria will most likely also be ex-
tended to cassava ethanol.
ETHANOL FROM CASSAVA final version, 04 DECEMBER 2007 36
16. To avoid food or fuel debates, it has to be assured that additional cassava is
grown for ethanol, preferably on idle land. This enhancess cassava’s potential,
due to its cultivation potential on low fertil ity soils.
17. Beneficial export conditions and relative low production costs will enhance cas-
sava’s potential.
18. In order to develop a market and infrastructure for cassava the following aspects
should be addressed:
• Increase stable cassava yields. Use high yielding root material and optimise
harvesting methods in order to make large volumes of additional cassava avail -
able.
• Explore the possibilities for integrating small scale ethanol production facili ties
with opportunities for biogas production.
• Define domest ic ethanol markets and possibilities for export ing ethanol.
• Address sustainability i ssues from the start.
ETHANOL FROM CASSAVA final version, 04 DECEMBER 2007 37
Re fe re nc es
• Abera, S. and Rakshit, S. K.; Effect of Dry Cassava Chip Storage on Yield and Functional P roperties of Ext racted Starch; Starch; Volume 56, Issue 6, page 232 – 240; 2004
• Bassam, N.el 1998. Energy plants species. Their use and impact on environment
and development. James & james Science Publishers, London
• Belt ran F. J., Alvarez P. M., Rodriquez E.M., Garcia-Araya J. F., Rivas J., 2001.
Treatment of high strength distillery wastewater (cherry stillage) by integrated
aerobic biological oxidation and ozonation. Biotechnology Progress. 17, 462-
467.
• Biopact, 2007. Available at http://biopact. com/2007/10/caltech-ventures-to-produce-ethanol. html.
• FAO, 2003. The world cassava economy: facts, trends and outlook. FAO & IFAD 2000.
• FAO, 2004. A cassava indust rial revolut ion in Nigeria: The potential for a new indust rial crop.
• FAO, 2007. FAOST AT • FAS/China, 2006. Biofuels. An alternative future for agriculture.
• FAS/Indonesia, 2007. Indonesia. Biofuels Annual 2007. USDA/FAS.
• FAS/Thailand, 2007. Thai land. Biofuels Annual 2007. USDA/FAS
• Hamelinck CN and Hoogwijk M, 2007, Future Scenarios for Biofuels, Ecofys /
Netherlands Environmental Assessment Agency, Utrecht the Netherlands.
• Henry, G. and Cardoso, C.E. L., 2003. Cassava products and biotech: Brazilian trends and implications. Presentat ion CIRAD Argentina and EMBRAPA Brazil.
• Knowledge for Development, CT A, 2007. Available at: http://knowledge.cta.int /en/content/view/full/2567.
• Nandy T., Shast ry S., Kaul S. N., 2002. Wastewater management in a cane mo-
lasses distilery involving bioresource recovery. Journal Environmental M anage-
ment. 65, 25-38
• New crop factsheet Cassava.
www.hort.purdue.edu/newcrop/CropFactSheet/cassava.html
• Nguyen TLT, Gheewala SH and Garivait S, 2006, Li fe Cycle Cost Analysis of
Fuel Ethanol Produced from Cassava in Thailand, Institution, City.
• Nguyen, T.L.T. et al.; Energy balance and GHG-abatement cost of cassava utili -zation for fuel ethanol in Thailand; Energy Policy; Volume 35, Issue 9, page 4585 – 4596; 2007
• Nweke, F., 2003. New challenges in the cassava t ransformation in Nigeria and Ghana. http://www.i fpri.org/events/conferences/2003/120103/papers/paper8.pdf
• Pant P., Adholeya A., 2007. Biological approaches for treatment of distillery
wastewater: A review. Bioresource Technology. 98, 2321-2334
• Sheehan G. J., Greenfield P. F., 1980. Utilisation, treatment and disposal of dis-
tillery wastewater. Water Research. 14, 257-277
ETHANOL FROM CASSAVA final version, 04 DECEMBER 2007 38
• Sriroth, K. et al 2004. A study of directions for the development of ethanol in-
dust ry in Thailand.
• Sriroth, K. Lamchaiyaphum, B and Piayachomkwan, K. 2006. Present situation
and future potential of cassava in Thailand. • The Bahama Journal, 2007. Available at
http://www.jonesbahamas.com/? c=47&a=7415 • TIPS, unknown. Trade Information Brief: Cassava. Aust ralian Government,
Trade and Industrial Policy St rategies (TIPS). • Wang, W. 2002; Cassava production for indust rial utilization in China – Present
and future perspectives; Proceedings of the 7th
regional cassava workshop; Bangkok, Thailand;
� Wilkie A, C., Riedesel K. J., Owens J. M., 2000. Stillage characterization and
anaerobic treatment of ethanol stillage from conventional and cellulosic feed-
stock. Biomass and Bioenergy. 19, 63-102
� Willingthon I.P., Marten G. G., 1982. Options for handling stillage waste from
sugar-based fuel ethanol production. Resources and Conservation. 8, 111-129 • Worldwatch Institute, 2007. Available at http://www. worldwatch.org/node/4351 • X-rates, 2007, Historic exhange rates, www.x-rates.com