BIMB UNIT TRUST MANAGEMENT BERHAD€¦ · 2 Axiata Group Berhad 6.21% 3 Sime Darby Berhad 5.32% 4...
13
Transcript of BIMB UNIT TRUST MANAGEMENT BERHAD€¦ · 2 Axiata Group Berhad 6.21% 3 Sime Darby Berhad 5.32% 4...

This document provides detailed features, investment objectives, strategy and approach of the 7 Shariah-compliant funds and all other
important information that you will need to know regarding these investment funds.
1. myEQUITY INDEX FUND
2. myGROWTH FUND
3. myBLUE CHIPS FUND
4. myDIVIDEND FUND
5. myBALANCED FUND
6. ITTIZAN
7. ISTIQRAR
The choice of funds should be based on, among others, your tolerance to risk. Please seek advice from your Takaful Agent of the
company on your tolerance to risk. For Ittizan and Istiqrar, the funds are no longer being offered for new investment.
The above mentioned funds will be professionally managed by the Investment Division of Syarikat Takaful Malaysia Berhad. The
investment team comprises of a group of professional portfolio managers and investment research analysts who possess an average
of 15 years experience in fund management.
Note: The selection of investible securities is conducted in a systematic manner where the investment process is governed by internal
policies. In addition to that, the systematic investment process is strictly guided by the Company’s Shariah Advisory Body to ensure
that the Shariah principles are not compromised in every investment decision made.
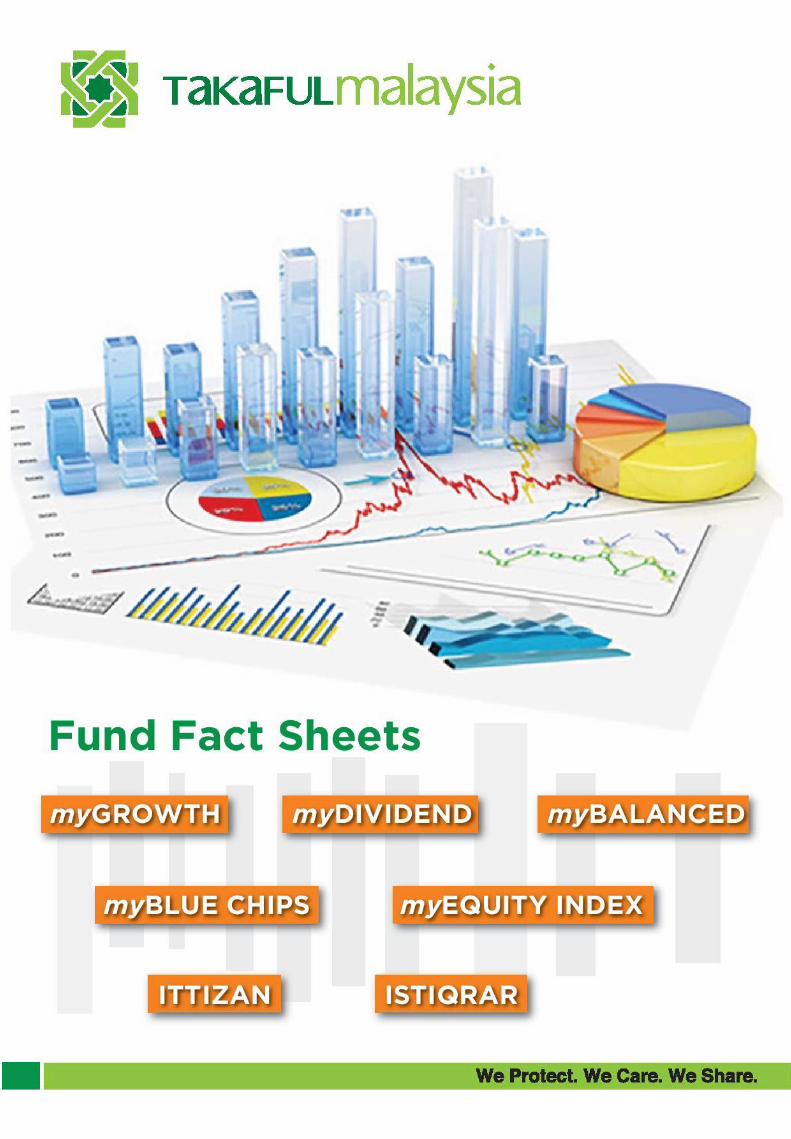
Fund Fact Sheets
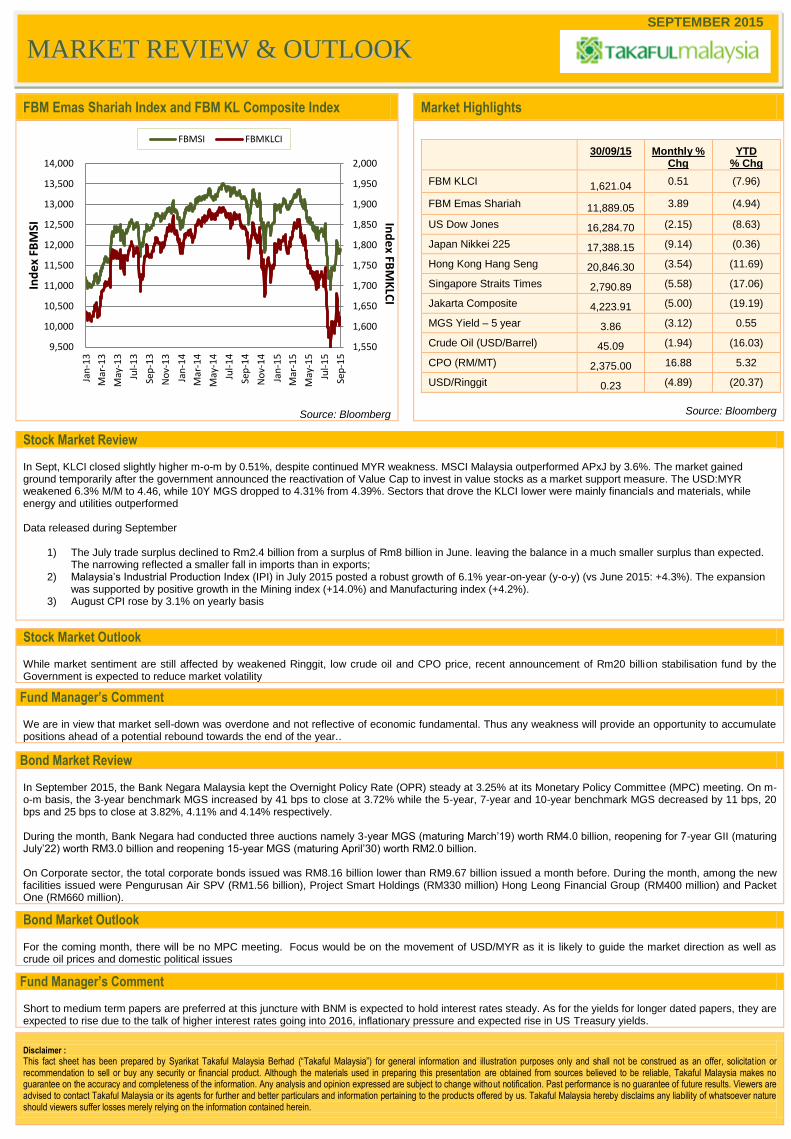
FBM Emas Shariah Index and FBM KL Composite Index Market Highlights
Source: Bloomberg
30/09/15
Monthly %
Chg YTD
% Chg
FBM KLCI 1,621.04 0.51 (7.96)
FBM Emas Shariah 11,889.05 3.89 (4.94)
US Dow Jones 16,284.70 (2.15) (8.63)
Japan Nikkei 225 17,388.15 (9.14) (0.36)
Hong Kong Hang Seng 20,846.30 (3.54) (11.69)
Singapore Straits Times 2,790.89 (5.58) (17.06)
Jakarta Composite 4,223.91 (5.00) (19.19)
MGS Yield – 5 year 3.86 (3.12) 0.55
Crude Oil (USD/Barrel) 45.09 (1.94) (16.03)
CPO (RM/MT) 2,375.00 16.88 5.32
USD/Ringgit 0.23 (4.89) (20.37)
Source: Bloomberg
Stock Market Review In Sept, KLCI closed slightly higher m-o-m by 0.51%, despite continued MYR weakness. MSCI Malaysia outperformed APxJ by 3.6%. The market gained ground temporarily after the government announced the reactivation of Value Cap to invest in value stocks as a market support measure. The USD:MYR weakened 6.3% M/M to 4.46, while 10Y MGS dropped to 4.31% from 4.39%. Sectors that drove the KLCI lower were mainly financials and materials, while energy and utilities outperformed Data released during September
1) The July trade surplus declined to Rm2.4 billion from a surplus of Rm8 billion in June. leaving the balance in a much smaller surplus than expected. The narrowing reflected a smaller fall in imports than in exports;
2) Malaysia’s Industrial Production Index (IPI) in July 2015 posted a robust growth of 6.1% year-on-year (y-o-y) (vs June 2015: +4.3%). The expansion was supported by positive growth in the Mining index (+14.0%) and Manufacturing index (+4.2%).
3) August CPI rose by 3.1% on yearly basis
Stock Market Outlook While market sentiment are still affected by weakened Ringgit, low crude oil and CPO price, recent announcement of Rm20 billion stabilisation fund by the Government is expected to reduce market volatility
Fund Manager’s Comment We are in view that market sell-down was overdone and not reflective of economic fundamental. Thus any weakness will provide an opportunity to accumulate positions ahead of a potential rebound towards the end of the year..
Bond Market Review In September 2015, the Bank Negara Malaysia kept the Overnight Policy Rate (OPR) steady at 3.25% at its Monetary Policy Committee (MPC) meeting. On m-o-m basis, the 3-year benchmark MGS increased by 41 bps to close at 3.72% while the 5-year, 7-year and 10-year benchmark MGS decreased by 11 bps, 20 bps and 25 bps to close at 3.82%, 4.11% and 4.14% respectively. During the month, Bank Negara had conducted three auctions namely 3-year MGS (maturing March’19) worth RM4.0 billion, reopening for 7-year GII (maturing July’22) worth RM3.0 billion and reopening 15-year MGS (maturing April’30) worth RM2.0 billion. On Corporate sector, the total corporate bonds issued was RM8.16 billion lower than RM9.67 billion issued a month before. During the month, among the new facilities issued were Pengurusan Air SPV (RM1.56 billion), Project Smart Holdings (RM330 million) Hong Leong Financial Group (RM400 million) and Packet One (RM660 million).
Bond Market Outlook For the coming month, there will be no MPC meeting. Focus would be on the movement of USD/MYR as it is likely to guide the market direction as well as crude oil prices and domestic political issues
Fund Manager’s Comment Short to medium term papers are preferred at this juncture with BNM is expected to hold interest rates steady. As for the yields for longer dated papers, they are expected to rise due to the talk of higher interest rates going into 2016, inflationary pressure and expected rise in US Treasury yields.
Disclaimer :
This fact sheet has been prepared by Syarikat Takaful Malaysia Berhad (“Takaful Malaysia”) for general information and illustration purposes only and shall not be construed as an offer, solicitat ion or recommendation to sell or buy any security or financial product. Although the materials used in preparing this presentation are obtained from sources believed to be reliable, Takaful Malaysia makes no guarantee on the accuracy and completeness of the information. Any analysis and opinion expressed are subject to change without notification. Past performance is no guarantee of future results. Viewers are advised to contact Takaful Malaysia or its agents for further and better particulars and information pertaining to the products offered by us. Takaful Malaysia hereby disclaims any liability of whatsoever nature should viewers suffer losses merely relying on the information contained herein.
1,550
1,600
1,650
1,700
1,750
1,800
1,850
1,900
1,950
2,000
9,500
10,000
10,500
11,000
11,500
12,000
12,500
13,000
13,500
14,000
Jan
-13
Mar
-13
May
-13
Jul-
13
Sep
-13
No
v-1
3
Jan
-14
Mar
-14
May
-14
Jul-
14
Sep
-14
No
v-1
4
Jan
-15
Mar
-15
May
-15
Jul-
15
Sep
-15
Ind
ex
FBM
SI
FBMSI FBMKLCI
Ind
ex FB
MK
LCI
MMAARRKKEETT RREEVVIIEEWW && OOUUTTLLOOOOKK
SEPTEMBER 2015
mmyyEEQQUUIITTYY IINNDDEEXX FFUUNNDD SSEEPPTTEEMMBBEERR 22001155
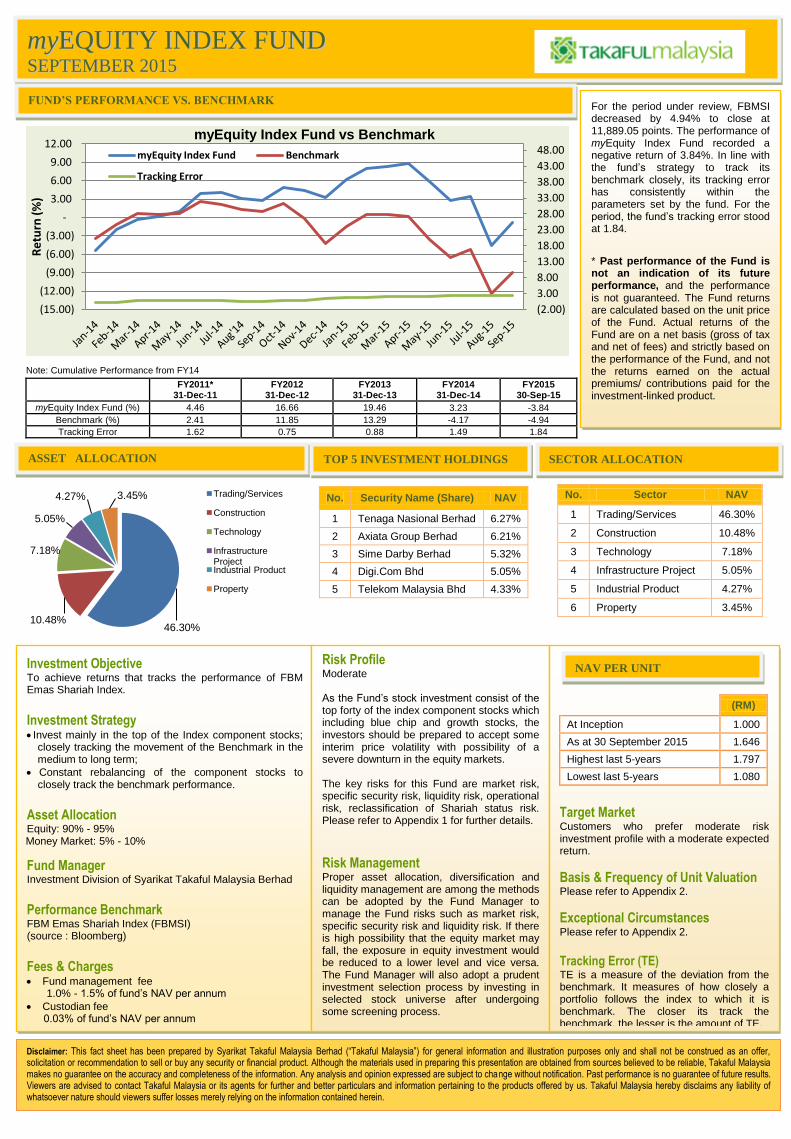
FUND’S PERFORMANCE VS. BENCHMARK
Note: Cumulative Performance from FY14
FY2011*
31-Dec-11
FY2012 31-Dec-12
FY2013 31-Dec-13
FY2014 31-Dec-14
FY2015 30-Sep-15
myEquity Index Fund (%) 4.46 16.66 19.46 3.23 -3.84
Benchmark (%) 2.41 11.85 13.29 -4.17 -4.94
Tracking Error 1.62 0.75 0.88 1.49 1.84
(2.00)
3.00
8.00
13.00
18.00
23.00
28.00
33.00
38.00
43.00
48.00
(15.00)
(12.00)
(9.00)
(6.00)
(3.00)
-
3.00
6.00
9.00
12.00
Re
turn
(%
)
myEquity Index Fund vs Benchmark
myEquity Index Fund Benchmark
Tracking Error
For the period under review, FBMSI decreased by 4.94% to close at 11,889.05 points. The performance of myEquity Index Fund recorded a negative return of 3.84%. In line with the fund’s strategy to track its benchmark closely, its tracking error has consistently within the parameters set by the fund. For the period, the fund’s tracking error stood at 1.84.
* Past performance of the Fund is not an indication of its future performance, and the performance is not guaranteed. The Fund returns are calculated based on the unit price of the Fund. Actual returns of the Fund are on a net basis (gross of tax and net of fees) and strictly based on the performance of the Fund, and not the returns earned on the actual premiums/ contributions paid for the investment-linked product.
ASSET ALLOCATION TOP 5 INVESTMENT HOLDINGS
46.30%
10.48%
7.18%
5.05%
4.27% 3.45% Trading/Services
Construction
Technology
Infrastructure Project Industrial Product
Property
No. Security Name (Share) NAV
1 Tenaga Nasional Berhad 6.27%
2 Axiata Group Berhad 6.21%
3 Sime Darby Berhad 5.32%
4 Digi.Com Bhd 5.05%
5 Telekom Malaysia Bhd 4.33%
No. Sector NAV
1 Trading/Services 46.30%
2 Construction 10.48%
3 Technology 7.18%
4 Infrastructure Project 5.05%
5 Industrial Product 4.27%
6 Property 3.45%
Investment Objective To achieve returns that tracks the performance of FBM Emas Shariah Index.
Investment Strategy Invest mainly in the top of the Index component stocks;
closely tracking the movement of the Benchmark in the medium to long term;
Constant rebalancing of the component stocks to closely track the benchmark performance.
Asset Allocation Equity: 90% - 95% Money Market: 5% - 10%
Fund Manager Investment Division of Syarikat Takaful Malaysia Berhad
Performance Benchmark FBM Emas Shariah Index (FBMSI) (source : Bloomberg)
Fees & Charges Fund management fee
1.0% - 1.5% of fund’s NAV per annum
Custodian fee 0.03% of fund’s NAV per annum
Risk Profile Moderate As the Fund’s stock investment consist of the top forty of the index component stocks which including blue chip and growth stocks, the investors should be prepared to accept some interim price volatility with possibility of a severe downturn in the equity markets. The key risks for this Fund are market risk, specific security risk, liquidity risk, operational risk, reclassification of Shariah status risk. Please refer to Appendix 1 for further details.
Risk Management Proper asset allocation, diversification and liquidity management are among the methods can be adopted by the Fund Manager to manage the Fund risks such as market risk, specific security risk and liquidity risk. If there is high possibility that the equity market may fall, the exposure in equity investment would be reduced to a lower level and vice versa. The Fund Manager will also adopt a prudent investment selection process by investing in selected stock universe after undergoing some screening process.
(RM)
At Inception 1.000
As at 30 September 2015 1.646
Highest last 5-years 1.797
Lowest last 5-years 1.080
Target Market Customers who prefer moderate risk investment profile with a moderate expected return.
Basis & Frequency of Unit Valuation Please refer to Appendix 2.
Exceptional Circumstances Please refer to Appendix 2.
Tracking Error (TE) TE is a measure of the deviation from the benchmark. It measures of how closely a portfolio follows the index to which it is benchmark. The closer its track the benchmark, the lesser is the amount of TE.
Disclaimer: This fact sheet has been prepared by Syarikat Takaful Malaysia Berhad (“Takaful Malaysia”) for general information and illustration purposes only and shall not be construed as an offer, solicitation or recommendation to sell or buy any security or financial product. Although the materials used in preparing this presentation are obtained from sources believed to be reliable, Takaful Malaysia makes no guarantee on the accuracy and completeness of the information. Any analysis and opinion expressed are subject to change without notification. Past performance is no guarantee of future results. Viewers are advised to contact Takaful Malaysia or its agents for further and better particulars and information pertaining to the products offered by us. Takaful Malaysia hereby disclaims any liability of whatsoever nature should viewers suffer losses merely relying on the information contained herein.
SECTOR ALLOCATION
NAV PER UNIT
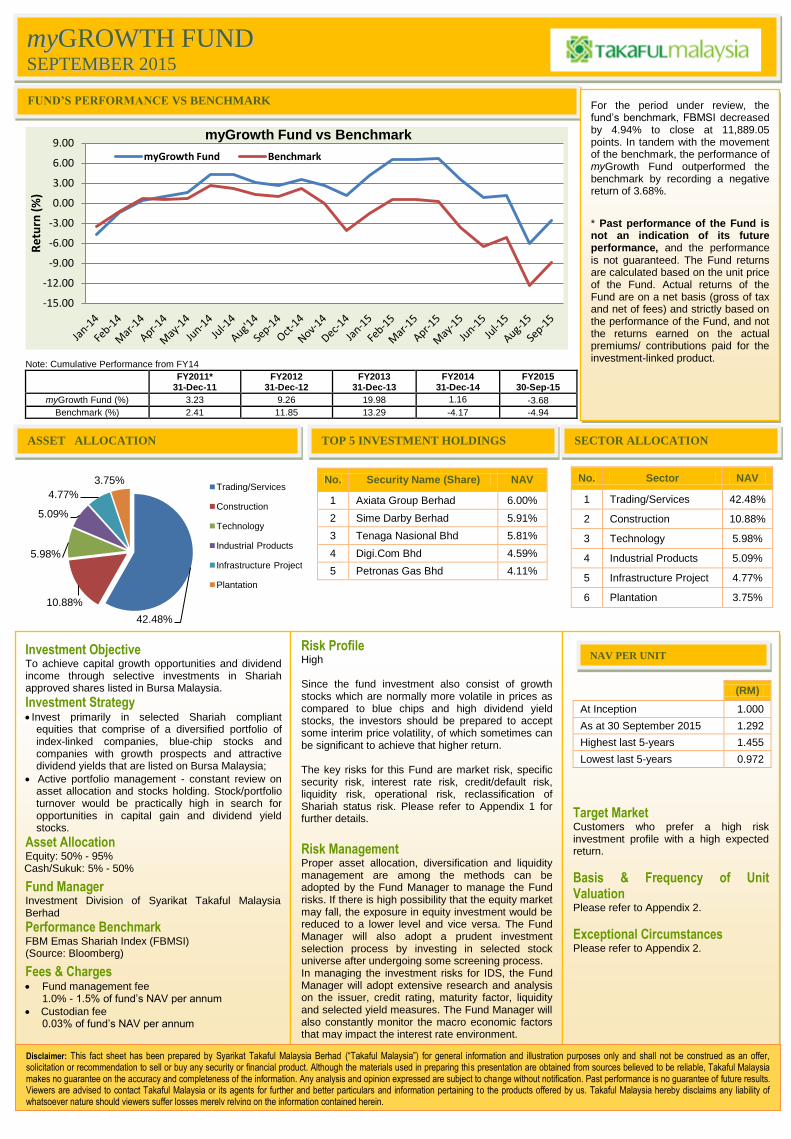
mmyyGGRROOWWTTHH FFUUNNDD SSEEPPTTEEMMBBEERR 22001155
FUND’S PERFORMANCE VS BENCHMARK
Note: Cumulative Performance from FY14
FY2011*
31-Dec-11
FY2012 31-Dec-12
FY2013 31-Dec-13
FY2014 31-Dec-14
FY2015 30-Sep-15
myGrowth Fund (%) 3.23 9.26 19.98 1.16 -3.68
Benchmark (%) 2.41 11.85 13.29 -4.17 -4.94
-15.00
-12.00
-9.00
-6.00
-3.00
0.00
3.00
6.00
9.00
Re
turn
(%
)
myGrowth Fund vs Benchmark
myGrowth Fund Benchmark
For the period under review, the fund’s benchmark, FBMSI decreased by 4.94% to close at 11,889.05 points. In tandem with the movement of the benchmark, the performance of myGrowth Fund outperformed the benchmark by recording a negative return of 3.68%.
* Past performance of the Fund is not an indication of its future performance, and the performance is not guaranteed. The Fund returns are calculated based on the unit price of the Fund. Actual returns of the Fund are on a net basis (gross of tax and net of fees) and strictly based on the performance of the Fund, and not the returns earned on the actual premiums/ contributions paid for the investment-linked product.
ASSET ALLOCATION TOP 5 INVESTMENT HOLDINGS
42.48%
10.88%
5.98%
5.09%
4.77%
3.75% Trading/Services
Construction
Technology
Industrial Products
Infrastructure Project
Plantation
No. Security Name (Share) NAV
1 Axiata Group Berhad 6.00%
2 Sime Darby Berhad 5.91%
3 Tenaga Nasional Bhd 5.81%
4 Digi.Com Bhd 4.59%
5 Petronas Gas Bhd 4.11%
No. Sector NAV
1 Trading/Services 42.48%
2 Construction 10.88%
3 Technology 5.98%
4 Industrial Products 5.09%
5 Infrastructure Project 4.77%
6 Plantation 3.75%
Investment Objective To achieve capital growth opportunities and dividend income through selective investments in Shariah approved shares listed in Bursa Malaysia.
Investment Strategy Invest primarily in selected Shariah compliant
equities that comprise of a diversified portfolio of index-linked companies, blue-chip stocks and companies with growth prospects and attractive dividend yields that are listed on Bursa Malaysia;
Active portfolio management - constant review on asset allocation and stocks holding. Stock/portfolio turnover would be practically high in search for opportunities in capital gain and dividend yield stocks.
Asset Allocation Equity: 50% - 95% Cash/Sukuk: 5% - 50%
Fund Manager Investment Division of Syarikat Takaful Malaysia Berhad
Performance Benchmark FBM Emas Shariah Index (FBMSI) (Source: Bloomberg)
Fees & Charges Fund management fee
1.0% - 1.5% of fund’s NAV per annum
Custodian fee 0.03% of fund’s NAV per annum
Risk Profile High Since the fund investment also consist of growth stocks which are normally more volatile in prices as compared to blue chips and high dividend yield stocks, the investors should be prepared to accept some interim price volatility, of which sometimes can be significant to achieve that higher return. The key risks for this Fund are market risk, specific security risk, interest rate risk, credit/default risk, liquidity risk, operational risk, reclassification of Shariah status risk. Please refer to Appendix 1 for further details.
Risk Management Proper asset allocation, diversification and liquidity management are among the methods can be adopted by the Fund Manager to manage the Fund risks. If there is high possibility that the equity market may fall, the exposure in equity investment would be reduced to a lower level and vice versa. The Fund Manager will also adopt a prudent investment selection process by investing in selected stock universe after undergoing some screening process. In managing the investment risks for IDS, the Fund Manager will adopt extensive research and analysis on the issuer, credit rating, maturity factor, liquidity and selected yield measures. The Fund Manager will also constantly monitor the macro economic factors that may impact the interest rate environment.
(RM)
At Inception 1.000
As at 30 September 2015 1.292
Highest last 5-years 1.455
Lowest last 5-years 0.972
Target Market Customers who prefer a high risk investment profile with a high expected return.
Basis & Frequency of Unit Valuation Please refer to Appendix 2.
Exceptional Circumstances Please refer to Appendix 2.
Disclaimer: This fact sheet has been prepared by Syarikat Takaful Malaysia Berhad (“Takaful Malaysia”) for general information and illustration purposes only and shall not be construed as an offer, solicitation or recommendation to sell or buy any security or financial product. Although the materials used in preparing this presentation are obtained from sources believed to be reliable, Takaful Malaysia makes no guarantee on the accuracy and completeness of the information. Any analysis and opinion expressed are subject to change without notification. Past performance is no guarantee of future results. Viewers are advised to contact Takaful Malaysia or its agents for further and better particulars and information pertaining to the products offered by us. Takaful Malaysia hereby disclaims any liability of whatsoever nature should viewers suffer losses merely relying on the information contained herein.
SECTOR ALLOCATION
NAV PER UNIT
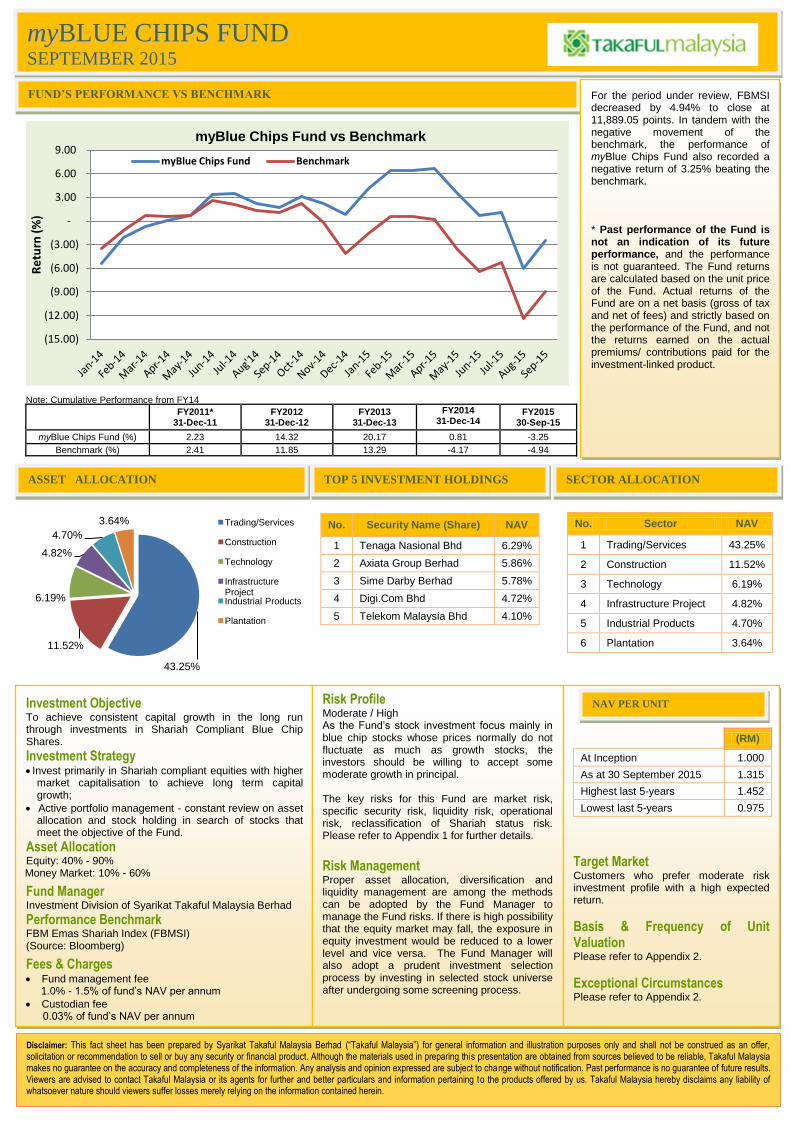
mmyyBBLLUUEE CCHHIIPPSS FFUUNNDD SSEEPPTTEEMMBBEERR 22001155
FUND’S PERFORMANCE VS BENCHMARK
Note: Cumulative Performance from FY14
FY2011*
31-Dec-11
FY2012 31-Dec-12
FY2013 31-Dec-13
FY2014 31-Dec-14
FY2015 30-Sep-15
myBlue Chips Fund (%) 2.23 14.32 20.17 0.81 -3.25
Benchmark (%) 2.41 11.85 13.29 -4.17 -4.94
(15.00)
(12.00)
(9.00)
(6.00)
(3.00)
-
3.00
6.00
9.00
Re
turn
(%
)
myBlue Chips Fund vs Benchmark
myBlue Chips Fund Benchmark
For the period under review, FBMSI decreased by 4.94% to close at 11,889.05 points. In tandem with the negative movement of the benchmark, the performance of myBlue Chips Fund also recorded a negative return of 3.25% beating the benchmark.
* Past performance of the Fund is not an indication of its future performance, and the performance is not guaranteed. The Fund returns are calculated based on the unit price of the Fund. Actual returns of the Fund are on a net basis (gross of tax and net of fees) and strictly based on the performance of the Fund, and not the returns earned on the actual premiums/ contributions paid for the investment-linked product.
ASSET ALLOCATION TOP 5 INVESTMENT HOLDINGS
43.25%
11.52%
6.19%
4.82%
4.70%
3.64% Trading/Services
Construction
Technology
Infrastructure Project Industrial Products
Plantation
No. Security Name (Share) NAV
1 Tenaga Nasional Bhd 6.29%
2 Axiata Group Berhad 5.86%
3 Sime Darby Berhad 5.78%
4 Digi.Com Bhd 4.72%
5 Telekom Malaysia Bhd 4.10%
No. Sector NAV
1 Trading/Services 43.25%
2 Construction 11.52%
3 Technology 6.19%
4 Infrastructure Project 4.82%
5 Industrial Products 4.70%
6 Plantation 3.64%
Investment Objective To achieve consistent capital growth in the long run through investments in Shariah Compliant Blue Chip Shares.
Investment Strategy Invest primarily in Shariah compliant equities with higher
market capitalisation to achieve long term capital growth;
Active portfolio management - constant review on asset allocation and stock holding in search of stocks that meet the objective of the Fund.
Asset Allocation Equity: 40% - 90% Money Market: 10% - 60%
Fund Manager Investment Division of Syarikat Takaful Malaysia Berhad
Performance Benchmark FBM Emas Shariah Index (FBMSI) (Source: Bloomberg)
Fees & Charges Fund management fee 1.0% - 1.5% of fund’s NAV per annum
Custodian fee 0.03% of fund’s NAV per annum
Risk Profile Moderate / High As the Fund’s stock investment focus mainly in blue chip stocks whose prices normally do not fluctuate as much as growth stocks, the investors should be willing to accept some moderate growth in principal. The key risks for this Fund are market risk, specific security risk, liquidity risk, operational risk, reclassification of Shariah status risk. Please refer to Appendix 1 for further details.
Risk Management Proper asset allocation, diversification and liquidity management are among the methods can be adopted by the Fund Manager to manage the Fund risks. If there is high possibility that the equity market may fall, the exposure in equity investment would be reduced to a lower level and vice versa. The Fund Manager will also adopt a prudent investment selection process by investing in selected stock universe after undergoing some screening process.
(RM)
At Inception 1.000
As at 30 September 2015 1.315
Highest last 5-years 1.452
Lowest last 5-years 0.975
Target Market Customers who prefer moderate risk investment profile with a high expected return.
Basis & Frequency of Unit Valuation Please refer to Appendix 2.
Exceptional Circumstances Please refer to Appendix 2.
Disclaimer: This fact sheet has been prepared by Syarikat Takaful Malaysia Berhad (“Takaful Malaysia”) for general information and illustration purposes only and shall not be construed as an offer, solicitation or recommendation to sell or buy any security or financial product. Although the materials used in preparing this presentation are obtained from sources believed to be reliable, Takaful Malaysia makes no guarantee on the accuracy and completeness of the information. Any analysis and opinion expressed are subject to change without notification. Past performance is no guarantee of future results. Viewers are advised to contact Takaful Malaysia or its agents for further and better particulars and information pertaining to the products offered by us. Takaful Malaysia hereby disclaims any liability of whatsoever nature should viewers suffer losses merely relying on the information contained herein.
SECTOR ALLOCATION
NAV PER UNIT
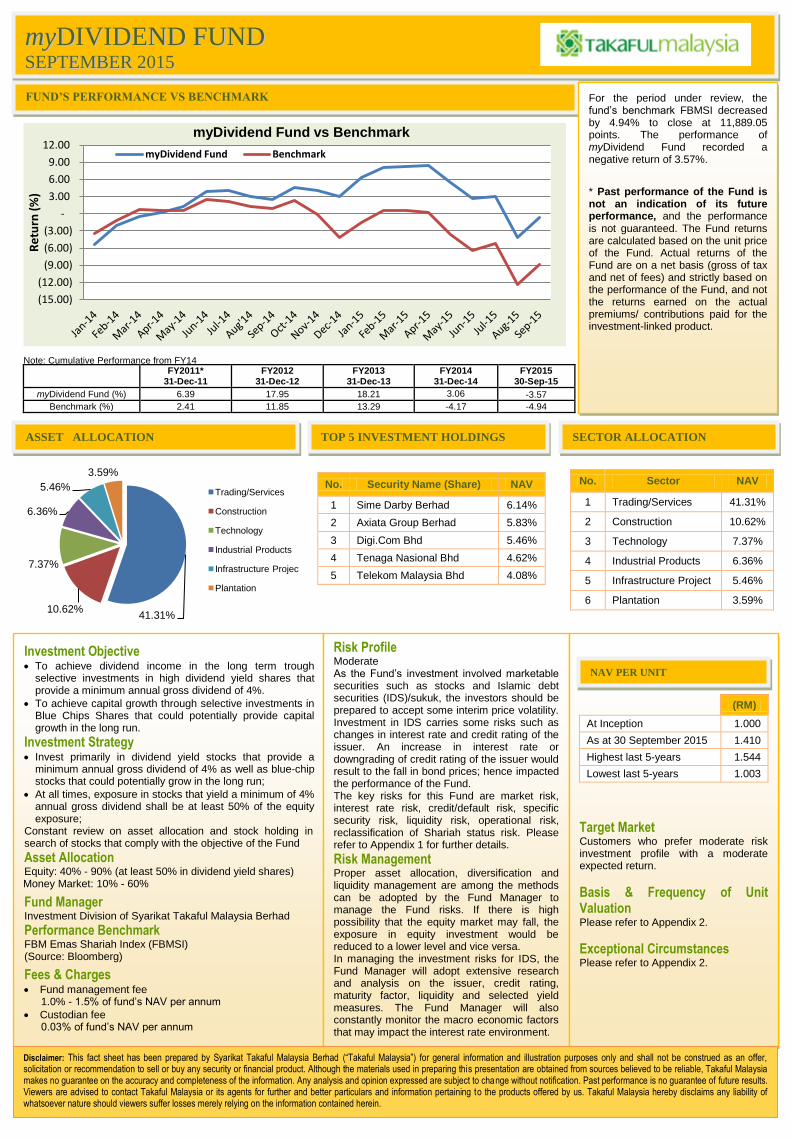
mmyyDDIIVVIIDDEENNDD FFUUNNDD SSEEPPTTEEMMBBEERR 22001155
FUND’S PERFORMANCE VS BENCHMARK
Note: Cumulative Performance from FY14
FY2011*
31-Dec-11
FY2012 31-Dec-12
FY2013 31-Dec-13
FY2014 31-Dec-14
FY2015 30-Sep-15
myDividend Fund (%) 6.39 17.95 18.21 3.06 -3.57
Benchmark (%) 2.41 11.85 13.29 -4.17 -4.94
(15.00)
(12.00)
(9.00)
(6.00)
(3.00)
-
3.00
6.00
9.00
12.00
Re
turn
(%
)
myDividend Fund vs Benchmark
myDividend Fund Benchmark
For the period under review, the fund’s benchmark FBMSI decreased by 4.94% to close at 11,889.05 points. The performance of myDividend Fund recorded a negative return of 3.57%.
* Past performance of the Fund is not an indication of its future performance, and the performance is not guaranteed. The Fund returns are calculated based on the unit price of the Fund. Actual returns of the Fund are on a net basis (gross of tax and net of fees) and strictly based on the performance of the Fund, and not the returns earned on the actual premiums/ contributions paid for the investment-linked product.
ASSET ALLOCATION TOP 5 INVESTMENT HOLDINGS
41.31%
10.62%
7.37%
6.36%
5.46%
3.59%
Trading/Services
Construction
Technology
Industrial Products
Infrastructure Project
Plantation
No. Security Name (Share) NAV
1 Sime Darby Berhad 6.14%
2 Axiata Group Berhad 5.83%
3 Digi.Com Bhd 5.46%
4 Tenaga Nasional Bhd 4.62%
5 Telekom Malaysia Bhd 4.08%
No. Sector NAV
1 Trading/Services 41.31%
2 Construction 10.62%
3 Technology 7.37%
4 Industrial Products 6.36%
5 Infrastructure Project 5.46%
6 Plantation 3.59%
Investment Objective To achieve dividend income in the long term trough
selective investments in high dividend yield shares that provide a minimum annual gross dividend of 4%.
To achieve capital growth through selective investments in Blue Chips Shares that could potentially provide capital growth in the long run.
Investment Strategy Invest primarily in dividend yield stocks that provide a
minimum annual gross dividend of 4% as well as blue-chip stocks that could potentially grow in the long run;
At all times, exposure in stocks that yield a minimum of 4% annual gross dividend shall be at least 50% of the equity exposure;
Constant review on asset allocation and stock holding in search of stocks that comply with the objective of the Fund
Asset Allocation Equity: 40% - 90% (at least 50% in dividend yield shares) Money Market: 10% - 60%
Fund Manager Investment Division of Syarikat Takaful Malaysia Berhad
Performance Benchmark FBM Emas Shariah Index (FBMSI) (Source: Bloomberg)
Fees & Charges Fund management fee
1.0% - 1.5% of fund’s NAV per annum
Custodian fee 0.03% of fund’s NAV per annum
Risk Profile Moderate As the Fund’s investment involved marketable securities such as stocks and Islamic debt securities (IDS)/sukuk, the investors should be prepared to accept some interim price volatility. Investment in IDS carries some risks such as changes in interest rate and credit rating of the issuer. An increase in interest rate or downgrading of credit rating of the issuer would result to the fall in bond prices; hence impacted the performance of the Fund. The key risks for this Fund are market risk, interest rate risk, credit/default risk, specific security risk, liquidity risk, operational risk, reclassification of Shariah status risk. Please refer to Appendix 1 for further details.
Risk Management Proper asset allocation, diversification and liquidity management are among the methods can be adopted by the Fund Manager to manage the Fund risks. If there is high possibility that the equity market may fall, the exposure in equity investment would be reduced to a lower level and vice versa. In managing the investment risks for IDS, the Fund Manager will adopt extensive research and analysis on the issuer, credit rating, maturity factor, liquidity and selected yield measures. The Fund Manager will also constantly monitor the macro economic factors that may impact the interest rate environment.
(RM)
At Inception 1.000
As at 30 September 2015 1.410
Highest last 5-years 1.544
Lowest last 5-years 1.003
Target Market Customers who prefer moderate risk investment profile with a moderate expected return.
Basis & Frequency of Unit Valuation Please refer to Appendix 2.
Exceptional Circumstances Please refer to Appendix 2.
Disclaimer: This fact sheet has been prepared by Syarikat Takaful Malaysia Berhad (“Takaful Malaysia”) for general information and illustration purposes only and shall not be construed as an offer, solicitation or recommendation to sell or buy any security or financial product. Although the materials used in preparing this presentation are obtained from sources believed to be reliable, Takaful Malaysia makes no guarantee on the accuracy and completeness of the information. Any analysis and opinion expressed are subject to change without notification. Past performance is no guarantee of future results. Viewers are advised to contact Takaful Malaysia or its agents for further and better particulars and information pertaining to the products offered by us. Takaful Malaysia hereby disclaims any liability of whatsoever nature should viewers suffer losses merely relying on the information contained herein.
SECTOR ALLOCATION
NAV PER UNIT
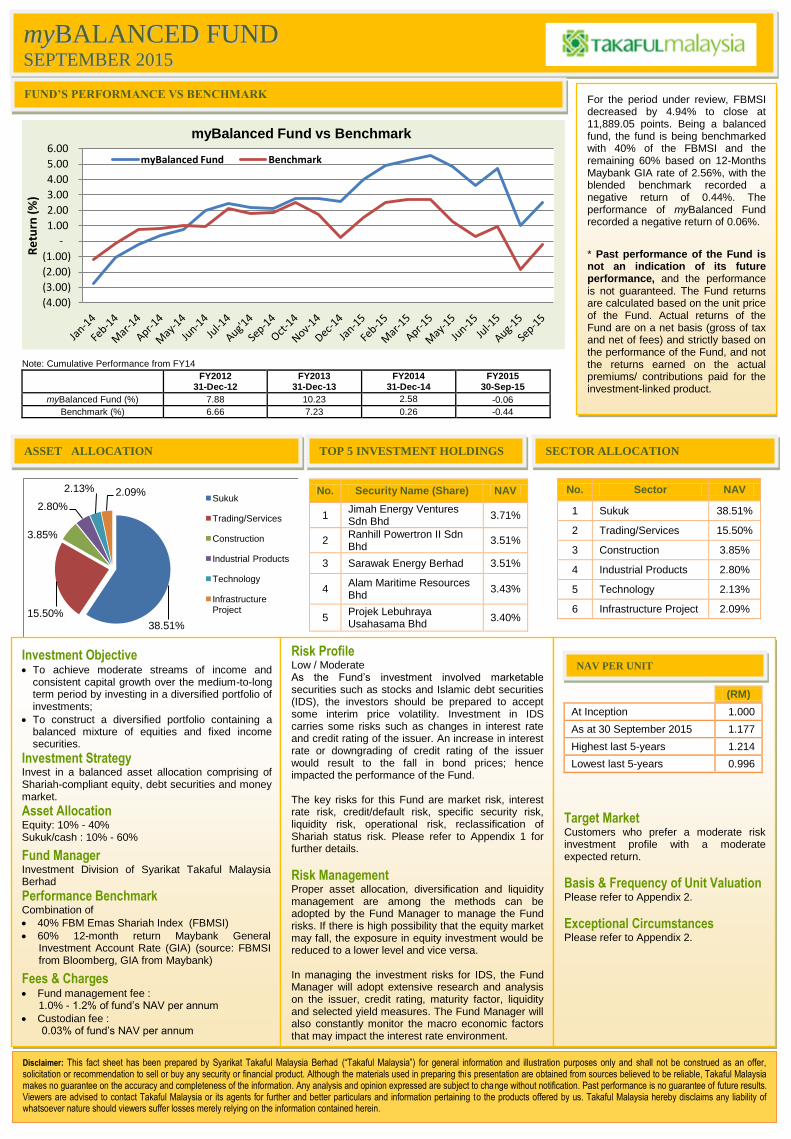
mmyyBBAALLAANNCCEEDD FFUUNNDD SSEEPPTTEEMMBBEERR 22001155
FUND’S PERFORMANCE VS BENCHMARK
Note: Cumulative Performance from FY14
FY2012
31-Dec-12
FY2013 31-Dec-13
FY2014 31-Dec-14
FY2015 30-Sep-15
myBalanced Fund (%) 7.88 10.23 2.58 -0.06
Benchmark (%) 6.66 7.23 0.26 -0.44
(4.00)
(3.00)
(2.00)
(1.00)
-
1.00
2.00
3.00
4.00
5.00
6.00
Re
turn
(%
)
myBalanced Fund vs Benchmark
myBalanced Fund Benchmark
For the period under review, FBMSI decreased by 4.94% to close at 11,889.05 points. Being a balanced fund, the fund is being benchmarked with 40% of the FBMSI and the remaining 60% based on 12-Months Maybank GIA rate of 2.56%, with the blended benchmark recorded a negative return of 0.44%. The performance of myBalanced Fund recorded a negative return of 0.06%.
* Past performance of the Fund is not an indication of its future performance, and the performance is not guaranteed. The Fund returns are calculated based on the unit price of the Fund. Actual returns of the Fund are on a net basis (gross of tax and net of fees) and strictly based on the performance of the Fund, and not the returns earned on the actual premiums/ contributions paid for the investment-linked product.
ASSET ALLOCATION TOP 5 INVESTMENT HOLDINGS
38.51%
15.50%
3.85%
2.80%
2.13% 2.09% Sukuk
Trading/Services
Construction
Industrial Products
Technology
Infrastructure Project
No. Security Name (Share) NAV
1 Jimah Energy Ventures Sdn Bhd
3.71%
2 Ranhill Powertron II Sdn Bhd
3.51%
3 Sarawak Energy Berhad 3.51%
4 Alam Maritime Resources Bhd
3.43%
5 Projek Lebuhraya Usahasama Bhd
3.40%
No. Sector NAV
1 Sukuk 38.51%
2 Trading/Services 15.50%
3 Construction 3.85%
4 Industrial Products 2.80%
5 Technology 2.13%
6 Infrastructure Project 2.09%
Investment Objective To achieve moderate streams of income and
consistent capital growth over the medium-to-long term period by investing in a diversified portfolio of investments;
To construct a diversified portfolio containing a balanced mixture of equities and fixed income securities.
Investment Strategy Invest in a balanced asset allocation comprising of Shariah-compliant equity, debt securities and money market.
Asset Allocation Equity: 10% - 40% Sukuk/cash : 10% - 60%
Fund Manager Investment Division of Syarikat Takaful Malaysia Berhad
Performance Benchmark Combination of
40% FBM Emas Shariah Index (FBMSI)
60% 12-month return Maybank General Investment Account Rate (GIA) (source: FBMSI from Bloomberg, GIA from Maybank)
Fees & Charges Fund management fee :
1.0% - 1.2% of fund’s NAV per annum
Custodian fee : 0.03% of fund’s NAV per annum
Risk Profile Low / Moderate As the Fund’s investment involved marketable securities such as stocks and Islamic debt securities (IDS), the investors should be prepared to accept some interim price volatility. Investment in IDS carries some risks such as changes in interest rate and credit rating of the issuer. An increase in interest rate or downgrading of credit rating of the issuer would result to the fall in bond prices; hence impacted the performance of the Fund. The key risks for this Fund are market risk, interest rate risk, credit/default risk, specific security risk, liquidity risk, operational risk, reclassification of Shariah status risk. Please refer to Appendix 1 for further details.
Risk Management Proper asset allocation, diversification and liquidity management are among the methods can be adopted by the Fund Manager to manage the Fund risks. If there is high possibility that the equity market may fall, the exposure in equity investment would be reduced to a lower level and vice versa. In managing the investment risks for IDS, the Fund Manager will adopt extensive research and analysis on the issuer, credit rating, maturity factor, liquidity and selected yield measures. The Fund Manager will also constantly monitor the macro economic factors that may impact the interest rate environment.
(RM)
At Inception 1.000
As at 30 September 2015 1.177
Highest last 5-years 1.214
Lowest last 5-years 0.996
Target Market Customers who prefer a moderate risk investment profile with a moderate expected return.
Basis & Frequency of Unit Valuation Please refer to Appendix 2.
Exceptional Circumstances Please refer to Appendix 2.
Disclaimer: This fact sheet has been prepared by Syarikat Takaful Malaysia Berhad (“Takaful Malaysia”) for general information and illustration purposes only and shall not be construed as an offer, solicitation or recommendation to sell or buy any security or financial product. Although the materials used in preparing this presentation are obtained from sources believed to be reliable, Takaful Malaysia makes no guarantee on the accuracy and completeness of the information. Any analysis and opinion expressed are subject to change without notification. Past performance is no guarantee of future results. Viewers are advised to contact Takaful Malaysia or its agents for further and better particulars and information pertaining to the products offered by us. Takaful Malaysia hereby disclaims any liability of whatsoever nature should viewers suffer losses merely relying on the information contained herein.
SECTOR ALLOCATION
NAV PER UNIT
Note: Cumulative Performance from FY14
FY2011*
31-Dec-11
FY2012 31-Dec-12
FY2013 31-Dec-13
FY2014 31-Dec-14
FY2015 30-Sep-15
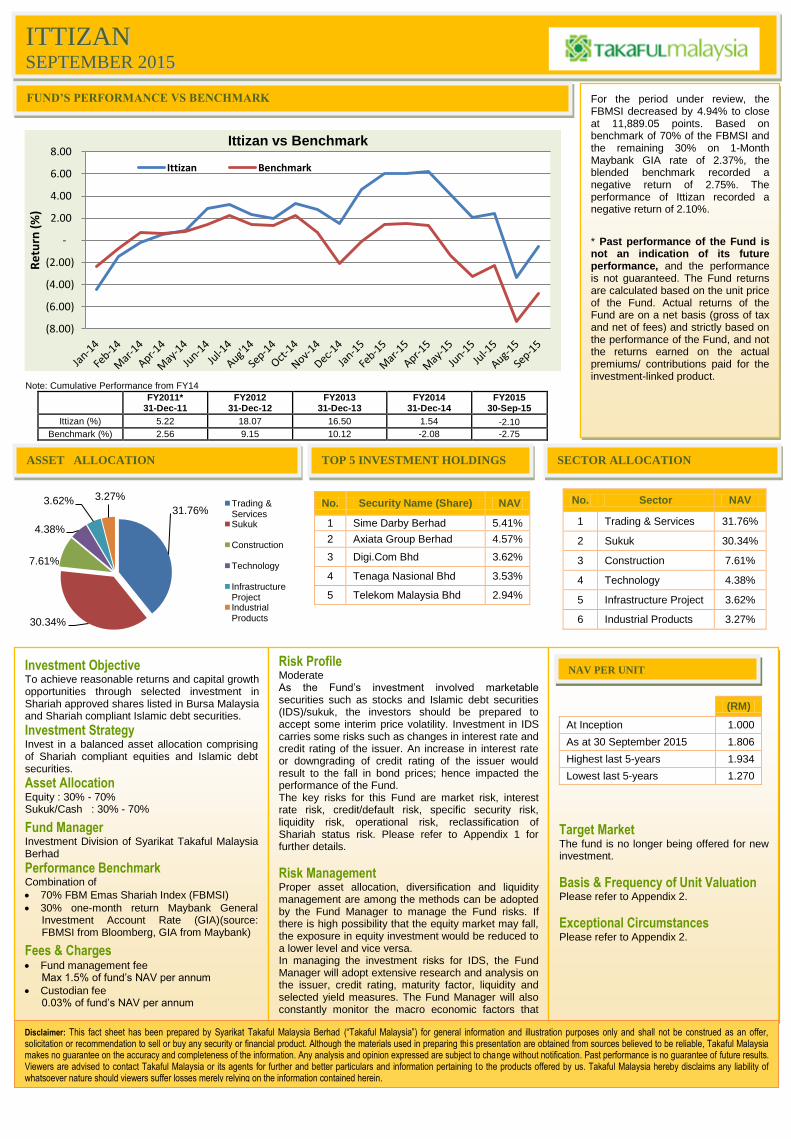
Ittizan (%) 5.22 18.07 16.50 1.54 -2.10
Benchmark (%) 2.56 9.15 10.12 -2.08 -2.75
IITTTTIIZZAANN SSEEPPTTEEMMBBEERR 22001155
FUND’S PERFORMANCE VS BENCHMARK For the period under review, the
FBMSI decreased by 4.94% to close at 11,889.05 points. Based on benchmark of 70% of the FBMSI and the remaining 30% on 1-Month Maybank GIA rate of 2.37%, the blended benchmark recorded a negative return of 2.75%. The performance of Ittizan recorded a negative return of 2.10%.
* Past performance of the Fund is not an indication of its future performance, and the performance is not guaranteed. The Fund returns are calculated based on the unit price of the Fund. Actual returns of the Fund are on a net basis (gross of tax and net of fees) and strictly based on the performance of the Fund, and not the returns earned on the actual premiums/ contributions paid for the investment-linked product.
(8.00)
(6.00)
(4.00)
(2.00)
-
2.00
4.00
6.00
8.00
Re
turn
(%
)
Ittizan vs Benchmark
Ittizan Benchmark
ASSET ALLOCATION TOP 5 INVESTMENT HOLDINGS SECTOR ALLOCATION
31.76%
30.34%
7.61%
4.38%
3.62% 3.27% Trading & Services Sukuk
Construction
Technology
Infrastructure Project Industrial Products
No. Security Name (Share) NAV
1 Sime Darby Berhad 5.41%
2 Axiata Group Berhad 4.57%
3 Digi.Com Bhd 3.62%
4 Tenaga Nasional Bhd 3.53%
5 Telekom Malaysia Bhd 2.94%
No. Sector NAV
1 Trading & Services 31.76%
2 Sukuk 30.34%
3 Construction 7.61%
4 Technology 4.38%
5 Infrastructure Project 3.62%
6 Industrial Products 3.27%
Investment Objective To achieve reasonable returns and capital growth opportunities through selected investment in Shariah approved shares listed in Bursa Malaysia and Shariah compliant Islamic debt securities.
Investment Strategy Invest in a balanced asset allocation comprising of Shariah compliant equities and Islamic debt securities. Asset Allocation Equity : 30% - 70% Sukuk/Cash : 30% - 70%
Fund Manager Investment Division of Syarikat Takaful Malaysia Berhad
Performance Benchmark Combination of
70% FBM Emas Shariah Index (FBMSI)
30% one-month return Maybank General Investment Account Rate (GIA)(source: FBMSI from Bloomberg, GIA from Maybank)
Fees & Charges Fund management fee
Max 1.5% of fund’s NAV per annum
Custodian fee 0.03% of fund’s NAV per annum
Risk Profile Moderate As the Fund’s investment involved marketable securities such as stocks and Islamic debt securities (IDS)/sukuk, the investors should be prepared to accept some interim price volatility. Investment in IDS carries some risks such as changes in interest rate and credit rating of the issuer. An increase in interest rate or downgrading of credit rating of the issuer would result to the fall in bond prices; hence impacted the performance of the Fund. The key risks for this Fund are market risk, interest rate risk, credit/default risk, specific security risk, liquidity risk, operational risk, reclassification of Shariah status risk. Please refer to Appendix 1 for further details.
Risk Management Proper asset allocation, diversification and liquidity management are among the methods can be adopted by the Fund Manager to manage the Fund risks. If there is high possibility that the equity market may fall, the exposure in equity investment would be reduced to a lower level and vice versa. In managing the investment risks for IDS, the Fund Manager will adopt extensive research and analysis on the issuer, credit rating, maturity factor, liquidity and selected yield measures. The Fund Manager will also constantly monitor the macro economic factors that may impact the interest rate environment.
(RM)
At Inception 1.000
As at 30 September 2015 1.806
Highest last 5-years 1.934
Lowest last 5-years 1.270
Target Market The fund is no longer being offered for new investment.
Basis & Frequency of Unit Valuation Please refer to Appendix 2.
Exceptional Circumstances Please refer to Appendix 2.
Disclaimer: This fact sheet has been prepared by Syarikat Takaful Malaysia Berhad (“Takaful Malaysia”) for general information and illustration purposes only and shall not be construed as an offer, solicitation or recommendation to sell or buy any security or financial product. Although the materials used in preparing this presentation are obtained from sources believed to be reliable, Takaful Malaysia makes no guarantee on the accuracy and completeness of the information. Any analysis and opinion expressed are subject to change without notification. Past performance is no guarantee of future results. Viewers are advised to contact Takaful Malaysia or its agents for further and better particulars and information pertaining to the products offered by us. Takaful Malaysia hereby disclaims any liability of whatsoever nature should viewers suffer losses merely relying on the information contained herein.
NAV PER UNIT
NAV PER UNIT
Note: Cumulative Performance from FY14
FY2011*
31-Dec-11
FY2012 31-Dec-12
FY2013 31-Dec-13
FY2014 31-Dec-14
FY2015 30-Sep-15
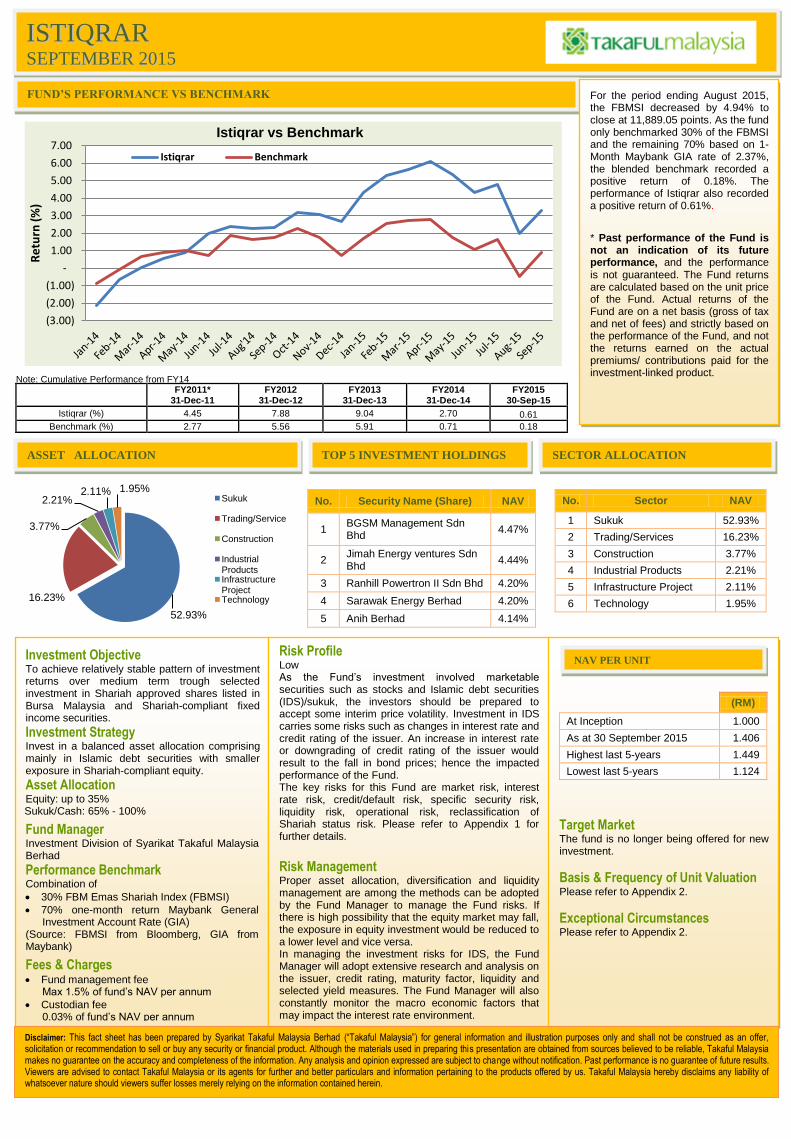
Istiqrar (%) 4.45 7.88 9.04 2.70 0.61
Benchmark (%) 2.77 5.56 5.91 0.71 0.18
IISSTTIIQQRRAARR SSEEPPTTEEMMBBEERR 22001155
FUND’S PERFORMANCE VS BENCHMARK For the period ending August 2015,
the FBMSI decreased by 4.94% to close at 11,889.05 points. As the fund only benchmarked 30% of the FBMSI and the remaining 70% based on 1-Month Maybank GIA rate of 2.37%, the blended benchmark recorded a positive return of 0.18%. The performance of Istiqrar also recorded a positive return of 0.61%.
* Past performance of the Fund is not an indication of its future performance, and the performance is not guaranteed. The Fund returns are calculated based on the unit price of the Fund. Actual returns of the Fund are on a net basis (gross of tax and net of fees) and strictly based on the performance of the Fund, and not the returns earned on the actual premiums/ contributions paid for the investment-linked product.
(3.00)
(2.00)
(1.00)
-
1.00
2.00
3.00
4.00
5.00
6.00
7.00
Re
turn
(%
)
Istiqrar vs Benchmark
Istiqrar Benchmark
ASSET ALLOCATION TOP 5 INVESTMENT HOLDINGS SECTOR ALLOCATION
52.93%
16.23%
3.77%
2.21% 2.11% 1.95%
Sukuk
Trading/Services
Construction
Industrial Products Infrastructure Project Technology
No. Security Name (Share) NAV
1 BGSM Management Sdn Bhd
4.47%
2 Jimah Energy ventures Sdn Bhd
4.44%
3 Ranhill Powertron II Sdn Bhd 4.20%
4 Sarawak Energy Berhad 4.20%
5 Anih Berhad 4.14%
No. Sector NAV
1 Sukuk 52.93%
2 Trading/Services 16.23%
3 Construction 3.77%
4 Industrial Products 2.21%
5 Infrastructure Project 2.11%
6 Technology 1.95%
Investment Objective To achieve relatively stable pattern of investment returns over medium term trough selected investment in Shariah approved shares listed in Bursa Malaysia and Shariah-compliant fixed income securities.
Investment Strategy Invest in a balanced asset allocation comprising mainly in Islamic debt securities with smaller exposure in Shariah-compliant equity.
Asset Allocation Equity: up to 35% Sukuk/Cash: 65% - 100%
Fund Manager Investment Division of Syarikat Takaful Malaysia Berhad
Performance Benchmark Combination of
30% FBM Emas Shariah Index (FBMSI)
70% one-month return Maybank General Investment Account Rate (GIA)
(Source: FBMSI from Bloomberg, GIA from Maybank)
Fees & Charges Fund management fee
Max 1.5% of fund’s NAV per annum
Custodian fee 0.03% of fund’s NAV per annum
Risk Profile Low As the Fund’s investment involved marketable securities such as stocks and Islamic debt securities (IDS)/sukuk, the investors should be prepared to accept some interim price volatility. Investment in IDS carries some risks such as changes in interest rate and credit rating of the issuer. An increase in interest rate or downgrading of credit rating of the issuer would result to the fall in bond prices; hence the impacted performance of the Fund. The key risks for this Fund are market risk, interest rate risk, credit/default risk, specific security risk, liquidity risk, operational risk, reclassification of Shariah status risk. Please refer to Appendix 1 for further details.
Risk Management Proper asset allocation, diversification and liquidity management are among the methods can be adopted by the Fund Manager to manage the Fund risks. If there is high possibility that the equity market may fall, the exposure in equity investment would be reduced to a lower level and vice versa. In managing the investment risks for IDS, the Fund Manager will adopt extensive research and analysis on the issuer, credit rating, maturity factor, liquidity and selected yield measures. The Fund Manager will also constantly monitor the macro economic factors that may impact the interest rate environment.
(RM)
At Inception 1.000
As at 30 September 2015 1.406
Highest last 5-years 1.449
Lowest last 5-years 1.124
Target Market The fund is no longer being offered for new investment.
Basis & Frequency of Unit Valuation Please refer to Appendix 2.
Exceptional Circumstances Please refer to Appendix 2.
Disclaimer: This fact sheet has been prepared by Syarikat Takaful Malaysia Berhad (“Takaful Malaysia”) for general information and illustration purposes only and shall not be construed as an offer, solicitation or recommendation to sell or buy any security or financial product. Although the materials used in preparing this presentation are obtained from sources believed to be reliable, Takaful Malaysia makes no guarantee on the accuracy and completeness of the information. Any analysis and opinion expressed are subject to change without notification. Past performance is no guarantee of future results. Viewers are advised to contact Takaful Malaysia or its agents for further and better particulars and information pertaining to the products offered by us. Takaful Malaysia hereby disclaims any liability of whatsoever nature should viewers suffer losses merely relying on the information contained herein.
NAV PER UNIT
Appendix 1 SEPTEMBER 2015
Definition of Risks and Risk Management Techniques
1. Market risk
Refers to potential impact arising from adverse price movements that affects the market values of the investments due to changes in economic
cycles, financial market conditions, currency and interest rate. The risk may also arise due to changes in any political and regulatory forms.
Market risk is managed through portfolio diversification and asset allocation whereby the securities exposure is monitored / reduced in the event of
anticipated market weaknesses.
2. Liquidity risk
Refers to potential impact of not being able to convert Shariah compliant investment into cash at or near its fair value, which primarily depends on the
volume traded for that particular Shariah compliant investments in the market.
The investment policy is to always maintain a prudent level of liquid assets so as to reduce liquidity risk.
3. Interest rate risk
Refers to potential impact affecting the market values of investment into Islamic debt securities arising from adverse movement in interest rates.
When interest rate rise, the value of Islamic debt securities fall and vice versa, thus affecting the market value of the fund. Although the fund does not
invest in conventional bonds, any changes in interest rate trend could also affect the price and yield of Islamic debt securities as conventional interest
rate is generally used as indicative rate to determine the profit rate for the Islamic debt securities.
In managing the risks, the Fund Manager will adopt an active investment management by constantly review the fund’s strategy and portfolio.
4. Credit/Default risk
Refers to potential decrease in credit worthiness of the issuers for Islamic debt investments in the event that the issuer is faced with unexpected
financial difficulties. In the worst case scenario, the issuer may default in the payment of principal and profits for the Islamic debt securities issued,
decreasing the prices and value of that particular Islamic debt securities and thus affecting the market value of the fund.
The Fund Manager manages the risk by setting internal counterparty limits and undertaking internal credit evaluation to minimize such risk.
5. Specific security risk
Refers to the risk of individual security including stock or Islamic debt security invested in the portfolio. A major price change of any particular security,
which is a component of the fund’s portfolio, would affect the NAV and daily prices of the Fund.
The mechanism employed to minimize the risk is through the process of portfolio diversification and prudent investment selection process by the
Fund Manager.
6. Operational risk
Refers to the risk that the Company fails to fulfill its obligation or perform other required actions because of inadequate policies and procedures,
human resources, information systems or internal control.
To minimize the risks, the Fund Manager will work with the Fund‘s Trustee, internal compliance unit and other divisions to ensure compliance with all
relevant legislations and policies and procedures are put in place at all the time.
7. Reclassification of Shariah status risk
Refers to potential revision on the status of Shariah compliant securities in the fund to become non-Shariah compliant in the periodic review by the
SAC.
The Fund Manager will take the necessary steps to dispose such securities in accordance with the advice from the SAC and the Shariah Advisor.
The Fund Manager will manage the investment-linked funds according to the fund strategy and target asset allocation policy. Nevertheless, the Fund Manager
may take temporary steps which may not be consistent with the stated strategy and asset allocation policy in attempting to respond to adverse market,
economic conditions.
Fund’s Performance vs Benchmark
Appendix 2 SEPTEMBER 2015
Basis & Frequency of Unit Valuation The Unit Price on any Valuation Date of the Investment Linked Fund shall be obtained by dividing the NAV on the business day before the Valuation Date by
the number of Units in issue of the Investment Linked Fund.
In order to determine the Unit Price of each Unit on a Valuation Date, the Net Asset Value (NAV) of the Fund shall be calculated as follows:
(a) the amount for which in the opinion of the Company after taking such independent advice as they consider appropriate, the investments of the
Investment Linked Fund could be transacted in the open market on the Valuation Date by reference where applicable to the market dealing prices
quoted on a recognized stock exchange selected by the Company with the addition of expenses which would be incurred, plus
(b) in respect of the interests in the nature of land and other securities or properties of whatsoever nature held in the Investment Linked Fund the amount
which in the opinion of the Company after taking such independent advice as they consider appropriate is the value of such interests on the Valuation
Date with the addition of the expenses which would be incurred if such interests were transacted on the day, plus
(c) the amount of cash held uninvested in the Investment Linked Fund on the Valuation Date, less
(d) the amount (if any) which the Company shall determine on the Valuation Date shall be treated as liabilities of the Investment Linked Fund, less
(e) such amount as the Company shall consider to be just and equitable in respect of costs of valuation of any interests in the nature of land which are
comprised in the Investment Linked Fund and other expenses and outgoings properly attributable to such interest, less
(f) the applicable Fund Management Charge
There shall be deductions from the Investment Linked Fund of such amounts as the Company in its absolute discretion considers appropriate, as due
allowances for any levy, tax, duties or any other charges of whatsoever nature arising in respect of which the Fund may become liable.
To ensure fair treatment to all certificate owners of the fund, the Company may impute the transaction costs of acquiring or disposing of assets of the fund, if the
costs are significant. To recoup the cost of acquiring and disposing of assets, the company may make a dilution or transaction cost adjustment to the NAV per
unit to recover any amount which the fund had already paid or reasonably expects to pay for the creation or cancellation of units.
The Investment-linked Funds are valued on each business day. However, the Company may alter the frequency and date on which the Unit Price shall be
calculated by giving three (3) calendar months prior written notice to the Certificate Owner.
Exceptional Circumstances The Company reserves the right to take the following actions that may become necessary due to change of circumstances, as a means to protect the interest of
the certificate owner.
Subject to at least three (3) months written notice, the Company may:
(a) close any of the Unit Fund or cease to allow the allocation of additional Contribution or to transfer the assets to a new fund which has similar
investment objectives;
(b) change the name of the Unit Funds;
(c) split or combine existing units of Unit Funds;
(d) make any changes that may be required due to regulatory requirement and/or the legislation.
The Company may also choose to, without prior notice, suspend unit pricing and Certificate transactions if any of the exchanges in which the Unit Fund is
invested is temporarily suspended for trading;
In circumstances considered by the Company in its absolute discretion, to be prejudicial to the interests of participants, the Company reserves the right to
defer Partial Withdrawal and Surrender payment for a period not exceeding six (6) months from the date of redemption.
Issued by Syarikat Takaful Malaysia Berhad (131646-K)
Syarikat Takaful Malaysia Berhad was incorporated on 29 November 1984 and commenced operations in July 1985. It has an authorised capital of RM500
million and a paid up capital of RM162 million. The Company was listed on the Main Board of the Malaysian Stock Exchange on 30 July 1996. In accordance
with the Takaful Act 1984, Takaful Malaysia provides two types of Takaful business namely Family Takaful Business and General Takaful Business. Takaful
Malaysia has 30 outlets nationwide with total assets of RM6.7 billion at group level.
Tel : 603 - 2268 1984, 1300-8-TAKAFUL(825 2385)
Fax : 603 - 2274 0237
Email : [email protected] Website : takaful-malaysia.com.my
Fund’s Performance vs Benchmark