BILLY BISHOP TORONTO CITY AIRPORT …¢timent Infrastructures municipales Transport Industriel...
26
Infrastructures municipales Bâtiment Transport Industriel Énergie Environnement BILLY BISHOP TORONTO CITY AIRPORT PRELIMINARY RUNWAY DESIGN COASTAL ENGINEERING STUDY N. Guillemette 1 , C. Glodowski 1 , P. Dupuis 1 , S. Renaud 1 , S. Baker 2 , A. Cornett 2 , G. Comfort 3 1 WSP Canada Inc. 2 National Research Council Canada 3 G. Comfort Ice Engineering Ltd.
Transcript of BILLY BISHOP TORONTO CITY AIRPORT …¢timent Infrastructures municipales Transport Industriel...

Infrastructures municipales Bâtiment Transport Industriel Énergie Environnement
BILLY BISHOP TORONTO CITY AIRPORT
PRELIMINARY RUNWAY DESIGN
COASTAL ENGINEERING STUDY
N. Guillemette1, C. Glodowski1, P. Dupuis1, S. Renaud1, S. Baker2, A. Cornett2, G. Comfort3 1 WSP Canada Inc.
2 National Research Council Canada 3 G. Comfort Ice Engineering Ltd.

STUDY AREA

STUDY AREA: BILLY BISHOP TORONTO CITY AIRPORT 3
Toronto Islands Existing Runway
Lake Ontario

BACKGROUND AND STUDY SCOPE

5 BACKGROUND v The mandate from PortsToronto was to undertake feasibility studies regarding
the lengthening of Runway 08‑26 and other service upgrades at the Billy Bishop Toronto City Airport to support use by newer aircraft (jet service).
v The west runway and taxiway extension will be exposed to wind, wave, water level, and ice conditions from Lake Ontario.
v It will require rock armour protection to stabilize the fill area, as well as controlling wave overtopping and spray from impacting the runway operations.
v The existing runway elevation is only 2.4 m above the chart datum water level of the lake; and the elevation of protection structures is limited by requirements of various airport equipment.

6 THE WEST EXTENSION v The overall objective of the Coastal Engineering investigations for the
proposed runway extension involved the preliminary design of protection works that would enclose the land reclamation area for both the west and east extensions of Runway 08-26. The land mass of the west runway expansion extends 200 m from the face of the existing west wall and it has a width of 166 m.
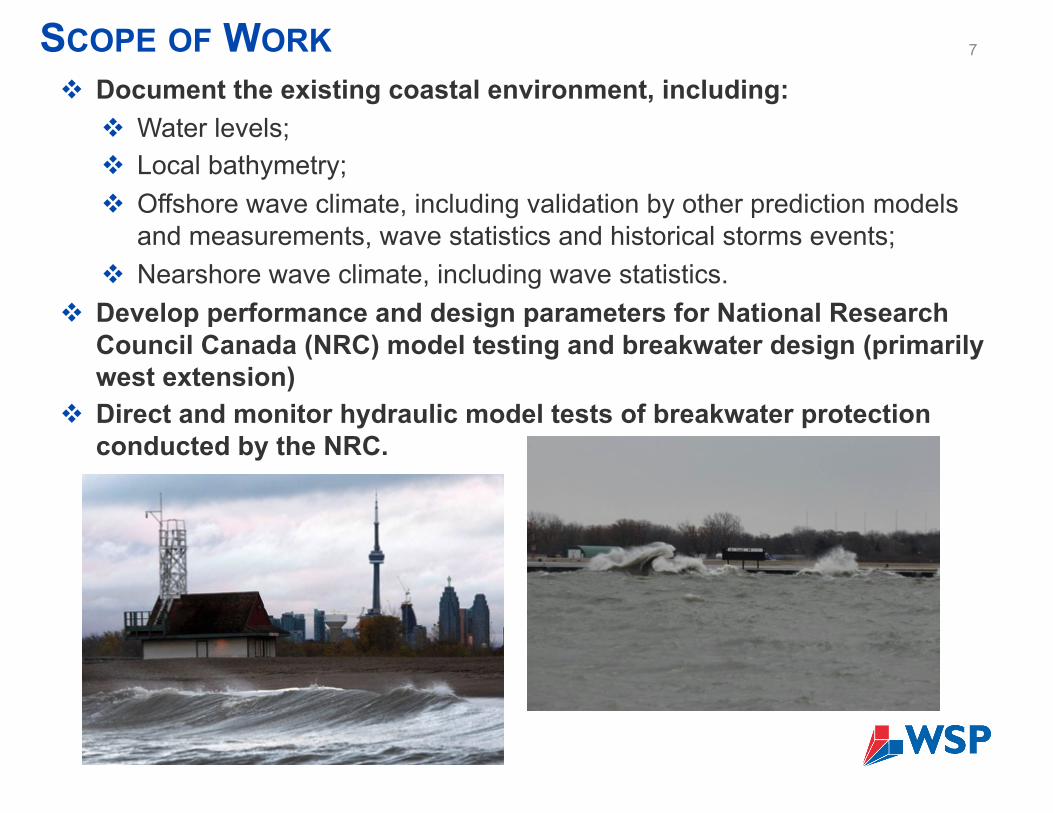
7 SCOPE OF WORK v Document the existing coastal environment, including:
v Water levels; v Local bathymetry; v Offshore wave climate, including validation by other prediction models
and measurements, wave statistics and historical storms events; v Nearshore wave climate, including wave statistics.
v Develop performance and design parameters for National Research Council Canada (NRC) model testing and breakwater design (primarily west extension)
v Direct and monitor hydraulic model tests of breakwater protection conducted by the NRC.

COASTAL ENVIRONMENT STUDY

9 COASTAL ENVIRONMENT STUDY v The analyses and development of long term data for winds, waves water
levels and ice dynamic are undertaken primarily to provide design conditions for the rubble mound breakwater protection of the west extension. The objective is to estimate the magnitude and frequency of the conditions as well as extreme values and to provide NRC with all relevant information to perform physical modeling.

10 WATER LEVEL VARIATION v Seasonality of Water Levels (CD)
v Extreme Water Levels (IGLD 85 / CD)
Months 50 10 5 1 0.1 0.01
January 0.39 0.75 0.83 0.92 0.98 1.11
February 0.45 0.83 0.90 1.01 1.06 1.09
March 0.53 0.87 0.95 1.11 1.28 1.31
April 0.70 1.09 1.17 1.48 1.51 1.55
May 0.89 1.17 1.36 1.53 1.58 1.59
June 0.92 1.15 1.33 1.50 1.56 1.58
July 0.84 1.11 1.19 1.36 1.45 1.48
August 0.73 0.94 1.06 1.14 1.19 1.21
September 0.58 0.76 0.83 0.92 0.98 1.03
October 0.44 0.61 0.67 0.95 1.00 1.05
November 0.34 0.56 0.62 0.81 0.92 0.97
December 0.36 0.58 0.65 0.83 0.87 0.90
Water Levels (CD) - % of Exceedance
RETURN PERIODS WATER LEVELS (IGLD 85 / CD)
GEV
WATER LEVELS (IGLD 85 / CD)
LOG-PEARSON III
WATER LEVELS (IGLD 85 / CD)
WEIBULL
2 75.26 / 1.06 75.26 / 1.06 75.23 / 1.03
5 75.45 / 1.25 75.44 / 1.24 75.42 / 1.22
10 75.55 / 1.35 75.55 / 1.35 75.55 / 1.35
25 75.67 / 1.47 75.66 / 1.46 75.71 / 1.51
50 75.74 / 1.54 75.74 / 1.54 75.82 / 1.62
100 75.80 / 1.60 75.81 / 1.61 75.94 / 1.74
Chart Datum Elevation is
74.2 m IGLD 85

11 OFFSHORE WAVE CLIMATE v The WSP 1D wave hindcast model (Dupuis et al., 1996) is based on a parametric
approach described by Bretschneider (1964) with modified dimensional relations taken from the Shore Protection Manual (CERC, 1984). The model provides hourly significant wave heights (Hm0) and peak wave period (Tp) by compass direction.
v Prior to developing the wave climate offshore of the Billy Bishop Airport, validation of the model was undertaken using measured wind and wave data extracted at the American buoy NDBC 45012 for which high quality data was found for a time-series of 13 years.

12 OFFSHORE WAVE CLIMATE – MODEL VALIDATION v WSP Wave Hindcast Model (black line) against the NDBC Buoy 45012 (red line)
v Highly satisfactory results were found and demonstrate the model’s ability to hindcast a representative wave field on the lake for a long period of time.

13 OFFSHORE WAVE CLIMATE – BILLY BISHOP AIRPORT

14 NEARSHORE WAVE CLIMATE – BILLY BISHOP AIRPORT
v As the deep water waves propagate to the shore, various physical
phenomena transform the waves as they interact with the lake bed.
v The numerical wave model SWAN (Delft‑3D-WAVE) was used to transform the offshore wave climate to the tip of the proposed west extension runway. SWAN is a phase-averaged third-generation wave model developed by Deltares, that computes wind-generated waves in coastal regions and inland waters. This model simulates, in order, the following physical processes:
v Refraction and shoaling due to depth variations; v Dissipation due to wave breaking; v Dissipation due to bottom friction; v Dissipation due to white-capping; v Wave reflection on coastal structures.
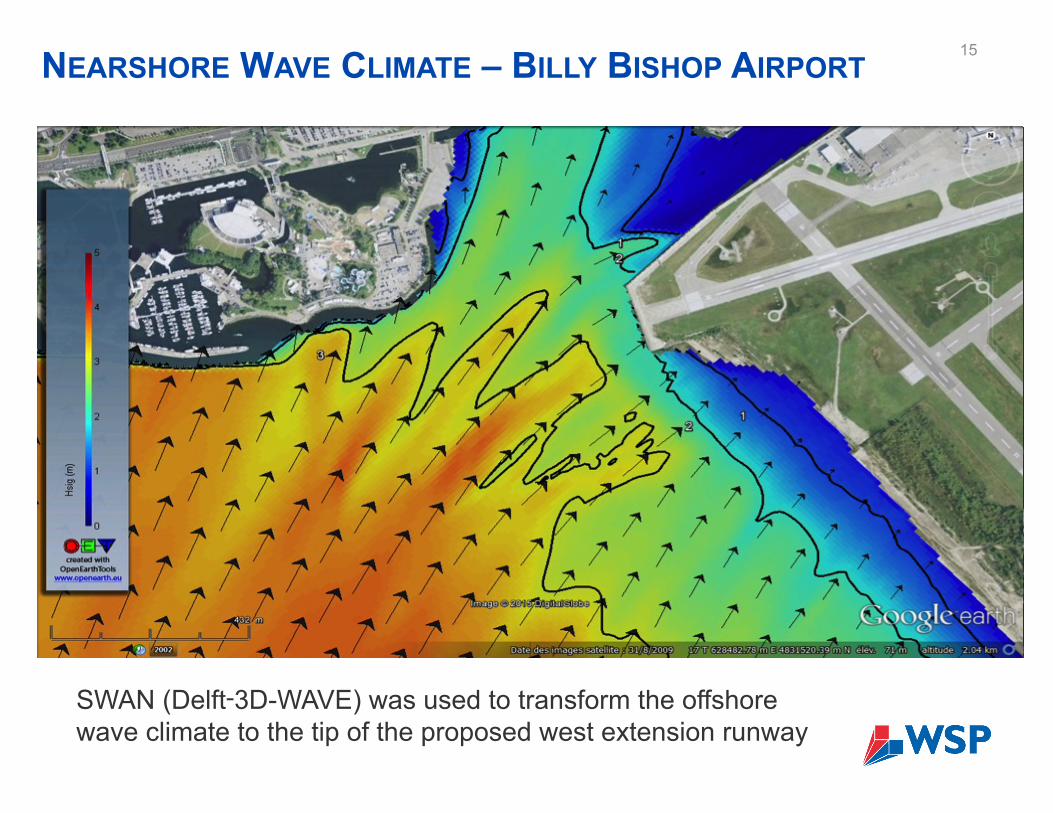
15 NEARSHORE WAVE CLIMATE – BILLY BISHOP AIRPORT
SWAN (Delft‑3D-WAVE) was used to transform the offshore wave climate to the tip of the proposed west extension runway

16 NEARSHORE WAVE CLIMATE – BILLY BISHOP AIRPORT
Extreme Value Analysis (EVA)
Nearshore Wave Rose

17 ICE CONDITIONS
v Historical records indicate that the western runway extension into Lake Ontario is ice-free most of the time, although on occasion, new ice and pack ice are present.
v This ice cover is dynamic, and its concentration and stage of development varies with time, reaching a thickness up to 0.3 m.
v Ice pileup and ice ridge-building is considered a rare event, with a return period exceeding 100 years (in agreement with anecdotal information).
Large-scale ice conditions shown (Jan. 16, 1994) are most severe in 30 years of records.
v Minimum armour stone size recommended on lake side is D50 of 0.4m to avoid ice damage.

BREAKWATER DESIGN
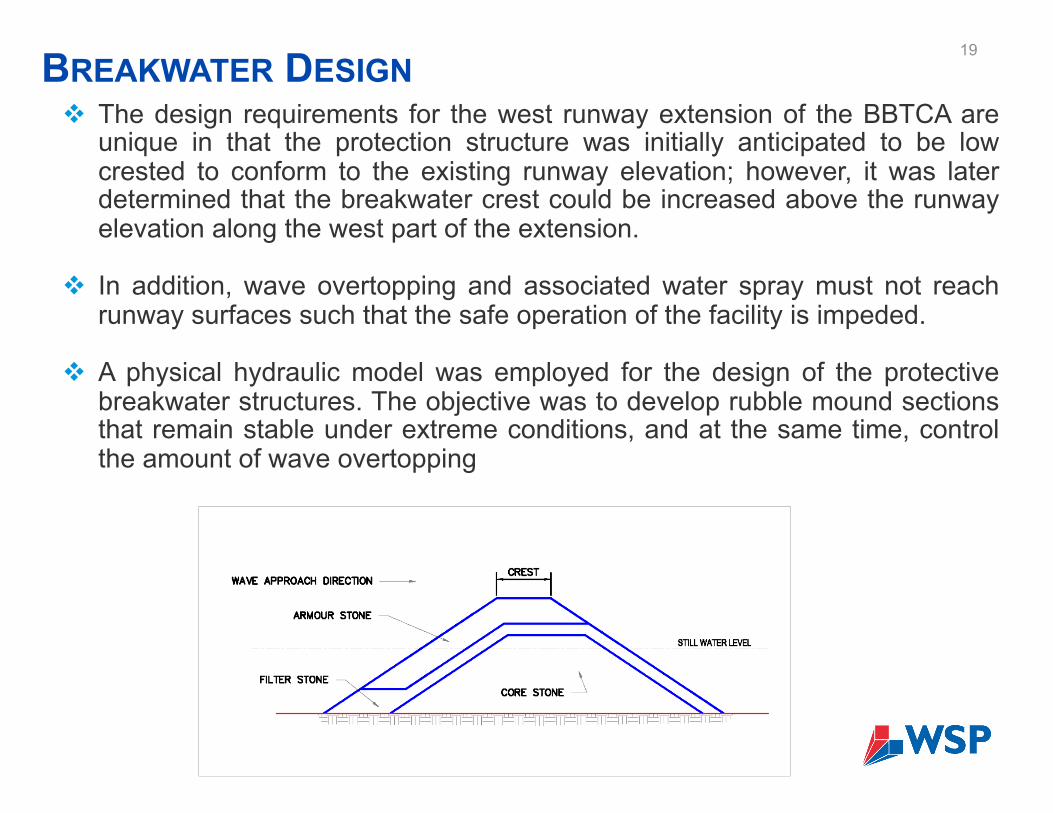
19 BREAKWATER DESIGN v The design requirements for the west runway extension of the BBTCA are
unique in that the protection structure was initially anticipated to be low crested to conform to the existing runway elevation; however, it was later determined that the breakwater crest could be increased above the runway elevation along the west part of the extension.
v In addition, wave overtopping and associated water spray must not reach runway surfaces such that the safe operation of the facility is impeded.
v A physical hydraulic model was employed for the design of the protective breakwater structures. The objective was to develop rubble mound sections that remain stable under extreme conditions, and at the same time, control the amount of wave overtopping

20 BREAKWATER DESIGN v The conditions for the preliminary design of the breakwater protection
for the west runway extension were governed by criteria for:
à use of all available rock material sizes;
à wave, water level and wind conditions;
à no significant damage (i.e., little initial damage & no continued stone displacement after wave ‘shakedown’ tests per section);
à minimal overtopping under 100-year return period wave conditions at seasonal high water levels;
à Specific clearance requirements at the airport including:
− OLS (obstacle limitation surface)
− Localizer (navigational) antenna array
− Jet blast fence

NRC PHYSICAL HYDRAULIC MODEL

22 NRC TESTING – MODEL DEVELOPMENT
v Due to the size and complexity of the project, the breakwater sections were
developed by WSP and tested for stability and wave overtopping at the National Research Council Canada hydraulics laboratory facility in Ottawa.
v The Ocean, Coastal and River Engineering (OCRE) portfolio of NRC was responsible for constructing and operating the physical model. The hydraulic model was constructed in the Multi-Directional Wave Basin in building M-32 at the Ottawa facility. The model was physically scaled at 1 (model unit) to 28 (prototype) in the 29 x 36 m wave basin. The model encompassed the end of the existing west runway; the 200 m land mass extension; and the hydrographic or lake bottom contours approaching the runway.

23
v Water level and wave conditions were precisely controlled in the model (e.g.,
storms at high water). Rock armour stability and wave overtopping were measured and assessed for various arrangements of breakwater materials and geometries.
v In addition, wind generators were employed in some of the test sequences to assess the effect on the water spray from the impact of the waves on the rocks slopes.
NRC TESTING – MODEL DEVELOPMENT
24
v The combinations of water level and wave conditions were the most critical inputs to the design conditions for the breakwater arrangements (i.e., higher wave conditions did not statistically occur during the periods of high water levels).
v Ice conditions were not the dominant design factor for the west runway extension; however, they are considered a dominant factor for a rubble mound structure inside Toronto Harbour.
v The NRC 3D physical model proved invaluable in assessing the various requirements for the breakwater design regarding: Ø The stability performance of different areas of the protection works
(i.e., differing depths, wave exposures, heads vs. trunk sections) Ø The areas of potential overtopping in relation to the runway surfaces Ø Effectiveness of breakwater sections: crest height vs width
CONCLUSIONS

25
NOVEMBER 12th 2015
à Canada's new transport minister announces that the Liberal government has no intention of letting passenger jets fly out of the Toronto Islands and will not re-open an agreement that could lead to the expansion of the island airport (CBC News, 11-12-2015)
CONCLUSIONS

26
Acknowledgement The authors would respectfully like to thank PortsToronto for approval of the production of this presentation.