BILLABONG INTERNATIONAL LIMITED
32
BILLABONG INTERNATIONAL LIMITED 30 August 2010 Investor presentation highlights
Transcript of BILLABONG INTERNATIONAL LIMITED
BILLABONG INTERNATIONAL LIMITED30 August 2010
Investor presentation highlights
2010$m
2009$m
2010Change %
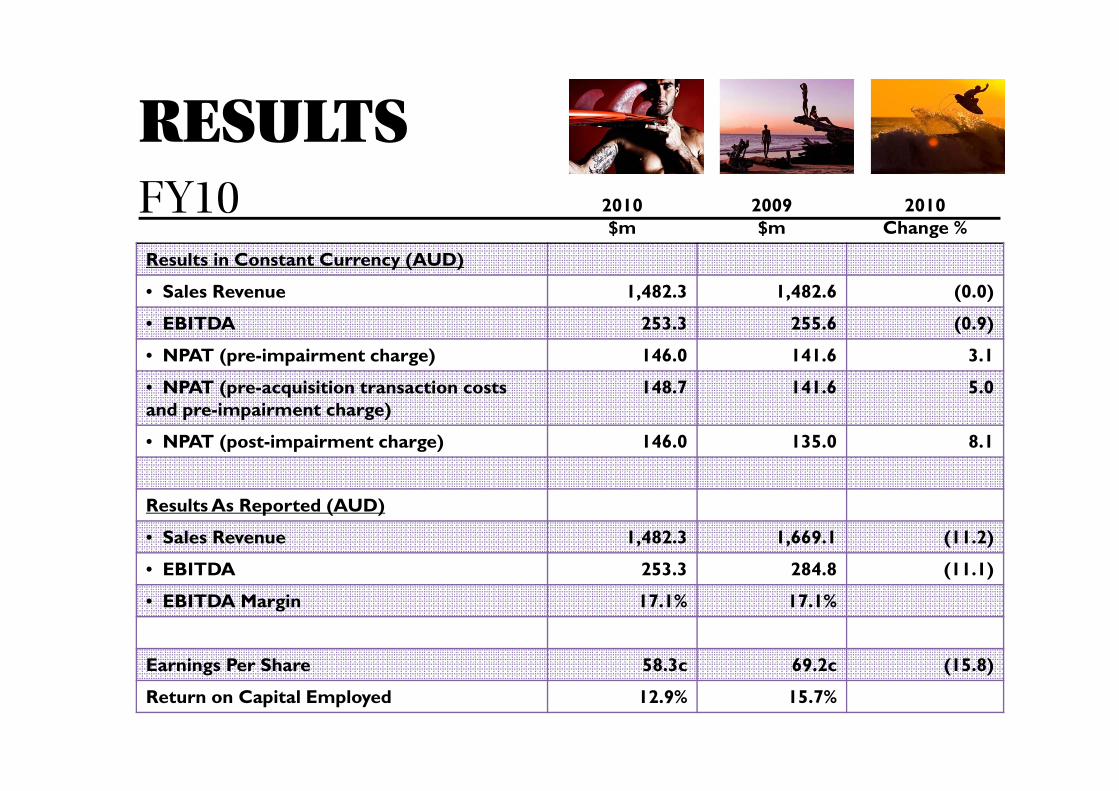
Results in Constant Currency (AUD)
• Sales Revenue 1,482.3 1,482.6 (0.0)
• EBITDA 253.3 255.6 (0.9)
• NPAT (pre-impairment charge) 146.0 141.6 3.1
• NPAT (pre-acquisition transaction costs and pre-impairment charge)
148.7 141.6 5.0
• NPAT (post-impairment charge) 146.0 135.0 8.1
Results As Reported (AUD)
• Sales Revenue 1,482.3 1,669.1 (11.2)
• EBITDA 253.3 284.8 (11.1)
• EBITDA Margin 17.1% 17.1%
Earnings Per Share 58.3c 69.2c (15.8)
Return on Capital Employed 12.9% 15.7%
RESULTSFY10
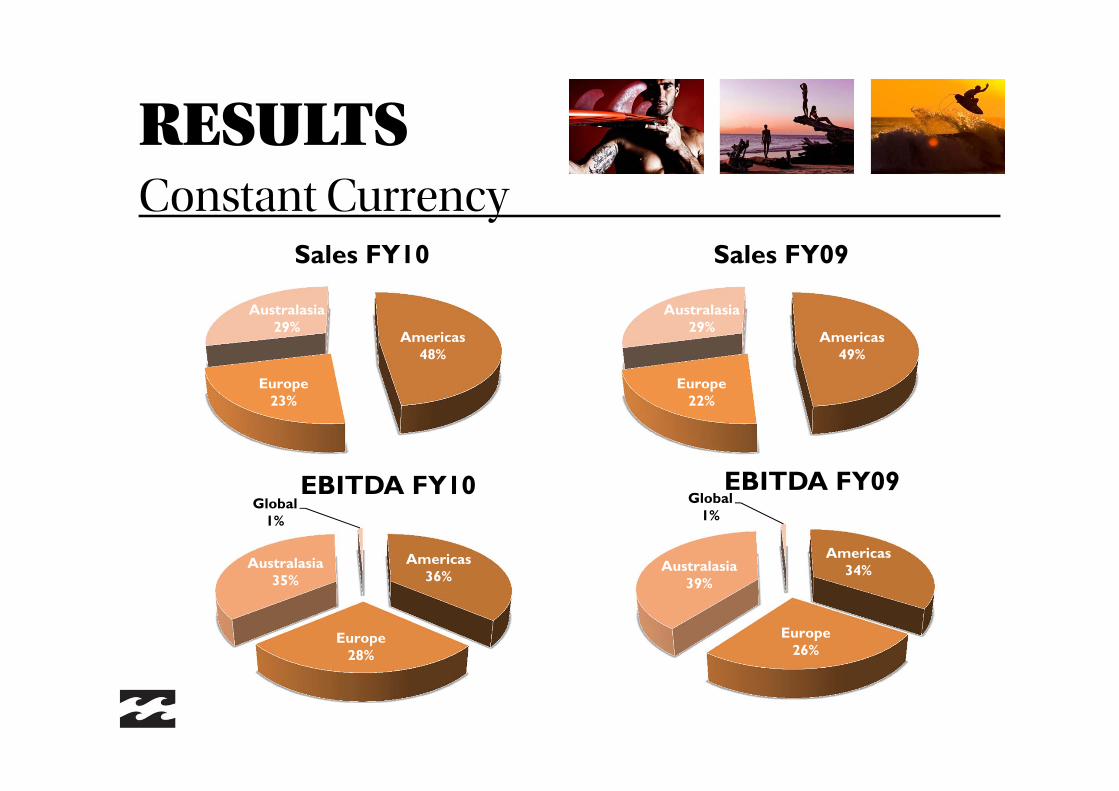
RESULTSConstant Currency
Americas48%
Europe23%
Australasia29%
Sales FY10
Americas49%
Europe22%
Australasia29%
Sales FY09
Americas36%
Europe28%
Australasia35%
Global1%
EBITDA FY10
Americas34%
Europe26%
Australasia39%
Global1%
EBITDA FY09
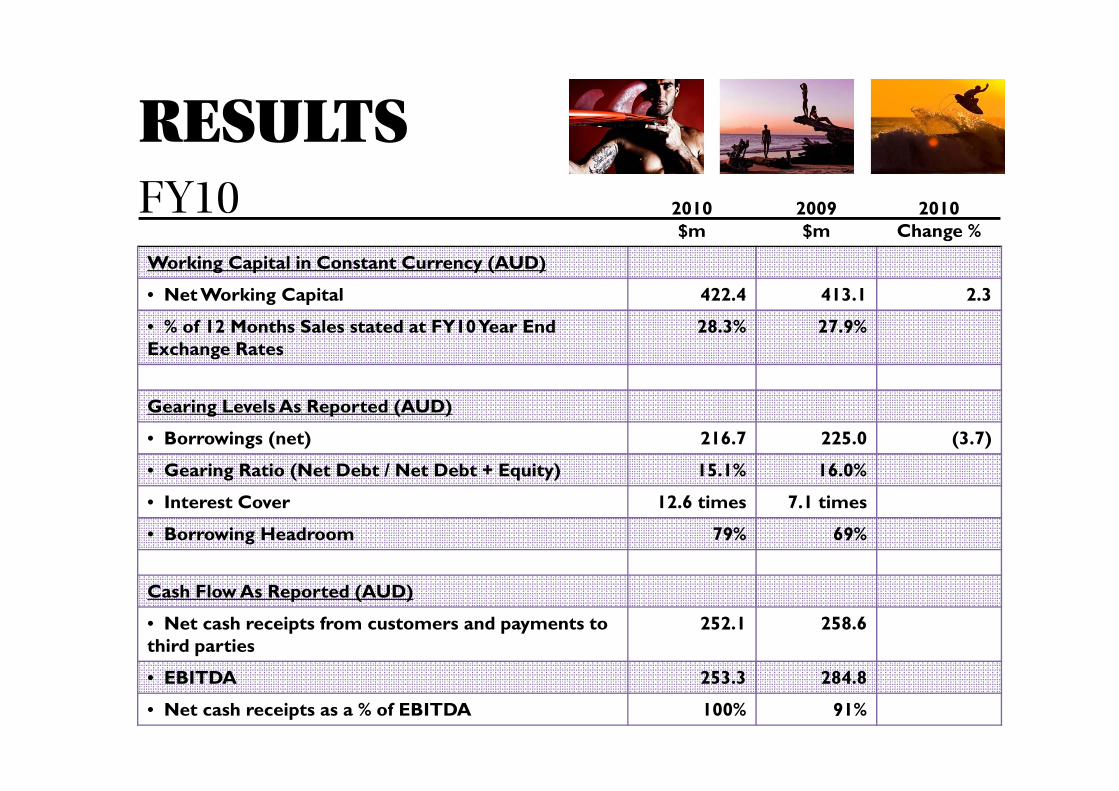
2010$m
2009$m
2010Change %
Working Capital in Constant Currency (AUD)
• Net Working Capital 422.4 413.1 2.3
• % of 12 Months Sales stated at FY10 Year End Exchange Rates
28.3% 27.9%
Gearing Levels As Reported (AUD)
• Borrowings (net) 216.7 225.0 (3.7)
• Gearing Ratio (Net Debt / Net Debt + Equity) 15.1% 16.0%
• Interest Cover 12.6 times 7.1 times
• Borrowing Headroom 79% 69%
Cash Flow As Reported (AUD)
• Net cash receipts from customers and payments to third parties
252.1 258.6
• EBITDA 253.3 284.8
• Net cash receipts as a % of EBITDA 100% 91%
RESULTSFY10
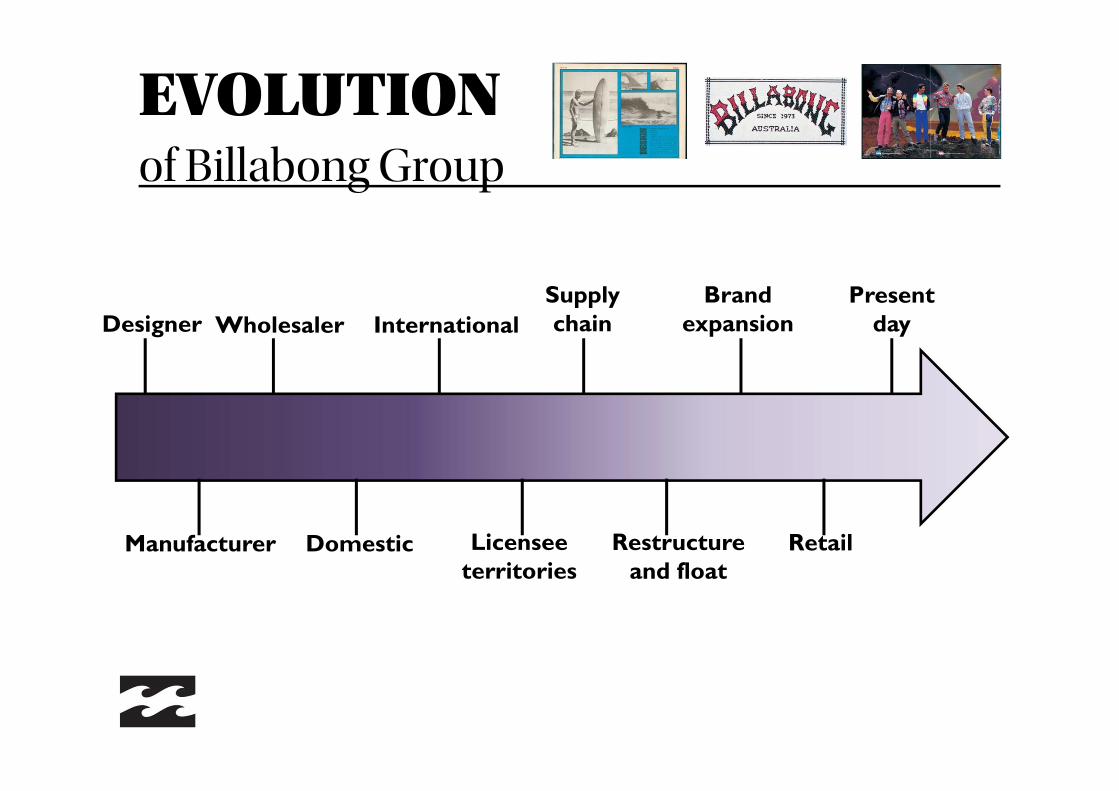
EVOLUTIONof Billabong Group
Designer
Manufacturer
Wholesaler International
Domestic
Supply chain
Brand expansion
Licensee territories
Restructure and float
Present day
Retail

BUSINESS MODEL
Production and supply chain
Branding, marketing and merchandising
Third party wholesale*
Company owned retail*
Str
ateg
ic o
bjec
tive
s
Quality and stability
Unique design and product innovations
Control brand integrity
Consumer insights
Strong focused brands
Strengthen the distribution
channel
*% varies by market
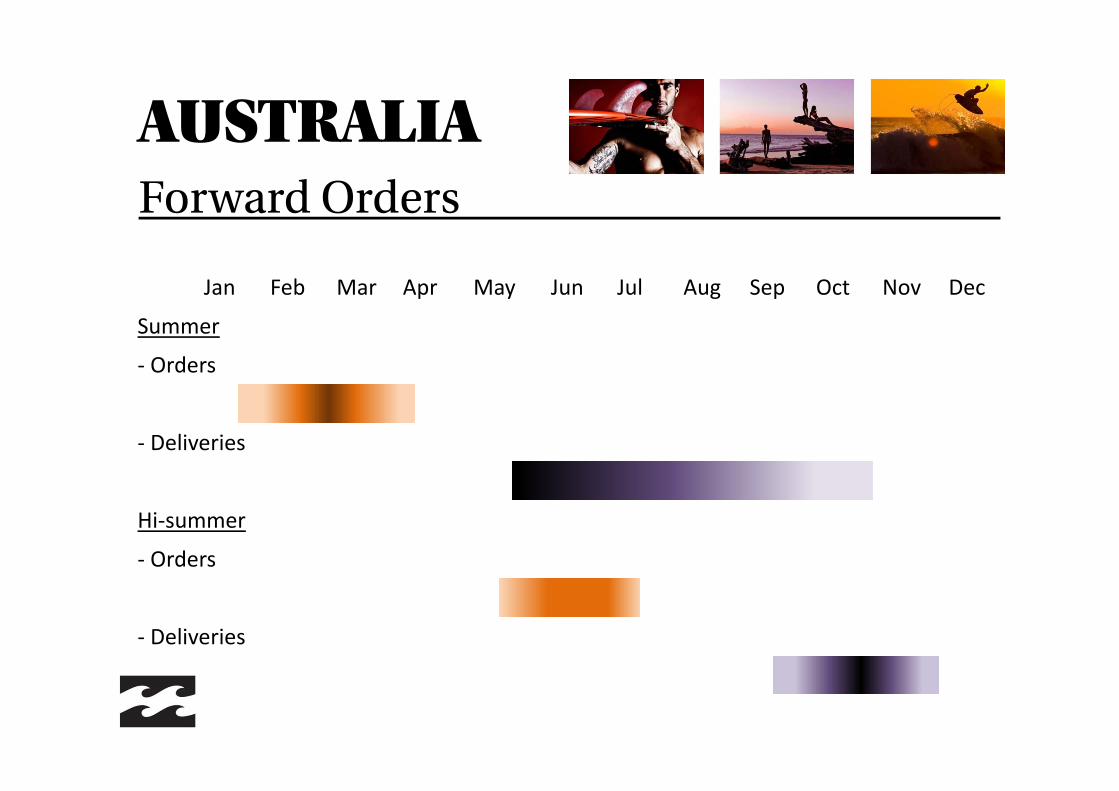
Jan Feb Mar Apr May Jun Jul Aug Sep Oct Nov Dec
Summer
‐ Orders
‐ Deliveries
Hi‐summer
‐ Orders
‐ Deliveries
AUSTRALIAForward Orders
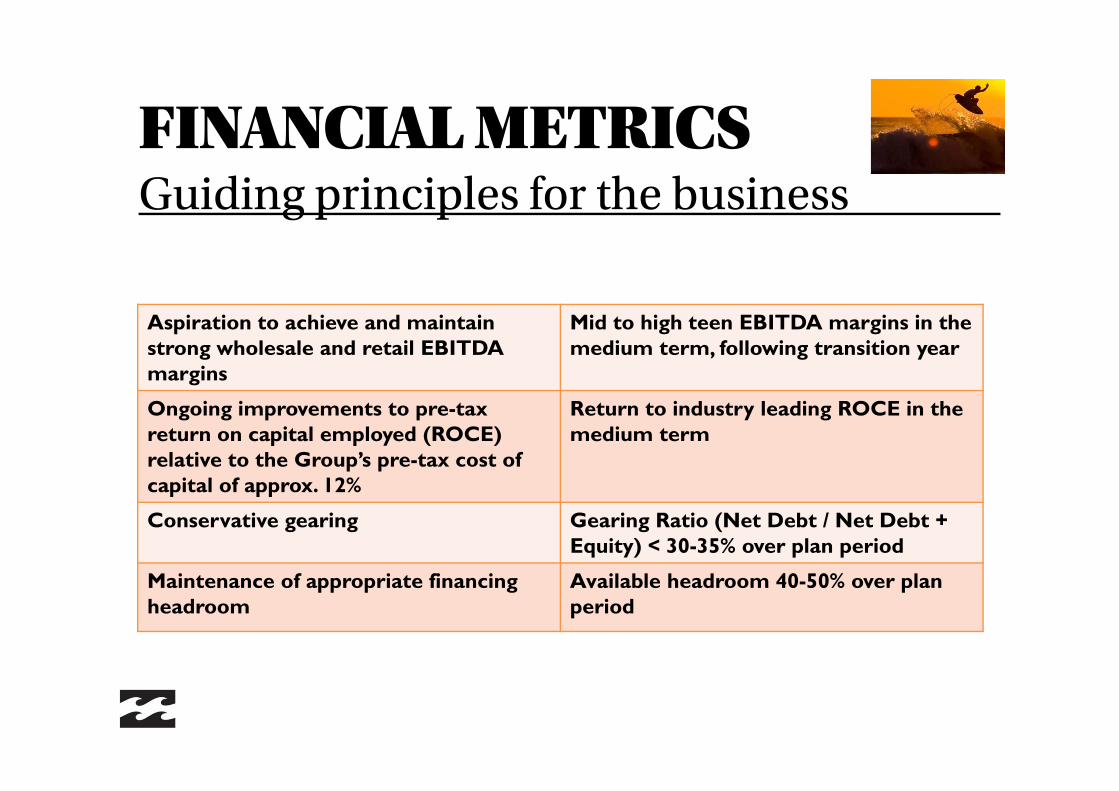
FINANCIAL METRICSGuiding principles for the business
Aspiration to achieve and maintain strong wholesale and retail EBITDA margins
Mid to high teen EBITDA margins in the medium term, following transition year
Ongoing improvements to pre-tax return on capital employed (ROCE) relative to the Group’s pre-tax cost of capital of approx. 12%
Return to industry leading ROCE in the medium term
Conservative gearing Gearing Ratio (Net Debt / Net Debt + Equity) < 30-35% over plan period
Maintenance of appropriate financing headroom
Available headroom 40-50% over plan period

BRANDSGrowth drivers
Existing Market Penetration
Brand Design & Marketing Innovation
New/ Emerging Market Development
New Category Growth
Brand market share varies significantly by Region
Significant potential to increase penetration of existing brands into the established channels
Emerging markets (Asia, S. America and E. Europe) are seeing strong growth in their middle class who will increasingly have the disposable income and leisure time to consider action sports
Most brands in the portfolio have potential to extend into new categories
Broader action sport and lifestyle segments hold further potential for Billabong
Fundamental to Billabong’s future growth is continued design and marketing innovation

BILLABONGWholesale Sales
0%10%20%30%40%50%60%70%80%90%
100%
Americas Europe Australasia Consol
Including Sales to Related Retail Excluding Pac Sun (Constant Currency)
FY08 FY09 FY10
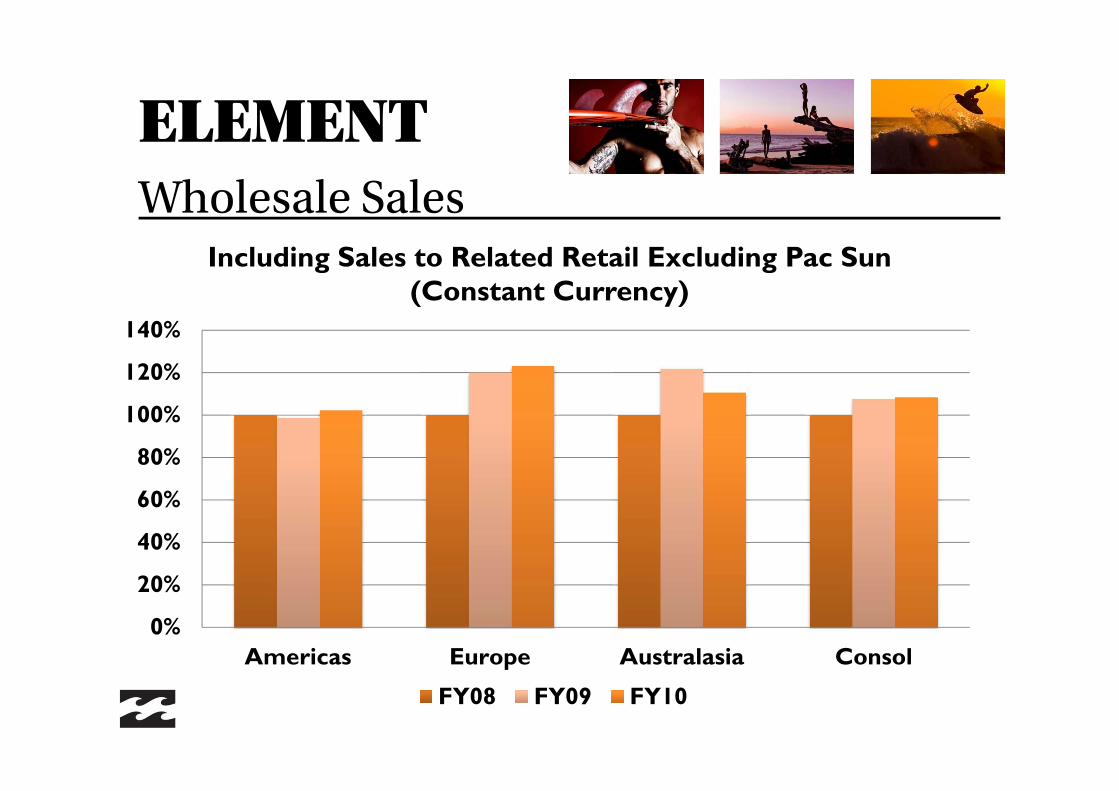
ELEMENTWholesale Sales
0%
20%
40%
60%
80%
100%
120%
140%
Americas Europe Australasia Consol
Including Sales to Related Retail Excluding Pac Sun (Constant Currency)
FY08 FY09 FY10

NIXONWholesale Sales
0%
20%
40%
60%
80%
100%
120%
140%
160%
Americas Europe Australasia Consol
Including Sales to Related Retail (Constant Currency)
FY08 FY09 FY10
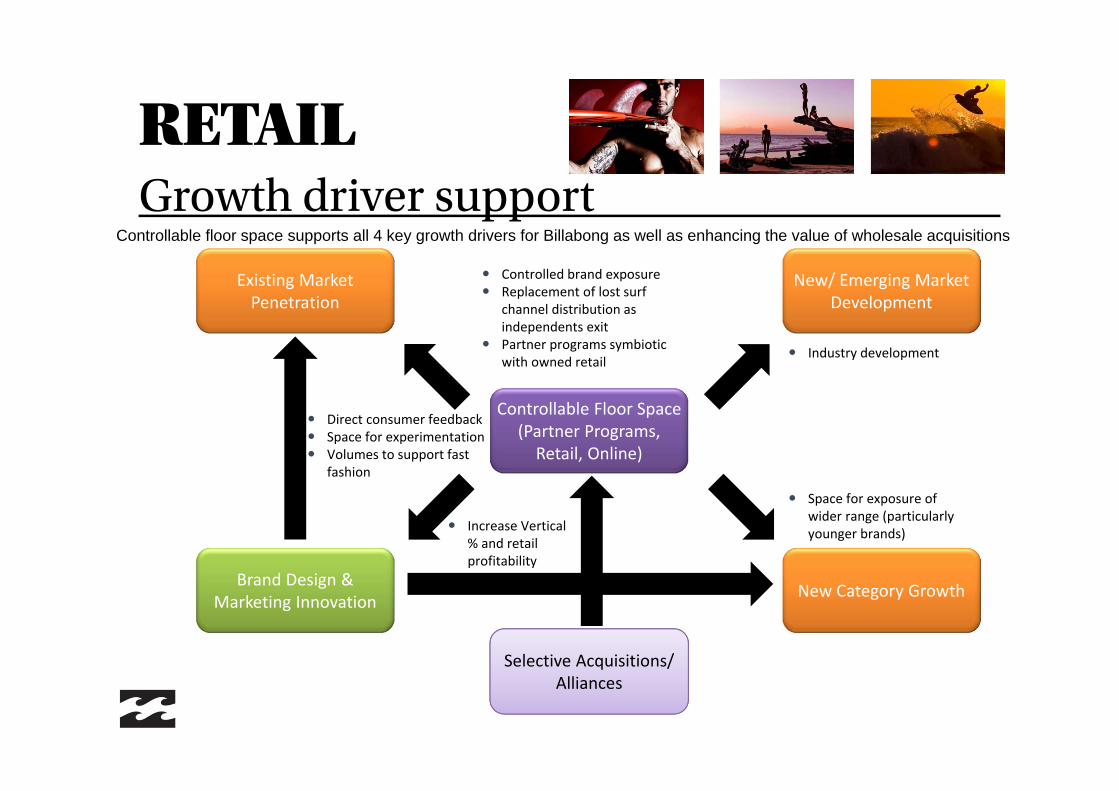
RETAILGrowth driver support
Controllable floor space supports all 4 key growth drivers for Billabong as well as enhancing the value of wholesale acquisitions
Controllable Floor Space (Partner Programs, Retail, Online)
Industry development
Space for exposure of wider range (particularly younger brands)
Direct consumer feedback Space for experimentation Volumes to support fast
fashion
Existing Market Penetration
Brand Design & Marketing Innovation
New/ Emerging Market Development
New Category Growth
Controlled brand exposure Replacement of lost surf
channel distribution as independents exit
Partner programs symbiotic with owned retail
Selective Acquisitions/ Alliances
Increase Vertical % and retail profitability

RETAILSpeed to market
RangeDevelop-
mentSell-in Production & Delivery
Trim, Samples, Fabric Sourcing
30 60 60 120
270
Range Develop
Production & Delivery
Trim, Samples,
Fabric
20 40 50
Range Develop
Production & Delivery
Trim, Samples,
Fabric
20 40
50
90
BBG Leadtime:
Required Time:
Typical Vertical Retailer:
Comparison of BBG vs. Typical Apparel Retailer Leadtimes
Retail provides the scale to short-circuit the current sell-in process to wholesalers for part of the range and deliver newranges in a comparable timeframe to vertical apparel retailers
Retail does not require the sell in process as long as retail planners are linked into wholesale design team
Range release schedule required for wholesale indent model is not relevant for retail
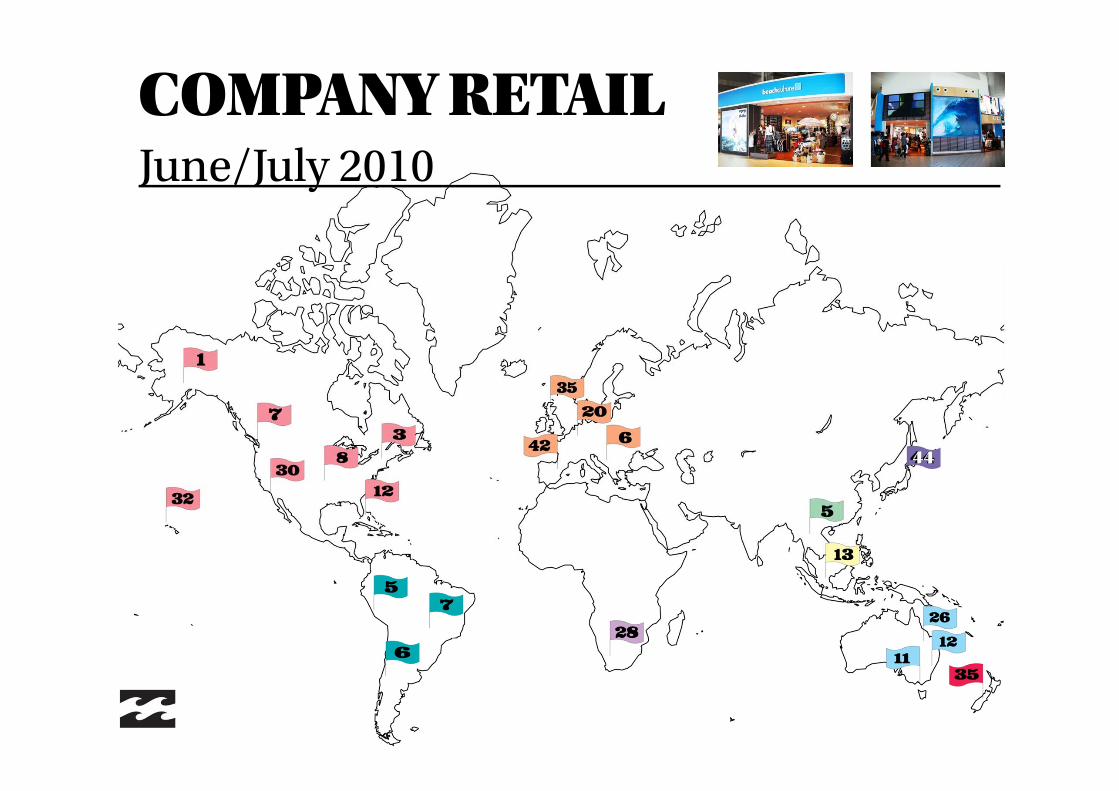
COMPANY RETAILJune/July 2010
44
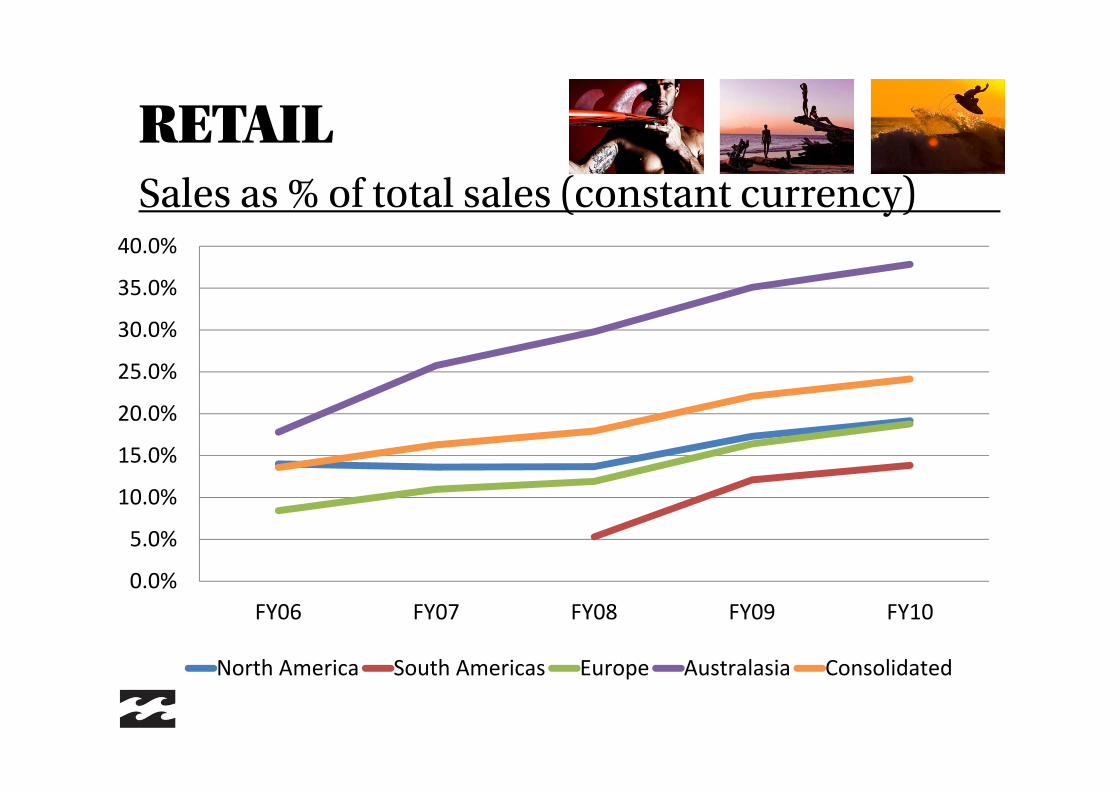
RETAILSales as % of total sales (constant currency)
0.0%
5.0%
10.0%
15.0%
20.0%
25.0%
30.0%
35.0%
40.0%
FY06 FY07 FY08 FY09 FY10
North America South Americas Europe Australasia Consolidated
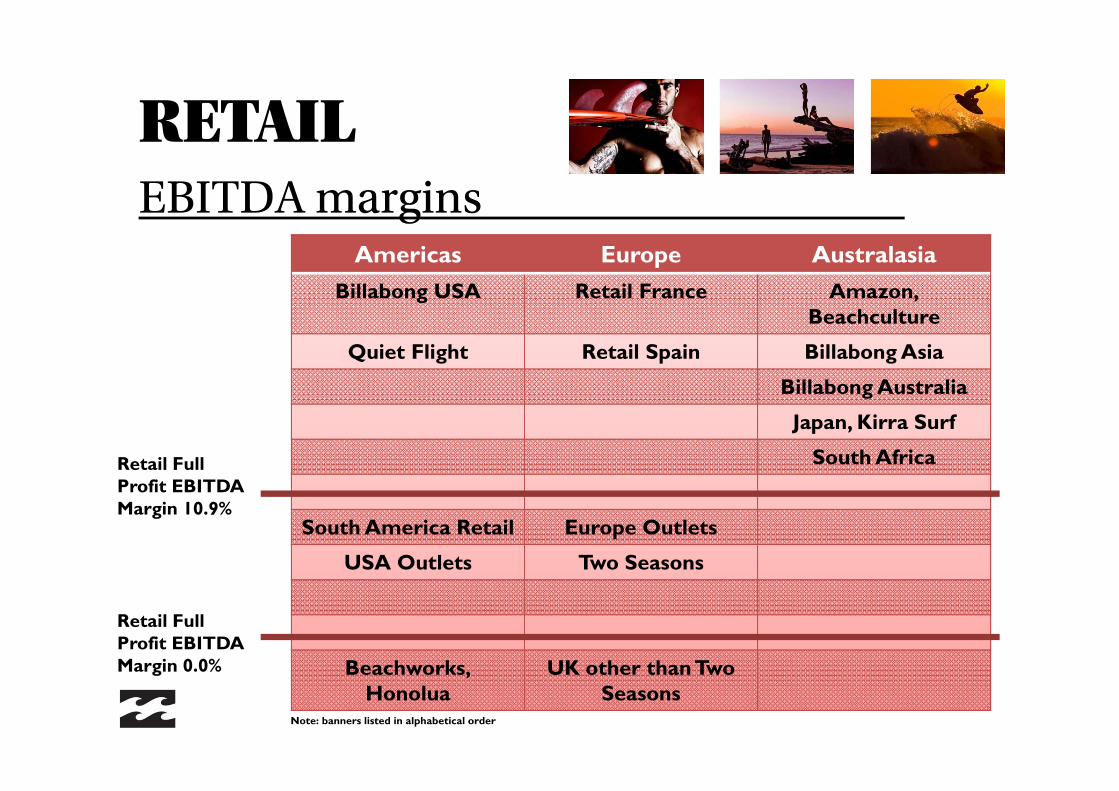
Americas Europe Australasia
Billabong USA Retail France Amazon,Beachculture
Quiet Flight Retail Spain Billabong Asia
Billabong Australia
Japan, Kirra Surf
South Africa
South America Retail Europe Outlets
USA Outlets Two Seasons
Beachworks,Honolua
UK other than Two Seasons
Retail Full Profit EBITDA Margin 10.9%
Retail Full Profit EBITDA Margin 0.0%
RETAILEBITDA margins
Note: banners listed in alphabetical order

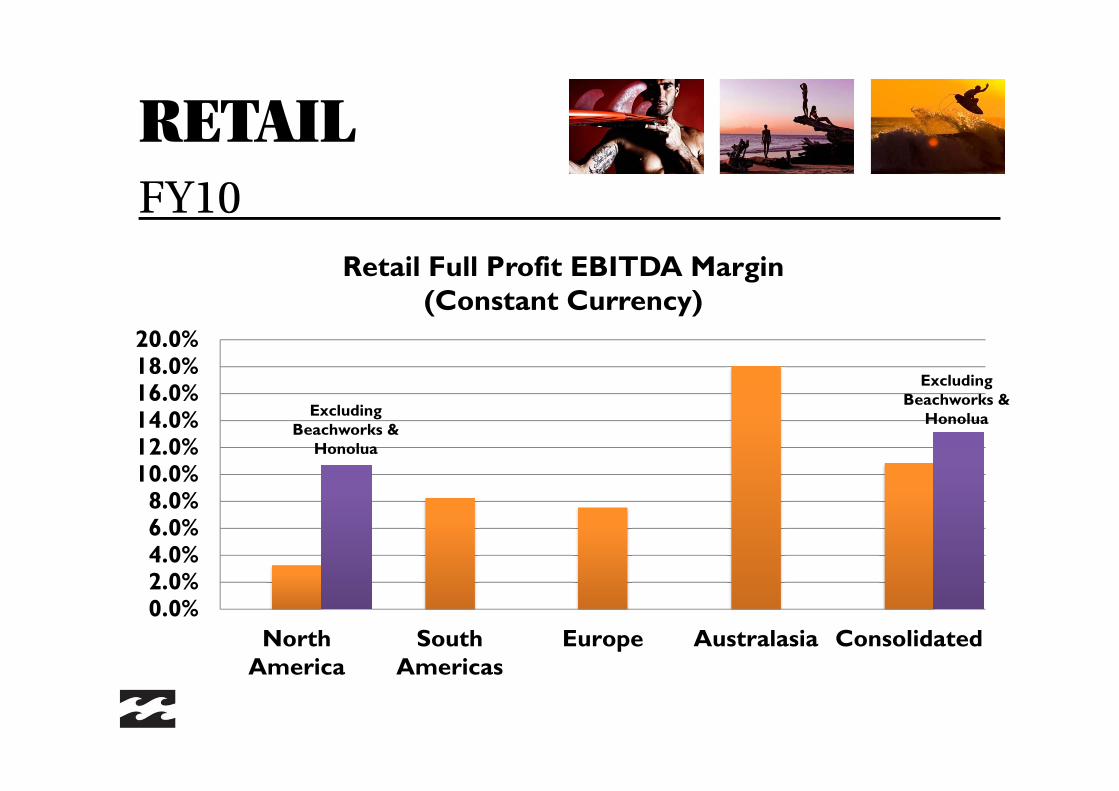
RETAILFY10
0.0%2.0%4.0%6.0%8.0%
10.0%12.0%14.0%16.0%18.0%20.0%
NorthAmerica
SouthAmericas
Europe Australasia Consolidated
Retail Full Profit EBITDA Margin (Constant Currency)
RETAILFY10
0.0%2.0%4.0%6.0%8.0%
10.0%12.0%14.0%16.0%18.0%20.0%
NorthAmerica
SouthAmericas
Europe Australasia Consolidated
Retail Full Profit EBITDA Margin (Constant Currency)
Excluding Beachworks &
Honolua
Excluding Beachworks &
Honolua

RETAILFY10
0.0%2.0%4.0%6.0%8.0%
10.0%12.0%14.0%16.0%18.0%20.0%
NorthAmerica
SouthAmericas
Europe Australasia Consolidated
Retail Full Profit EBITDA Margin (Constant Currency)
Excluding Beachworks &
Honolua
Excluding Beachworks &
Honolua
Stores open more than 2yrs,
excluding Beachworks &
Honolua
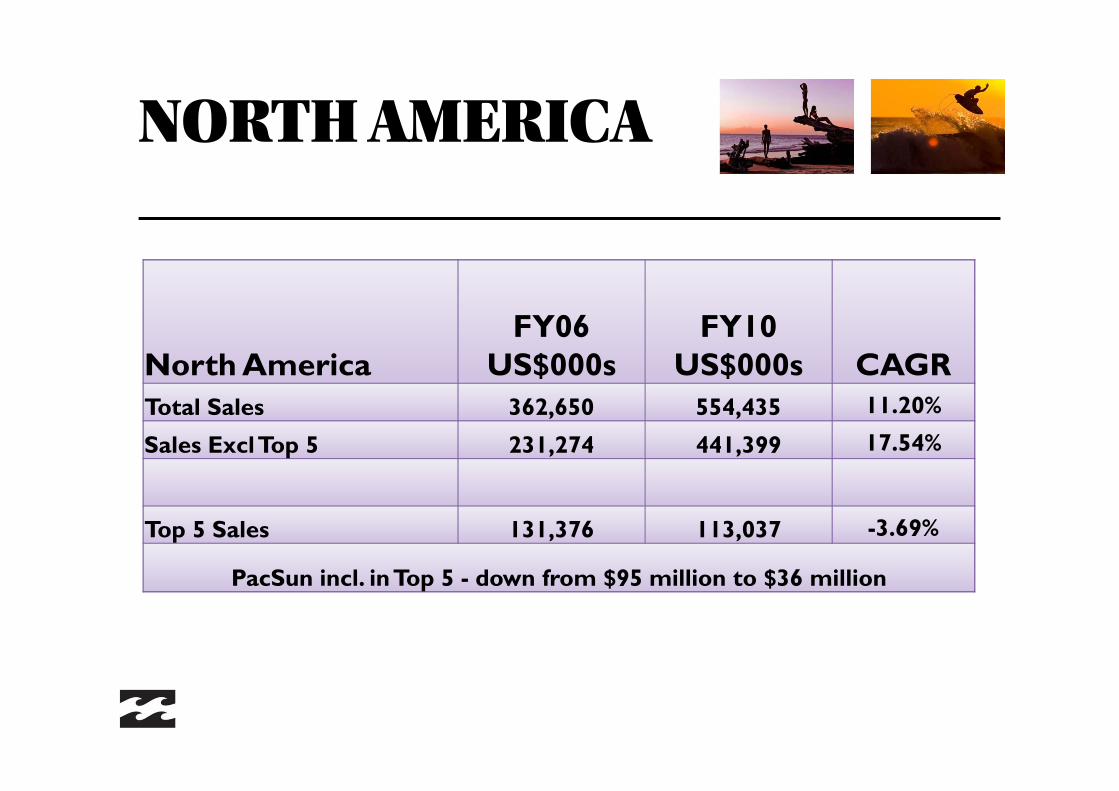
NORTH AMERICA
North AmericaFY06
US$000sFY10
US$000s CAGRTotal Sales 362,650 554,435 11.20%
Sales ExclTop 5 231,274 441,399 17.54%
Top 5 Sales 131,376 113,037 -3.69%
PacSun incl. in Top 5 - down from $95 million to $36 million
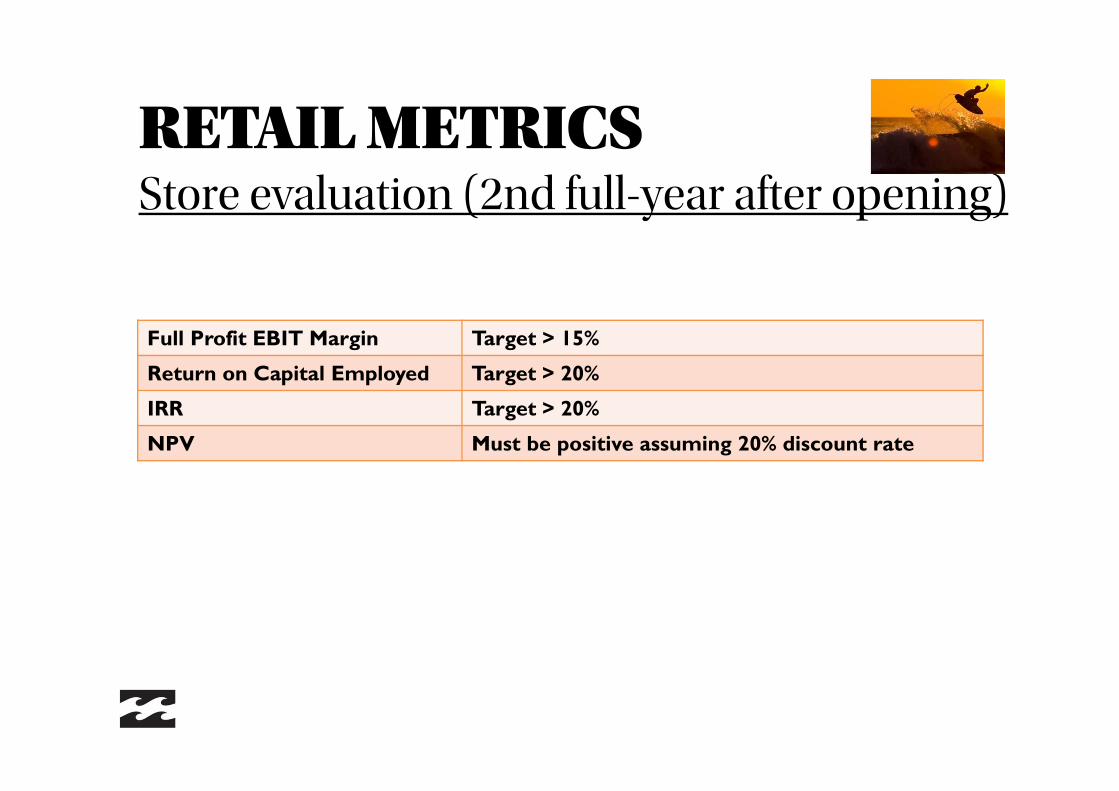
RETAIL METRICSStore evaluation (2nd full-year after opening)
Full Profit EBIT Margin Target > 15%
Return on Capital Employed Target > 20%
IRR Target > 20%
NPV Must be positive assuming 20% discount rate

RETAILFull profit actual
-
1,000
2,000
3,000
4,000
5,000
6,000
7,000
35,000 35,500 36,000 36,500 37,000 37,500 38,000 38,500 39,000
FY09 FY10
Quiet Flight (US$000s)
Sales EBITDA
% BBG Family 61.0% 70.0%
ROCE 5.1% 10.9%
EBITDA Margin 8.6% 15.4%
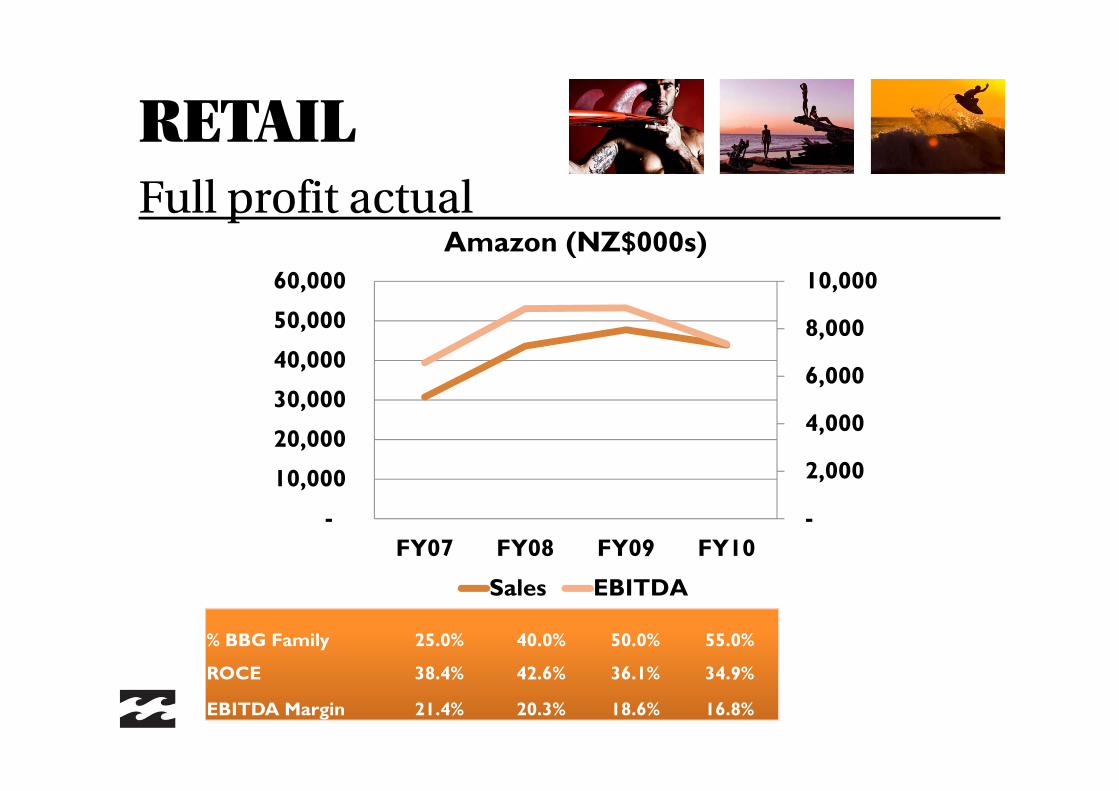
RETAILFull profit actual
-
2,000
4,000
6,000
8,000
10,000
-
10,000
20,000
30,000
40,000
50,000
60,000
FY07 FY08 FY09 FY10
Amazon (NZ$000s)
Sales EBITDA
% BBG Family 25.0% 40.0% 50.0% 55.0%
ROCE 38.4% 42.6% 36.1% 34.9%
EBITDA Margin 21.4% 20.3% 18.6% 16.8%
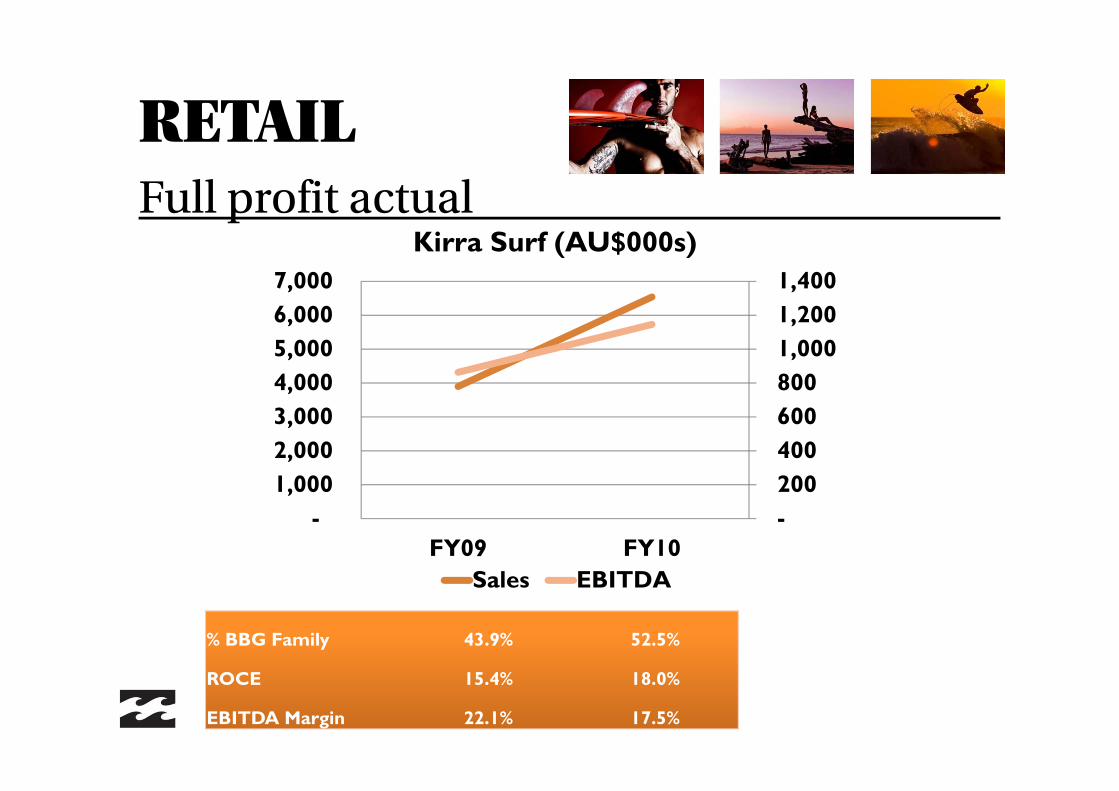
RETAILFull profit actual
- 200 400 600 800 1,000 1,200 1,400
- 1,000 2,000 3,000 4,000 5,000 6,000 7,000
FY09 FY10
Kirra Surf (AU$000s)
Sales EBITDA
% BBG Family 43.9% 52.5%
ROCE 15.4% 18.0%
EBITDA Margin 22.1% 17.5%
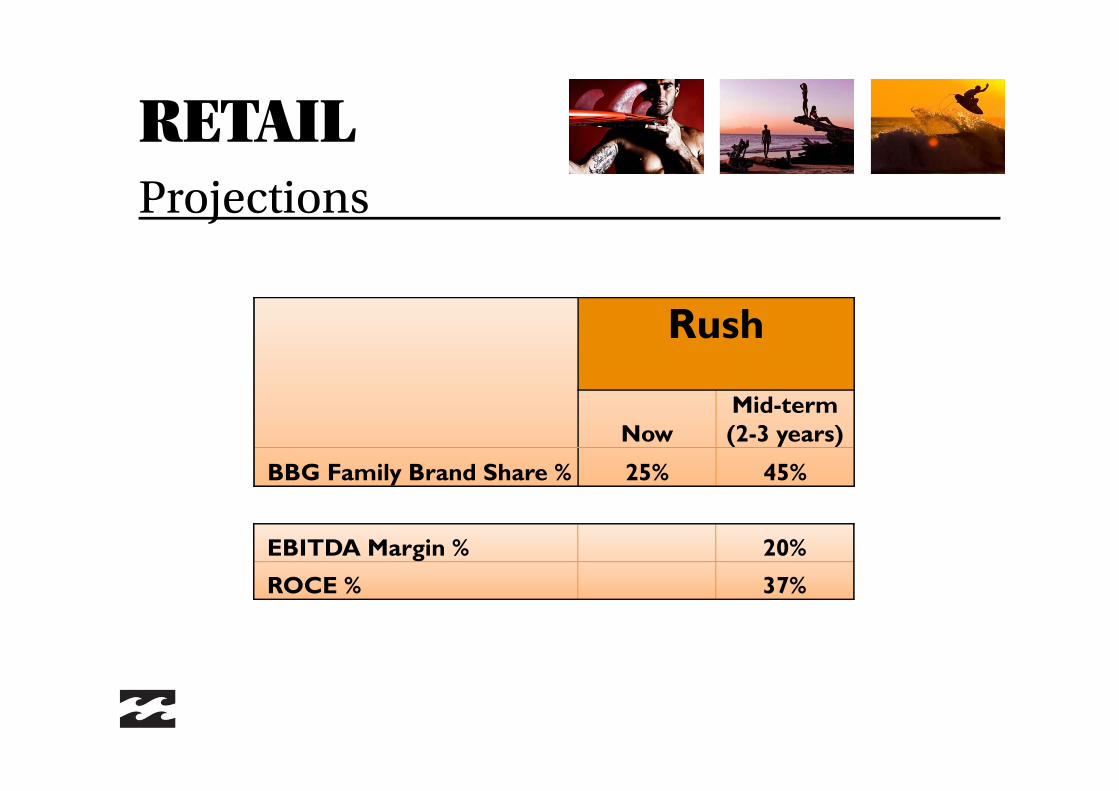
RETAILProjections
Rush
NowMid-term(2-3 years)
BBG Family Brand Share % 25% 45%
EBITDA Margin % 20%
ROCE % 37%
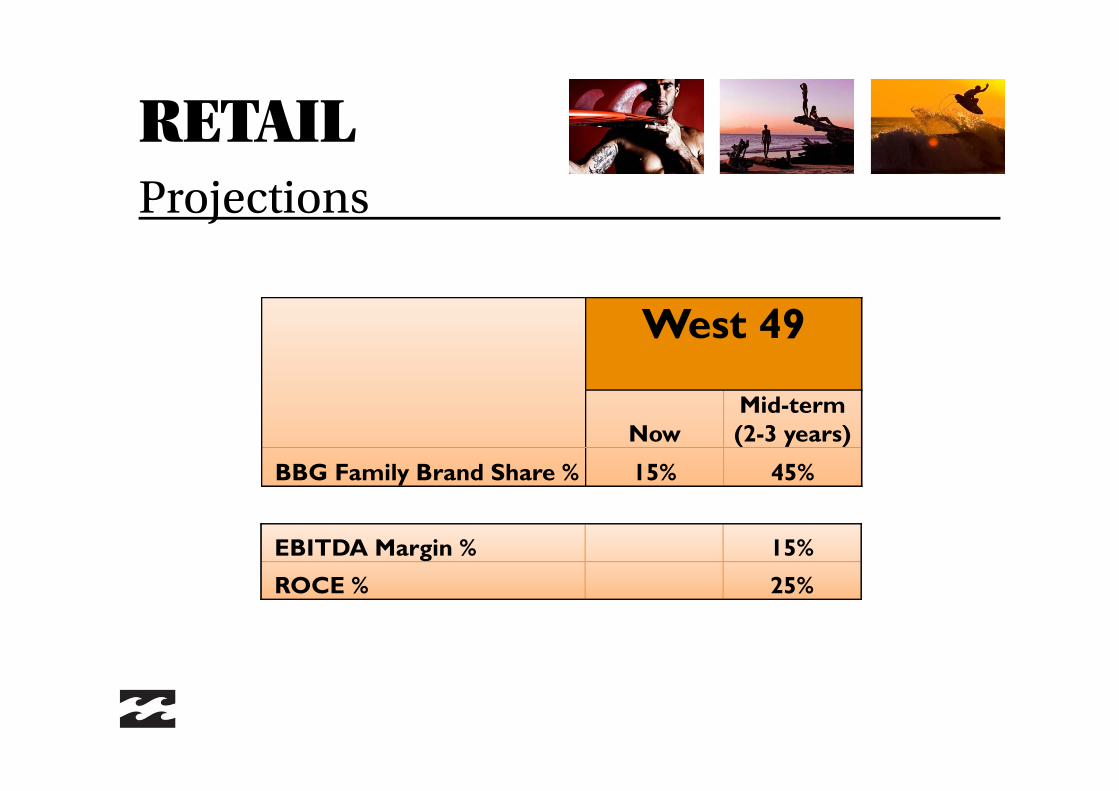
RETAILProjections
West 49
NowMid-term(2-3 years)
BBG Family Brand Share % 15% 45%
EBITDA Margin % 15%
ROCE % 25%
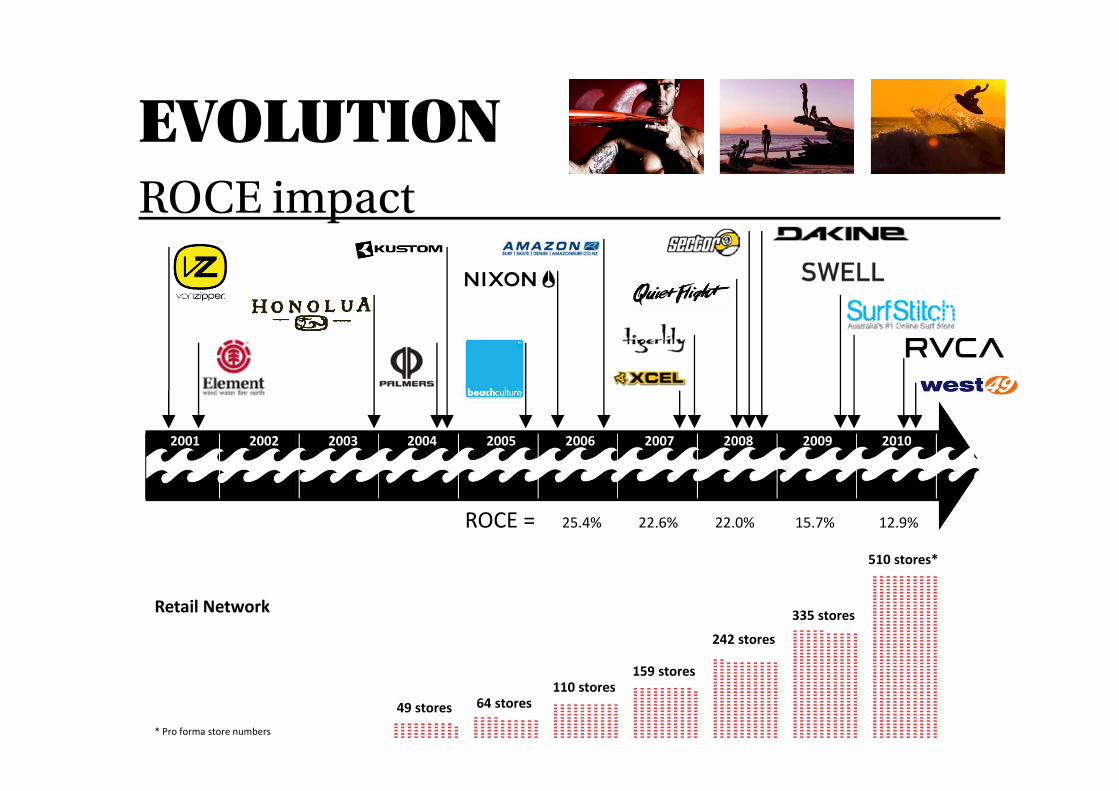
EVOLUTIONROCE impact
Retail Network
49 stores 64 stores110 stores
159 stores
242 stores
335 stores
510 stores*
* Pro forma store numbers
2001 2002 2003 2004 2005 2006 2007 2008 2009 2010
25.4% 22.6% 22.0% 15.7% 12.9%ROCE =

NIXONGrowth drivers
Existing Market Penetration
Brand Design & Marketing Innovation
New/ Emerging Market Development
New Category Growth
Nixon has driven growth across all four brand growth drivers
10%+ FY07-FY10 sales CAGR in N. America market
Main driver was expansion into speciality watch channel
20%+ FY07-FY10 sales CAGR outside of N. America leveraging Billabong’s global distribution network
Apparel Headphones
Tide watch Unique high end watch design Luxury accessories
Nixon ROCE increased from 8% in 2005 to 18% in 2010
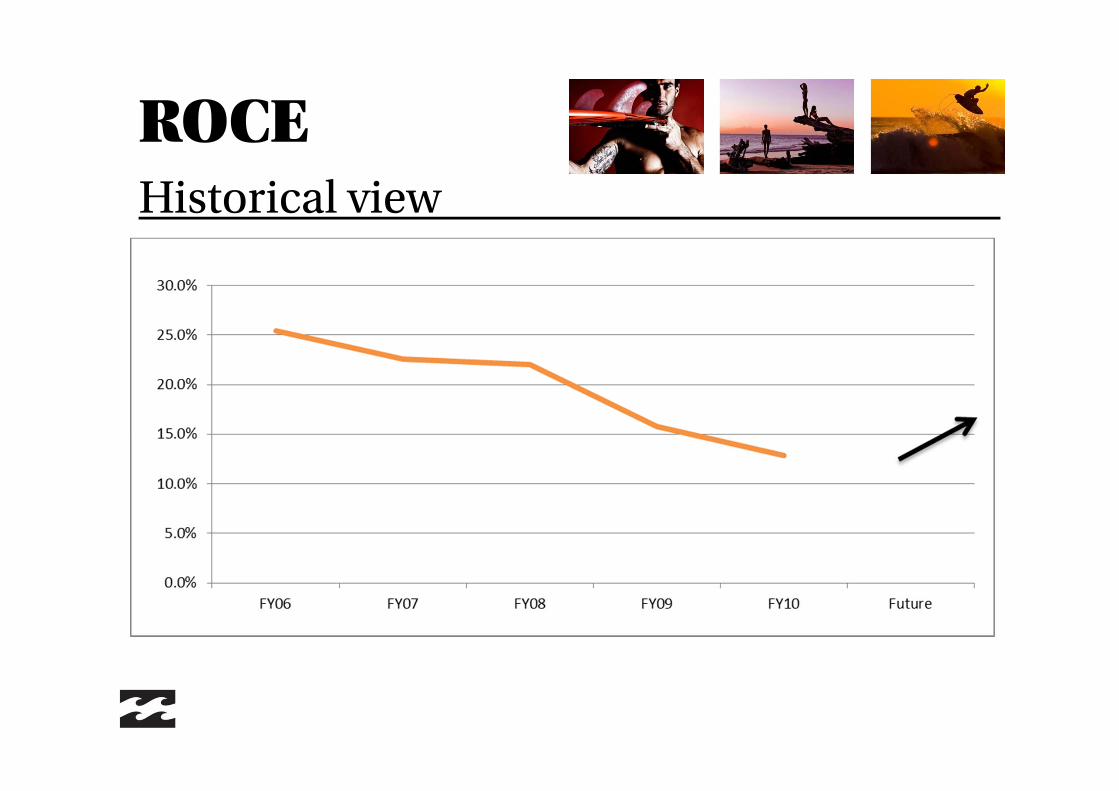
ROCEHistorical view
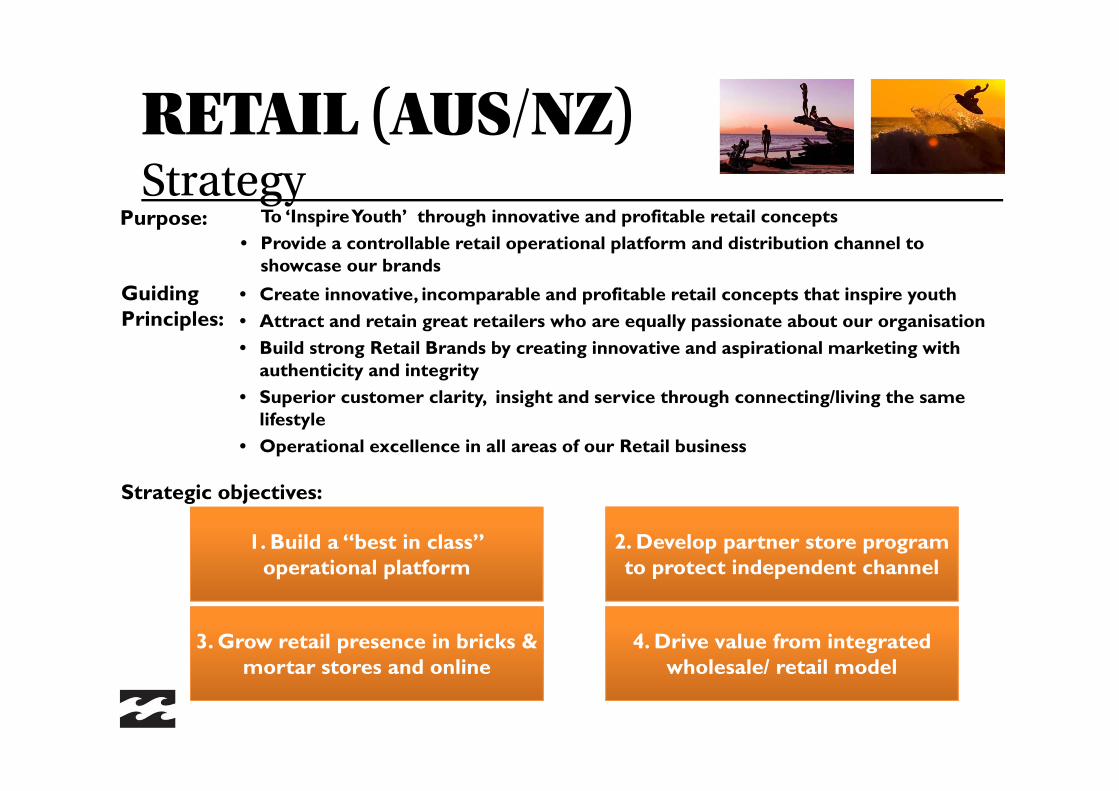
• To ‘Inspire Youth’ through innovative and profitable retail concepts• Provide a controllable retail operational platform and distribution channel to
showcase our brands
Purpose:
RETAIL (AUS/NZ)Strategy
Guiding Principles:
• Create innovative, incomparable and profitable retail concepts that inspire youth• Attract and retain great retailers who are equally passionate about our organisation• Build strong Retail Brands by creating innovative and aspirational marketing with
authenticity and integrity • Superior customer clarity, insight and service through connecting/living the same
lifestyle• Operational excellence in all areas of our Retail business
Strategic objectives:
1. Build a “best in class” operational platform
3. Grow retail presence in bricks & mortar stores and online
4. Drive value from integrated wholesale/ retail model
2. Develop partner store program to protect independent channel
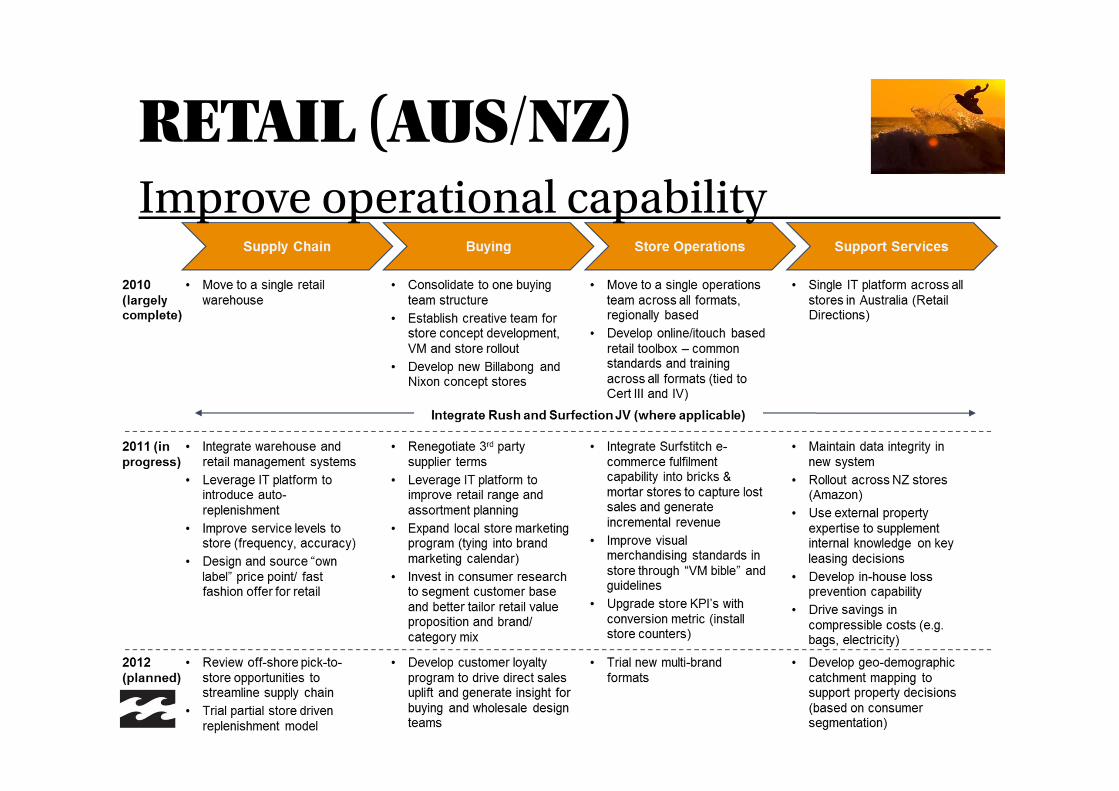
RETAIL (AUS/NZ)Improve operational capability