Bill Navidi Colorado School of Mines THE BOTTOM LINE: WHAT’S ESSENTIAL IN AN ELEMENTARY STATISTICS...
30
Bill Navidi Colorado School of Mines THE BOTTOM LINE: WHAT’S ESSENTIAL IN AN ELEMENTARY STATISTICS COURSE Barry Monk Middle Georgia State College Don Brown Middle Georgia State College
-
Upload
graciela-golder -
Category
Documents
-
view
218 -
download
0
Transcript of Bill Navidi Colorado School of Mines THE BOTTOM LINE: WHAT’S ESSENTIAL IN AN ELEMENTARY STATISTICS...

Bill NavidiColorado School of Mines
THE BOTTOM LINE:
WHAT’S ESSENTIAL IN AN ELEMENTARY STATISTICS COURSE
Barry MonkMiddle Georgia State College
Don BrownMiddle Georgia State College

HISTORICAL PERSPECTIVE AND GROWTH OF ELEMENTARY
STATISTICS

1925 Statistical Methods for Research Workers R.A. Fisher
Aimed at practicing scientists 1937 Statistical Methods
George Snedecor
Aimed at prospective scientists still working on degrees
1961 Probability with Statistical Applications Moste l ler , Rourke, & Thomas
Aimed at the broader academic curriculum
70’s-present Data RevolutionAnalysis of data as an independent subjectTechnology
STATISTICS IN THE PAST

GROWTH (AP STATISTICS EXAMINEES)
AP Statistics ExamineesYear Students1997 7,6671998 15,4861999 25,2402000 34,1182001 41,0342002 49,8242003 58,2302004 65,8782005 76,7862006 88,2372007 98,0332008 108,2842009 116,8762010 109,6092011 120,1282012 152,750
1997 1998 1999 2000 2001 2002 2003 2004 2005 2006 2007 2008 2009 2010 2011 20120
20000
40000
60000
80000
100000
120000
140000
160000
180000
Students
Taught across many disciplines and departments
Students have vastly diff erent backgrounds and goals
Active learning Increased use of web resourcesVaried uses of technologyEmphasis on statistical literacy
MODERN ELEMENTARY STATISTICS
GAISE RecommendationsEmphasize statistical literacy and
develop statistical thinking.Use real data.Stress conceptual understanding,
rather than mere knowledge of procedures.
Foster active learning in the classroom.Use technology for developing
concepts and analyzing data.Use assessments to improve and
evaluate student learning.

COMMON APPROACHES TO TEACHING ELEMENTARY
STATISTICS

A fi rst Statistics course generally includes the following content areas:
SamplingDescriptive StatisticsProbability Inferential Statistics
APPROACH
Descriptive Statistics
Sampling ProbabilityInferential Statistics

The topics covered in each of these areas and the amount of time spent on may diff er depending on educational needs or curricular objectives. Two factors that shape the course approach are:
Balance between probability and statisticsExtent to which technology is included
APPROACH
Descriptive Statistics
Sampling ProbabilityInferential Statistics

Sampling Types of Samples Types of Data Design of Experiments Bias in Studies
Descriptive Statistics Graphical Displays of Data Measures of Center Measures of Spread Measures of Position
Probability Basic Ideas & Terminology Addition Rule Conditional Probability &
Multiplication Rule
Counting techniques Random Variables
Binomial Distribution Poisson Distribution Normal Distribution
Inferential Statistics Sampling Distributions and The
Central Limit Theorem Confi dence Intervals
Population Mean Population Proportion
Hypothesis Testing Population Mean Population Proportion
MAINSTREAM ONE-SEMESTER STATISTICS COURSE

LIGHT PROBABILITY APPROACH

LIGHT PROBABILITY APPROACH
Descriptive Statistics
Sampling Probability Inferential Statistics

Sampling Types of Samples Types of Data Design of Experiments Bias in Studies
Descriptive Statistics Graphical Displays of Data Measures of Center Measures of Spread Measures of Position
Probability Basic Ideas & Terminology Addition Rule* Conditional Probability &
Multiplication Rule
Counting techniques* Random Variables
Binomial Distribution Poisson Distribution Normal Distribution
Inferential Statistics Sampling Distributions and The
Central Limit Theorem Confi dence Intervals
Population Mean Population Proportion
Hypothesis Testing Population Mean Population Proportion
LIGHT PROBABILITY APPROACH

LIMITED PROBABILITY APPROACH

LIMITED PROBABILITY APPROACH
Descriptive Statistics
Sampling
Pro
babili
ty
Inferential Statistics

Sampling Types of Samples Types of Data Design of Experiments Bias in Studies
Descriptive Statistics Graphical Displays of Data Measures of Center Measures of Spread Measures of Position
Probability Basic Ideas & Terminology Addition Rule Conditional Probability &
Multiplication Rule
Counting techniques Random Variables
Binomial Distribution Poisson Distribution Normal Distribution
Inferential Statistics Sampling Distributions and The
Central Limit Theorem Confi dence Intervals
Population Mean Population Proportion
Hypothesis Testing Population Mean Population Proportion
MAINSTREAM ONE-SEMESTER STATISTICS COURSE

Sampling Types of Samples Types of Data Design of Experiments Bias in Studies
Descriptive Statistics Graphical Displays of Data Measures of Center Measures of Spread Measures of Position
Probability Basic Ideas & Terminology Addition Rule Conditional Probability &
Multiplication Rule
Counting techniques Random Variables
Binomial Distribution Poisson Distribution Normal Distribution
Inferential Statistics Sampling Distributions and The
Central Limit Theorem Confi dence Intervals
Population Mean Population Proportion
Hypothesis Testing Population Mean Population Proportion
LIMITED PROBABILITY APPROACH

Sampling Types of Samples Types of Data Design of Experiments Bias in Studies
Descriptive Statistics Graphical Displays of Data Measures of Center Measures of Spread Measures of Position
Probability Basic Ideas & Terminology
Normal Distribution Inferential Statistics
Sampling Distributions and The
Central Limit Theorem Confi dence Intervals
Population Mean Population Proportion
Hypothesis Testing Population Mean Population Proportion
Leaves time for additional topics: Regression Two Sample Inferences Tests with Qualitative Data Analysis of Variance
LIMITED PROBABILITY APPROACH

A vocabulary test was given to elementary school children in grades 1 through 6.
There was a positive correlation between the childrens’ test scores and their shoe sizes.
Does learning new words make your feet grow?
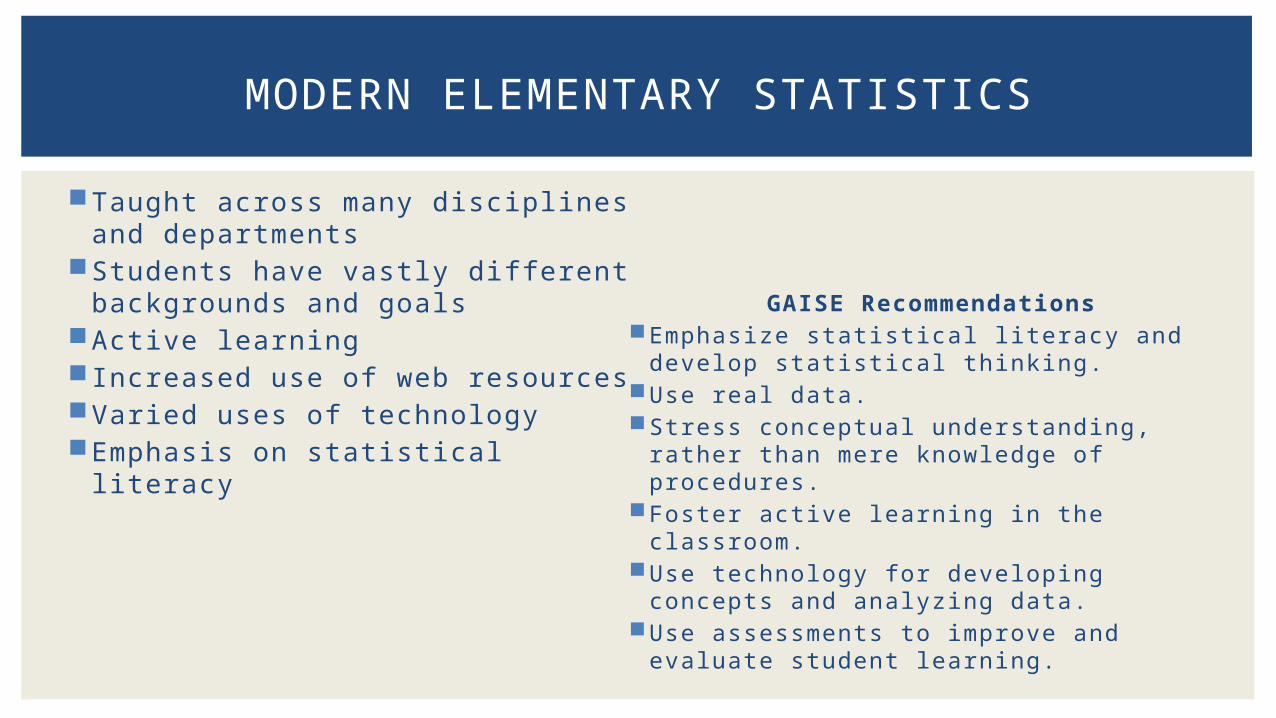
CORRELATION IS NOT CAUSATION
In a study of weightlifters, the least-squares regression line was computed for predicting the amount the weightlifter could lift (y) from his weight (x).
The line was y = 50 + 0.6x.
Joe is a weightlifter. He figures that if he gains 10 pounds, he will be able to lift 6 pounds more.
CORRELATION IS NOT CAUSATION

Each student tosses a coin 50 times and records the number of heads.
Students who toss the most heads are praised
Students who toss few heads are criticized for not being good at tossing heads
Message: Much variation in workplace performance is due to chance
NOTIONS ABOUT COIN TOSSING
Adapted from Red Bead Experiment – W.E. Deming

A probabilist and a statistician encounter a game of craps for the fi rst time. Can you tell which is which?
PROBABILITY VS. STATISTICS
Six-sided dice? Assuming that each face
comes up with probability 1/6, I can figure out what my
chances are of winning.
Those dice may look OK, but how do I know
they’re not loaded? I’ll watch for a while and
keep track of how often each number comes up.
Adapted from Calculated Bets: Computers, Gambling, and Mathematical Modeling to Win - Steven Skiena

What factors should be considered when weighing the balance between probability and statistics?
What trade-off’s are involved?
QUESTIONS

GENERAL CONSIDERATIONS (OR GEE-WHIZ – I’M REALLY
BEHIND!)

Light treatment or potential omission of:Frequency PolygonsOgivesStem-and-Leaf PlotsComputation of percentiles*Five-Number SummaryBoxplotsChebyshev’s InequalityComputation of standard deviation of discrete probability distribution
*Computation given light treatment, but the concept should be covered
GEE-WHIZ, I’M REALLY BEHIND!

TECHNOLOGY CONSIDERATIONS

To what degree should technology be used to: Construct graphical displays of data
Should the focus be on the construction of the display or the interpretation? Compute descriptive statistics
How much computation should students do to build intuition Determine the area under a curve
Table vs. Technology What are the advantages/disadvantages of each?
Construct confidence intervals and perform hypothesis tests Technology implies P-value approach
TECHNOLOGY CONSIDERATIONS

Critical value approach Only tells whether a test statistic is
unusual or not Generally easier if using tables
CRITICAL VALUE VS. P-VALUE
P-value approach Tells exactly how unusual a test
statistic is Generally easier if using technology
Where should the line be drawn between “by hand” calculations and technology?
What kind of technology should be used and why? Is there a particular advantage to one type of technology over another?
QUESTIONS

Historically, inference begins with sample means. With technology, the case where is known is less important and rarely used.
Is it necessary to cover the known case for conceptual reasons?
It may be diffi cult to begin with the t-distribution, so what about beginning with proportions?
QUESTIONS

Bill NavidiColorado School of Mines
THE BOTTOM LINE:
WHAT’S ESSENTIAL IN AN ELEMENTARY STATISTICS COURSE
Barry MonkMidd le Georg ia State Co l lege
Don BrownMidd le Georg ia State Co l lege
Thank you