
Bill Janeway Warburg Pincus Productive Bubbles Business of Software Conference Europe
44
Productive Bubbles William H. Janeway Faculty of Economics University of Cambridge Warburg Pincus 24 June 2015
-
Upload
business-of-software -
Category
Business
-
view
11.453 -
download
0
Transcript of Bill Janeway Warburg Pincus Productive Bubbles Business of Software Conference Europe

Productive Bubbles
William H. Janeway
Faculty of Economics
University of Cambridge
Warburg Pincus
24 June 2015

Bubbles: A Typology
Locus of Speculation
Non-Productivity Enhancing
Productivity Enhancing
Object of Speculation
2005-2008
1998-2000
Banking System
Capital Markets

Objects of Speculation
“Investors have speculated in commodity exports, commodity imports, agricultural land at home and abroad, urban building sites, railroads, new banks, discount houses, stocks, bonds (both foreign and domestic), glamour stocks, conglomerates, condominiums, shopping centers and office buildings.” (Kindleberger and Aliber, Manias, Panics and Crashes: A History of Financial Crises, 6th edn. (New York: Palgrave Macmillan, 2011) p. 15)
3
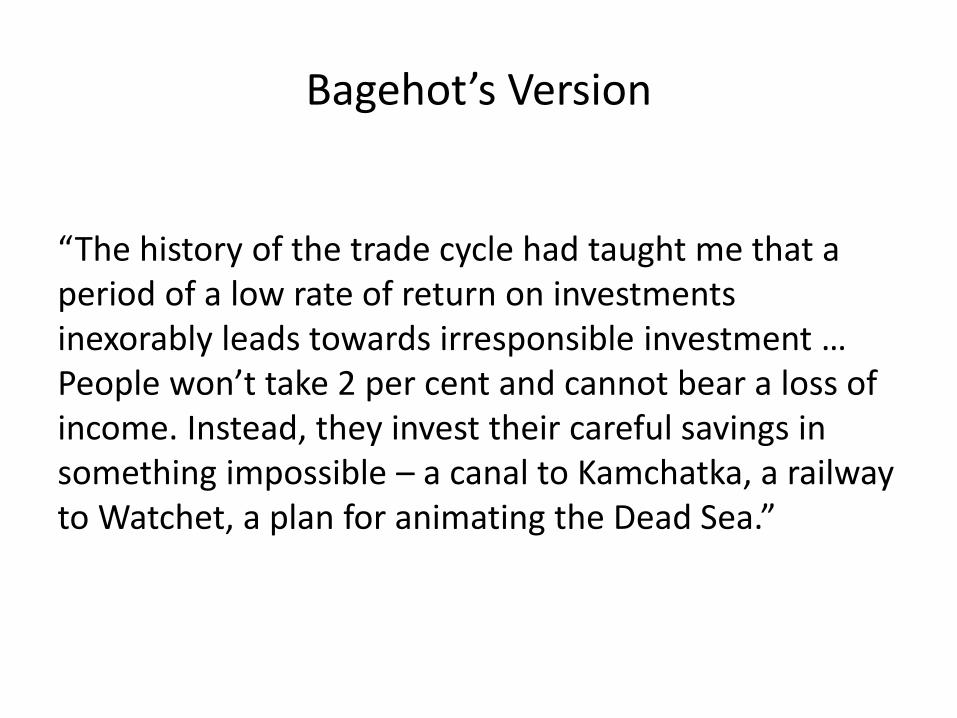
Bagehot’s Version
“The history of the trade cycle had taught me that a period of a low rate of return on investments inexorably leads towards irresponsible investment … People won’t take 2 per cent and cannot bear a loss of income. Instead, they invest their careful savings in something impossible – a canal to Kamchatka, a railway to Watchet, a plan for animating the Dead Sea.”

Nick Sibley’s Version
“A less flattering portrait of financial capitalism captures the recurrent waves of speculative boom and bust that express the essential behavior of financial institutions and markets, whose participants are compelled to make commitments today in the face of inescapable uncertainty about the world in which the consequences of those commitments will be realized. Nicholas Sibley, once the public face of the leading investment firm in Hong Kong, characterizes financial capitalism as a lush: “Giving capital to a bank . . . is like giving a gallon of beer to a drunk: you know what will come of it, but you can’t know which wall he will choose.” (Janeway, Doing Capitalism, p. 136, citing Fildes, “City and Suburban,” The Spectator (London), October 3, 1998)
5

The Double Role of Prices
“Prices play two roles. Not only are they a reflection of the underlying economic fundamentals, they are also an imperative to action. That is, prices induce actions on the part of other economic agents. Some actions induced by price changes are desirable, not only from the point of view of the individual but from a system perspective, too. However, some actions borne out of binding constraints or actions that exert harmful spillover effects on others are undesirable when viewed from the perspective of the group….The problem comes when the reliance on market prices distorts those same market prices.” (Shin, Risk and Liquidity, p. 4)
6

Perverse Demand and Supply Curves
“…[I]n a boom phase, we can characterize the decisions of a leveraged financial institution as if coming from a decision maker who has become less risk averse, even though the underlying preferences of that institutions remain unchanged….When the price of a risky assets rises, the leveraged financial institution purchases more of the risky asset….But then, the additional purchases of risky assets…fuel the asset price boom further….The upward-sloping demand response has a mirror image in the downward phase of the financial cycle. When the price falls, the risk appetite of the leveraged institution falls so much that, in spite of the fall in the price, the desired holding of the risky asset falls. The supply response is downward-sloping. As price falls, more of the asset is dumped on the market, depressing the price further.” (Shin, pp. 10-1)
7

The Consequences of Securitization and Mark-to-Market
“In an era when loans are packaged into securities and balance sheets are continually marked to market, the galvanizing role of market prices reaches into every nook and cranny of the financial system….[T]he severity of the global financial crisis is explained in large part by financial development that put marketable assets at the heart of the financial system, and the increased sophistication of financial institutions that held and traded the assets.
“The action-inducing nature of market prices is at its most dramatic during crisis episodes, but arguably it is at its most damaging during booms….
“During a boom, the action-inducing nature of market prices do their work through the increased capacity of banks to lend In boom times [when] banks have surplus capital.…
“In the eyes of the bank’s top management, a bank with surplus capital is like a manufacturing plant with idle capacity….” (Shin, pp. 1, 6-7)
8

The Limits of Arbitrage: Shleifer and Vishny
“Our article describes the workings of markets in which specialized arbitrageurs invest the capital of outside investors, and where investors use arbitrageurs' performance to ascertain their ability to invest profitably. We show that such specialized performance-based arbitrage may not be fully effective in bringing security prices to fundamental values, especially in extreme circum-stances. More generally, specialized, professional arbitrageurs may avoid extremely volatile "arbitrage" positions. Although such positions offer attractive average returns, the volatility also exposes arbitrageurs to risk of losses and the need to liquidate the portfolio under pressure from the investors in the fund.
(Shleifer and Vishny, “The Limits of Arbitrage,” Journal of Finance, 52, no. 1 (1997), p. 54)
9

The Limits of Arbitrage: Keynes
“There must surely be large profits to be gained from the other players in the long run by the skilled individual who, unperturbed by the prevailing pastime, continues to purchase investments on the best genuine long-term expectations he can frame….[T]there are, indeed, such serious-minded individuals and…it makes a vast difference to an investment market whether or not they predominant….{but} investment based on genuine long-term expectation is so difficult today as to be scarcely practicable. He who attempts it must surely lead much more laborious days and run greater risks than he who tries to guess better than the crowd how the crowd will behave….The game of professional investment is intolerably boring and over-exacting to anyone who is entirely exempt from the gambling instinct; whilst he who has it must to this propensity the appropriate toll. Furthermore, an investor who proposes to ignore near-term market fluctuations needs greater resources for safety and must not operate on so large a scale, if at all with borrowed money….(Keynes, The General Theory, p. 156)
10
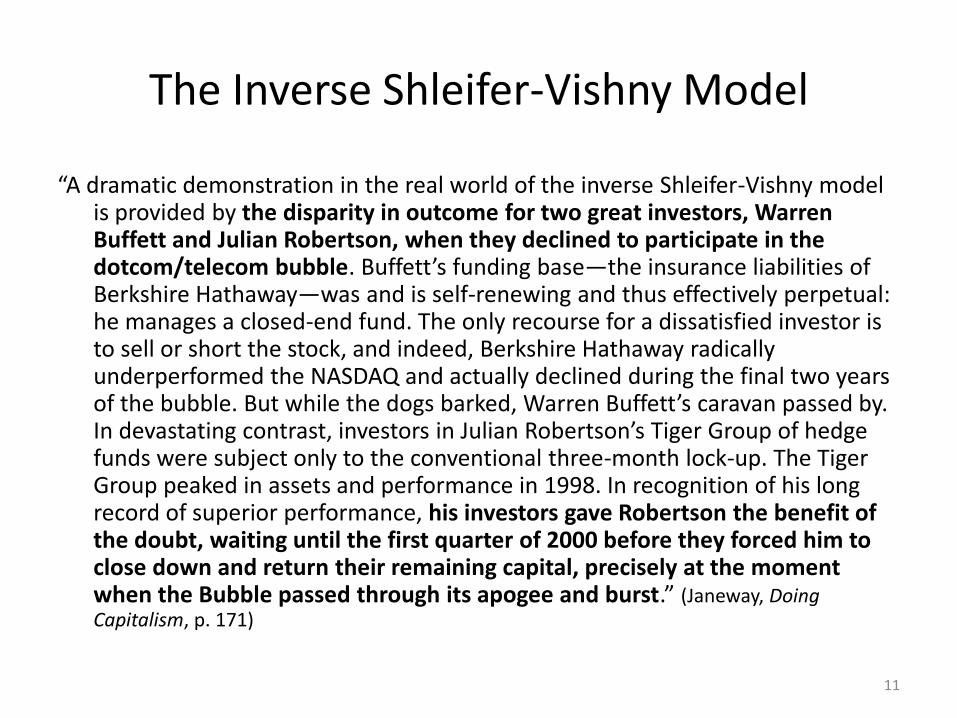
The Inverse Shleifer-Vishny Model
“A dramatic demonstration in the real world of the inverse Shleifer-Vishny model is provided by the disparity in outcome for two great investors, Warren Buffett and Julian Robertson, when they declined to participate in the dotcom/telecom bubble. Buffett’s funding base—the insurance liabilities of Berkshire Hathaway—was and is self-renewing and thus effectively perpetual: he manages a closed-end fund. The only recourse for a dissatisfied investor is to sell or short the stock, and indeed, Berkshire Hathaway radically underperformed the NASDAQ and actually declined during the final two years of the bubble. But while the dogs barked, Warren Buffett’s caravan passed by. In devastating contrast, investors in Julian Robertson’s Tiger Group of hedge funds were subject only to the conventional three-month lock-up. The Tiger Group peaked in assets and performance in 1998. In recognition of his long record of superior performance, his investors gave Robertson the benefit of the doubt, waiting until the first quarter of 2000 before they forced him to close down and return their remaining capital, precisely at the moment when the Bubble passed through its apogee and burst.” (Janeway, Doing Capitalism, p. 171)
11

The Limits to Arbitrage: Data
“Institutional limits to arbitrage can also give rise to bubbles owing to the nature of incentives and principal-agent issues in the rapidly growing fund management industry. In the United States for instance, the proportion of stocks held by institutional investors hovered around 5 percent in the first half of the twentieth century; from 6 percent in 1952, the institutional share then rose to 45 percent in 1991, and 67 percent by 2010.…While the growing presence of institutional investors might intuitively suggest markets would become more efficient over time (and thus less prone to bubbles), business risk and compensation practices in the delegated portfolio management industry can encourage institutional herding and ‘rational’ bubble riding. At the very least, incentives for investment managers can dissuade them from leaning against bubbles.”
(B. Jones, “Asset Bubbles: Re-thinking Policy for the Age of Asset Management,” IMF WP 15/27, February 2015)

Share Prices and Economic Fundamentals
“[O]n average over the past century, U.S. stock prices have been three times more volatile than fundamentals . . . But the trend in the degree of excess volatility is also telling. Up until the 1960s, prices were around twice as volatile as fundamentals. Since 1990, they have been anywhere from six to ten times more volatile. Excess volatility in equity prices has risen as financial innovation has taken off.”
(A. Haldane, “Patience and Finance,” paper presented to Oxford China Business Forum, Beijing, September 9, 2010, p. 15, www.bis.org/review/r100909e.pdf.)
13

Three Stylized Facts of Bubbles
“…[A]sset prices coincide with increases in trading volume,…asset price bubble deflation seems to match with increases in an asset’s supply, and…asset price bubbles often occur in times of financial or technological innovation.”
(J. A. Scheinkman, Speculation, Trading and Bubbles (Columbia University Press, New York NY, 2014), p. 11.)
14

The “Signature” of a Bubble
“[T]he connection between high trading volume and bubbles is a well-established fact. This relationship…distinguishes models of bubbles based on heterogeneous beliefs and cost asymmetries from ‘rational bubble’ theories. A rational bubble is characterized by a continuous rise in an asset’s price. Investors are content to hold the asset at the current price, because they believe that they are compensated for any risk of the bubble bursting by a suitably expected rate of price increase. In contrast to models based on heterogeneous beliefs and costly short-selling, rational bubble theories fail to explain the association between bubbles and high trading volume and cannot be invoked to explain bubbles in assets that have final payoffs at a maturity date T, such as many credit instruments.”
(Scheinkman, Speculation, p. 10)
15

Keynes’ Bridge
“The daily revaluations of the Stock Exchange . . . inevitably exert a decisive influence on the rate of current investment. For there is no sense in building a new enterprise at a cost greater than that at which a similar existing enterprise can be purchased; while there is an inducement to spend on a new project what may seem an extravagant sum, if it can be floated off on the Stock Exchange at an immediate profit. Thus certain classes of investment are governed by the average expectation of those who deal on the Stock Exchange as revealed in the price of shares, rather than by the genuine expectation of the professional entrepreneur.” (Keynes, General Theory, p. 151)
16

Entrepreneurs and Speculators: Financial Valuation and Real Investment
“By conveying a positive signal about profitability, higher aggregate investment . . . increases asset prices, which in turn raises the incentives to invest. This two-way feedback between real and financial activity makes economic decisions sensitive to higher-order expectations and amplifies the impact of noise on equilibrium outcomes. As a result, economic agents may behave as if they were engaged in a Keynesian “beauty contest” and the economy may exhibit fluctuations that may appear in the eyes of an external observer as if they were the product of “irrational exuberance.” Importantly, these effects are symptoms of inefficiency, are driven purely by the dispersion of information, and obtain in an otherwise conventional neoclassical setting.”
(M. Angelotos, Lorenzoni. G. and Pavan, A., “Beauty Contests and Irrational Exuberance: a Neoclassical Approach”, NBER Working paper, No., 15883, 2010, pp. 31–2; emphasis in original)
17

Financial Valuation and Real Investment through the Cycle
“The effects analyzed in this paper are likely to be stronger during periods of intense technological or institutional change, when the information about the profitability of new investment opportunities is likely to be highly dispersed. At some level, this seems consistent with the recent experiences surrounding the internet revolution or the explosion of investment opportunities in emerging economies.”
(Angelotos, Lorenzoni and Pavan, p. 32)
18
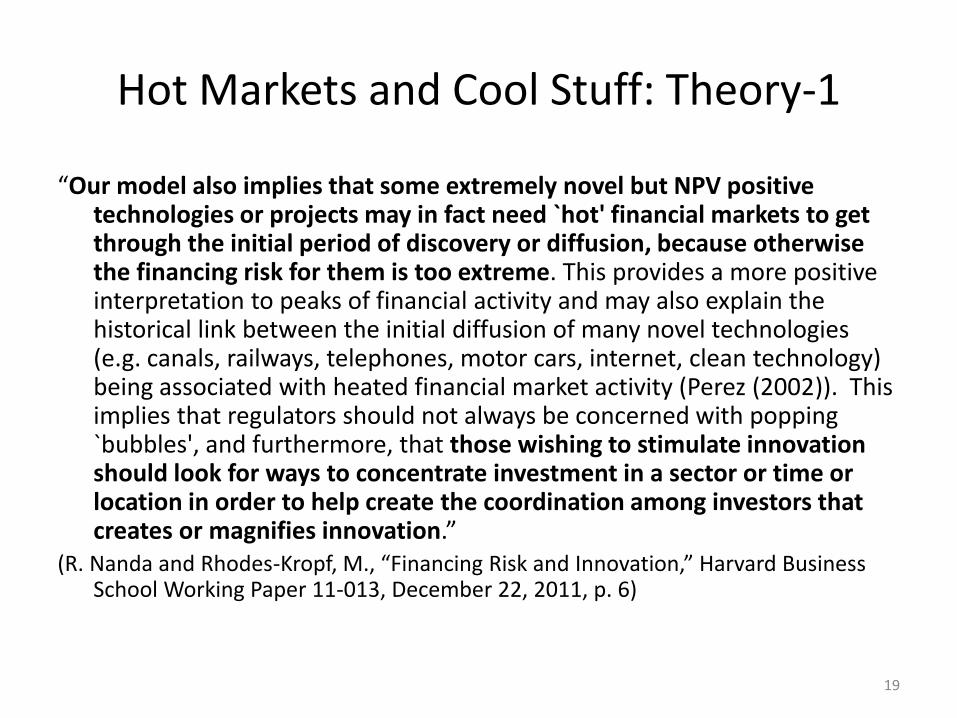
Hot Markets and Cool Stuff: Theory-1
“Our model also implies that some extremely novel but NPV positive technologies or projects may in fact need `hot' financial markets to get through the initial period of discovery or diffusion, because otherwise the financing risk for them is too extreme. This provides a more positive interpretation to peaks of financial activity and may also explain the historical link between the initial diffusion of many novel technologies (e.g. canals, railways, telephones, motor cars, internet, clean technology) being associated with heated financial market activity (Perez (2002)). This implies that regulators should not always be concerned with popping `bubbles', and furthermore, that those wishing to stimulate innovation should look for ways to concentrate investment in a sector or time or location in order to help create the coordination among investors that creates or magnifies innovation.”
(R. Nanda and Rhodes-Kropf, M., “Financing Risk and Innovation,” Harvard Business School Working Paper 11-013, December 22, 2011, p. 6)
19

Hot Markets and Cool Stuff: Theory-2
“By modeling the investor response to financing risk we are able to understand why financing risk is likely to create or magnify innovative activity, as well as lead investors to fund a different type of firm at different times in the innovation cycle. Conventional wisdom on the effect of abundant financing is one of money chasing deals (Gompers and Lerner (2000)) - that when more money enters an area more “bad", lower return, deals are funded. Our idea is that simultaneously money changes deals. That is, when capital is abundant, more innovative ideas are funded because financing risk falls in these times, increasing the NPV of innovative projects. Thus, during peaks of activity financiers may increase experimentation and fund a fundamentally different type of activity.” (Nanda and Rhodes-Kropf, “Financing Risk,” p. 4)
20

Hot Markets and Cool Stuff: Empirics
“We find that startups receiving their initial funding in more active investment periods were significantly more likely to go bankrupt than those founded in periods when fewer startup firms were funded. However, conditional on being successful, and controlling for the year they exit, startups funded in more active periods were valued higher at IPO or acquisition, led more patents in the years subsequent to their funding (controlling for capital received), and had more highly-cited patents than startups funded in less active investment periods. That is, startups funded in hot markets were more likely to be in the “tails" of the distribution of outcomes than startups funded in cold markets: they were both more likely to fail completely and more likely to be extremely successful and innovative.”
(R. Nanda, and Rhodes-Kropf, M., “Investment Cycles and Startup Innovation,” Journal of Financial Economics, 110, no. 2 (November 2013). p. 4)
21
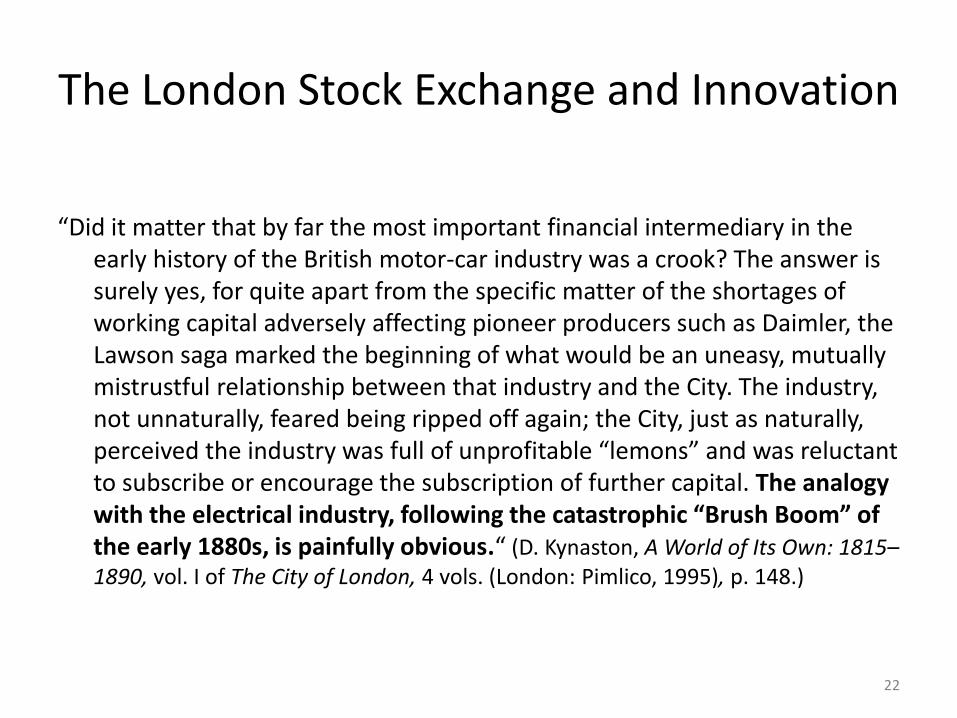
The London Stock Exchange and Innovation
“Did it matter that by far the most important financial intermediary in the early history of the British motor-car industry was a crook? The answer is surely yes, for quite apart from the specific matter of the shortages of working capital adversely affecting pioneer producers such as Daimler, the Lawson saga marked the beginning of what would be an uneasy, mutually mistrustful relationship between that industry and the City. The industry, not unnaturally, feared being ripped off again; the City, just as naturally, perceived the industry was full of unprofitable “lemons” and was reluctant to subscribe or encourage the subscription of further capital. The analogy with the electrical industry, following the catastrophic “Brush Boom” of the early 1880s, is painfully obvious.“ (D. Kynaston, A World of Its Own: 1815–1890, vol. I of The City of London, 4 vols. (London: Pimlico, 1995), p. 148.)
22

New Issues on US Stock Markets
“…[T]he cash proceeds from stock issues in the United States…were already relatively high by the early part of the twentieth century, and the rapid growth that occurred in the 1920s brought them to an impressive peak by 1930.
“However,…if we take account of the growth in the U.S. economy, it is the 1920s that stands out as the decade with the highest level of stock issuance. No other year before or after came close to 1928 and 1929 in the levels of stock issuance as a percentage of national income….”
(M. O’Sullivan, “Funding New Industries: A Historical Perspective on the Financing Role of the U.S. Stock Market in the Twentieth Century” in N. R. Lamoreaux and K. L. Sokoloff (eds.), Financing Innovation in the United States: 1870 to the Present (Cambridge, MA: MIT Press, 2007), pp. 167 and Tables 4.1 and 4.2)
23
The Auto Industry and the Stock Market: The Boom of 1915-17
“…[N]early fifty security issues were undertaken by automobile companies from 1915 to 1917 to raise cash of more than $100 million in new financings. Some of these issues were undertaken by the larger, established companies in the industry….In addition, a group of recent entrants to the automobile business, twenty of them in total, raised funds from the financial markets at this time.
“…[T]hese companies were late entrants…, and the majority of them came to a sorry end. By 1924, thirteen out of twenty of them had exited the automobile industry….However, there were six survivors, including Chevrolet….” (O’Sullivan, pp. 180-1)
24

Financing Electrification - 1
“The dominant economic fact of the electric utility industry, determined by technology, was extreme capital intensity. This had two major implications. First, the industry had high fixed costs that had to be met in order for a utility to be profitable, and relatively low operating or variable costs . . . A substantial amount of capital had to be raised before any electricity could be produced.
“A second economic effect . . . was that production was subject to significant economies of scale . . . This meant that for most relevant output levels, marginal costs were below average costs . . . If firms set a price equal to marginal cost (the point to which competition would drive prices under “normal” circumstances), they would be making economic losses.”
(Hausman, The Historical Antecedents of Restructuring: Mergers and Concentration in the U.S. Electric Utility Industry, 1879–1935, pp. 2–3.)
25

Financing Electrification - 2
“During the 1920s, the public equity and debt markets played the critical role in funding the build-out of the systems that delivered electricity to industry and to households, regionally and at length nationally. The public utility holding companies, initially created to transfer technical expertise to local generating and distribution companies, evolved into vehicles for providing the necessary finance for an industry whose capital intensity rivaled that of the railroads.
“So electrification evolved through a dynamic feedback process that delivered, generally at the state and local level, both speculative capital and governmental regulation, the latter invoked to protect the prospective returns on the former.…As the level of electrification for manufacturing industry and (nonrural) residential uses passed 50 percent in the early 1920s, consolidation of the industry into regional and even national holding companies was enabled by a frenzy on Wall Street terminated only by the Crash of 1929. Before the frenzy ended, installed generating capacity in the United States had risen from 13 million to 33 million kilowatts.”
(Janeway, Doing Capitalism)
26

Aviation and the Stock Market
“…Initially, the public did not seem particularly interested in investing in the aviation industry….
“Charles Lindbergh’s transatlantic flight in May 1927 changed all of that…At the time, however, there were few…stocks from which investors could choose. Wright Aeronautical was the only aviation company with a listing on the NYSE. It made the engine that powered Lindbergh’s plane, and its stock soared from 25…in April 1927 to 94 ¾ by December 1927.
“…From March 1928 to June 1930, 124 public offering of stock were conducted by aviation companies to raise more than $300 million….” (O’Sullivan, p. 187)
27

Radio and the Stock Market: The First Boom
“…The boon to the commercial potential of radio…was the development of public broadcasting in 1920.
“By far the most important player in the radio industry…was the Radio Corporation of America. It was established at the initiative of General Electric, with the approval of the U.S. government, to bring all the important patents in the U.S. radio industry…under one roof.
“The wave of entry into the radio industry was accompanied by a boom in stock issues of radio companies. An expression commonly heard at the time was ‘a new radio stock a day’….
“The stock market’s enthusiasm for the radio industry dissipated in early 1925 largely because of the pressure on profitability that high entry had caused. The leading radio stocks lost 60 percent of their value from December 1924 to May 1926. If we exclude RCA…the decline…was…92 percent.” (O’Sullivan, pp. 193-5)
28

Radio and the Stock Market: The Second Boom
“Following the crash of radio stocks in 1925, there was a lull…that lasted for almost three years….From March 1928 to September 1929, twenty-five public stock offerings were undertaken by radio companies to raise a total of $38.4 million.
“There was another bust in radio stock prices from 1929. The stock market crash and subsequent depression played crucial roles in precipitating the decline, but industry observers also blamed another overexpansion of the industry.’ (O’Sullivan, p. 196)
29

The “-onics” Bubble: The Return of Speculation circa 1960
“The bull market that got underway from the early 1950s was primarily focused on the stocks of established companies….
“It was not until the late 1950s that substantial numbers of small, high-tech companies once again sold stock to the public. An important catalyst for the change occurred in October 1957….Sputnik galvanized the U.S. political elite to make even greater financial commitments to the development of technology….
“A boom in initial public offerings got underway in 1958 and continued until the decline of the stock market in early 1962. During this period, as the SEC put it, ‘The distribution of securities by companies that had not made a previous public offering reached the highest level in history.’” (O’Sullivan, p. 208)
30
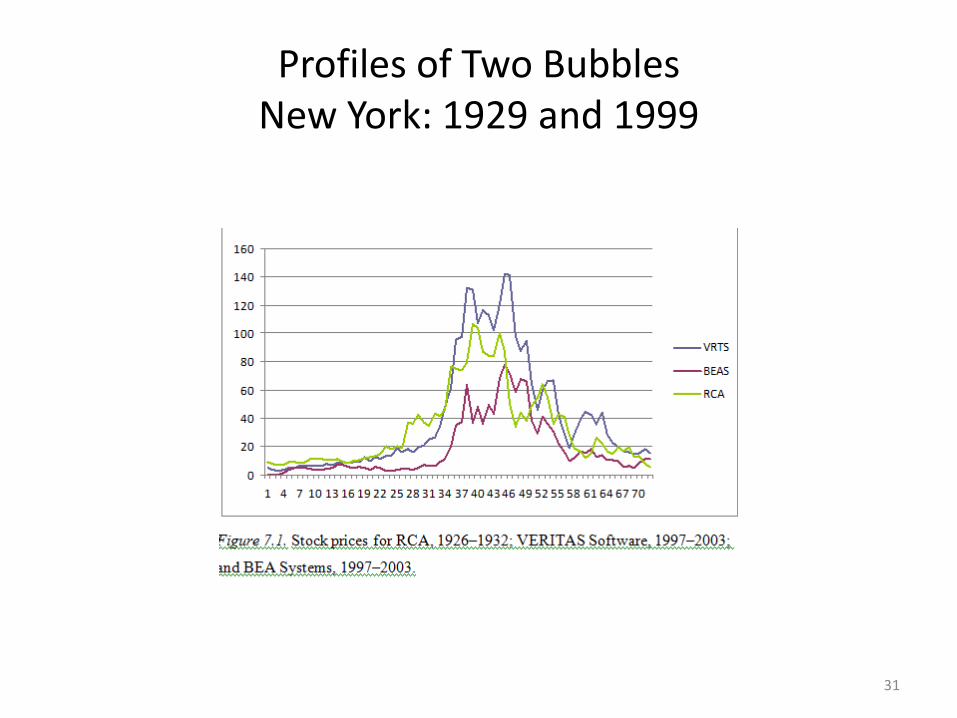
Profiles of Two Bubbles New York: 1929 and 1999
31

The R&D Boom of the Late 1990s
“From 1994 to 2004, there was a dramatic boom, and subsequent decline, in R&D: The ratio of privately financed industrial R&D to GDP rose from 1.40% in 1994 to an all-time high of 1.89% in 2000 before declining to an average of 1.70% from 2002 to 2004, according to a survey from the National Science Foundation. As we will show, just seven high-tech industries (drugs,office equipment and computers, electronic components, communication equipment, scientific instruments, medical instruments, and software) accounted for virtually all of the 1990s U.S. R&D boom. More important, virtually all of the boom was accounted for by young firms (publicly traded for less than 15 years) in these industries.
“From 1994 to 2004, there was also a dramatic boom and bust in both cash flow and external equity finance in these industries. Internal finance (cash flow) for publicly traded firms increased from $89 billion in 1993 to $231 billion in 2000, and then collapsed in 2001 and 2002. External public equity finance rose from $24 billion in 1998 to $86 billion in 2000, but then plummeted 62% in 2001.”
(J. R. Brown, Fazzari, S. M. and Peterson, B.C., “Financing Innovation and Growth: External Equity and the 1990s R&D Boom,” Journal of Finance, 64(1) 2009, p. 152)
32

The R&D Boom of the Late 1990s: Evidence for the Explanation
33

Amazon
“Amazon’s IPO, on May 15, 1997…raised $54 million.…(p. 59)
“…In those highly carbonated years, from 1998 to early 2000, it raised a breathtaking $2.2 billion in thee separate bond offerings….(p, 69)
“While other dot-coms merged or perished, Amazon survived through a combination of conviction, improvisation and luck. Early in 2000…Amazon sold $672 million in convertible bonds to overseas investors….The deal was completed just a month before the crash of the stock market, after which it became exceedingly difficult for any company to raise money. Without that cushion, Amazon would almost certainly have faced the prospect of insolvency over the course of the next year.” (p. 101)
(B. Stone, The Everything Store: Jeff Bezos and the Age of Amazon (New York: Little, Brown and Company, 2013)
34

“Profits of Doom”
“Let us now praise famous men, the wild-eyed enthusiasts who begat the bubble-boom. When the stock market hit the puke stage, conventional wisdom turned. The whole new economy thing had been a bad thing. Time, talent, and capital were thrown away on unsustainable enterprises like point-and-click pet food….
“Conventional wisdom…once rode side by side with the prophets of change.
“Today’s party line is that the gold rush brought both pain and gain. Fortunes were poured into overflowing snake pits of fiber-optic cables, which, like Web-ordered groceries, proved to be profit-free zones. In just four years, the craze sucked up $600 billion of purchasing power….On the flip side, public markets paid for a build-out of the network infrastructure, and burn rates pushed the envelope of the culture at large…. (DeLong, p. 1]
35
Social Returns versus Profits of Firms
“In fact, history will look back and see gain and gain. That’s because profits are not the same thing as social value. Just because a group of firms, an industry segment, flopped as a profitmaker does not mean it failed as a producer. Profit is primarily a signal about the size of a set of enterprises…. If profits are high, the industry segment should grow; if absent, it should shrink.
“That the dotcom and telecom sectors needed…to shrink has next to nothing to do with how useful their products will turn out to be….British investors in US railroads during the late 19th century got their pockets picked twice: first as waves of overenthusiasm led to overbuilding, ruinous competition and unbelievable…burn rates, and second as sharp financial operators stripped investors of control and ownership during bankruptcy workouts. Yet Americans and the American economy benefited enormously from the resulting network of railroad tracks that stretched from sea to shining sea… (DeLong, p. 1)
36

The “Killer App” of the Railroads
“[A] curious thing happened as railroad bankruptcies and price wars put steady downward pressure pm shipping prices and slashed rail freight and passenger rates across the country: New industries sprang up.
“Consider…the old Montgomery Ward and Sears Roebuck catalogs….Mail a catalog to every household in the country. Offer the big-city goods at near big-city discounts. Rake in the money from satisfied customers. For two generations this business model—call it the ‘railroad services’ business model—was a license to print money, made possible only by the gross overbuilding of railroads, the resulting collapse of freight rates, and the fact that railroad investors had had to kiss nearly all their money good-bye….
“The same thing will happen with the froth that the bubble put on our 1990s boom. Investors lost their money. We now get to use all their stuff….” (DeLong, pp. 1-2)
37

Current Events: The Unicorn Bubble
“Over the past year or so, a phenomenon has emerged at the frontier of the digital economy: a wave of ventures delivering “disruptive” web services: Uber, Airbnb and their kin, generically known as “unicorns,” that share the double distinction of being valued at more than $1 billion while remaining private companies. How can we know whether these unprecedented valuations, some 107 of them at latest count, represent a bubble…and, if so, why this bubble is different?
“…The venue of this bubble is the market for private placement of equity securities with institutional investors – hedge funds, mutual funds, even sovereign wealth funds – whose portfolios overwhelmingly consist of public, freely trade-able shares.
“Private placements of equities with institutional investors have a long history: more than 35 years ago….But pricing of such placements was always at a substantial discount to the valuation of comparable public companies, as much as 40%. For the first time in the relevant record, institutional investors are choosing to pay premium prices to purchase securities without liquidity and in increasing volume.”
(W. H. Janeway, “Unicorns: Why This Bubble is Different?” available at http://www.forbes.com/sites/valleyvoices/2015/05/28/unicorns-why-this-bubble-is-different/)

The Unicorn Bubble: What Is Different
“First, “premium prices”: valuation metrics for the most recent financing rounds of unicorns – calculated as enterprise value divided by annual revenues, given the lack of profits reported by the vast majority of these fast-growing ventures – are currently running on the order of twice that metric for comparable public companies.
“Second, by purchasing unregistered securities in the absence of a liquid trading market, the new investors have chosen to forego the most valuable option an investor in a speculative venture can possess: the ability to “sell too soon;” the right to get out before having to find out if the speculation has been validated by economic reality; the opportunity to make money even if the venture fails.
“Finally, the signature of a bubble can be discerned in the increasing volume of such purchases of securities even as the disparity in valuation between private placements and public markets has grown.
“Between 2013 and 2014, Goldman Sachs’ count of the aggregate dollar value of private placements of tech company equity of more than $100 million quadrupled from $3.3 billion to $12.2 billion as the number of such transactions tripled from 15 to 49. And by Morgan Stanley’s more inclusive reckoning, technology private placements have risen from $9 billion and $10 billion during the twelve months ended March 31, 2013 and 2014, respectively, to $33 billion during the twelve months ended March 31, 2015.”

The Unicorn Bubble: The Supply Side
“As the complex of technologies that enable the development and delivery of disruptive services on the web have matured, the frictions that inhibit the growth of new companies have declined enormously. At start-up, the cost of introducing a new service is radically less than just 10 years thanks to open source (that is, “free”) software tools and the availability of computing resources for rent as needed from Amazon and the other cloud suppliers. Marketing begins with social media and advances through search engine optimization (i.e., gaming Google for better placement). And the service is delivered over the web as, from the point of view of the user, the underlying IT disappears.
“So the number of Darwinian “hopeful monsters” grows while the potential scale of any one of them grows even more. It is radically less costly in time and money to reach users and for users to take advantage of the service. Before profits or even revenues are recorded, an exponential increase in the number of users serves to imply a boundless market for the emergent unicorn even before a model for revenue generation and a path to profitability has been demonstrated.
“This especially appears to be the case for the web-based, two-sided market platforms represented by Uber and Airbnb. Both the suppliers and customers enjoy virtually friction-free access to services – including endogenous measures of service quality – that have historically been provided through far less efficient means characterized by substantial information asymmetries.”

The Unicorn Bubble: The Demand Side
“On the demand side, institutional investors have now been living with real interest rates close to zero for more than five years. Stock market returns have been attractive since recovery from the Global Financial Crisis was established and have averaged about 12% annually over the past five years. But the flow of new companies to the public markets, with the potential to deliver extraordinary growth and returns, has been highly constrained.
“For half a generation, since the last stock market bubble burst in 2000, the number of initial public offerings (“IPOs”) for technology companies has been far below the quarterly average of the previous twenty years, 10-15 per quarter versus more than 30. One factor has been the extreme consolidation of the investment banking industry since that time, with access to the market dominated by a small number of dealers whose own economics dictate their interest only in large offerings, more than $100 million.
“IPOs even at that scale limit the amount available to the major investing institutions, who can only accumulate meaningful positions by buying into a thin after- market, driving up the price against themselves. Under such circumstances, it appears rational for investors of this sort to make substantial commitments – many tens of millions of dollars – to offerings marketed as “pre-IPO” at valuations which are advertised as taking into account the post-IPO price increases.”

Andreessen Horowitz, “U.S. Tech Funding” June 2015, available at https://www.rebelmouse.com/TechnologyChannel/the-dry-bubble-we-may-be-in-what-that-means-1204202002.html

The Unicorn Bubble: How Will It End?
“Here, at length, is the crux of the matter. Sooner or later the unicorns will either go public or not. If they go public, their valuation will be subject to the two-way trading activity of the more or less liquid stock market. So far, the indications are mixed, at best. For every IPO that has validated the last private round in recent months, another has recorded a substantial markdown.
“The alternative to an IPO, of course, is sale to a strategic, corporate acquirer. But at the $1 billion-plus private market valuations for companies not generating profits or in some cases even revenue, the list of potential acquirers able to pay the price and absorb the dilution is very short indeed, limited to “FAGA”: Facebook, Amazon, Google and Apple, with perhaps Microsoft thrown in.
“The very existence of the FAGA set of players, of course, is what motivates the underlying force of the Unicorn Bubble, expressed as another acronym, “FOMO”- fear of missing out.”

The Unicorn Bubble? What Will It Leave behind
“Institutional latency guarantees that the Unicorn Bubble will persist yet awhile. The establishment of dedicated funds by major investment managers, as well as allocations by several sovereign wealth funds, will not be reversed overnight, whatever the results of the IPO market test. Yet, there will be consolation for society at large, if not for those motivated by FOMO to sacrifice liquidity in pursuit of the next FAGA.
“Indeed, the vast majority of the horde of hopeful monsters will fail to meet the speculators’ dreams and the failure of many will take the ultimate form of bankruptcy. But there will be a few amazing winners to demonstrate yet again the occasional role of productive bubbles in funding economic development at the frontier of technological innovation.”


