Bilirubin and Progression of Nephropathy in Type 2...
9
Ineke J. Riphagen, 1 Petronella E. Deetman, 1 Stephan J.L. Bakker, 1 Gerjan Navis, 1 Mark E. Cooper, 2 Julia B. Lewis, 3 Dick de Zeeuw, 4 and Hiddo J. Lambers Heerspink 4 Bilirubin and Progression of Nephropathy in Type 2 Diabetes: A Post Hoc Analysis of RENAAL With Independent Replication in IDNT Diabetes 2014;63:2845–2853 | DOI: 10.2337/db13-1652 Bilirubin, a potent endogenous antioxidant, was found to protect against the development of diabetic nephropa- thy (DN) in rodents. In humans, cross-sectional studies found an inverse relation between bilirubin and DN. We prospectively investigated whether bilirubin is associ- ated with progression of DN toward end-stage renal disease (ESRD). To this end, we performed a post hoc analysis in the Reduction of Endpoints in NIDDM with the Angiotensin II Antagonist Losartan (RENAAL) trial with independent replication in the Irbesartan Diabetic Nephropathy Trial (IDNT). Subjects with type 2 diabetes and nephropathy with alanine aminotransferase, aspar- tate aminotransferase (AST), and bilirubin levels <1.5 times the upper limit of normal were included. The renal end point was defined as the composite of confirmed doubling of serum creatinine or ESRD. Bilirubin was in- versely associated with the renal end point in RENAAL independent of age, sex, race, BMI, smoking, total cho- lesterol, diastolic blood pressure, HbA 1c , treatment, es- timated glomerular filtration rate, albumin-to-creatinine ratio, and AST. These results were confirmed in IDNT. This study indicates an independent inverse association of bilirubin with progression of nephropathy in RENAAL and IDNT. These data suggest a protective effect of bil- irubin against progression of nephropathy in type 2 di- abetes. The well-established role of bilirubin as an antioxidant is a potential explanation for the findings. The incidence of type 2 diabetes and its complications are increasing worldwide. One of the major complications of type 2 diabetes is diabetic nephropathy (DN). Nephrop- athy develops in ;20–40% of patients with diabetes and is the single leading cause of end-stage renal disease (ESRD) around the world (1). Bilirubin is a product of heme catabolism and is known to be a potent endogenous antioxidant (2). As such, bilirubin has consistently been associated with protection against the development of cardiovascular disease (CVD) (3,4). A study in rodents suggested that bilirubin is also protective against progression of DN (5). This notion is supported by several cross-sectional studies in humans demonstrating that low levels of bilirubin are associated with DN (6–8). To our knowledge, there are no prospective studies to date that investigated whether bilirubin levels are associated with progression of DN toward ESRD. There- fore, our primary objective was to prospectively investi- gate the association of bilirubin with progression of nephropathy in patients with type 2 diabetes. To this end, we performed a historical prospective study in the Reduction of Endpoints in NIDDM with the Angiotensin II Antagonist Losartan (RENAAL) trial (9,10). Subse- quently, independent replication was sought in the Irbe- sartan Diabetic Nephropathy Trial (IDNT) (11,12). 1 Department of Internal Medicine, Division of Nephrology, University of Gronin- gen, University Medical Center Groningen, Groningen, the Netherlands 2 Baker IDI Heart & Diabetes Institute, Melbourne, Victoria, Australia 3 Division of Nephrology, Vanderbilt University, Nashville, TN 4 Department of Clinical Pharmacy and Pharmacology, University of Groningen, University Medical Center Groningen, Groningen, the Netherlands Corresponding author: Dick de Zeeuw, [email protected]. Received 24 October 2013 and accepted 24 March 2014. This article contains Supplementary Data online at http://diabetes .diabetesjournals.org/lookup/suppl/doi:10.2337/db13-1652/-/DC1. © 2014 by the American Diabetes Association. Readers may use this article as long as the work is properly cited, the use is educational and not for profit, and the work is not altered. See accompanying article, p. 2613. Diabetes Volume 63, August 2014 2845 COMPLICATIONS
Transcript of Bilirubin and Progression of Nephropathy in Type 2...
Ineke J. Riphagen,1 Petronella E. Deetman,1 Stephan J.L. Bakker,1 Gerjan Navis,1 Mark E. Cooper,2 Julia B. Lewis,3
Dick de Zeeuw,4 and Hiddo J. Lambers Heerspink4
Bilirubin and Progression ofNephropathy in Type 2Diabetes: A Post Hoc Analysisof RENAAL With IndependentReplication in IDNTDiabetes 2014;63:2845–2853 | DOI: 10.2337/db13-1652
Bilirubin, a potent endogenous antioxidant, was found toprotect against the development of diabetic nephropa-thy (DN) in rodents. In humans, cross-sectional studiesfound an inverse relation between bilirubin and DN. Weprospectively investigated whether bilirubin is associ-ated with progression of DN toward end-stage renaldisease (ESRD). To this end, we performed a post hocanalysis in the Reduction of Endpoints in NIDDM withthe Angiotensin II Antagonist Losartan (RENAAL) trialwith independent replication in the Irbesartan DiabeticNephropathy Trial (IDNT). Subjects with type 2 diabetesand nephropathy with alanine aminotransferase, aspar-tate aminotransferase (AST), and bilirubin levels <1.5times the upper limit of normal were included. The renalend point was defined as the composite of confirmeddoubling of serum creatinine or ESRD. Bilirubin was in-versely associated with the renal end point in RENAALindependent of age, sex, race, BMI, smoking, total cho-lesterol, diastolic blood pressure, HbA1c, treatment, es-timated glomerular filtration rate, albumin-to-creatinineratio, and AST. These results were confirmed in IDNT.This study indicates an independent inverse associationof bilirubin with progression of nephropathy in RENAALand IDNT. These data suggest a protective effect of bil-irubin against progression of nephropathy in type 2 di-abetes. The well-established role of bilirubin as anantioxidant is a potential explanation for the findings.
The incidence of type 2 diabetes and its complications areincreasing worldwide. One of the major complications oftype 2 diabetes is diabetic nephropathy (DN). Nephrop-athy develops in ;20–40% of patients with diabetes andis the single leading cause of end-stage renal disease(ESRD) around the world (1).
Bilirubin is a product of heme catabolism and is knownto be a potent endogenous antioxidant (2). As such,bilirubin has consistently been associated with protectionagainst the development of cardiovascular disease (CVD)(3,4). A study in rodents suggested that bilirubin is alsoprotective against progression of DN (5). This notion issupported by several cross-sectional studies in humansdemonstrating that low levels of bilirubin are associatedwith DN (6–8).
To our knowledge, there are no prospective studiesto date that investigated whether bilirubin levels areassociated with progression of DN toward ESRD. There-fore, our primary objective was to prospectively investi-gate the association of bilirubin with progression ofnephropathy in patients with type 2 diabetes. To thisend, we performed a historical prospective study in theReduction of Endpoints in NIDDM with the AngiotensinII Antagonist Losartan (RENAAL) trial (9,10). Subse-quently, independent replication was sought in the Irbe-sartan Diabetic Nephropathy Trial (IDNT) (11,12).
1Department of Internal Medicine, Division of Nephrology, University of Gronin-gen, University Medical Center Groningen, Groningen, the Netherlands2Baker IDI Heart & Diabetes Institute, Melbourne, Victoria, Australia3Division of Nephrology, Vanderbilt University, Nashville, TN4Department of Clinical Pharmacy and Pharmacology, University of Groningen,University Medical Center Groningen, Groningen, the Netherlands
Corresponding author: Dick de Zeeuw, [email protected].
Received 24 October 2013 and accepted 24 March 2014.
This article contains Supplementary Data online at http://diabetes.diabetesjournals.org/lookup/suppl/doi:10.2337/db13-1652/-/DC1.
© 2014 by the American Diabetes Association. Readers may use this article aslong as the work is properly cited, the use is educational and not for profit, andthe work is not altered.
See accompanying article, p. 2613.
Diabetes Volume 63, August 2014 2845
COMPLIC
ATIO
NS

In the RENAAL and IDNT studies, patients were treatedwith an angiotensin receptor blocker (ARB) (losartan inRENAAL and irbesartan in IDNT). Several studies haveshown that ARBs reduce hemoglobin levels (13–15). Be-cause bilirubin is a product of heme catabolism, the use ofARBs could consequently reduce bilirubin levels. There-fore, our secondary aim was to investigate the effect ofARB treatment on serum concentrations of hemoglobinand bilirubin.
RESEARCH DESIGN AND METHODS
Study Design and PopulationThe current study was conducted in patients with type 2diabetes and nephropathy participating in the RENAALand IDNT studies. The design, rationale, and studyoutcomes for these trials have been published elsewhere(9–12).
Both trials investigated the efficacy of an ARB (losartanin RENAAL and irbesartan in IDNT) on renal outcomes inpatients with type 2 diabetes, nephropathy, and pro-teinuria. Inclusion criteria for both trials were similar,with minor differences in details. Patients with type 2diabetes, hypertension, and nephropathy aged 30–70years were eligible for inclusion in both trials. Serum cre-atinine levels ranged from 1.0 to 3.0 mg/dL. All subjectswere required to have proteinuria defined as a urinaryalbumin-to-creatinine ratio (ACR) $300 mg/g or a 24-hurinary protein excretion .500 mg/day in RENAAL and$900 mg/day in IDNT. Major exclusion criteria for par-ticipation in both trials were type 1 diabetes, nondiabeticrenal disease, and screening values of liver enzymes (ala-nine aminotransferase [ALT], aspartate aminotransferase[AST]) or total bilirubin .1.5 times the upper limit ofnormal (ULN). The inclusion and exclusion criteria ofthe RENAAL and IDNT studies are summarized in Sup-plementary Table 1 [adapted from Packham et al. (16)].Subjects with missing data for baseline measurements oftotal bilirubin were excluded from the analyses (RENAALn = 15 [1.0%], IDNT n = 8 [0.5%]).
Measurements and Clinical End PointsLaboratory and physical assessment data were collectedevery 6 months during follow-up for subjects participat-ing in RENAAL and IDNT and included blood pressuremeasurements, glycated hemoglobin (HbA1c), lipid profile,hemoglobin, total bilirubin, serum albumin, ALT, AST,and serum creatinine. For both trials, all biochemicalmeasurements were conducted in a central laboratoryaccording to standardized conditions. Estimated glomer-ular filtration rate (eGFR) was calculated using the Mod-ification of Diet in Renal Disease (MDRD) equation (17).The primary end point for the current study was thecomposite of a confirmed doubling of serum creatinine(DSCR) level or ESRD (defined as the need for long-term dialysis or renal transplantation). All end pointswere adjudicated by an independent committee using rig-orous guidelines and definitions.
Statistical AnalysesStatistical analyses were performed using SPSS version18.0 for Windows (IBM Corporation, Chicago, IL) andStata 11 (StataCorp LP, College Station, TX) software.Results are presented as mean 6 SD for variables witha normal distribution and as median (interquartile range)for variables with a nonnormal distribution. Nominal dataare presented as the total number of patients with per-centages. A two-sided P , 0.05 was considered statisti-cally significant.
To assess which baseline variables were associated withbaseline total bilirubin, the study populations were sub-divided into tertiles of baseline total bilirubin concentra-tion, and patient characteristics were presented accordingly(Table 1). P values for trend across tertiles of baseline totalbilirubin were assessed using linear regression analyses.Variables with a skewed distribution were log-transformedto fulfill criteria for linear regression analyses. Multivari-able linear regression analyses were used to investigatewhich clinical parameters at baseline were independentlyassociated with bilirubin at baseline (Table 2).
The course of clinical parameters over time are pre-sented according to tertiles of baseline bilirubin levels(Supplementary Table 2). We investigated whether thechange in total bilirubin concentration over time differedamong tertiles in subjects with complete bilirubin mea-surements at baseline and 12, 24, and 36 months usingone-way ANOVA (Supplementary Table 3).
To investigate the association of total bilirubin withprogression of nephropathy, we used Cox proportionalhazard regression analyses with time-varying covariates,which takes the change of clinical parameters over timeinto account (Table 3). Logarithmic transformation (base 2)of bilirubin levels was applied to present the hazardratios (HRs) derived from Cox regression analyses perdoubling of bilirubin levels. Multivariable analyses wereconducted using a Cox regression model, including the po-tential confounding factors of age, sex, baseline eGFR,baseline log ACR, race, smoking at baseline, history ofCVD at baseline, baseline BMI, total cholesterol, diastolicblood pressure, HbA1c, treatment assignment, and log AST.
In sensitivity analyses, we repeated the Cox regres-sion analyses in the subgroups receiving an ARB (i.e.,losartan in RENAAL, irbesartan in IDNT) or placebo inboth trials. In further sensitivity analyses, we investi-gated whether the change in bilirubin values during thecourse of the trials was associated with renal diseaseprogression. To investigate the effect of treatment withan ARB on serum concentrations of hemoglobin andtotal bilirubin, we used the independent sample t test tocompare these concentrations between treatment groupsin both trials (Fig. 2).
RESULTS
Patient CharacteristicsIn RENAAL, bilirubin concentrations were available for1,498 (99.0%) patients. Mean baseline bilirubin level was
2846 Bilirubin and Diabetic Nephropathy Diabetes Volume 63, August 2014

Tab
le1—
Bas
elinepatient
charac
teristicsoftheRENAALan
dID
NTstud
ypopulations
prese
nted
astertile
sofbilirubin
conc
entrations
RENAAL
IDNT
Allsu
bjects
Tertile
1Te
rtile
2Te
rtile
3Pva
lue
Allsu
bjects
Tertile
1Te
rtile
2Te
rtile
3Pva
lue
No.
subjects
1,49
837
477
634
8—
1,70
758
841
370
6—
Totalb
ilirubin
(mg/dL)
0.57
60.19
0.1–
0.4
0.5–
0.6
0.7–
2.1
—0.54
60.21
0.1–
0.4
0.5
0.6–
2.0
—
Age
(yea
rs)
60.1
67.4
57.5
67.7
60.8
67.2
61.4
67.0
,0.00
158
.96
7.8
57.4
68.4
58.7
67.7
60.3
67.0
,0.00
1
Malese
x94
6(63.2)
187(50.0)
490(63.1)
269(77.3)
,0.00
11,13
4(66.4)
297(50.5)
270(65.4)
567(80.3)
,0.00
1
History
ofCVD
443(29.6)
88(23.5)
249(32.1)
106(30.5)
0.04
481(28.2)
168(28.6)
101(24.5)
212(30.0)
0.5
Rac
e0.06
,0.00
1White
723(48.3)
119(31.8)
416(53.6)
188(54.0)
1,23
8(72.5)
323(54.9)
323(78.2)
592(83.9)
Black
228(15.2)
92(24.6)
112(14.4)
24(6.9)
224(13.1)
138(23.5)
39(9.4)
47(6.7)
Hispa
nic
276(18.4)
109(29.1)
113(14.6)
54(15.5)
83(4.9)
45(7.7)
18(4.4)
20(2.8)
Asian
252(16.8)
49(13.1)
125(16.1)
78(22.4)
85(5.0)
55(9.4)
13(3.1)
17(2.4)
Other
19(1.3)
5(1.3)
10(1.3)
4(1.1)
77(4.5)
27(4.6)
20(4.8)
30(4.2)
Smok
ingstatus
Smok
er27
0(18.0)
80(21.4)
134(17.3)
56(16.1)
0.06
299(17.5)
119(20.2)
76(18.4)
104(14.7)
0.00
9
Bod
yco
mpos
ition
BMI(kg/m
2)
29.7
66.3
30.2
67.1
29.9
66.1
28.7
65.6
0.00
230
.86
5.8
32.2
66.8
30.3
65.2
30.0
64.9
,0.00
1
Blood
pressure
Sys
tolic
(mmHg)
1536
1915
26
1915
36
2015
16
190.5
1596
2016
06
2115
96
1915
96
190.3
Diastolic
(mmHg)
826
1082
610
826
1083
611
0.1
876
1186
611
876
1088
611
,0.00
1
Use
ofACEi/A
RB
769(51.3)
192(51.3)
415(53.5)
162(46.6)
0.2
797(46.7)
306(52.0)
175(42.4)
316(44.8)
0.01
Use
ofdiuretic
s87
0(58.1)
251(67.1)
440(56.7)
179(51.4)
,0.00
180
2(47.0)
320(54.4)
198(47.9)
284(40.2)
,0.00
1
Gluco
seho
meo
stas
is
Diabetes
duration$5ye
ars
1,35
1(90.2)
342(91.4)
705(90.9)
304(87.4)
0.05
1,53
3(89.8)
537(91.3)
374(90.6)
622(88.1)
0.06
HbA
1c(%
)8.46
1.6
8.86
1.6
8.56
1.6
8.26
1.6
,0.00
18.16
1.7
8.16
1.8
8.36
1.8
8.16
1.7
0.9
HbA
1c(m
mol/m
ol)
696
1873
618
696
1866
618
,0.00
165
619
656
2067
620
656
190.9
Use
ofinsu
lin90
1(60.1)
252(67.4)
471(67.4)
178(51.1)
,0.00
198
5(57.7)
367(62.4)
232(56.2)
386(54.7)
0.00
6
Laboratorymea
suremen
tsHem
oglobin
(g/dL)
12.5
61.8
11.6
61.5
12.5
61.7
13.5
61.8
,0.00
112
.96
1.9
12.0
61.8
12.9
61.8
13.8
61.7
,0.00
1Serum
album
in(g/dL)
3.86
0.4
3.56
0.4
3.86
0.4
4.06
0.3
,0.00
13.86
0.4
3.66
0.5
3.96
0.4
4.06
0.3
,0.00
1
Lipids
Totalc
holesterol
(mg/dL)
2286
5624
46
6122
66
5421
66
48,0.00
122
86
5823
96
6422
96
5821
86
51,0.00
1HDLch
oles
terol(mg/dL)
456
1548
617
446
1444
614
0.00
142
614
436
1544
615
416
130.1
LDLch
oles
terol(mg/dL)
1426
4615
26
5314
16
4413
46
39,0.00
114
26
4615
06
5014
46
4813
66
41,0.00
1Triglyce
rides
(mg/dL)
172(122
–24
5)18
1(133
–27
0)17
2(120
–24
4)16
0(111
–22
8),0.00
117
7(119
–27
0)18
5(127
–27
6)17
8(116
–27
0)16
9(115
–26
6)0.06
Live
rfunc
tion
ALT
(units/L)
15(12–
21)
14(11–
19)
15(12–
21)
16(13–
24)
,0.00
118
(13–
25)
17(12–
24)
18(13–
25)
19(14–
26)
0.00
1AST(units/L)
16(13–
20)
15(12–
19)
16(13–
20)
17(14–
23)
,0.00
118
(14–
23)
17(14–
22)
18(14–
23)
18(15–
24)
0.00
1
Con
tinue
don
p.28
48
diabetes.diabetesjournals.org Riphagen and Associates 2847

0.57 6 0.19 mg/dL. Baseline patient characteristicsaccording to tertiles of baseline bilirubin levels are pre-sented in Table 1. Prevalence of male sex, age, history ofCVD, hemoglobin, serum albumin, liver enzymes, andeGFR increased with increasing bilirubin levels, whereasthe prevalence in use of diuretics, use of insulin, BMI,HbA1c, cholesterol, triglycerides, and urinary ACR de-creased with increasing bilirubin levels. Multivariable lin-ear regression analyses showed that baseline bilirubinlevels were independently associated with age, smoking,BMI, HbA1c, hemoglobin, serum albumin, log AST, andtotal cholesterol (Table 2).
In IDNT, bilirubin concentrations were available for1,707 (99.5%) patients. Mean baseline bilirubin level inIDNT was similar to that in RENAAL (0.546 0.21 mg/dL).In general, associations and trends of bilirubin with base-line characteristics were similar to those observed inRENAAL. In multivariable linear regression analyses, allvariables that were independently associated with bilirubinin RENAAL (except AST) were also independently associ-ated with bilirubin in IDNT. Sex, race, diastolic blood pres-sure, duration of diabetes ($5 years), and eGFR were alsosignificantly associated with bilirubin levels in IDNT.
Clinical Parameters Over TimeThe course of clinical parameters over time is shown inSupplementary Table 2. In RENAAL, the change in totalbilirubin concentration only differed among tertiles ofbaseline bilirubin at 12 months. After 24 and 36 months,there were no significant differences in change in bilirubinconcentrations among tertiles of bilirubin (Supplemen-tary Table 3). These results were confirmed in IDNT(Supplementary Table 3).
Progression of NephropathyAfter a mean follow-up period of 3.4 years, 471 (31%)subjects had reached the renal end point of DSCR orESRD in RENAAL. Univariable time-varying Cox regressionanalysis showed that total bilirubin was significantlyassociated with progression of nephropathy in RENAAL(HR 0.54 [95% CI 0.45–0.65], P , 0.001) (Table 3,model 1). These associations remained significant afteradjustment for potential confounding factors, whichwere age, sex, race, eGFR, log ACR, BMI, smoking status,history of CVD, total cholesterol, diastolic blood pres-sure, HbA1c, treatment, and log AST (0.67 [0.55–0.83],P , 0.001). The risk for the renal end point according tototal bilirubin concentrations in the RENAAL trial isshown in Fig. 1A.
In IDNT, 381 (22%) patients reached the renal endpoint after a mean follow-up of 2.6 years. The results oftime-varying Cox proportional hazard regression analyseswere similar to those of RENAAL (HR 0.64 [95% CI 0.55–0.76], P, 0.001) for the final multivariable model (Table 3).The graph indicating the risk for the renal end pointaccording to total bilirubin concentrations in IDNT is sim-ilar to that for RENAAL (Fig. 1B).
Tab
le1—
Continue
d
RENAAL
IDNT
Allsu
bjects
Tertile
1Te
rtile
2Te
rtile
3Pva
lue
Allsu
bjects
Tertile
1Te
rtile
2Te
rtile
3Pva
lue
Ren
alfunc
tion
ACR
(mg/g)
1,24
7(560
–2,55
9)1,91
7(882
–3,73
0)1,19
3(544
–2,33
4)85
5(433
–1,74
9),0.00
11,50
0(780
–2,75
9)2,13
0(1,163
–3,69
2)1,42
9(781
–2,60
9)1,10
6(604
–2,01
5),0.00
1
Serum
crea
tinine(m
g/dL)
1.96
0.5
1.96
0.5
1.96
0.5
1.86
0.4
,0.00
11.76
0.6
1.86
0.6
1.76
0.6
1.66
0.5
,0.00
1eG
FR,MDRD
(mL/min/1.73m
2)
39.8
612
.438
.26
12.7
39.7
612
.541
.86
11.5
,0.00
147
.46
17.5
43.3
616
.745
.96
18.2
51.6
617
.0,0.00
1
Dataaren(%
),mea
n6
SD,rang
e,or
med
ian(in
terqua
rtile
rang
e).ACEi,ACEinhibito
r;MDRD,Mod
ifica
tionof
Dietin
Ren
alDisea
se.
2848 Bilirubin and Diabetic Nephropathy Diabetes Volume 63, August 2014
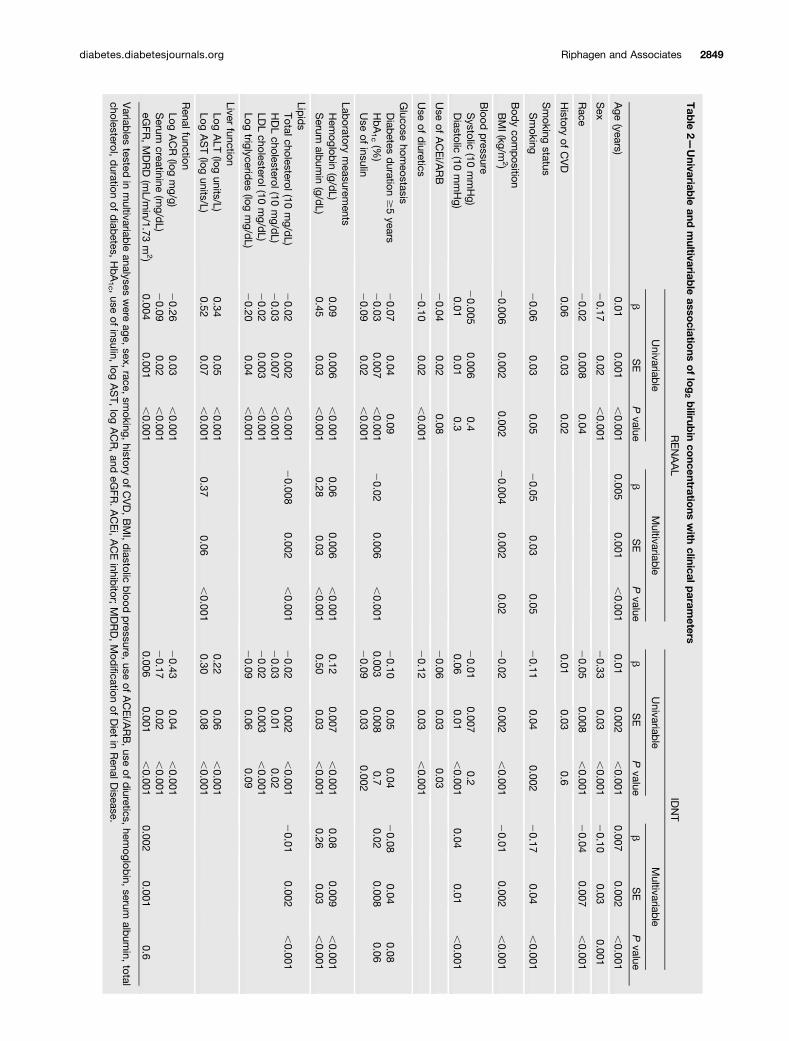
Tab
le2—
Univariab
leand
multivariab
leasso
ciations
oflog2bilirub
inco
ncentrations
with
clinicalparam
eters
RENAAL
IDNT
Univariab
leMultivariable
Univariab
leMultivariab
le
bSE
Pvalue
bSE
Pvalue
bSE
Pvalue
bSE
Pvalue
Age
(years)0.01
0.001,0.001
0.0050.001
,0.001
0.010.002
,0.001
0.0070.002
,0.001
Sex
20.17
0.02,0.001
20.33
0.03,0.001
20.10
0.030.001
Race
20.02
0.0080.04
20.05
0.008,0.001
20.04
0.007,0.001
History
ofCVD
0.060.03
0.020.01
0.030.6
Smoking
statusSmoking
20.06
0.030.05
20.05
0.030.05
20.11
0.040.002
20.17
0.04,0.001
Bod
ycom
position
BMI(kg/m
2)20.006
0.0020.002
20.004
0.0020.02
20.02
0.002,0.001
20.01
0.002,0.001
Blood
pressure
Systolic
(10mmHg)
20.005
0.0060.4
20.01
0.0070.2
Diastolic
(10mmHg)
0.010.01
0.30.06
0.01,0.001
0.040.01
,0.001
Use
ofACEi/A
RB
20.04
0.020.08
20.06
0.030.03
Use
ofdiuretics
20.10
0.02,0.001
20.12
0.03,0.001
Glucose
homeostasis
Diab
etesduration
$5years
20.07
0.040.09
20.10
0.050.04
20.08
0.040.08
HbA1c(%
)20.03
0.007,0.001
20.02
0.006,0.001
0.0030.008
0.70.02
0.0080.06
Use
ofinsulin
20.09
0.02,0.001
20.09
0.030.002
Laboratory
measurem
entsHem
oglobin
(g/dL)
0.090.006
,0.001
0.060.006
,0.001
0.120.007
,0.001
0.080.009
,0.001
Serum
album
in(g/d
L)0.45
0.03,0.001
0.280.03
,0.001
0.500.03
,0.001
0.260.03
,0.001
Lipids
Totalcholesterol(10mg/d
L)20.02
0.002,0.001
20.008
0.002,0.001
20.02
0.002,0.001
20.01
0.002,0.001
HDLcholesterol(10
mg/d
L)20.03
0.007,0.001
20.03
0.010.02
LDLcholesterol(10
mg/d
L)20.02
0.003,0.001
20.02
0.003,0.001
Logtriglycerid
es(log
mg/d
L)20.20
0.04,0.001
20.09
0.060.09
Liverfunction
LogALT
(logunits/L)
0.340.05
,0.001
0.220.06
,0.001
LogAST(log
units/L)0.52
0.07,0.001
0.370.06
,0.001
0.300.08
,0.001
RenalfunctionLog
ACR
(logmg/g)
20.26
0.03,0.001
20.43
0.04,0.001
Serum
creatinine(m
g/dL)
20.09
0.02,0.001
20.17
0.02,0.001
eGFR
,MDRD
(mL/m
in/1.73m
2)0.004
0.001,0.001
0.0060.001
,0.001
0.0020.001
0.6
Variab
lestested
inmultivariab
leanalyses
were
age,sex,
race,sm
oking,history
ofCVD,BMI,diastolic
blood
pressure,use
ofACEi/A
RB,use
ofdiuretics,
hemoglob
in,serum
album
in,total
cholesterol,duration
ofdiab
etes,HbA1c ,use
ofinsulin,
logAST,
logACR,and
eGFR
.ACEi,ACEinhib
itor;MDRD,Mod
ificationof
Diet
inRenalD
isease.
diabetes.diabetesjournals.org Riphagen and Associates 2849

In sensitivity analyses, we investigated whether totalbilirubin was associated with progression of nephropathyirrespective of ARB or placebo assignment. In RENAAL,total bilirubin was significantly and inversely associatedwith progression of nephropathy for subjects receivinglosartan (HR 0.66 [95% CI 0.48–0.89], P = 0.008) andthose receiving placebo (0.70 [0.52–0.94], P = 0.02). Theseresults were confirmed in IDNT for subjects receivingirbesartan (0.59 [0.43–0.81], P = 0.001) and those receiv-ing placebo (0.61 [0.46–0.80], P , 0.001).
In further sensitivity analyses, the change in totalbilirubin during the course of the trial was not associatedwith the renal end point (HR 1.07 [95% CI 0.97–1.19], P =0.2, per 0.1 mg/dL), whereas total bilirubin remained sig-nificantly associated with the renal end point in RENAAL(0.59 [0.44–0.79], P , 0.001). These results were con-firmed in IDNT for change in total bilirubin (1.05[0.97–1.13], P = 0.2) and for total bilirubin (0.62 [0.52–0.74], P , 0.001). The results remained essentially un-changed when stratified for treatment.
ARB Treatment EffectBecause treatment with ARBs influence serum concen-trations of hemoglobin (13) and could consequently affectbilirubin levels, we investigated the effect of treatmentwith an ARB (losartan in RENAAL and irbesartan inIDNT) on serum concentrations of hemoglobin and bili-rubin. Hemoglobin and bilirubin concentrations over timein the RENAAL trial are shown in Fig. 2A and B. Hemo-globin levels slowly decreased over time in the placebogroup, whereas an initial decrease followed by a stabiliza-tion of hemoglobin levels was seen in losartan-treatedpatients (Fig. 2A). After 48 months of treatment, hemo-globin levels were no longer significantly different be-tween treatment groups (Fig. 2A).
Bilirubin levels were slightly, but not significantly,lower in the losartan group than in the placebo group(Fig. 2B). Despite the initial fall in hemoglobin levels,there was no initial fall in bilirubin levels in the losartangroup. Bilirubin values decreased over time in both treat-ment groups, and no significant differences in bilirubin
Table 3—Associations of log2 bilirubin concentrations with the composite renal end point of DSCR or ESRD in univariable(model 1) and multivariable models adjusted for potential confounding factors
RENAAL IDNT RENAAL and IDNT
Model HR (95% CI) P value HR (95% CI) P value HR (95% CI) P value
1 0.54 (0.45–0.65) ,0.001 0.48 (0.43–0.55) ,0.001 0.50 (0.45–0.55) ,0.001
2 0.59 (0.49–0.72) ,0.001 0.51 (0.45–0.58) ,0.001 0.53 (0.48–0.59) ,0.001
3 0.60 (0.50–0.73) ,0.001 0.55 (0.48–0.63) ,0.001 0.55 (0.49–0.61) ,0.001
4 0.73 (0.60–0.89) 0.002 0.64 (0.55–0.74) ,0.001 0.65 (0.58–0.73) ,0.001
5 0.67 (0.55–0.83) ,0.001 0.64 (0.55–0.76) ,0.001 0.67 (0.59–0.76) ,0.001
Model 1: crude. Model 2: adjusted for age and sex. Model 3: adjusted for age, sex, and baseline eGFR. Model 4: adjusted for age, sex,baseline eGFR, and baseline log ACR. Model 5: adjusted for age, sex, baseline eGFR, baseline log ACR, race, smoking, history of CVD,baseline BMI, total cholesterol, diastolic blood pressure, HbA1c, treatment assignment, and log AST.
Figure 1—Histogram of baseline bilirubin concentrations in the RENAAL (A) and IDNT (B) studies. The line in the graph represents the riskfor DSCR or ESRD. The gray area represents the 95% CI of the HR.
2850 Bilirubin and Diabetic Nephropathy Diabetes Volume 63, August 2014

concentrations were observed between treatment groupsafter 12, 36, and 48 months.
Hemoglobin and bilirubin values of subjects usingplacebo and irbesartan in IDNT are shown in Fig. 2C andD. In general, the pattern of changes in these markersover time in IDNT was similar to the RENAAL trial.Although hemoglobin levels significantly decreased afterinitiation of treatment with irbesartan (Fig. 2C), as inRENAAL, no significant differences in bilirubin con-centrations were observed between treatment groups(Fig. 2D).
DISCUSSION
In this historical prospective analysis of the RENAAL trial,we found an independent inverse association of bilirubinlevels with progression of nephropathy in patients withtype 2 diabetes. This finding was independently repli-cated in IDNT. Furthermore, we showed that treatmentwith the ARBs losartan or irbesartan did not result ina decrease in bilirubin concentrations, despite an initialdecrease in hemoglobin levels.
One of the major pathophysiologic mechanisms thathas been identified in the development and progressionof DN is oxidative stress, described as increased levels of
reactive oxygen species (18–20). Bilirubin is known to bea potent endogenous antioxidant (2), and a recent studyin rodents found a protective effect of bilirubin againstDN through inhibition of oxidative stress by downregula-tion of renal NADPH oxidase (5).
In humans, several cross-sectional studies have pro-vided additional evidence for a protective effect ofbilirubin on DN. Inoguchi et al. (6) showed a lower preva-lence of vascular complications as well as reduced markersof oxidative stress and inflammation in patients withGilbert syndrome (a congenital hyperbilirubinemia) and di-abetes. Fukui et al. (8) reported a negative correlation ofbilirubin with log ACR and a positive correlation witheGFR. In addition, it was shown that bilirubin levels werehigher in patients without DN than in those with DN (7).However, these studies were cross-sectional in design, pre-cluding investigation of the prospective association of bil-irubin with renal impairment. To our knowledge, thecurrent prospective study is the first to indicate an inverseassociation of bilirubin and progression of nephropathytoward ESRD in type 2 diabetes.
In animal models, antioxidants have been shown to beeffective in treating DN (21,22). In combination with thecurrent human data showing an independent association
Figure 2—Hemoglobin (A, C ) and total bilirubin (B, D) concentrations (mean 6 SEM) of subjects using losartan or placebo in the RENAALtrial or irbesartan or placebo in the IDNT. The insets show a more-detailed versions of each graph. The charts under each graph indicate thenumber of subjects with available measurements.
diabetes.diabetesjournals.org Riphagen and Associates 2851

between bilirubin and renal outcome, we speculate thattreatments intended to slightly raise bilirubin levels mighthave a beneficial effect on progression of nephropathy inpatients with type 2 diabetes and low bilirubin levels.
A moderate increase in bilirubin levels could be at-tained through induction of heme oxygenase-1 (HO-1),the enzyme that catalyzes the rate-limiting step in hemedegradation. HO-1 splits heme into carbon monoxide(CO) and biliverdin, which is subsequently reduced tobilirubin (2,23). The HO-1 system and heme degradationproducts CO, biliverdin, and bilirubin have repeatedlybeen shown to have renoprotective properties (2,23).Therefore, the renoprotective effects of bilirubin in thisstudy are possibly, and at least partly, mediated by in-duction of HO-1 and by-products of heme degradation(i.e., CO, biliverdin). A study in rats showed that induc-tion of HO-1 reduces renal oxidative stress and protectsagainst diabetes-related renal injury (24). HO-1 is a highlyinducible enzyme that can be induced by many drugs rou-tinely used in clinical medicine (i.e., nonsteroidal anti-inflammatory drugs [NSAIDs], peroxisome proliferator–activated receptor a agonists) (4). However, given theadverse effects of NSAIDs, long-term use of NSAIDs isnot recommended in patients with advanced renal func-tion impairment. Natural HO-1 inducers include curcumaand polyphenols (i.e., resveratrol) (4,25). Partial inhibi-tion of conjugation of bilirubin by uridine diphosphate-glucuronyltransferase, an enzyme encoded by the UGT1A1gene, reduces bilirubin excretion and is known to result inmild increases in bilirubin concentrations (4,23,26). Phar-maceuticals capable of a partial inhibition of UGT1A1 areprobenecid and atazanavir (4).
A number of studies have reported that the use of ACEinhibitors and ARBs decrease hemoglobin levels (13–15),which can be enhanced by the use of diuretics (14). Becausebilirubin is a product of heme catabolism, changes in he-moglobin levels could subsequently influence bilirubin con-centrations. Although the use of losartan and irbesartanslightly, but significantly, decreased hemoglobin levels com-pared with placebo, it did not affect bilirubin levels in eithertrial. Several studies reported that the use of ACE inhibitorsand ARBs reduce erythropoietin and, consequently, hemo-globin levels by blocking the effects of angiotensin II onerythropoiesis (27,28). Because the enzymatic degradationof hemoglobin by HO-1 is known to be the rate-limitingstep in the formation of bilirubin (23,29) and not in thesynthesis of hemoglobin, it is conceivable that smallchanges in the synthesis of hemoglobin do not affect theformation and levels of bilirubin.
This study has several limitations. First, patients withliver enzymes (ALT, AST) and bilirubin levels .1.5 timesthe ULN were excluded from participation in both trials,which resulted in a relatively narrow range of bilirubinconcentrations (i.e., 0.1–2.1 mg/dL, with a mean valueof 0.57 mg/dL in RENAAL and 0.54 mg/dL in IDNT). Inearlier cross-sectional studies on the association of biliru-bin with DN, bilirubin levels were higher, with values of
1.4 (1.3–1.6) mg/dL in subjects with Gilbert syndrome inthe study by Inoguchi et al. (6), and 0.71 6 0.21 mg/dL insubjects with type 2 diabetes in the study by Fukui et al.(8). In a prospective study on development and progres-sion of albuminuria in patients with type 2 diabetes byMashitani et al. (30), mean bilirubin levels were 0.63 60.28 mg/dL. Within the relatively small range of bilirubinlevels in the current study, we could not identify a non-linear component in the association of bilirubin with therenal end point. A larger range of bilirubin concentrationsin future studies might allow for identification of a cutoffvalue of bilirubin above which the association with pro-gression of renal function might flatten, which could helpto identify an optimal target concentration for bilirubin inintervention trials. Second, in both RENAAL and IDNT,only total bilirubin was measured. Direct (conjugated) bil-irubin was not measured separately because serum biliru-bin comprises .95% of indirect (unconjugated) bilirubin(26), and subjects with total bilirubin levels .1.5 timesthe ULN were excluded from participation in both trials.Therefore, examining differences between unconjugatedand conjugated bilirubin levels was not possible. Further-more, given the observational nature of this study and theinability to focus on the HO-1 system and its by-productsin more detail, it is impossible to draw a definitive conclu-sion about the causality of bilirubin and progression ofDN. Mendelian randomization has been proposed asa method that enables estimation of causal relationshipsin observational studies (31,32). This method uses geno-type to estimate causal relationships between a gene prod-uct and physiological outcomes (32). Because there isa strong relation between UGT1A1 (genotype) and bilirubinlevels (phenotype) (32), Mendelian randomization can beused to establish a possible causal relation between biliru-bin and DN. The strengths of this study are the largesample size, the large number of renal events, and the in-dependent replication of the current findings in anotherlarge cohort of .1,700 subjects.
In conclusion, the results show an independent inverseassociation of bilirubin levels with progression of nephrop-athy in patients with type 2 diabetes, suggesting thatmeasurement of bilirubin levels may identify patients atrisk for renal disease progression. In addition, the studysuggests a protective effect of bilirubin against progres-sion of DN, thereby potentially implying its role as anantioxidant.
Acknowledgments. The authors thank all the RENAAL and IDNT inves-tigators, support staff, and participating patients.Funding. This research was performed within the framework of the Center forTranslational Molecular Medicine (CTMM) (www.ctmm.nl) project PREDICCt (Pre-diction and Early Diagnosis of Diabetes and Diabetes-related CardiovascularComplications) (grant 01C-104) and supported by the Dutch Heart Foundation,Dutch Diabetes Research Foundation, and Dutch Kidney Foundation. The workleading to this article has received funding from the Seventh Framework Pro-gramme of the European Community under grant agreement HEALTH-F2-2009-241544 (Syskid). I.J.R. and S.J.L.B. received support from The Netherlands Heart
2852 Bilirubin and Diabetic Nephropathy Diabetes Volume 63, August 2014

Foundation, Dutch Diabetes Research Foundation, and Dutch Kidney Foundation,together participating in the framework of the CTMM project PREDICCt. H.J.L.H. issupported by a Veni grant from The Netherlands Scientific Organisation.Duality of Interest. The RENAAL trial was funded by Merck & Co. TheIDNT trial was sponsored by the Bristol-Myers Squibb Institute for Medical Re-search and Sanofi-Synthelabo. M.E.C. and D.d.Z. have received financial supportfrom Merck for their participation on the RENAAL Steering Committee. No otherpotential conflicts of interest relevant to this article were reported.Author Contributions. I.J.R., S.J.L.B., and H.J.L.B. contributed to thedata analysis and interpretation, writing of the manuscript, and approval of thefinal manuscript. P.E.D., G.N., M.E.C., J.B.L., and D.d.Z. contributed to the criticalrevision of the manuscript and approval of the final manuscript. I.J.R. and H.J.L.H.are the guarantors of this work and, as such, had full access to all the data in thestudy and take responsibility for the integrity of the data and the accuracy of thedata analysis.Prior Presentation. Parts of this study were presented in abstract form atthe American Society of Nephrology Kidney Week 2012, San Diego, CA, 30October–4 November 2012.
References1. American Diabetes Association. Standards of medical care in diabetes—2012. Diabetes Care 2012;35(Suppl. 1):S11–S632. Adin CA, Croker BP, Agarwal A. Protective effects of exogenous bilirubin onischemia-reperfusion injury in the isolated, perfused rat kidney. Am J PhysiolRenal Physiol 2005;288:F778–F7843. Lin JP, Vitek L, Schwertner HA. Serum bilirubin and genes controlling bil-irubin concentrations as biomarkers for cardiovascular disease. Clin Chem 2010;56:1535–15434. Vítek L. The role of bilirubin in diabetes, metabolic syndrome, and car-diovascular diseases. Front Pharmacol 2012;3:555. Fujii M, Inoguchi T, Sasaki S, et al. Bilirubin and biliverdin protect rodentsagainst diabetic nephropathy by downregulating NAD(P)H oxidase. Kidney Int2010;78:905–9196. Inoguchi T, Sasaki S, Kobayashi K, Takayanagi R, Yamada T. Relationshipbetween Gilbert syndrome and prevalence of vascular complications in patientswith diabetes. JAMA 2007;298:1398–14007. Zelle DM, Deetman N, Alkhalaf A, Navis G, Bakker SJ. Support for a pro-tective effect of bilirubin on diabetic nephropathy in humans. Kidney Int 2011;79:686–6878. Fukui M, Tanaka M, Shiraishi E, et al. Relationship between serum bili-rubin and albuminuria in patients with type 2 diabetes. Kidney Int 2008;74:1197–12019. Brenner BM, Cooper ME, de Zeeuw D, et al.; RENAAL Study Investigators. Thelosartan renal protection study—rationale, study design and baseline character-istics of RENAAL (Reduction of Endpoints in NIDDM with the Angiotensin II An-tagonist Losartan). J Renin Angiotensin Aldosterone Syst 2000;1:328–33510. Brenner BM, Cooper ME, de Zeeuw D, et al.; RENAAL Study Investigators.Effects of losartan on renal and cardiovascular outcomes in patients with type 2diabetes and nephropathy. N Engl J Med 2001;345:861–86911. Rodby RA, Rohde RD, Clarke WR, et al.; Collaborative Study Group. TheIrbesartan type II diabetic nephropathy trial: study design and baseline patientcharacteristics. Nephrol Dial Transplant 2000;15:487–49712. Lewis EJ, Hunsicker LG, Clarke WR, et al.; Collaborative Study Group.Renoprotective effect of the angiotensin-receptor antagonist irbesartan in pa-tients with nephropathy due to type 2 diabetes. N Engl J Med 2001;345:851–860
13. Mohanram A, Zhang Z, Shahinfar S, Lyle PA, Toto RD. The effect of losartanon hemoglobin concentration and renal outcome in diabetic nephropathy oftype 2 diabetes. Kidney Int 2008;73:630–63614. Slagman MC, Sinkeler SJ, Hemmelder MH, et al. Erythropoietin is reduced bycombination of diuretic therapy and RAAS blockade in proteinuric renal patientswith preserved renal function. Nephrol Dial Transplant 2010;25:3256–326015. Robles NR, Angulo E, Grois J, Barquero A. Comparative effects of fosinopril andirbesartan on hematopoiesis in essential hypertensives. Ren Fail 2004;26:399–40416. Packham DK, Alves TP, Dwyer JP, et al. Relative incidence of ESRD versuscardiovascular mortality in proteinuric type 2 diabetes and nephropathy: resultsfrom the DIAMETRIC (Diabetes Mellitus Treatment for Renal Insufficiency Con-sortium) database. Am J Kidney Dis 2012;59:75–8317. Levey AS, Bosch JP, Lewis JB, Greene T, Rogers N, Roth D; Modification ofDiet in Renal Disease Study Group. A more accurate method to estimate glo-merular filtration rate from serum creatinine: a new prediction equation. AnnIntern Med 1999;130:461–47018. Baynes JW. Role of oxidative stress in development of complications indiabetes. Diabetes 1991;40:405–41219. Giugliano D, Ceriello A, Paolisso G. Oxidative stress and diabetic vascularcomplications. Diabetes Care 1996;19:257–26720. Giacco F, Brownlee M. Oxidative stress and diabetic complications. Circ Res2010;107:1058–107021. Stanton RC. Oxidative stress and diabetic kidney disease. Curr Diab Rep2011;11:330–33622. Koya D, Hayashi K, Kitada M, Kashiwagi A, Kikkawa R, Haneda M. Effects ofantioxidants in diabetes-induced oxidative stress in the glomeruli of diabetic rats.J Am Soc Nephrol 2003;14(Suppl. 3):S250–S25323. Abraham NG, Cao J, Sacerdoti D, Li X, Drummond G. Heme oxygenase: thekey to renal function regulation. Am J Physiol Renal Physiol 2009;297:F1137–F115224. Elmarakby AA, Faulkner J, Baban B, Sullivan JC. Induction of hemeox-ygenase-1 reduces renal oxidative stress and inflammation in diabetic sponta-neously hypertensive rats. Int J Hypertens 2012;2012:95723525. Barbagallo I, Galvano F, Frigiola A, et al. Potential therapeutic effects ofnatural heme oxygenase-1 inducers in cardiovascular diseases. Antioxid RedoxSignal 2013;18:507–52126. Fevery J. Bilirubin in clinical practice: a review. Liver Int 2008;28:592–60527. Mrug M, Stopka T, Julian BA, Prchal JF, Prchal JT. Angiotensin II stimulatesproliferation of normal early erythroid progenitors. J Clin Invest 1997;100:2310–231428. Freudenthaler SM, Schreeb K, Körner T, Gleiter CH. Angiotensin II increaseserythropoietin production in healthy human volunteers. Eur J Clin Invest 1999;29:816–82329. Sassa S, Kappas A, Bernstein SE, Alvares AP. Heme biosynthesis and drugmetabolism in mice with hereditary hemolytic anemia. Heme oxygenase in-duction as an adaptive response for maintaining cytochrome P-450 in chronichemolysis. J Biol Chem 1979;254:729–73530. Mashitani T, Hayashino Y, Okamura S, Tsujii S, Ishii H. Correlations betweenserum bilirubin levels and diabetic nephropathy progression among Japanesetype 2 diabetic patients: a prospective cohort study (Diabetes Distress and CareRegistry at Tenri [DDCRT 5]). Diabetes Care 2014;37:252–25831. Verduijn M, Siegerink B, Jager KJ, Zoccali C, Dekker FW. Mendelian ran-domization: use of genetics to enable causal inference in observational studies.Nephrol Dial Transplant 2010;25:1394–139832. McArdle PF, Whitcomb BW, Tanner K, Mitchell BD, Shuldiner AR, Parsa A.Association between bilirubin and cardiovascular disease risk factors: usingmendelian randomization to assess causal inference. BMC Cardiovasc Disord2012;12:16
diabetes.diabetesjournals.org Riphagen and Associates 2853