Bile Acid Profiling and Quantification in Biofluids using ... Acid... · Ultra-Performance Liquid...
14
This document is confidential and is proprietary to the American Chemical Society and its authors. Do not copy or disclose without written permission. If you have received this item in error, notify the sender and delete all copies. Bile Acid Profiling and Quantification in Biofluids using Ultra-Performance Liquid Chromatography Tandem Mass Spectrometry Journal: Analytical Chemistry Manuscript ID ac-2015-015564.R3 Manuscript Type: Article Date Submitted by the Author: n/a Complete List of Authors: Sarafian, Magali; Imperial College of London, Surgery and Cancer Lewis, Matthew; Imperial College of London, Surgery and Cancer Pechlivanis, Alexandros; Imperial College of London, Surgery and Cancer Ralphs, Simon; Imperial College of London, Hepatology Mc Phail, Mark; Imperial College of London, Hepatology Patel, Vishal; Institute of Liver Sciences, King's College Hospital, Division of Transplantation Immunology & Mucosal Biology Dumas, Marc-Emmanuel; Imperial College of London, Surgery and Cancer Holmes, Elaine; Imperial College, Surgery and Cancer Nicholson, Jeremy; Imperial College of London, Surgery and Cancer ACS Paragon Plus Environment Analytical Chemistry
Transcript of Bile Acid Profiling and Quantification in Biofluids using ... Acid... · Ultra-Performance Liquid...

This document is confidential and is proprietary to the American Chemical Society and its authors. Do not copy or disclose without written permission. If you have received this item in error, notify the sender and delete all copies.
Bile Acid Profiling and Quantification in Biofluids using
Ultra-Performance Liquid Chromatography Tandem Mass Spectrometry
Journal: Analytical Chemistry
Manuscript ID ac-2015-015564.R3
Manuscript Type: Article
Date Submitted by the Author: n/a
Complete List of Authors: Sarafian, Magali; Imperial College of London, Surgery and Cancer Lewis, Matthew; Imperial College of London, Surgery and Cancer Pechlivanis, Alexandros; Imperial College of London, Surgery and Cancer Ralphs, Simon; Imperial College of London, Hepatology Mc Phail, Mark; Imperial College of London, Hepatology Patel, Vishal; Institute of Liver Sciences, King's College Hospital, Division of Transplantation Immunology & Mucosal Biology Dumas, Marc-Emmanuel; Imperial College of London, Surgery and Cancer Holmes, Elaine; Imperial College, Surgery and Cancer Nicholson, Jeremy; Imperial College of London, Surgery and Cancer
ACS Paragon Plus Environment
Analytical Chemistry

Page 1 of 13
Bile Acid Profiling and Quantification in Biofluids using Ultra-Performance Liquid Chromatography Tandem Mass Spec-trometry
Magali H. Sarafian†*
, Matthew R. Lewis†‡*
, Alexandros Pechlivanis†, Simon Ralphs§, Mark JW
McPhail§, Vishal C. Patel
#, Marc-Emmanuel Dumas
†, Elaine Holmes
†, Jeremy K. Nicholson
†**
† Imperial College of London, Division of Computational Systems Medicine, Department of Surgery and Cancer, Sir Alex-
ander Building, Exhibition Road, South Kensington, London SW7 2AZ, UK, ‡ Imperial College of London, MRC NIHR
National Phenome Centre, Department of Surgery and Cancer, IRDB building, Du Cane Road, London W12 0NN, UK,§
Imperial College London, Department of Hepatology, St Mary's Hospital, Paddington, London, # King's College London,
Institute of Liver Sciences, Hospital NHS Foundation Trust, Division of Transplantation Immunology & Mucosal Biology,
MRC Centre for Transplantation
* These authors contributed equally to the work
ABSTRACT: Bile acids are important end products of cholesterol metabolism. While they have been identified as key factors in
lipid emulsification and absorption due to their detergent properties, bile acids have also been shown to act as signaling molecules
and intermediates between the host and the gut microbiota. To further the investigation of bile acid functions in humans, an ad-
vanced platform for high throughput analysis is essential. Herein we describe the development and application of a 15 minute
UPLC procedure for the separation of bile acid species from human biofluid samples requiring minimal sample preparation. High
resolution time of flight mass spectrometry was applied for profiling applications, elucidating rich bile acid profiles in both normal
and disease state plasma. In parallel, a second mode of detection was developed utilizing tandem mass spectrometry for sensitive
and quantitative targeted analysis of 145 bile acid (BA) species including primary, secondary and tertiary bile acids. The latter sys-
tem was validated by testing the linearity (LLOQ 0.25-10 nM and ULOQ 2.5-5 µM), precision (≈6.5%) and accuracy (81.2-
118.9%) on inter- and intra-day analysis achieving good recovery of bile acids (serum/plasma 88% and urine 93%). The UPLC-
MS/MS targeted method was successfully applied to plasma, serum, and urine samples in order to compare the bile acid pool com-
positional difference between pre-prandial and post-prandial states, demonstrating the utility of such analysis on human biofluids.
Bile acids (BA) are major components of bile, synthesized
from cholesterol in the hepatocytes of the liver and play fun-
damental roles in many physiological processes. BAs are well
known as powerful emulsifiers of dietary lipids in the intes-
tine,1,2
antimicrobial agents,3,4
and signaling molecules regu-
lating their own synthesis. BAs are modulated by gut microbi-
ota5-8
and perturbations of the circulating BAs pool have been
shown to contribute to development of liver and intestinal
diseases.9,10
Numerous reports have shown the structural diversity of BAs
from cholesterol catabolism in the liver to microbial transfor-
mations in the intestine.11,12
BAs traverse the boundary be-
tween endogenous metabolism and symbiotic gut bacterial
metabolism, acting as a strong link between humans and their
intestinal microbiota. The pool of BAs is comprised of prima-
ry BAs synthesized in the liver (cholic acid and chenodeoxy-
cholic acid), secondary BAs produced mainly in the gut via
modification of primary BAs, and tertiary BAs which are
formed in both the liver and gut via modification of secondary
BAs, such as sulfation, glucuronidation, glucosidation and N-
acetylglucosaminidation.13
In the intestinal lumen, gut micro-
biota are free to modulate the hepatic output through various
reactions, which include deconjugation and dehydroxylation at
specific sites to form secondary BAs. All BAs are subject to a
cycle of absorption, modification in the liver (further conjuga-
tion), and excretion back to the gastrointestinal tract in a pro-
Page 1 of 13
ACS Paragon Plus Environment
Analytical Chemistry
123456789101112131415161718192021222324252627282930313233343536373839404142434445464748495051525354555657585960

Page 2 of 13
cess known as enterohepatic circulation. BA anabolism and
biotransformation is thus a complex iterative process yielding
a wide range of molecular variants. The abundance of these
BA species also occupies a wide concentration range in hu-
mans with respect to biofluid and physiological / pathological
phenotype (0.1-2000 nM). Given the biological significance of
this diverse pool of molecules, a reliable platform for specific
and sensitive analytical measurement is therefore needed.
However, the chemical diversity of BA,14
the wide concentra-
tion range in abundance in biofluids, and the molecular com-
plexity of the biofluids themselves all pose analytical chal-
lenges for sensitive and selective analysis of BAs.15-17
Within the past decade, LC-MS has been heavily utilized for
the separation and detection of BAs in human and animal
model biofluid samples.9,18-34
The most comprehensive of the-
se methods have a relatively long analytical cycle (> 30
minutes), precluding rapid sample analysis.21,25,28,30,34
On the
other hand, the most rapid methods (< 10 minutes) have lim-
ited BA coverage.19,33
The majority of separations have analyt-
ical times greater than 20 minutes and intermediate level of
BA species coverage (ranging from 11 to 32 species moni-
tored).9,18-34
Very few LC-MS methods report coverage of
tertiary BAs such as sulfate conjugates which have recently
been implicated in the important role of the gut microbiota in
human metabolism.9,32,34-36
The analytical foundation of these methods is reversed-phase
separation utilizing a C18 stationary phase, which is suitable
for retention and separation of the diverse range of hydropho-
bicity present among BAs.37
Furthermore, all methods re-
viewed utilize methanol, acetonitrile, or a combination thereof
as the strong eluent. Yet, the elution of ubiquitous blood ma-
trix components such as phospholipids and triglycerides is
known to benefit from the use of stronger solvents (e.g. 2-
propanol), increased column temperature, or both.38-40
The
methods reviewed therefore risk the accumulation of large
amounts of lipid content on the column and consequential
carry-over of intact lipids and steady bleed of fatty acids dur-
ing continuous sample analysis. Where present, these effects
potentially compromise the BA measurement quality by com-
peting for ionization in the electrospray process. These effects
have been observed within our laboratory when using such
methodology.20
To combat this, a desirable LC separation should be directly
compatible with lipid-rich matrices such as blood and bile,
allowing for the analysis of minimally processed samples
without sacrificing the excellent retention and separation of
BA species provided by a reversed-phase mechanism. The
“dilute-and-shoot” method developed herein features chemical
protein precipitation, removal of proteins by centrifugation,
and direct analysis of the supernatant. This approach elimi-
nates the potential for BA loss due to pre-processing steps
such as SPE and the commonly applied procedure of sample
drying prior to reconstitution with water,20
methanol,9,17
or a
combination thereof. 2,4,26,28,31,35
In this manner, selective en-
richment or exclusion of BA species across a wide range of
hydrophobicity is minimized or circumvented entirely.
The method described herein represents substantial develop-
ment beyond the many methods currently available in the lit-
erature. Using UPLC-MS, it combines a high throughput ana-
lytical cycle (15 minutes) with simple and fast sample prepara-
tion, producing an analytical pipeline capable of supporting
the rapid analysis of hundreds or thousands of samples. These
goals are achieved without sacrificing the coverage of BA
species, which is unprecedented in modern UPLC-MS applica-
tions. Of the 145 BA species detected by targeted tandem
mass spectrometry (MS/MS), 89 were tertiary sulfated BAs
synthesized for the development of this assay. Fifty-seven of
the 145 BAs were quantitatively measured using 16 commer-
cially available stable labeled standards. Their measurements
were validated according to established FDA criteria for accu-
racy and precision on intra/inter day, linearity, carry-over,
stability and matrix effect. Recoveries were evaluated for 16
deuterated BAs spiked in three human biofluids; plasma, se-
rum and urine. In addition, our BA method was validated by
application to routine analysis of pre-prandial vs. post-prandial
human plasma, serum and urine samples.
EXPERIMENTAL SECTION
Materials. Organic solvents (HPLC grade) used for the sul-
fation and precipitation and sodium sulfate were obtained from
Page 2 of 13
ACS Paragon Plus Environment
Analytical Chemistry
123456789101112131415161718192021222324252627282930313233343536373839404142434445464748495051525354555657585960
Page 3 of 13
Sigma Aldrich (Dorset, UK). All mobile phases were prepared
with LC-MS grade solvents, formic acid and ammonium for-
mate from Sigma Aldrich (Dorset, UK). Table S-1 shows the
73 BA standards including 36 non-conjugated, 12 conjugated
with taurine, 9 conjugated with glycine and 16 deuterated in-
ternal standards obtained from Steraloids (Newport, RI) and
Medical Isotopes (Pelham, USA). Table S-2 shows the 88
sulfated BA standards that were synthesized in house includ-
ing 50 non-conjugated, 23 conjugated with taurine, 15 conju-
gated with glycine. Bile acid name abbreviations are provided
at the conclusion of the manuscript, as well as in Tables S-1
and S2.
Collection of human plasma for bile acid profiling and
targeted analysis. Blood plasma was collected into lithium-
heparin for profiling analysis from patients with acute liver
failure and cirrhosis as well as from healthy control subjects
for use in the bile acid profiling application. All samples were
centrifuged at 1,000 g at 4°C for 10 min and aliquoted and
stored at -80°C. Ethical approval for the collection was ob-
tained from the National Research Ethics Service Committee
(Ref 12/LO/1417).
For targeted analysis, blood and urine samples were collected
from healthy volunteers (n=20) in either the pre- or post-
prandial state. Ten volunteers were fasted overnight and blood
and urine samples were collected after 12h (pre-prandial
group). The remaining ten volunteers were given a high-fat
meal and blood and urine samples were collected after 2h
(post-prandial group). Serum and EDTA-plasma were centri-
fuged at 1,000 g and 4°C for 10 min and aliquoted and stored
at -80°C. This study was given ethical permission for conduct
in the NHS by St Mary’s Research Ethics Committee (Ref
09/H0712/82).
Sample preparation for profiling analysis of liver failure
and cirrhosis patients. Samples were received on dry ice and
stored at -80°C until needed for preparation and analysis. All
samples were thawed at 4°C, transferred to 1 mL Eppendorf
96-deepwell plates (Eppendorf, Stevenage UK) and centri-
fuged at maximum speed in an Eppendorf 5810 R equipped
with an A-2-DWP-AT rotor (3486 x g) for 15 minutes. Super-
natant (100 µL) was transferred to 0.5 mL Eppendorf 96-
deepwell plates and 300 µL of ice-cold methanol were added
to each sample.41
All plates were heat sealed (Thermo Fisher
Scientific, Hertfordshire UK), homogenized by vortexing for
15 min at 4°C using an Eppendorf MixMate (1400 RPM), and
incubated at -20°C for 20 min. All samples were again centri-
fuged at 4°C (3486 x g) for 15 minutes prior to decanting of
200 µL of supernatant to Eppendorf microplates for heat seal-
ing and subsequent analysis.
Sample preparation for targeted analysis of human
pre/post-prandial study. The same procedure described for
the preparation of samples for profiling analysis was used for
the targeted analysis samples, except the volume of sample
and therefore ice-cold methanol (1:3 v/v) was reduced to 50
µL and 150 µL respectively. Additionally, 10 µL of deuterated
internal standards (2.1 µM) in H2O/acetonitrile/2-propanol
(10:6:5, v:v:v) were added to the sample prior to the addition
of methanol.
UPLC-MS profiling and MS/MS conditions. BA analysis
was performed by ACQUITY ultra-performance liquid-
chromatography (UPLC) (Waters Ltd, Elstree, UK) coupled to
either a Xevo G2-S Q-ToF mass spectrometer (for profiling
application) or a Xevo TQ-S mass spectrometer (for targeted
detection application) (Waters, Manchester, UK). In both cas-
es, the MS system was equipped with an electrospray ioniza-
tion source operating in negative ion mode (ESI-).
The reversed-phase chromatographic method consisted of a
mobile phase system, adapted from existing lipid profiling
methods,38
paired with a shorter alkyl chain stationary phase
(C8) to facilitate both the separation of BA species and the
elution of lipidic matrix content. For this purpose, an
ACQUITY BEH C8 column (1.7 µm, 100mm x 2.1 mm) was
selected and used at an operating temperature of 60°C. The
mobile phase solvent A consisted of a volumetric preparation
of 100 mL acetonitrile added to 1L ultrapure water, with a
final additive concentration of 1mM ammonium acetate and
pH adjusted to 4.15 with acetic acid. Mobile phase solvent B
consisted of a volumetric preparation of acetonitrile and 2-
propanol in a 1:1 mixture. The gradient separation is described
in Table S-3 in supplemental information. Critically, the high
organic wash step was adjusted in length for the complete
Page 3 of 13
ACS Paragon Plus Environment
Analytical Chemistry
123456789101112131415161718192021222324252627282930313233343536373839404142434445464748495051525354555657585960

Page 4 of 13
elution of observable phospholipids and triglycerides, preclud-
ing their accumulation on column. The injection volume of all
samples was 5 µL. To minimize injector carry-over, 3 wash
cycles of weak (H2O: 2-propanol, 90:10) and strong (2-
propanol) solvent preparations were performed simultaneously
with sample analysis.
Mass spectrometry parameters were as follows: capillary volt-
age was set at 1.5 kV, cone voltage at 60 V, source tempera-
ture 150 °C, desolvation temperature at 600 °C, desolvation
gas flow at 1000 L/h, cone gas flow at 150 L/h. Bile acid spe-
cies yielding characteristic fragments when subjected to colli-
sion-induced dissociation were assayed using multiple reaction
monitoring (MRM), while those that did not fragment were
assayed by selected ion monitoring (SIM). The transitions for
each of the BA standards and deuterated internal standards are
provided in Table S-1 and Table S-2.
Optimization of bile acid sulfation. Lithocholic acid was
selected for the optimization of the sulfation procedure as it is
the most abundant BA in human where sulfation occurs on
hydroxyl C3.42,43
Triplicate samples of lithocholic acid (LCA)
(pure reference material) were prepared for sixteen sulfation
reaction conditions. Sulfur trioxide–pyridine complex was
resuspended in CHCl3 (5 mg/mL) or pyridine and added to 20
µL of BA standards (0.5 mg/mL) with or without sodium sul-
fate. The reaction was stopped after 1h or 24h at RT or 55°C
by evaporation to dryness. All samples were stored at −80°C.
Prior to use in analysis, all samples were solubilized in
H2O/acetonitrile/2-propanol (10:6:5, v:v:v).
Purification of sulfated bile acids. Following synthesis, the
presence of sulfated BAs was confirmed by UPLC-MS/MS
using the chromatographic method described above and multi-
ple reaction monitoring for the [HSO4]- m/z 97 moiety. Each
of the 46 sulfated BAs was purified by individually tailored
chromatographic separations of the reaction mixture using an
Acquity UPLC equipped with an XBridge BEH C8 column
(3.5 µm, 4.6 mm x 150 mm). The solvents used were the same
as described above for the analytical method. The chromato-
graphic separation of each sulfated BA was repeated a number
of times and fractions were repeatedly collected using a Frac-
tion Collector III (Waters, Manchester, UK) in order to amass
sufficient material for subsequent experiments.
Optimization of MRM transitions and SIR. Source parame-
ters such as collision energy and capillary voltage were opti-
mized for each standard by direct infusion combined with the
UPLC flow rate and appropriate solvents (e.g. UPLC-MS/MS
conditions). Source parameters were optimized for glycine,
taurine and sulfate fragmentations. These optimizations were
automatically performed using Waters IntelliStart software
(Waters) and then improved manually. Cone voltage was set to
60V for all BAs as no significant variation in ionization during
the optimization was observed between 10-60V.
Method validation. The BA targeted UPLC-MS/MS method
was validated according to the bioanalytical guidance provid-
ed by the FDA.44 Linearity was evaluated for each BA over a
concentration range of 0.05 nM-5 µM. The limit of detection
(LOD) was determined with a signal to noise (S/N) ratio > 3,
the lower limit of quantification (LLOQ) was determined with
S/N > 5 and <20% of coefficient of variation (CV, standard
deviation divided by the mean), and upper limit of quantifica-
tion (ULOQ) was determined with an intensity level below the
detector saturation which corresponds to the highest standard
concentration in the calibration curve. Matrix effect assess-
ment aimed to detect potential increase or suppression of BAs
ionization due to presence of interfering analytes in samples.
Matrix effect was evaluated by comparing integrated peak area
of deuterated standards spiked in solvent and spiked in plasma
samples for the quality controls; QC1 (10 nM) and QC3 (100
nM). Carry-over was tested by comparison of blanks vs QC1
and QC5 (5µM).
Percent error of accuracy and precision of the assay were as-
sessed with three different concentrations of quality control
(QC) prepared in solvent H2O/acetonitrile/2-propanol (10:6:5,
v:v:v). The QC1 (10 nM), QC2 (50 nM) and QC3 (100 nM)
and QC4 (750nM) precision and accuracy were validated on
intraday (6 replicates analyzed on same day) and interday (one
replicate analyzed on each of six different days).
Percenterrorofaccuracy =calculatedconcentration
actualconcentration× 100
Precision =standarddeviation
mean× 100
Page 4 of 13
ACS Paragon Plus Environment
Analytical Chemistry
123456789101112131415161718192021222324252627282930313233343536373839404142434445464748495051525354555657585960

Page 5 of 13
Recoveries were evaluated for each deuterated internal stand-
ard on six replicates for each biofluid; plasma, serum and
urine. Deuterated internal standards were spiked into samples
before sample preparation (pre-spiked) and after sample prep-
aration (post-spiked). Recoveries were calculated as follows;
area under peaks of pre-spiked-sample divided by the area
under peaks of post-spiked samples at QC1 and QC3.
MS data pre-processing. Waters raw data files were convert-
ed to NetCDF format and data were extracted via XCMS
(v1.24.1) package with R (v2.11) software. MassLynx soft-
ware 4.1 and Target Lynx 4.1 were used respectively for data
acquisition and validation for this high throughput targeted
method for quantification of BAs.
Multivariate Statistical Analysis. Principal components
analysis (PCA) was carried out on the integrated BAs peaks
with Pareto scaling using SIMCA P+ v13 (Umetrics, Umeå,
Sweden). A standard univariate statistic, the Student’s t-test,
was carried out to establish significant variations in BA con-
centrations observed between the pre- vs. post-prandial volun-
teers.
RESULTS AND DISCUSSION
Optimization of chromatographic conditions and profiling
application. A concentration of 1 mM ammonium acetate was
found to be sufficient for producing and maintaining adequate
chromatographic peak shape across all BA species throughout
the experiments presented in this study. Greater concentrations
were observed to reduce the signal response from BA species,
negatively impacting the sensitivity of the assay. Use of a low
mobile phase pH was observed to substantially improve the
retention of glycine conjugated and unconjugated BA species.
The retention of taurine conjugated species was stable across
the pH range achievable in reversed-phase separation (pH 3 to
10). These data relating to mobile phase pH and BA retention
are consistent with previously published results.24
The dura-
tion of the column washing step was determined by observa-
tion of phospholipid and triglyceride species elution (the latter
only visible in positive mode ionization) during repeat injec-
tions of human plasma.
Figure 1. Bile acid profiling of human plasma from a single control sample (a) and pooled liver disease sample (b). Where possible, anno-
tations of observed BAs were made from the 145 bile acid reference standards on hand. Furthermore, BAs with product ions such as glu-
curonides 113-175 m/z (*blue), sulfates 97 m/z (*red) and glycine sulfates 74-97 m/z (*black) were noted as such.
When paired with high resolution ToF MS detection, the sen-
sitivity of the system was found to be sufficient for the detec-
tion of BA species in normal healthy plasma (Figure 1a). A
generalized increase in serum BA species was observed in the
profiling of a pooled plasma sample constructed from 191
subjects with acute liver failure and cirrhosis and used as an
Page 5 of 13
ACS Paragon Plus Environment
Analytical Chemistry
123456789101112131415161718192021222324252627282930313233343536373839404142434445464748495051525354555657585960

Page 6 of 13
example here, demonstrating the utility of the profiling meth-
od for generating pathology specific signatures of bile acid
dysregulation (Figure 1b). Although many of the bile acids
observed in both the healthy control and disease pool sample
analyses can be annotated from the 145 bile acids character-
ized in the targeted method below, additional signals relating
to unidentified bile acids enhance the potential for deriving
specific bile acid fingerprints for liver diseases and hence re-
tain the capacity to contribute to understating the underlying
mechanistic etiologies of these pathologies. In this example,
the wide coverage profiling of primary, secondary and tertiary
bile acids which allow differential mechanisms of intestinal
and hepatic function to be measured on a single chromatogram
could have significant translational potential for patients with
acute liver failure, cirrhosis or cholestatic liver diseases.
Bile acid sulfation and purification. Sulfation of 46 BA ref-
erence standards was conducted to generate sulfated reference
materials for use in method development, facilitating a wide
detection range of BA species. Sulfation efficiency was opti-
mized by evaluation of sixteen reaction conditions selected
from previous work.5,45,46
Figure 2. Optimization of BA sulfation. Sixteen conditions were
tested on the lithocholic acid to evaluate the effect of time (1h vs
24h), temperature (RT room temperature vs 55°C), solvent (chlo-
roform CHCl3 vs pyridine) and sodium sulfate. The error bars
show the standard deviation of the replicates (n=3).
Different reaction conditions were tested such as the choice of
solvent (CHCl3 vs. Pyridine), reaction time (1h vs. 24h), reac-
tion temperature (22°C vs. 55°C) and the presence or absence
of sodium sulfate. Sulfation efficiency was assessed for sulfat-
ed lithocholic acid by integration of the area under the peak
obtained by monitoring the m/z transition 455.2472 � 97. The
results of this procedural optimization are illustrated in Figure
2 and Table S-4. Analysis of sixteen conditions showed that
the optimal sulfation efficiency was obtained with CHCl3,
during 24 hours, at 55°C and with sodium sulfate (Figure S-1).
Purification of the sulfated lithocholic acid was performed by
HPLC separation with fraction collection. UPLC-MS/MS
analysis was implemented to assess the purity of each fraction
collected by characterization of two fragments; the sulfate
moiety [HSO4]- m/z 97 and the non-sulfated form [M-H]
- (ex-
ample m/z for lithocholic acid 375.2904). This workflow was
successfully applied for sulfation and purification of 46 BAs
in total.
The C3 and C6 hydroxy groups are the major sites of naturally
occurring BA sulfation in humans, while the C3 and C7 hy-
droxy sites are predominant in rodents.15,47
Naturally occurring
sulfation on the C12 hydroxy group is still unclear in the liter-
ature.48
The in vitro reaction was capable of sulfation at each
available hydroxy group, producing all applicable variants of
mono-sulfated BAs for purification. The elution order ob-
served in the reversed-phase HPLC separation of mono-
sulfated BAs was used to determine the sulfate position, as
previously reported (C3 < C6 < C7 < C12).49 Poly-sulfated BA
products, however, were not observed. As previous studies
have shown that liver sulfatase does not allow poly sulfation
of BAs, their synthesis was not pursued.50
Targeted MS/MS analysis of 145 bile acids. In total, 145
BAs, including BA sulfates, were targeted in a single UPLC-
MS/MS method operating in a single mode of detection (Fig-
ure 3 and Table S-1 and S-2). The chromatographic method
performed well in retaining all BA species, balancing the
overall analysis time with high performance separation. How-
ever, the separation of unconjugated muricholic acid sterol
isomers, differing only by the OH conformation in α, β, ω, was
not achieved due to the early elution of the species.
Page 6 of 13
ACS Paragon Plus Environment
Analytical Chemistry
123456789101112131415161718192021222324252627282930313233343536373839404142434445464748495051525354555657585960
Page 7 of 13
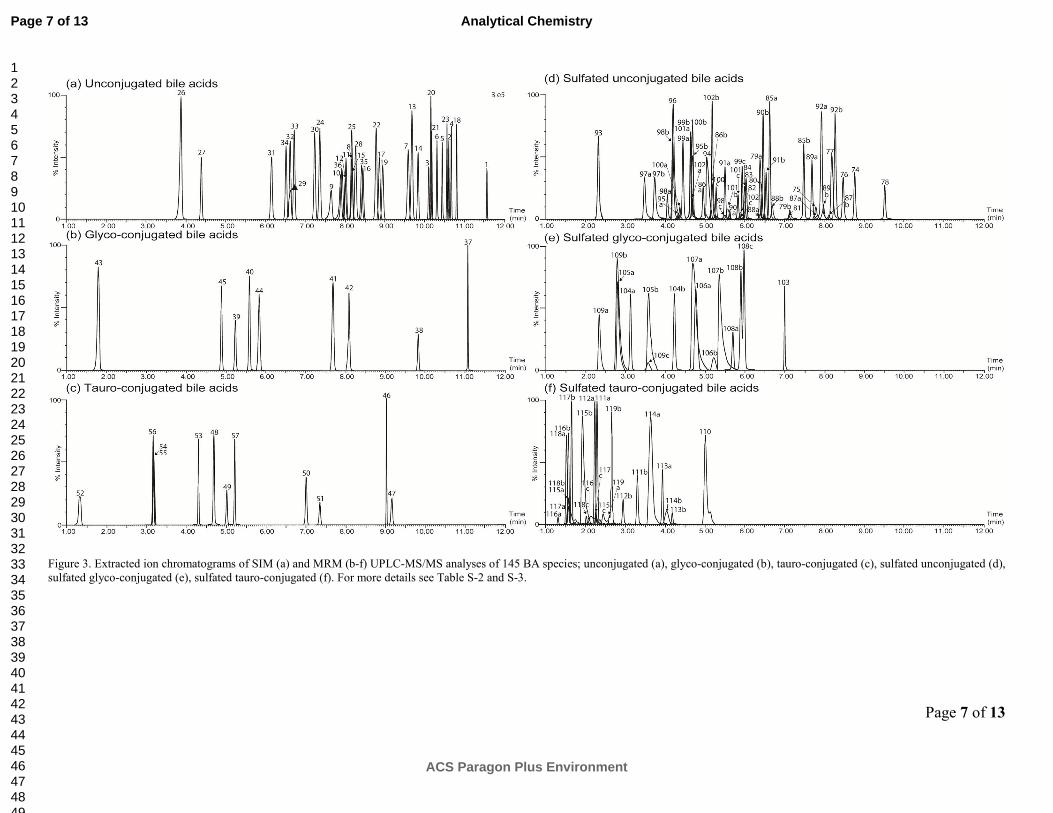
Figure 3. Extracted ion chromatograms of SIM (a) and MRM (b-f) UPLC-MS/MS analyses of 145 BA species; unconjugated (a), glyco-conjugated (b), tauro-conjugated (c), sulfated unconjugated (d),
sulfated glyco-conjugated (e), sulfated tauro-conjugated (f). For more details see Table S-2 and S-3.
Page 7 of 13
ACS Paragon Plus Environment
Analytical Chemistry
123456789101112131415161718192021222324252627282930313233343536373839404142434445464748495051525354555657585960
Page 8 of 13
As expected BA sulfates and also tauro- and glyco- conjugates
eluted earlier than their unconjugated counterparts. This ob-
servation demonstrates that sulfated hydroxyls situated on the
steroid nucleus change significantly the structure conformation
and solubility of the molecule. These results are consistent
with previous studies that demonstrate a change in physiologi-
cal activity due to sulfation, especially for BA transport in the
intestine.51
In addition to detection of sulfate conjugates, this
chromatographic method offers the possibility to detect and
quantify other water soluble BAs such as BA glucuronides.
Furthermore, sulfation was implemented in this method as it is
the most common modification observed in the BA elimina-
tion pathway and a simple one step procedure compared to
glucuronidation which involve more complex organic synthe-
sis steps.52
The combination of fit-for-purpose LC separation and opti-
mized MRM transitions and SIM offered high sensitivity and
selectivity for the 145 BA species tested (Table S-1 and Table
S-2). However, care needs to be taken for the mobile phase A
of this chromatographic method which has to be accurately
measured and stable if more solvents need to be added during
the run (400 samples analyzed with 2.5L of mobile phase A)
as retention times of the glycine conjugated and unconjugated
BA species are pH dependent.2 Therefore, this is an important
consideration when targeting the MS detection time window to
the elution of BA species, as any shift can result in missing the
specific peaks.
Method validation of the targeted UPLC-MS/MS method.
Optimization of MRM transitions and SIM aimed to maximize
the detected signal for each characteristic ion species or transi-
tion. Afterwards, the UPLC-MS/MS method was validated in
terms of accuracy and precision on intra/inter day, linearity,
carry-over and matrix effect.
Intra- and Inter day precision and accuracy.
The LODs ranged between 0.05-7.5 nM and linearity was
investigated over a wide concentration range of 10000 fold
between 0.25 nM and 5 μM respectively LLOQ and ULOQ.
This wide concentration range offered the best order of magni-
tude for quantification as the concentration of BAs spans a
wide range of concentrations (1 nM to 3 μM).27
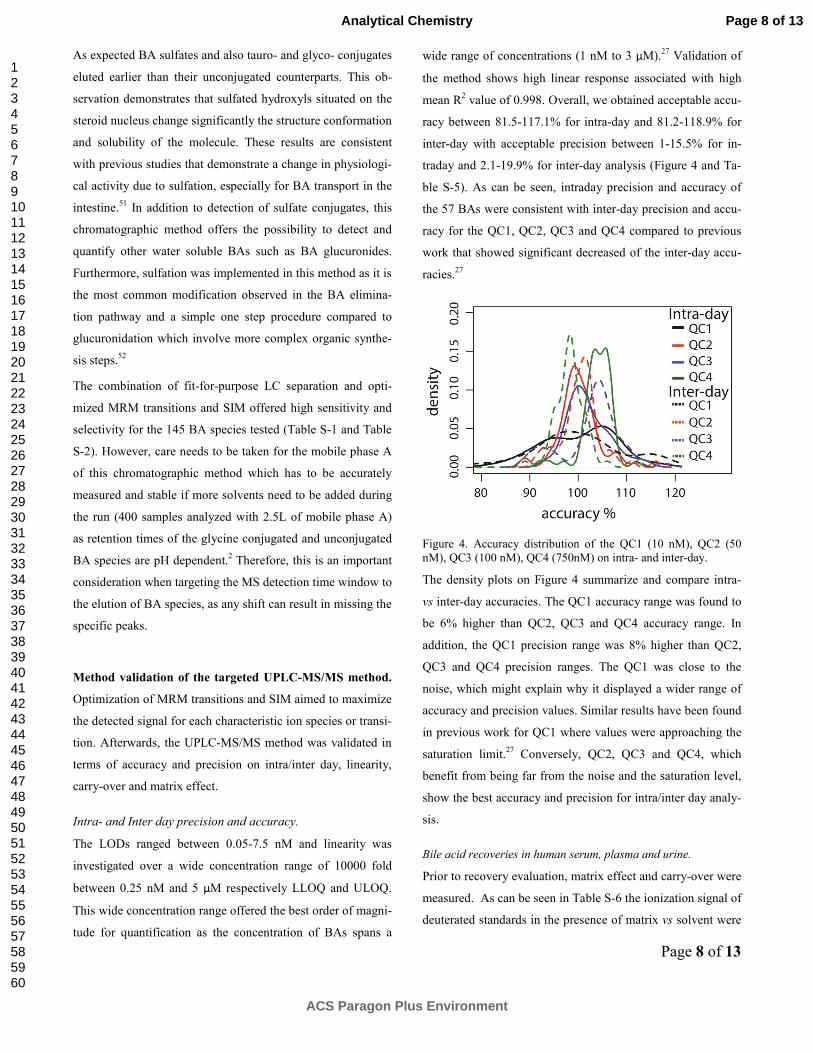
Validation of
the method shows high linear response associated with high
mean R2 value of 0.998. Overall, we obtained acceptable accu-
racy between 81.5-117.1% for intra-day and 81.2-118.9% for
inter-day with acceptable precision between 1-15.5% for in-
traday and 2.1-19.9% for inter-day analysis (Figure 4 and Ta-
ble S-5). As can be seen, intraday precision and accuracy of
the 57 BAs were consistent with inter-day precision and accu-
racy for the QC1, QC2, QC3 and QC4 compared to previous
work that showed significant decreased of the inter-day accu-
racies.27
Figure 4. Accuracy distribution of the QC1 (10 nM), QC2 (50
nM), QC3 (100 nM), QC4 (750nM) on intra- and inter-day.
The density plots on Figure 4 summarize and compare intra-
vs inter-day accuracies. The QC1 accuracy range was found to
be 6% higher than QC2, QC3 and QC4 accuracy range. In
addition, the QC1 precision range was 8% higher than QC2,
QC3 and QC4 precision ranges. The QC1 was close to the
noise, which might explain why it displayed a wider range of
accuracy and precision values. Similar results have been found
in previous work for QC1 where values were approaching the
saturation limit.27
Conversely, QC2, QC3 and QC4, which
benefit from being far from the noise and the saturation level,
show the best accuracy and precision for intra/inter day analy-
sis.
Bile acid recoveries in human serum, plasma and urine.
Prior to recovery evaluation, matrix effect and carry-over were
measured. As can be seen in Table S-6 the ionization signal of
deuterated standards in the presence of matrix vs solvent were
Page 8 of 13
ACS Paragon Plus Environment
Analytical Chemistry
123456789101112131415161718192021222324252627282930313233343536373839404142434445464748495051525354555657585960

Page 9 of 13
between 87.05-111.85% for the QC1 and between 79.85-
111.37% for the QC3. Furthermore, qualitative measurement
by combined infusion and injection of the standards confirmed
that there was no significant ion suppression or enhancement.
As shown in Table S-7 carry-over of BAs was easily removed
by the UPLC system and is negligible. Extraction efficiency of
the sample preparation was evaluated by analysis of recoveries
and reproducibility (n=6) for each deuterated internal standard
at their QC1 and QC3 concentrations (Figure S-2 and Table S-
8).
Simple protein precipitation is a straightforward one step sam-
ple preparation procedure that is known to reduce variation in
lipid recoveries.41
High recoveries of BAs associated with high
reproducibility were found in urine respectively around 92.7%
and 8.58%. Recovery of the standards in plasma and serum
were around 4% less than for urine recoveries, whereas repro-
ducibility around 2% higher than for urine. This difference
between plasma/serum and urine can be explained by the pres-
ence of high concentrations of proteins in blood, which might
affect the BA recoveries. Interestingly, ionization and recov-
ery of bile acids coeluting with other lipid species after 10 min
are not affected. Overall, satisfactory recoveries results were
observed for all three biofluids.
Application of the targeted UPLC-MS/MS methodology to
a human fed/fasted study showing post-prandial differ-
ences in bile acid quantification and detection. The validat-
ed targeted BA method was applied to a pre/post-prandial
study. BA profiles of plasma, serum and urine human samples
were investigated using a combination of univariate and mul-
tivariate analysis. As expected, the PCA scores plots for both
plasma and serum showed clear separation of samples ob-
tained pre- and post-prandially in PC1, reflecting systematic
differences in the bile acid profile (Figure 5). Moreover, sam-
ples collected pre-prandially were more tightly clustered than
those obtained following consumption of a fatty meal indicat-
ing that the dietary challenge may magnify inter-individual
differences in BA synthesis. In total, around 66 BAs were
detected in blood and 55 BAs in urine respectively including
15 and 22 sulfated BAs.
Figure 5. PCA scores plots of UPLC-MS/MS spectra obtained
from pre/post-prandial human plasma, serum and urine.
In contrast, no obvious separation was observed between the
pre- and post-prandial groups for the urine samples. A likely
explanation for this observation would be that the urine was
Page 9 of 13
ACS Paragon Plus Environment
Analytical Chemistry
123456789101112131415161718192021222324252627282930313233343536373839404142434445464748495051525354555657585960

Page 10 of 13
collected too early, only 2 hours after the meal, which might
be not long enough for the BAs to be accumulated in the urine.
Since the majority of BA excretion is via the fecal route, the
urine should only contain minor concentrations of bile acids,
and this may also account for the lack of observed variation
between the pre- and post-prandial samples. For all three PCA
models, the same outlier was observed but no modification in
separation occurred on removal of this sample from any mod-
el.
The top five most significant BAs in discriminating between
the pre- and post- prandial groups are listed in Table 1 and
were consistent between serum and plasma. However, com-
pared to a previous study, the order of significance was slight-
ly different for the two matrices.19
Higher BA concentrations
were observed in serum compared with EDTA-plasma, con-
sistent with general observations in small molecule studies
regarding the use of EDTA as an anticoagulant.53
We noted
that GCDCA was the most concentrated BA in blood, yet its
measurement remained within the dynamic range of the assay.
The values observed in the present study are in agreement with
those reported by Sherer and colleagues (1710 nM),19
but dif-
fer from those reported by other investigators (450-750
nM).18,22,27,28
Subsequent application of the method described
here to the analysis of independently obtained blood product
samples have yielded results more closely aligned with the
latter range, suggesting that the differences observed accurate-
ly reflect biological variance.
Table 1. BAs found in plasma and serum that discriminated
between pre-prandial vs. post-prandial healthy volunteers with
means and standard deviations of each quantified BAs. Statis-
tical analysis was performed using 2-tailed student t-test.
Biomarkers
Plasma p-value
Concentration (nM)
Pre-prandial Post-prandial
GCDCA 2.11E-05 3300 ± 1530 13900 ± 4540
GCA 8.00E-04 23.31 ± 7.45 88.47 ± 42.16
GDCA 1.70E-03 10.34 ± 50.32 111 ± 95.71
TCA 2.20E-03 17.81 ± 9.59 51.63 ± 25.55
GLCA 2.80E-03 12.71 ± 4.8 27.24 ± 11.32
Biomarkers Serum
p-value Concentration (nM)
Pre-prandial Post-prandial
GCDCA 6.99E-05 2200± 1367 11800 ± 4614
GDCA 1.42E-03 8.83 ± 6.18 108.47 ± 69.66
GCA 2.73E-03 17.41 ± 6.87 75.04 ± 44.76
GLCA 3.76E-03 5.36 ± 2.48 18.43 ± 10.72
TCA 8.36E-03 7.71 ± 8.11 28.37 ±19.11
CONCLUSIONS
Is it well established that BAs undergo multiple modifications
during the enterohepatic circulation via interaction with the
host or the gut microbiota. As a result, there is great BA di-
versity and most BAs found in human biofluidsare not listed in
any database. The parallel development of a non-targeted
screening approach for BAs combined with a targeted UPLC-
MS/MS BA assay provides a new resource for the profiling,
identification and quantification of BAs found in human bio-
fluids.
The method described is a reliable platform for BA analysis in
human biofluids including those with lipidic matrices. Analy-
sis of plasma, serum, and urine was efficiently performed with
a high degree of precision in a rapid analytical cycle, and cov-
ering a large number of BA species. Of these species, 89 sul-
fated BAs have been described, enhancing the capability in the
field for tertiary BA analysis. On the basis of these findings,
this analytical method should provide new insights into the
circulating BA pool regulated by the gut microbiota. Applica-
tions in biomarker discovery could furthermore provide guid-
ance for clinical diagnosis and monitoring response to therapy
in liver and intestinal diseases.
ABBREVIATIONS
BA, bile acid; UPLC-MS, ultra performance liquid chroma-
tography-mass spectrometry; MS/MS, tandem mass spectrom-
etry; SIM, selected ion monitoring; MRM, multiple reaction
monitoring; CA, cholic acid; DCA; deoxycholic acid, HCA,
hyocholic acid; LCA-S: lithocholic acid sulfate; MuroCA,
murocholic acid; UDCA, ursodeoxycholic acid; GCDCA,
glycochenodeoxycholic acid; GDCA, glycochenodeoxycholic
acid sulfate; GDCA-S; glycodeoxycholic acid; GCA, gly-
cocholic acid; GHCA, glycohyocholic acid; GHDCA, glyco-
hyodeoxycholic acid; GLCA, glycolithocholic acid; GUDCA,
glycursodeoxycholic acid; TCA, taurocholic acid; TDCA,
taurodeoxycholic acid; TCDCA, taurochenodeoxycholic acid;
THCA, taurohyocholic acid; THDCA, taurohyodeoxycholic
acid; TωMCA, tauro ω murichlic acid; TUDCA, tauro-
ursodeoxycholic acid; S, sulfate; PCA, principal component
analysis; QC, quality control; LOD, limit of detection; LLOQ,
lower limit of quantification; ULOQ, upper limit of quantifica-
tion.
ASSOCIATED CONTENT
Supporting Information
Additional information as noted in the text. This material is avail-
able free of charge via the Internet at http://pubs.acs.org.
Page 10 of 13
ACS Paragon Plus Environment
Analytical Chemistry
123456789101112131415161718192021222324252627282930313233343536373839404142434445464748495051525354555657585960

Page 11 of 13
AUTHOR INFORMATION
Corresponding Author
**E-mail: [email protected] (J.K.N.)
ACKNOWLEDGMENT
M.S. would like to thank Nestlé and M.Gaudin for his assistance
for the sulfation optimization, as well as the staff of the MRC-
NIHR National Phenome Centre for their assistance and technical
expertise.
MJWM is grateful to the Welcome Trust, UK for support during
the production of this article. MJWM and VP would like to thank
the staff of the Institute of Liver Studies and in particular Prof
Julia Wendon and Dr Debbie Shawcross.
This work was supported by Nestlé ((RDLS015375), the Medical
Research Council and National Institute for Health Research
[grant number MC_PC_12025] and by the Medical Research
Council (MRC), reference [grant number MR/L001489/1].
REFERENCES
(1) Tso, P. Adv Lipid Res 1985, 21, 143-86.
(2) Cai, X.; Grant, D. J.; Wiedmann, T. S. J Pharm Sci 1997, 86,
372-7.
(3) Hofmann, A. F.; Eckmann, L. Proc Natl Acad Sci U S A 2006,
103, 4333-4.
(4) Inagaki, T.; Moschetta, A.; Lee, Y. K.; Peng, L.; Zhao, G.;
Downes, M.; Yu, R. T.; Shelton, J. M.; Richardson, J. A.; Repa, J. J.;
Mangelsdorf, D. J.; Kliewer, S. A. Proc Natl Acad Sci U S A 2006,
103, 3920-5.
(5) Anizan, S.; Bichon, E.; Di Nardo, D.; Monteau, F.; Cesbron,
N.; Antignac, J. P.; Le Bizec, B. Talanta 2011, 86, 186-94.
(6) Chiang, J. Y. Am J Physiol Gastrointest Liver Physiol 2003,
284, G349-56.
(7) Claus, S. P.; Tsang, T. M.; Wang, Y.; Cloarec, O.; Skordi, E.;
Martin, F. P.; Rezzi, S.; Ross, A.; Kochhar, S.; Holmes, E.;
Nicholson, J. K. Mol Syst Biol 2008, 4, 219.
(8) Ridlon, J. M.; Kang, D. J.; Hylemon, P. B. J Lipid Res 2006,
47, 241-59.
(9) Duboc, H.; Rajca, S.; Rainteau, D.; Benarous, D.; Maubert, M.
A.; Quervain, E.; Thomas, G.; Barbu, V.; Humbert, L.; Despras, G.;
Bridonneau, C.; Dumetz, F.; Grill, J. P.; Masliah, J.; Beaugerie, L.;
Cosnes, J.; Chazouilleres, O.; Poupon, R.; Wolf, C.; Mallet, J. M.;
Langella, P.; Trugnan, G.; Sokol, H.; Seksik, P. Gut 2013, 62, 531-9.
(10) Jones, M. L.; Martoni, C. J.; Ganopolsky, J. G.; Labbe, A.;
Prakash, S. Expert Opin Biol Ther 2014, 14, 467-82.
(11) Mahato, S. B.; Mukherjee, E.; Banerjee, S. Biotechnol Adv
1994, 12, 357-91.
(12) Russell, D. W. Annu Rev Biochem 2003, 72, 137-74.
(13) Marschall, H. U.; Matern, H.; Wietholtz, H.; Egestad, B.;
Matern, S.; Sjovall, J. J Clin Invest 1992, 89, 1981-7.
(14) Moschetta, A.; Xu, F.; Hagey, L. R.; van Berge-Henegouwen,
G. P.; van Erpecum, K. J.; Brouwers, J. F.; Cohen, J. C.; Bierman, M.;
Hobbs, H. H.; Steinbach, J. H.; Hofmann, A. F. J Lipid Res 2005, 46,
2221-32.
(15) Griffiths, W. J.; Sjovall, J. J Lipid Res 2010, 51, 23-41.
(16) Street, J. M.; Trafford, D. J.; Makin, H. L. J Lipid Res 1983,
24, 491-511.
(17) Shimada, K.; Mitamura, K.; Higashi, T. J Chromatogr A 2001,
935, 141-72.
(18) Xie, G.; Wang, Y.; Wang, X.; Zhao, A.; Chen, T.; Ni, Y.;
Wong, L.; Zhang, H.; Zhang, J.; Liu, C.; Liu, P.; Jia, W. J Proteome
Res 2015, 14, 850-9.
(19) Scherer, M.; Gnewuch, C.; Schmitz, G.; Liebisch, G. J
Chromatogr B Analyt Technol Biomed Life Sci 2009, 877, 3920-5.
(20) Want, E. J.; Coen, M.; Masson, P.; Keun, H. C.; Pearce, J. T.;
Reily, M. D.; Robertson, D. G.; Rohde, C. M.; Holmes, E.; Lindon, J.
C.; Plumb, R. S.; Nicholson, J. K. Anal Chem 2010, 82, 5282-9.
(21) Steiner, C.; von Eckardstein, A.; Rentsch, K. M. J
Chromatogr B Analyt Technol Biomed Life Sci 2010, 878, 2870-80.
(22) Perwaiz, S.; Tuchweber, B.; Mignault, D.; Gilat, T.; Yousef, I.
M. J Lipid Res 2001, 42, 114-9.
(23) Sayin, S. I.; Wahlstrom, A.; Felin, J.; Jantti, S.; Marschall, H.
U.; Bamberg, K.; Angelin, B.; Hyotylainen, T.; Oresic, M.; Backhed,
F. Cell Metab 2013, 17, 225-35.
(24) Alnouti, Y.; Csanaky, I. L.; Klaassen, C. D. J Chromatogr B
Analyt Technol Biomed Life Sci 2008, 873, 209-17.
(25) Bathena, S. P.; Mukherjee, S.; Olivera, M.; Alnouti, Y. J
Chromatogr B Analyt Technol Biomed Life Sci 2013, 942-943, 53-62.
(26) Huang, J.; Bathena, S. P.; Csanaky, I. L.; Alnouti, Y. J Pharm
Biomed Anal 2011, 55, 1111-9.
(27) Garcia-Canaveras, J. C.; Donato, M. T.; Castell, J. V.; Lahoz,
A. J Lipid Res 2012, 53, 2231-41.
(28) Humbert, L.; Maubert, M. A.; Wolf, C.; Duboc, H.; Mahe, M.;
Farabos, D.; Seksik, P.; Mallet, J. M.; Trugnan, G.; Masliah, J.;
Rainteau, D. J Chromatogr B Analyt Technol Biomed Life Sci 2012,
899, 135-45.
(29) Sergi, M.; Montesano, C.; Napoletano, S.; Pizzoni, D.;
Manetti, C.; Colistro, F.; Curini, R.; Compagnone, D.
Chromatographia 2012, 75, 479–489.
(30) Qiao, X.; Ye, M.; Liu, C. F.; Yang, W. Z.; Miao, W. J.; Dong,
J.; Guo, D. A. Steroids 2012, 77, 204-11.
(31) Ye, L.; Liu, S.; Wang, M.; Shao, Y.; Ding, M. J Chromatogr
B Analyt Technol Biomed Life Sci 2007, 860, 10-7.
(32) Bobeldijk, I.; Hekman, M.; de Vries-van der Weij, J.; Coulier,
L.; Ramaker, R.; Kleemann, R.; Kooistra, T.; Rubingh, C.; Freidig,
A.; Verheij, E. J Chromatogr B Analyt Technol Biomed Life Sci 2008,
871, 306-13.
(33) Chen, T.; Xie, G.; Wang, X.; Fan, J.; Qiu, Y.; Zheng, X.; Qi,
X.; Cao, Y.; Su, M.; Xu, L. X.; Yen, Y.; Liu, P.; Jia, W. Mol Cell
Proteomics 2011, 10, M110 004945.
(34) John, C.; Werner, P.; Worthmann, A.; Wegner, K.; Todter, K.;
Scheja, L.; Rohn, S.; Heeren, J.; Fischer, M. J Chromatogr A 2014,
1371, 184-95.
(35) Swann, J. R.; Want, E. J.; Geier, F. M.; Spagou, K.; Wilson, I.
D.; Sidaway, J. E.; Nicholson, J. K.; Holmes, E. Proc Natl Acad Sci U
S A 2011, 108 Suppl 1, 4523-30.
(36) Ridlon, J. M.; Kang, D. J.; Hylemon, P. B.; Bajaj, J. S. Curr
Opin Gastroenterol 2014, 30, 332-8.
(37) Maekawa, M.; Shimada, M.; Iida, T.; Goto, J.; Mano, N.
Steroids 2014, 80, 80-91.
(38) Shockor, J.; Crowe, H.; Yu, K.; Shion, H. Waters Application
note 2011.
(39) Knittelfelder, O. L.; Weberhofer, B. P.; Eichmann, T. O.;
Kohlwein, S. D.; Rechberger, G. N. J Chromatogr B Analyt Technol
Biomed Life Sci 2014, 951-952, 119-28.
(40) Ogiso, H.; Suzuki, T.; Taguchi, R. Anal Biochem 2008, 375,
124-31.
(41) Sarafian, M. H.; Gaudin, M.; Lewis, M. R.; Martin, F. P.;
Holmes, E.; Nicholson, J. K.; Dumas, M. E. Anal Chem 2014, 86,
5766-74.
(42) Norman, A.; Palmer, R. H. J Lab Clin Med 1964, 63, 986-
1001.
(43) Palmer, R. H. Proc Natl Acad Sci U S A 1967, 58, 1047-50.
(44) Food and Drug Administration, FDA. US Department of
Health and Human Services, center for Drug Evaluation and
Research and center for Veterinary Medicine, Rockville, MD, 2013.
(45) Cerny, I.; Pouzar, V.; Budesinsky, M.; Bicikova, M.; Hill, M.;
Hampl, R. Steroids 2004, 69, 161-71.
(46) Sandhoff, R.; Brugger, B.; Jeckel, D.; Lehmann, W. D.;
Wieland, F. T. J Lipid Res 1999, 40, 126-32.
(47) Hagey, L. R.; Krasowski, M. D. Adv Nutr 2013, 4, 29-35.
Page 11 of 13
ACS Paragon Plus Environment
Analytical Chemistry
123456789101112131415161718192021222324252627282930313233343536373839404142434445464748495051525354555657585960
Page 12 of 13
(48) Huijghebaert, S.; Parmentier, G.; Eyssen, H. J Steroid
Biochem 1984, 20, 907-12.
(49) Alnouti, Y. Toxicol Sci 2009, 108, 225-46.
(50) Loof, L.; Hjerten, S. Biochim Biophys Acta 1980, 617, 192-
204.
(51) Palmer, R. H.; Bolt, M. G. J Lipid Res 1971, 12, 671-9.
(52) Mostarda, S.; Filipponi, P.; Sardella, R.; Venturoni, F.;
Natalini, B.; Pellicciari, R.; Gioiello, A. Org Biomol Chem 2014, 12,
9592-600.
(53) Vuckovic, D. Anal Bioanal Chem 2012, 403, 1523-48.
Page 12 of 13
ACS Paragon Plus Environment
Analytical Chemistry
123456789101112131415161718192021222324252627282930313233343536373839404142434445464748495051525354555657585960

13
For Table of Contents Only
Page 13 of 13
ACS Paragon Plus Environment
Analytical Chemistry
123456789101112131415161718192021222324252627282930313233343536373839404142434445464748495051525354555657585960