Bilcare corporate presentation
29
Speed | Innovation | Happiness Corporate Presentation Mar 2014
-
Upload
bilcareltd -
Category
Healthcare
-
view
139 -
download
0
Transcript of Bilcare corporate presentation

Speed | Innovation | Happiness
Corporate PresentationMar 2014

Speed | Innovation | Happiness
2
Vision
Delivering Innovation - Transforming lives
Values
Speed
Proactive and swift action is our mantra
Innovation
Our constant approach at all levels is to seek better ways of listening, thinking & doing – making our offerings meaningful
& impactful
Happiness
We are motivated by our customer’s success & happiness of our stakeholders
Overview

Speed | Innovation | Happiness
Overview
3

Speed | Innovation | Happiness
Global footprint with world-class production facilities in America, Europe and Asia

Speed | Innovation | Happiness
5
Corporate Structure
Bilcare India
Bilcare Singapore
100%
Bilcare Inc. 100%
Bilcare Brazil 100%
Bilcare GmbH 100%
Bilcare SA 100%
Bilcare Technologies
80%
Bilcare Technologies
Italia92%
Bilcare Mauritius
100%
Bilcare Research AG
100%
Bilcare Research Srl.
100%
Bilcare Research Inc.
100%
Bilcare Research GmbH - 100%
Caprihans 51%
Speed | Innovation | Happiness
Business Verticles
6

Speed | Innovation | Happiness
7
Innovative Packaging Solutions
Integrated R&D consultancy and Solutions for the global pharmaceutical industry
Value based solutions for brand protection technologies and next generation packaging needs
Highly focused and targeted to address the unmet needs of the pharmaceutical industry
Intensive R&D efforts, complemented by excellent product development capabilities
Partnerships with external research institutes and experts of repute for establishing strong R&D capabilities
Continued investments in R&D as a core element for growth
R&D facilities spread across Pune – India, Changi – Singapore; Staufen & Botzingen - Germany
Our R&D Philosophy
Speed | Innovation | Happiness
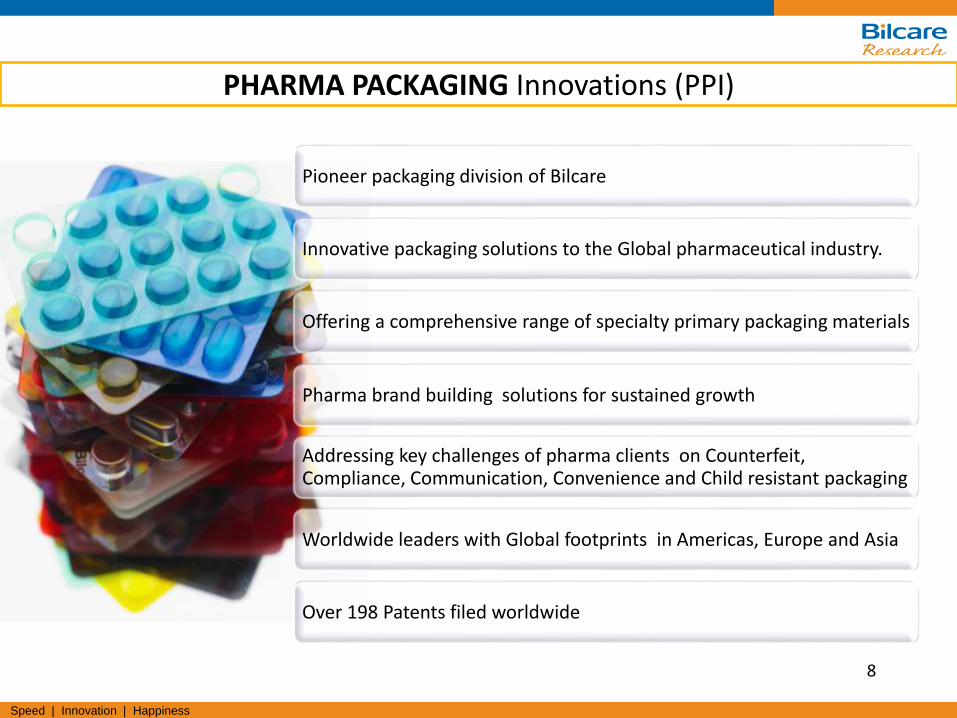
Pioneer packaging division of Bilcare
Innovative packaging solutions to the Global pharmaceutical industry.
Offering a comprehensive range of specialty primary packaging materials
Pharma brand building solutions for sustained growth
Addressing key challenges of pharma clients on Counterfeit, Compliance, Communication, Convenience and Child resistant packaging
Worldwide leaders with Global footprints in Americas, Europe and Asia
Over 198 Patents filed worldwide
PHARMA PACKAGING Innovations (PPI)
8
Speed | Innovation | Happiness
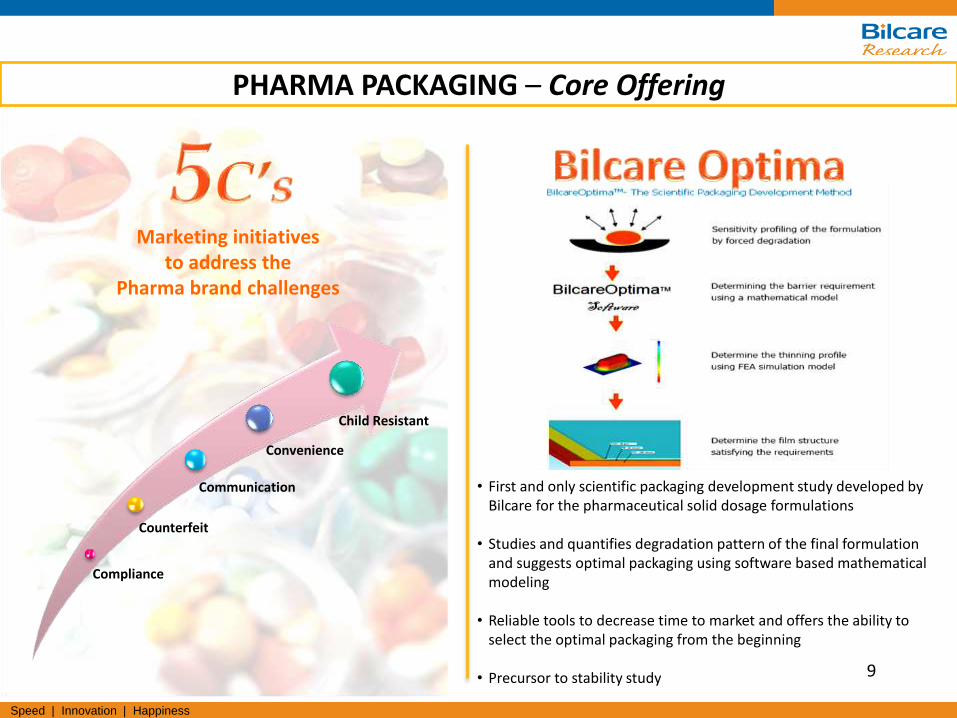
• First and only scientific packaging development study developed by Bilcare for the pharmaceutical solid dosage formulations
• Studies and quantifies degradation pattern of the final formulation and suggests optimal packaging using software based mathematical modeling
• Reliable tools to decrease time to market and offers the ability to select the optimal packaging from the beginning
• Precursor to stability study
Compliance
Counterfeit
Communication
Convenience
Child Resistant
9
Marketing initiativesto address the
Pharma brand challenges
PHARMA PACKAGING – Core Offering

Speed | Innovation | Happiness
Pharma Packaging - Range of products
Bilcare offers a complete range of high-quality packaging films. Our production standards are the highest in the business, with every film meeting complex and
ever dynamic pharmaceutical specifications
Flexible Packaging Films
• Pharma-grade Barrier films
• Extra (PVC), Duplex(PVC/PVdC), Triplex (PVC/PE/PVdC), Exel(PVC/PE).
• Ultra-high Barrier Film
• Aquaba
• Zymax TX.
• Eco-friendly Halogen-free Films
• Optra, Astra, Petra, Topas
Aluminum Foils
• Pharma-grade Cold-forming Foil
• Bilcare Venus (PVC/Alu/OPA)
• Pharma-grade Aluminium Liddingfoils
• Bilcare Zeon, Bilcare Zeon+, Bilcare Zeon xt
• Eco-friendly Lidding Foils
• Bilcare Nova, Bilcare SilNova, Bilcare MetNova
• Bilcare CR Lidding Foils
• Bilcare Crispak of various structures
Innovative Products
• Products to create brand identity with anti-counterfeiting features
• Bilcare Patina, Bilcare Ultra, Bilcare Ultra TX, Bilcare Protect, Bilcare Secure.
• Flexible Laminates
• Aclar
• Bilcare Lamiflex of various structures of paper, aluminum and polymerfilm combinations
Speed | Innovation | Happiness
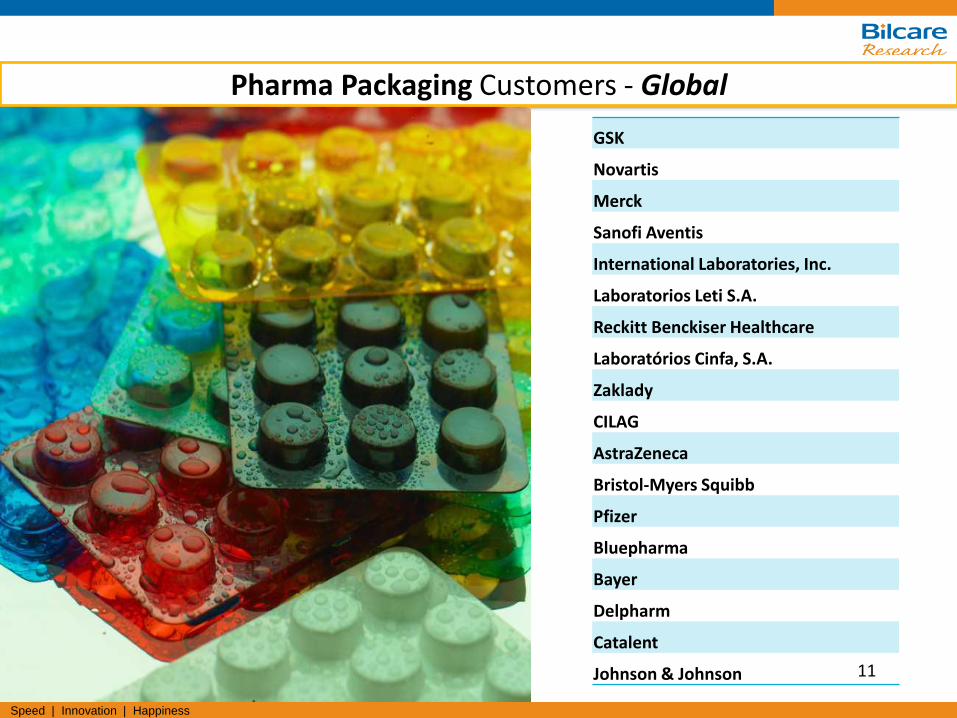
Global Pharma Packaging Customers
GSK
Novartis
Merck
Sanofi Aventis
International Laboratories, Inc.
Laboratorios Leti S.A.
Reckitt Benckiser Healthcare
Laboratórios Cinfa, S.A.
Zaklady
CILAG
AstraZeneca
Bristol-Myers Squibb
Pfizer
Bluepharma
Bayer
Delpharm
Catalent
Johnson & Johnson
Pharma Packaging Customers - Global
11

Speed | Innovation | Happiness
Packaging Films Solutions (PFS)
Leading suppliers of wide range
of rigid Mono and Multilayer
films for Food & FMCG industry
12
Cards Solutions (CS)
High quality cores and overlays for
all kind of PVC Laminate Cards viz.
Magnetic swipe cards, Gift &
Loyalty cards, Banking Cards,
Playing cards etc.
Specialty Films Solutions(SFS)
High quality Films for sectors
such as Printing/ Decoration,
Shrink films, Visual packaging,
Technical applications, Office
materials and Furniture

Speed | Innovation | Happiness
13
Highly differentiated, next-gen anti-counterfeiting solution
Large market opportunity
(approx 5% to 7% of the entire World trade is feared to be counterfeit *)
Globally patented proprietary technology having applications beyond anti-counterfeiting
Nationally and internationally recognized
(Pioneer status from Govt. of Singapore)
Razor sharp focus on operations
(Production capacity of over 1 Billion Chips )
Strong partner/channel focus to drive scale quickly
Highly experienced, talented and focused leadership team …
* http://www.unc.edu/courses/2010spring/law/357c/001/ACG/stats.html
nCID Technologies – for Brand Safety & Security
13

Speed | Innovation | Happiness
The nonClonableID Chip cannot be duplicated ever!
Bilcare’s answer for Counterfeiting
14
Metal materials-based “Signature” of micro nano particles
Serial Number
2D Data Matrix assigned to each
Signature
nonClonable Tamper -proof Chip for Identification &
Authentication
Captured by MO-Chip reader & stored in
Digitized form
Speed | Innovation | Happiness
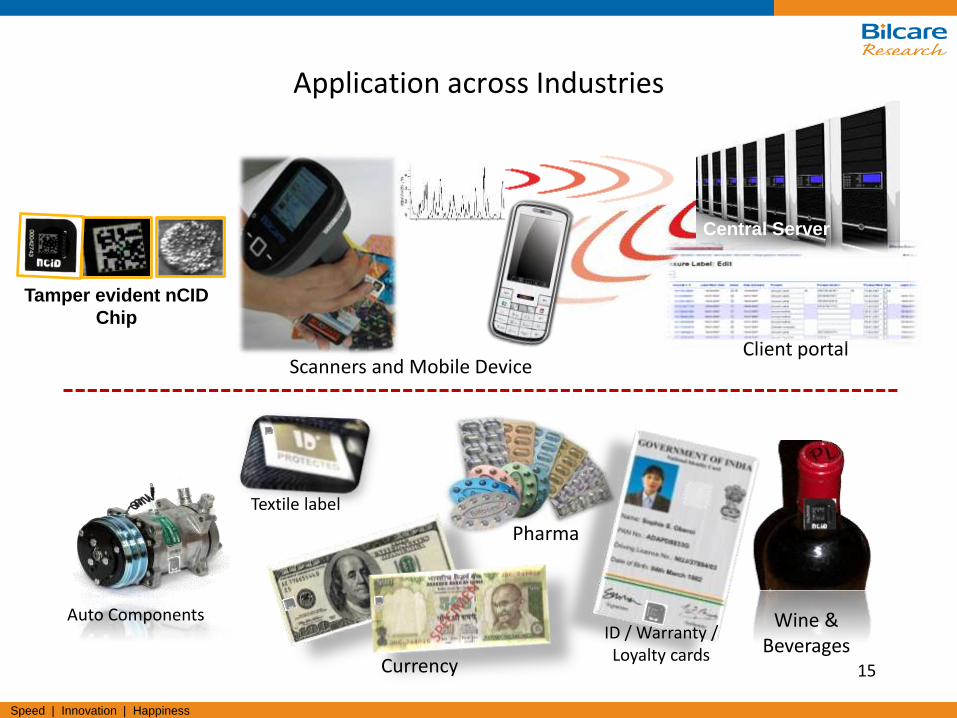
Scanners and Mobile Device
Auto Components
Textile label
Client portal
Wine & Beverages
Pharma
Currency
Application across Industries
15
Central Server
Tamper evident nCID
Chip
ID / Warranty / Loyalty cards
Speed | Innovation | Happiness
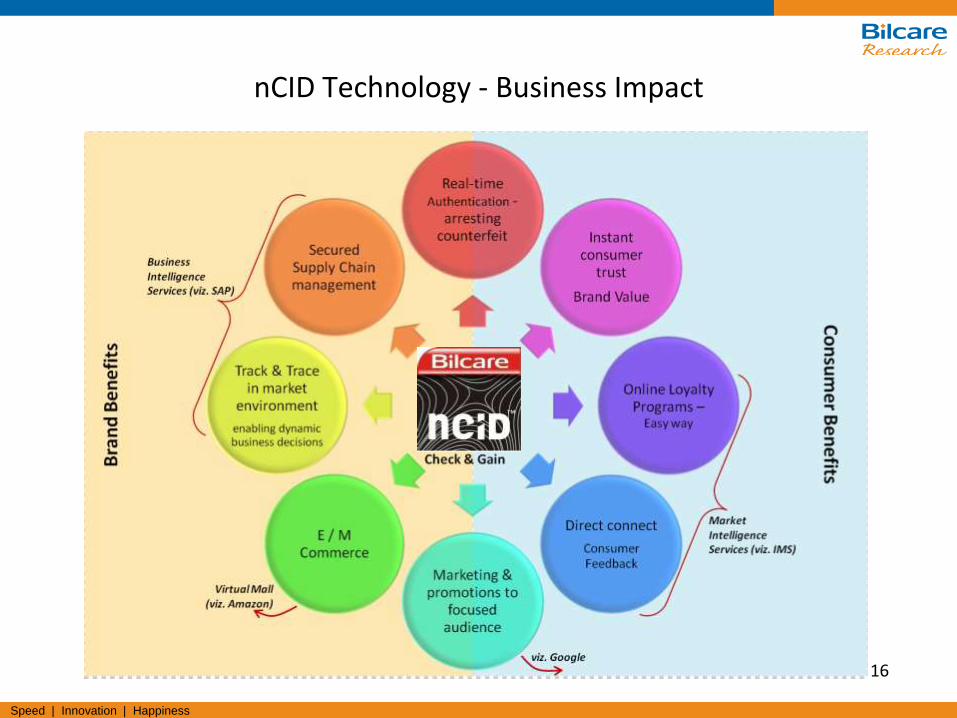
nCID Technology - Business Impact
16
Speed | Innovation | Happiness
17
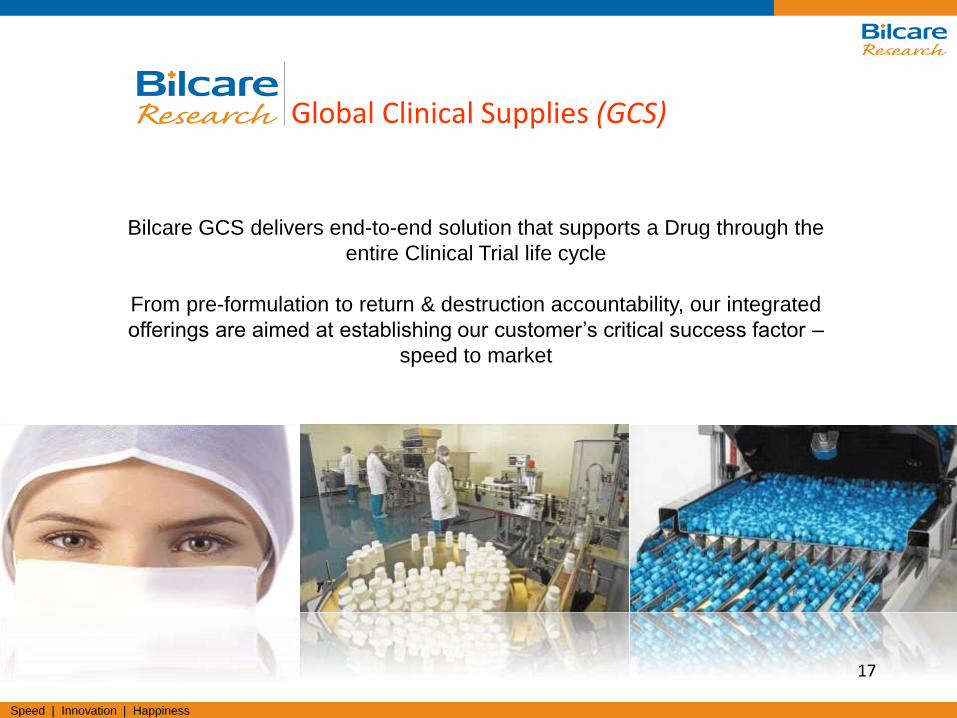
Global Clinical Supplies (GCS)
Bilcare GCS delivers end-to-end solution that supports a Drug through the
entire Clinical Trial life cycle
From pre-formulation to return & destruction accountability, our integrated
offerings are aimed at establishing our customer’s critical success factor –
speed to market
Speed | Innovation | Happiness
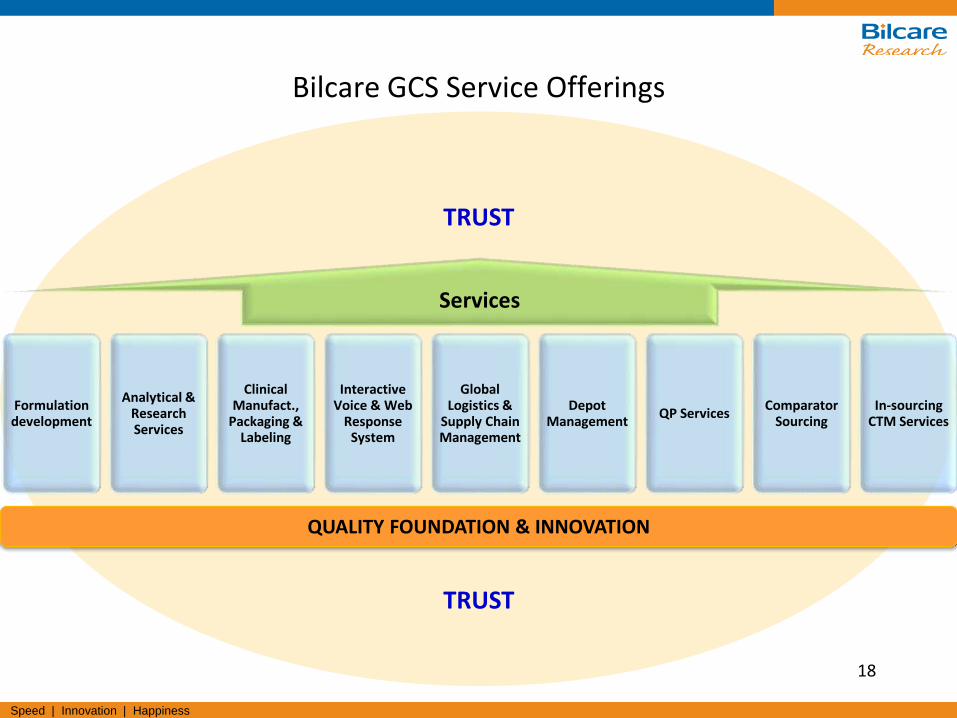
TRUST
TRUST
Services
Formulation development
Analytical & Research Services
Clinical Manufact.,
Packaging & Labeling
Interactive Voice & Web
Response System
Global Logistics &
Supply Chain Management
Depot Management
QP ServicesComparator
SourcingIn-sourcing
CTM Services
QUALITY FOUNDATION & INNOVATION
Bilcare GCS Service Offerings
18

Speed | Innovation | Happiness
19
Bilcare GCS Facilities
FDA licensed facility to carry out CTMS activities like Manufacturing, Packaging & Labeling, Storage &
Distribution operations of clinical trial supplies
World class SOPs in line with USFDA & MHRA requirementsGCS Facilities - India
Packaging & Labeling facility Storage & Distribution
Bilcare GCS – Global S&D Network
In Aug 2012, United Drugs Plc acquired Bilcare’s Global Clinical Supplies business in US and UK for USD 61 Mn. while Bilcare retained its GCS Asia business.
Going forward, Bilcare GCS, Asia and United Drugs Plc. will work together to use their complementary resources to meet the needs of their global customers across US, Europe and Asia.

Speed | Innovation | Happiness
Financial Overview
20
Share of International Business grown from 20% to 80% in the last 5 years
Transformation to a Global Company
Note: The above years denote Financial Year ending 31st March for that particular year
India13%
Overseas87%
Revenue Share 2014
India 63%
Overseas 37%
Revenue Share 2008
India28%
Overseas72%
Revenue Share 2011

Speed | Innovation | Happiness
Key Financial Parameters – P&L CONSOLIDATED (updated till 31st March 2014)
21
Note: The above years denote Financial Year ending 31st March for that particular year
169.0 208.0
455.0
712.9
653.5
511.8
0
100
200
300
400
500
600
700
800
2009 2010 2011 2012 2013 2014
Revenue (USD Mn)
38
51
74
95
72
43
0
20
40
60
80
100
2009 2010 2011 2012 2013 2014
EBIDTA (USD Mn)
4.95.9
4.12.9
1.50.5
0
5
10
15
2009 2010 2011 2012 2013 2014
Interest Cover (Times)
-20
-10
0
10
20
30
40
50
60
1 2 3 4 5 6
16 23 2927
7
-19
2433
46
5235
4
PAT & Cash Accruals (USD Mn)
PAT Cash Accruals
0.820.96
1.241.16
0.31
-0.8-1.00
-0.50
0.00
0.50
1.00
1.50
2.00
2009 2010 2011 2012 2013 2014
Earning Per Share (USD/ share)
Speed | Innovation | Happiness
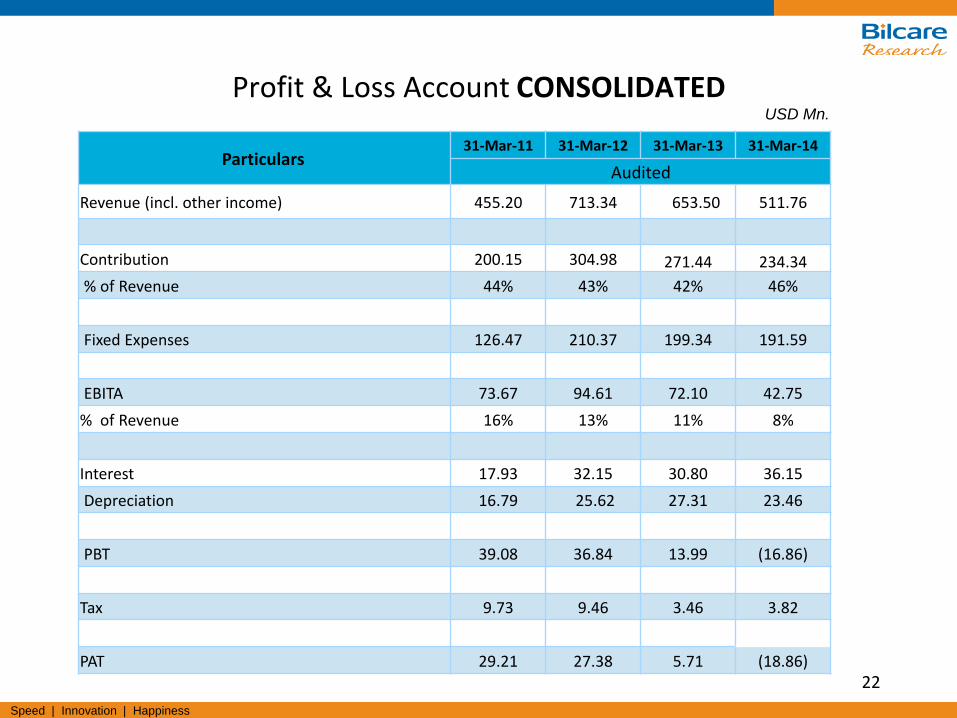
Profit & Loss Account CONSOLIDATED
22
USD Mn.
Particulars31-Mar-11 31-Mar-12 31-Mar-13 31-Mar-14
Audited
Revenue (incl. other income) 455.20 713.34 653.50 511.76
Contribution 200.15 304.98 271.44 234.34
% of Revenue 44% 43% 42% 46%
Fixed Expenses 126.47 210.37 199.34 191.59
EBITA 73.67 94.61 72.10 42.75
% of Revenue 16% 13% 11% 8%
Interest 17.93 32.15 30.80 36.15
Depreciation 16.79 25.62 27.31 23.46
PBT 39.08 36.84 13.99 (16.86)
Tax 9.73 9.46 3.46 3.82
PAT 29.21 27.38 5.71 (18.86)

Speed | Innovation | Happiness
23Note: The above years denote Financial Year ending 31st March for that particular year
Key Financial Parameters – Balance Sheet CONSOLIDATED (updated till 31st March 2014)
99
170
218
290 281
243
0
50
100
150
200
250
300
350
2009 2010 2011 2012 2013 2014
Net Worth (USD Mn)
1.92
0.69
1.01 1.03
1.61 1.65
0.00
0.50
1.00
1.50
2.00
2.50
2009 2010 2011 2012 2013 2014
Debt/ Equity Ratio
0.0%2.0%4.0%6.0%8.0%
10.0%12.0%14.0%16.0%
2009 2010 2011 2012 2013 2014
15.8%
11.5% 10.9% 11.2%
6.7%
3.2%
Return on Capital Employed
0.00
0.20
0.40
0.60
0.80
1.00
1.20
1.40
2009 2010 2011 2012 2013 2014
0.46
1.17
0.60
0.96
1.391.50
Total Outside Liab/ Total Net Worth

Speed | Innovation | Happiness
Balance Sheet CONSOLIDATED
24
USD Mn.
Particulars31-Mar-11 31-Mar-12 31-Mar-13 31-Mar-14
Audited
Equity Capital 4.60 4.60 4.33 3.92
Networth (incl. deferred tax) 244.00 301.67 277.01 238.82
Debt 238.42 267.90 391.99 364.53
TOTAL 487.02 574.17 673.33 607.27
Net Fixed Assets 282.24 320.01 430.34 397.47
Investments 0.04 0.02 0.02 0.02
Net Current Assets 204.74 254.14 242.98 209.78
TOTAL 487.02 574.17 673.33 607.27
Speed | Innovation | Happiness
25
Note: The above years denote Financial Year ending 31st March for that particular year
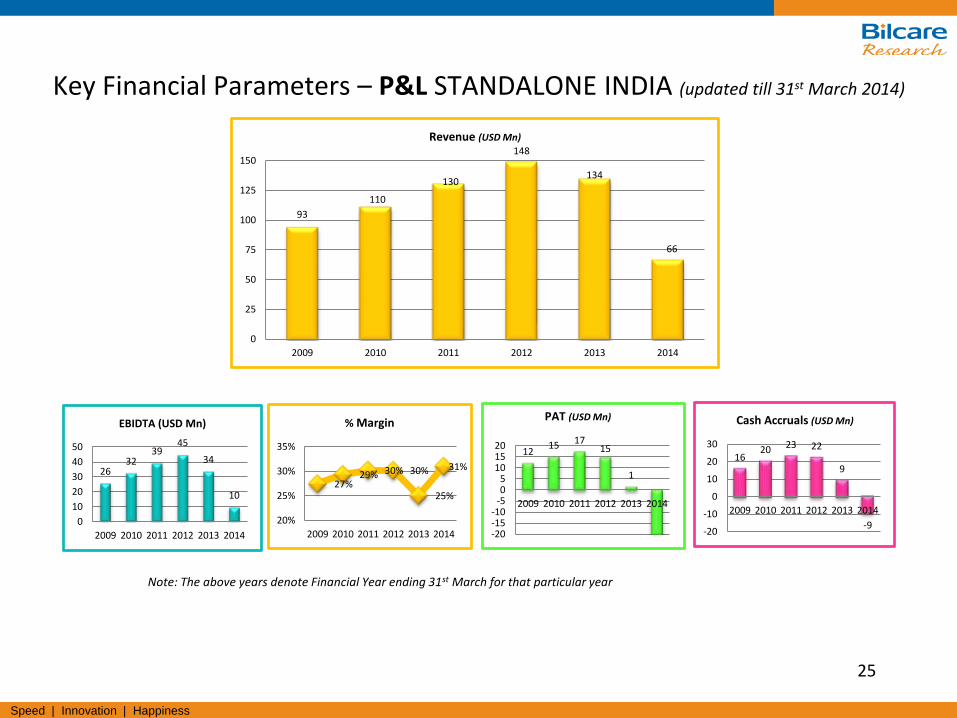
Key Financial Parameters – P&L STANDALONE INDIA (updated till 31st March 2014)
93
110
130
148
134
66
0
25
50
75
100
125
150
2009 2010 2011 2012 2013 2014
Revenue (USD Mn)
2632
3945
34
10
0
10
20
30
40
50
2009 2010 2011 2012 2013 2014
EBIDTA (USD Mn)
27%29% 30% 30%
25%
31%
20%
25%
30%
35%
2009 2010 2011 2012 2013 2014
% Margin
1215 17
15
1
-20-15-10
-505
101520
2009 2010 2011 2012 2013 2014
PAT (USD Mn)
1620 23 22
9
-9-20
-10
0
10
20
30
2009 2010 2011 2012 2013 2014
Cash Accruals (USD Mn)

Speed | Innovation | Happiness
26
Profit & Loss Account Standalone IndiaUSD Mn.
Particulars31-Mar-11 31-Mar-12 31-Mar-13 31-Mar-14
Audited
Revenue (incl. other income) 129.57 148.33 133.70 65.64
Contribution 52.05 57.19 46.38 20.34
% of Revenue 40% 39% 35% 31%
Fixed Expenses 12.95 12.45 12.85 10.77
EBIDTA 39.17 44.74 33.53 9.57
% of Revenue 30% 30% 25% 25%
Interest 8.77 15.58 18.86 24.47
Depreciation 5.80 7.04 7.73 11.28
PBT 24.60 22.12 6.94 (26.18)
Tax 7.58 7.51 0.91 0.22
PAT 17.01 14.61 1.21 (20.21)

Speed | Innovation | Happiness
27
Note: The above years denote Financial Year ending 31st March for that particular year
Key Financial Parameters – Balance Sheet INDIA STANDALONE (updated till 31st March 2014)
84
153
176187
200
159
0
50
100
150
200
250
2009 2010 2011 2012 2013 2014
Net Worth (USD Mn)
1.10
0.560.60
0.68
1.41 1.44
0
0
0
1
1
1
1
1
2
2009 2010 2011 2012 2013 2014
Debt /Equity Ratio
Speed | Innovation | Happiness
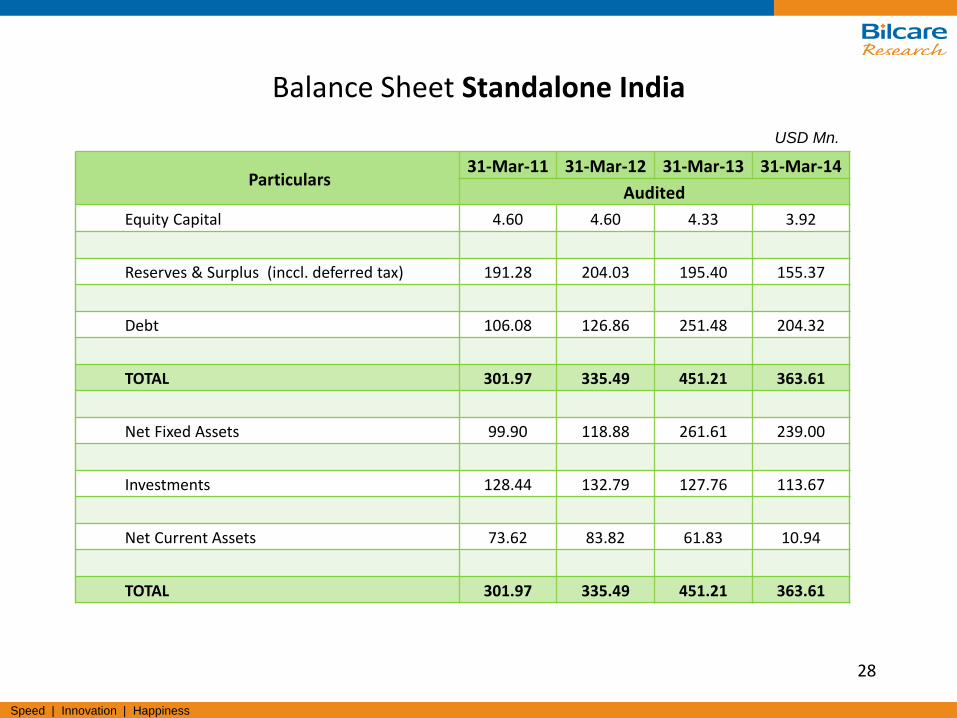
Balance Sheet Standalone India
28
USD Mn.
Particulars31-Mar-11 31-Mar-12 31-Mar-13 31-Mar-14
Audited
Equity Capital 4.60 4.60 4.33 3.92
Reserves & Surplus (inccl. deferred tax) 191.28 204.03 195.40 155.37
Debt 106.08 126.86 251.48 204.32
TOTAL 301.97 335.49 451.21 363.61
Net Fixed Assets 99.90 118.88 261.61 239.00
Investments 128.44 132.79 127.76 113.67
Net Current Assets 73.62 83.82 61.83 10.94
TOTAL 301.97 335.49 451.21 363.61

Speed | Innovation | Happiness
Bilcare Limited
Worlds largest Pharmaceutical
Packaging Company
Business in over 100 countries
worldwide, and growing
Patented nCID Technology under commercialization
Focus on Research & technology
Strong Assets base and Profitability
numbers
29Bilcare Limited, 601, ICC Trade Tower, Pune, India (Corporate office)
www.bilcare.com