Bilateral Free Trade Agreements in SAARC and...
21
4 Bilateral Free Trade Agreements in SAARC and Implications for SAFTA Deshal de Mel 1. INTRODUCTION R egional economic integration within South Asia had been mooted since the early 1990s. The emergence of the South Asian Preferential Trade Agreement (SAPTA) in 1995 followed by the decision to deepen it to a South Asian Free Trade Agreement (SAFTA) in 1996 sug- gested that there was limited rationale for bilateral trade agreements within the region to emerge. However, the SAPTA had covered limited product lines of trade interests and, when efforts at regional economic integration came to a deadlock in 1998 following competing nuclear tests by the two largest countries in South Asia, countries looked at bilateralism with greater interest. Sri Lanka is involved in both bilateral trade agreements that have emerged within the region. The first was with India, signed in 1998 and implemented in March 2000, and the second was with Pakistan, which came into effect in June 2005. Although both agreements provided Sri Lanka with important market access to its main trading partners in the region, the fact that the three most developed countries within South Asian Association for Regional Cooperation (SAARC) have entered into bilateral trade agreements threatens the significance of SAFTA. Given the
Transcript of Bilateral Free Trade Agreements in SAARC and...
4
Bilateral Free Trade Agreements in SAARC and Implications for SAFTA
Deshal de Mel
1. INTRODUCTION
Regional economic integration within South Asia had been mooted since the early 1990s. The emergence of the South Asian Preferential Trade Agreement (SAPTA) in 1995 followed by the decision to
deepen it to a South Asian Free Trade Agreement (SAFTA) in 1996 sug-gested that there was limited rationale for bilateral trade agreements within the region to emerge. However, the SAPTA had covered limited product lines of trade interests and, when efforts at regional economic integration came to a deadlock in 1998 following competing nuclear tests by the two largest countries in South Asia, countries looked at bilateralism with greater interest. Sri Lanka is involved in both bilateral trade agreements that have emerged within the region. The fi rst was with India, signed in 1998 and implemented in March 2000, and the second was with Pakistan, which came into effect in June 2005. Although both agreements provided Sri Lanka with important market access to its main trading partners in the region, the fact that the three most developed countries within South Asian Association for Regional Cooperation (SAARC) have entered into bilateral trade agreements threatens the signifi cance of SAFTA. Given the
90 Deshal de Mel
current deadlock in the World Trade Organization (WTO), other South Asian countries (Bangladesh in particular) may consider the bilateral route of trade liberalization more seriously.
Eight years have passed since the commencement of the Indo–Sri Lanka FTA (ILFTA), and it is now possible to have a better idea of the implications of the agreement. Aggregate values show strong benefi ts for Sri Lanka in terms of export growth, but a more disaggregated analysis shows that the actual picture is less encouraging. The Pakistan–Sri Lanka FTA (PSFTA) has had limited impact on trade thus far, and the effi cacy of the agreement and lessons for other countries can be considered in this light. This chapter will examine the structure of each agreement and evaluate their impact on trade between Sri Lanka, India, and Pakistan. The chapter also touches on the position of the two agreements within the context of SAFTA and highlights some lessons that emerge for SAFTA and for other countries looking to sign bilateral agreements within the region. Section 2 will deal with the India–Sri Lanka FTA (ISFTA) with subsections touching on the structure of the agreement, economic impacts, and the moves toward the Comprehensive Economic Partnership Agreement (CEPA) between the two countries. Section 3 will deal with the PSFTA, and subsections will again touch on the structure, economic implications, and the way forward. Section 4 compares the two bilateral trade agreements with SAFTA and highlights lessons for other countries; Section 5 concludes.
2. INDO–SRI LANKA FTA
The ILFTA was the fi rst bilateral trade agreement that was signed by both Sri Lanka and India. The agreement was signed in the backdrop of expanding economic ties between the two countries following liberalization of the Indian economy in the early 1990s. While India had become one of Sri Lanka’s major import sources, exports to India remained low. With the deteriorating political relationship between India and Pakistan stalling progress on SAFTA, Sri Lanka and India were keen to forge ahead with a bilateral agreement to cement the improving economic integration between the two countries.
2.1 Structure of the AgreementLearning from the poor trade impact of the product-by-product approach of SAPTA, the ILFTA utilized a negative list approach to trade
Bilateral Free Trade Agreements in SAARC 91
liberalization. Thereby, all items would be liberalized except those deemed sensitive by each country. At the foundation of the agreement is that, given the asymmetry between India and Sri Lanka, there would be less than full reciprocity between the two countries. Several special and differential treatment measures were implemented to allow for this asymmetry.
2.1.1 Negative Lists
India’s negative list, with 429 tariff lines, was substantially smaller than that of Sri Lanka, which maintained 1,220 items on the negative list. Sri Lanka protected much of the agricultural sector and many other sectors for which particularly small and medium industries were perceived to be vulnerable to Indian competition. These included such sectors as rubber, ceramics, paper, and products thereof. Furthermore, revenue compen-sation was excluded from the agreement and, in lieu of this, Sri Lanka was allowed to maintain key revenue-earning items in the negative list. Therefore, products such as motor vehicles and parts—key imports from India—were kept in the negative list. Such measures were required to placate Sri Lankan domestic interests with regard to the perceived threat of “fl ooding” of Indian products and revenue implications. As a result, of the 1,180 items on Sri Lanka’s negative list, 712 were traded between the two countries at a value of US$912.3 million. Therefore, around 50 percent of India’s exports to Sri Lanka, in terms of value, were subject to the negative list and did not receive preferences under the FTA. On the other hand, 70 of the 429 items on India’s negative list were exported from Sri Lanka to India, accounting for 3.3 percent of Sri Lanka’s exports to India in value terms in 2006 (Weerakoon and Thennakoon 2008).
2.1.2 Tariff Liberalization Program
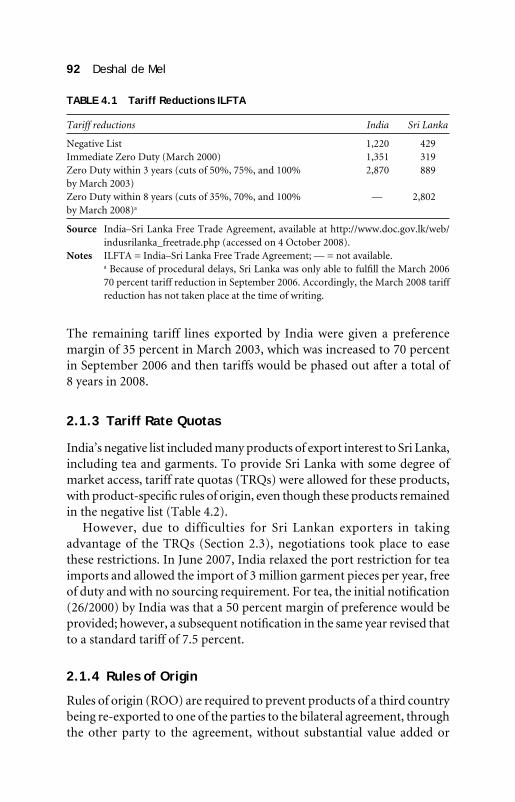
While India’s tariff liberalization program (TLP) would be completed over a period of three years, Sri Lanka was given eight years to complete its liberalization process, allowing domestic fi rms time to adjust to the shocks associated with trade liberalization. The TLP for both countries is summarized in Table 4.1.
India’s initial preferences to Sri Lanka were larger than Sri Lanka’s preferences to India. India provided immediate zero duty for 1,351 tariff lines compared with Sri Lanka’s 319 tariff lines and also provided 50 percent preference margins for the remaining 2,870 tariff lines (to be phased out over 3 years), while Sri Lanka did the same for 889 items.
92 Deshal de Mel
The remaining tariff lines exported by India were given a preference margin of 35 percent in March 2003, which was increased to 70 percent in September 2006 and then tariffs would be phased out after a total of 8 years in 2008.
2.1.3 Tariff Rate Quotas
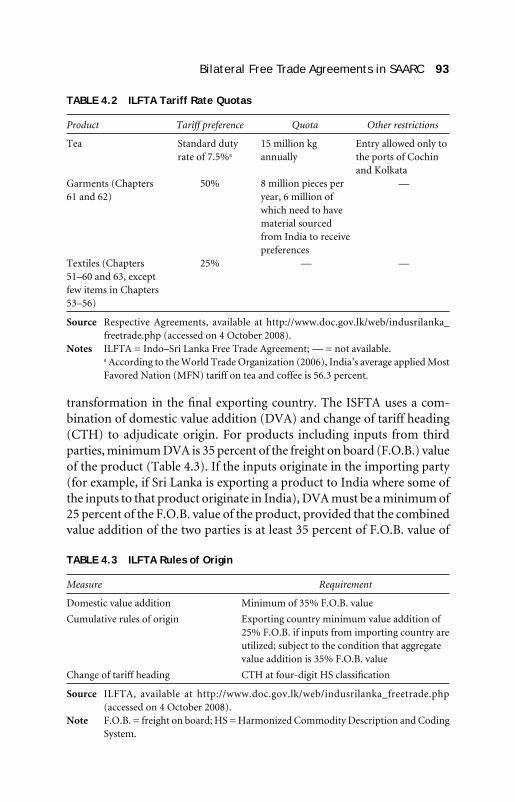
India’s negative list included many products of export interest to Sri Lanka, including tea and garments. To provide Sri Lanka with some degree of market access, tariff rate quotas (TRQs) were allowed for these products, with product-specifi c rules of origin, even though these products remained in the negative list (Table 4.2).
However, due to difficulties for Sri Lankan exporters in taking advantage of the TRQs (Section 2.3), negotiations took place to ease these restrictions. In June 2007, India relaxed the port restriction for tea imports and allowed the import of 3 million garment pieces per year, free of duty and with no sourcing requirement. For tea, the initial notifi cation (26/2000) by India was that a 50 percent margin of preference would be provided; however, a subsequent notifi cation in the same year revised that to a standard tariff of 7.5 percent.
2.1.4 Rules of Origin
Rules of origin (ROO) are required to prevent products of a third country being re-exported to one of the parties to the bilateral agreement, through the other party to the agreement, without substantial value added or
TABLE 4.1 Tariff Reductions ILFTA
Tariff reductions India Sri Lanka
Negative List 1,220 429Immediate Zero Duty (March 2000) 1,351 319Zero Duty within 3 years (cuts of 50%, 75%, and 100% by March 2003)
2,870 889
Zero Duty within 8 years (cuts of 35%, 70%, and 100% by March 2008)a
— 2,802
Source India–Sri Lanka Free Trade Agreement, available at http://www.doc.gov.lk/web/indusrilanka_freetrade.php (accessed on 4 October 2008).
Notes ILFTA = India–Sri Lanka Free Trade Agreement; — = not available. a Because of procedural delays, Sri Lanka was only able to fulfi ll the March 2006
70 percent tariff reduction in September 2006. Accordingly, the March 2008 tariff reduction has not taken place at the time of writing.
Bilateral Free Trade Agreements in SAARC 93
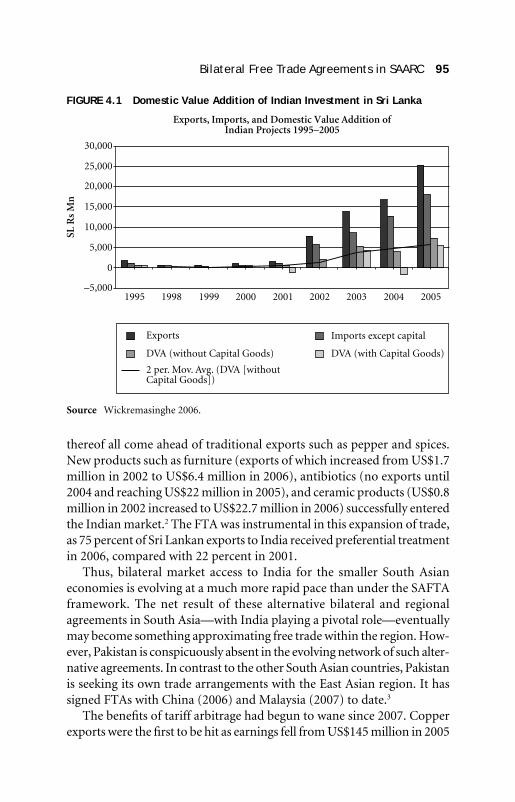
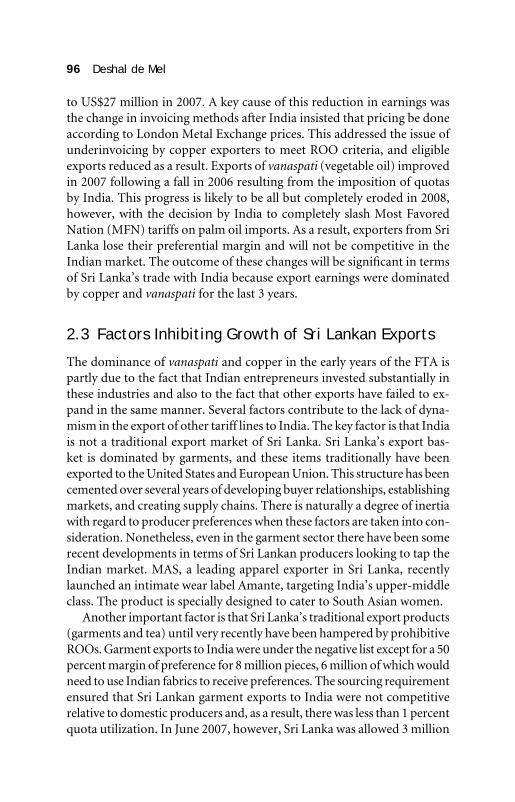
transformation in the fi nal exporting country. The ISFTA uses a com-bination of domestic value addition (DVA) and change of tariff heading (CTH) to adjudicate origin. For products including inputs from third parties, minimum DVA is 35 percent of the freight on board (F.O.B.) value of the product (Table 4.3). If the inputs originate in the importing party (for example, if Sri Lanka is exporting a product to India where some of the inputs to that product originate in India), DVA must be a minimum of 25 percent of the F.O.B. value of the product, provided that the combined value addition of the two parties is at least 35 percent of F.O.B. value of
TABLE 4.2 ILFTA Tariff Rate Quotas
Product Tariff preference Quota Other restrictions
Tea Standard duty rate of 7.5%a
15 million kg annually
Entry allowed only to the ports of Cochin and Kolkata
Garments (Chapters61 and 62)
50% 8 million pieces per year, 6 million of which need to have material sourced from India to receive preferences
—
Textiles (Chapters 51–60 and 63, except few items in Chapters 53–56)
25% — —
Source Respective Agreements, available at http://www.doc.gov.lk/web/indusrilanka_freetrade.php (accessed on 4 October 2008).
Notes ILFTA = Indo–Sri Lanka Free Trade Agreement; — = not available. a According to the World Trade Organization (2006), India’s average applied Most
Favored Nation (MFN) tariff on tea and coffee is 56.3 percent.
TABLE 4.3 ILFTA Rules of Origin
Measure Requirement
Domestic value addition Minimum of 35% F.O.B. value
Cumulative rules of origin Exporting country minimum value addition of 25% F.O.B. if inputs from importing country are utilized; subject to the condition that aggregate value addition is 35% F.O.B. value
Change of tariff heading CTH at four-digit HS classifi cation
Source ILFTA, available at http://www.doc.gov.lk/web/indusrilanka_freetrade.php (accessed on 4 October 2008).
Note F.O.B. = freight on board; HS = Harmonized Commodity Description and Coding System.
94 Deshal de Mel
the product. In addition to fulfi lling the DVA criteria, the fi nal product being exported must have a different classifi cation, according to the Harmonized Commodity Description and Coding System (HS Code) at the four-digit level, from all of its constituent inputs.
2.2 Economic ImpactsEven before the FTA was implemented, India had become a signifi cant source of Sri Lankan imports. In 1999, India accounted for 8.6 percent of Sri Lanka’s total import basket and was the second highest source of imports (with Japan being the highest). Sri Lankan exports to India were not substantial before the FTA, with total exports in 1999 being a mere US$47 million, around 1 percent of total exports, and India not even being among Sri Lanka’s top 10 export destinations. Furthermore, in 1999 Sri Lanka’s trade defi cit with India was substantial (US$463 million) with an import–export ratio of 10.5:1. In 1999, Sri Lanka’s main exports to India were in primary products—mainly agriculture and unprocessed metals. The major exports included pepper, which made up 20 percent, and areca nuts, which made up 11 percent, while such products as waste steel and waste paper made up 8 percent and 5.5 percent, respectively. It is clear from this passage that before the FTA, Sri Lanka’s trade with India was limited in terms of both value and industrial depth. While the trade balance was weighted toward India, this was not compensated by investment fl ows. Foreign direct investment (FDI) from India to Sri Lanka was limited, with cumulative investment as of 1998 a mere Sri Lankan Rupees (SL Rs)165 million (US$2.5 million1 or 1.3 percent of total FDI).
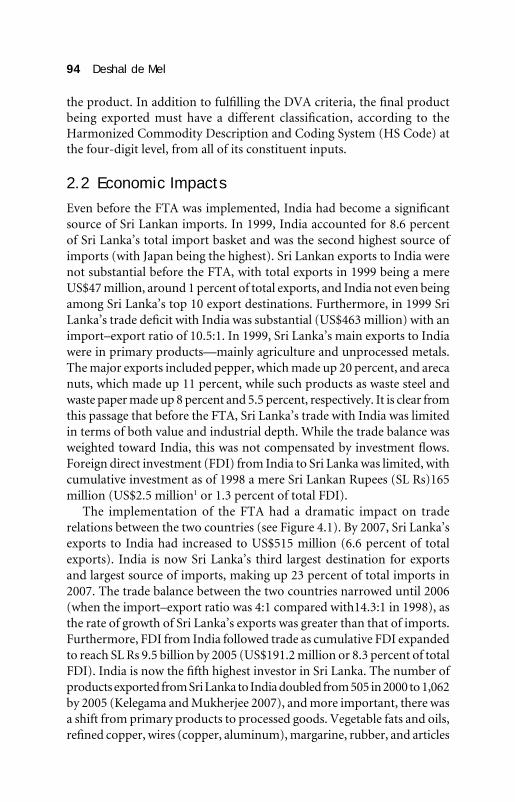
The implementation of the FTA had a dramatic impact on trade relations between the two countries (see Figure 4.1). By 2007, Sri Lanka’s exports to India had increased to US$515 million (6.6 percent of total exports). India is now Sri Lanka’s third largest destination for exports and largest source of imports, making up 23 percent of total imports in 2007. The trade balance between the two countries narrowed until 2006 (when the import–export ratio was 4:1 compared with14.3:1 in 1998), as the rate of growth of Sri Lanka’s exports was greater than that of imports. Furthermore, FDI from India followed trade as cumulative FDI expanded to reach SL Rs 9.5 billion by 2005 (US$191.2 million or 8.3 percent of total FDI). India is now the fi fth highest investor in Sri Lanka. The number of products exported from Sri Lanka to India doubled from 505 in 2000 to 1,062 by 2005 (Kelegama and Mukherjee 2007), and more important, there was a shift from primary products to processed goods. Vegetable fats and oils, refi ned copper, wires (copper, aluminum), margarine, rubber, and articles
Bilateral Free Trade Agreements in SAARC 95
thereof all come ahead of traditional exports such as pepper and spices. New products such as furniture (exports of which increased from US$1.7 million in 2002 to US$6.4 million in 2006), antibiotics (no exports until 2004 and reaching US$22 million in 2005), and ceramic products (US$0.8 million in 2002 increased to US$22.7 million in 2006) successfully entered the Indian market.2 The FTA was instrumental in this expansion of trade, as 75 percent of Sri Lankan exports to India received preferential treatment in 2006, compared with 22 percent in 2001.
Thus, bilateral market access to India for the smaller South Asian economies is evolving at a much more rapid pace than under the SAFTA framework. The net result of these alternative bilateral and regional agreements in South Asia—with India playing a pivotal role—eventually may become something approximating free trade within the region. How-ever, Pakistan is conspicuously absent in the evolving network of such alter-native agreements. In contrast to the other South Asian countries, Pakistan is seeking its own trade arrangements with the East Asian region. It has signed FTAs with China (2006) and Malaysia (2007) to date.3
The benefi ts of tariff arbitrage had begun to wane since 2007. Copper exports were the fi rst to be hit as earnings fell from US$145 million in 2005
FIGURE 4.1 Domestic Value Addition of Indian Investment in Sri Lanka
Source Wickremasinghe 2006.
96 Deshal de Mel
to US$27 million in 2007. A key cause of this reduction in earnings was the change in invoicing methods after India insisted that pricing be done according to London Metal Exchange prices. This addressed the issue of underinvoicing by copper exporters to meet ROO criteria, and eligible exports reduced as a result. Exports of vanaspati (vegetable oil) improved in 2007 following a fall in 2006 resulting from the imposition of quotas by India. This progress is likely to be all but completely eroded in 2008, however, with the decision by India to completely slash Most Favored Nation (MFN) tariffs on palm oil imports. As a result, exporters from Sri Lanka lose their preferential margin and will not be competitive in the Indian market. The outcome of these changes will be signifi cant in terms of Sri Lanka’s trade with India because export earnings were dominated by copper and vanaspati for the last 3 years.
2.3 Factors Inhibiting Growth of Sri Lankan Exports
The dominance of vanaspati and copper in the early years of the FTA is partly due to the fact that Indian entrepreneurs invested substantially in these industries and also to the fact that other exports have failed to ex-pand in the same manner. Several factors contribute to the lack of dyna-mism in the export of other tariff lines to India. The key factor is that India is not a traditional export market of Sri Lanka. Sri Lanka’s export bas-ket is dominated by garments, and these items traditionally have been exported to the United States and European Union. This structure has been cemented over several years of developing buyer relationships, establishing markets, and creating supply chains. There is naturally a degree of inertia with regard to producer preferences when these factors are taken into con-sideration. Nonetheless, even in the garment sector there have been some recent developments in terms of Sri Lankan producers looking to tap the Indian market. MAS, a leading apparel exporter in Sri Lanka, recently launched an intimate wear label Amante, targeting India’s upper-middle class. The product is specially designed to cater to South Asian women.
Another important factor is that Sri Lanka’s traditional export products (garments and tea) until very recently have been hampered by prohibitive ROOs. Garment exports to India were under the negative list except for a 50 percent margin of preference for 8 million pieces, 6 million of which would need to use Indian fabrics to receive preferences. The sourcing requirement ensured that Sri Lankan garment exports to India were not competitive relative to domestic producers and, as a result, there was less than 1 percent quota utilization. In June 2007, however, Sri Lanka was allowed 3 million
Bilateral Free Trade Agreements in SAARC 97
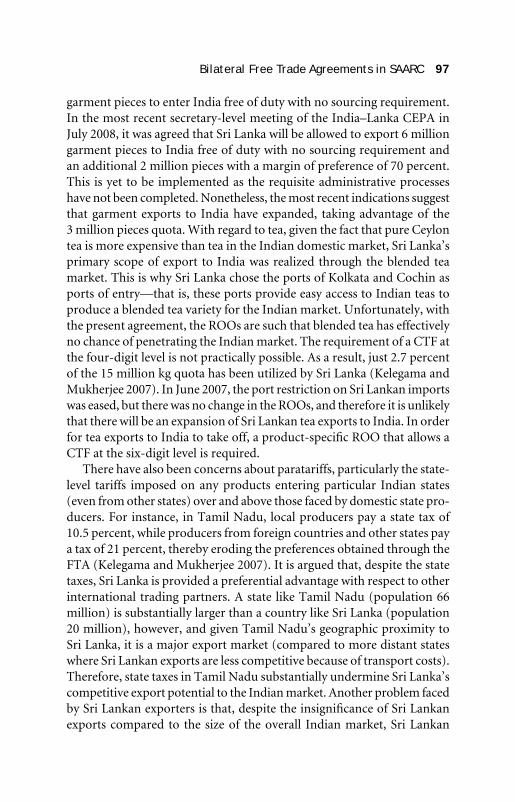
garment pieces to enter India free of duty with no sourcing requirement. In the most recent secretary-level meeting of the India–Lanka CEPA in July 2008, it was agreed that Sri Lanka will be allowed to export 6 million garment pieces to India free of duty with no sourcing requirement and an additional 2 million pieces with a margin of preference of 70 percent. This is yet to be implemented as the requisite administrative processes have not been completed. Nonetheless, the most recent indications suggest that garment exports to India have expanded, taking advantage of the 3 million pieces quota. With regard to tea, given the fact that pure Ceylon tea is more expensive than tea in the Indian domestic market, Sri Lanka’s primary scope of export to India was realized through the blended tea market. This is why Sri Lanka chose the ports of Kolkata and Cochin as ports of entry—that is, these ports provide easy access to Indian teas to produce a blended tea variety for the Indian market. Unfortunately, with the present agreement, the ROOs are such that blended tea has effectively no chance of penetrating the Indian market. The requirement of a CTF at the four-digit level is not practically possible. As a result, just 2.7 percent of the 15 million kg quota has been utilized by Sri Lanka (Kelegama and Mukherjee 2007). In June 2007, the port restriction on Sri Lankan imports was eased, but there was no change in the ROOs, and therefore it is unlikely that there will be an expansion of Sri Lankan tea exports to India. In order for tea exports to India to take off, a product-specifi c ROO that allows a CTF at the six-digit level is required.
There have also been concerns about paratariffs, particularly the state-level tariffs imposed on any products entering particular Indian states (even from other states) over and above those faced by domestic state pro-ducers. For instance, in Tamil Nadu, local producers pay a state tax of 10.5 percent, while producers from foreign countries and other states pay a tax of 21 percent, thereby eroding the preferences obtained through the FTA (Kelegama and Mukherjee 2007). It is argued that, despite the state taxes, Sri Lanka is provided a preferential advantage with respect to other international trading partners. A state like Tamil Nadu (population 66 million) is substantially larger than a country like Sri Lanka (population 20 million), however, and given Tamil Nadu’s geographic proximity to Sri Lanka, it is a major export market (compared to more distant states where Sri Lankan exports are less competitive because of transport costs). Therefore, state taxes in Tamil Nadu substantially undermine Sri Lanka’s competitive export potential to the Indian market. Another problem faced by Sri Lankan exporters is that, despite the insignifi cance of Sri Lankan exports compared to the size of the overall Indian market, Sri Lankan
98 Deshal de Mel
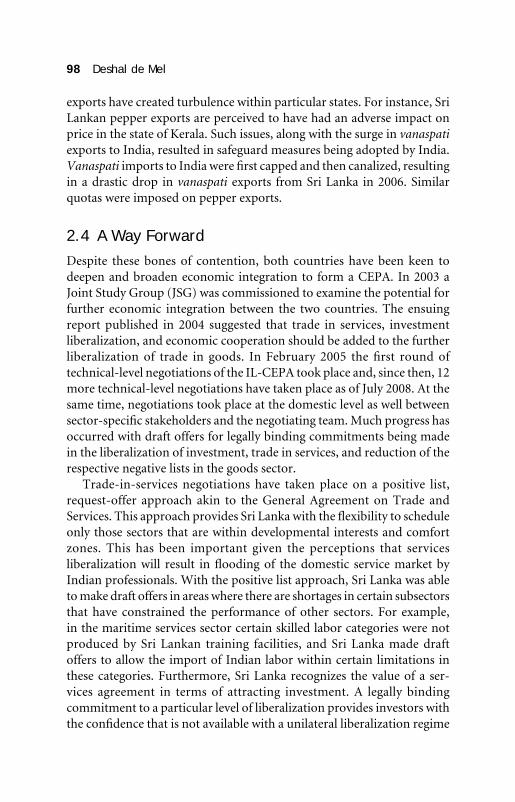
exports have created turbulence within particular states. For instance, Sri Lankan pepper exports are perceived to have had an adverse impact on price in the state of Kerala. Such issues, along with the surge in vanaspati exports to India, resulted in safeguard measures being adopted by India. Vanaspati imports to India were fi rst capped and then canalized, resulting in a drastic drop in vanaspati exports from Sri Lanka in 2006. Similar quotas were imposed on pepper exports.
2.4 A Way Forward Despite these bones of contention, both countries have been keen to deepen and broaden economic integration to form a CEPA. In 2003 a Joint Study Group (JSG) was commissioned to examine the potential for further economic integration between the two countries. The ensuing report published in 2004 suggested that trade in services, investment liberalization, and economic cooperation should be added to the further liberalization of trade in goods. In February 2005 the fi rst round of technical-level negotiations of the IL-CEPA took place and, since then, 12 more technical-level negotiations have taken place as of July 2008. At the same time, negotiations took place at the domestic level as well between sector-specifi c stakeholders and the negotiating team. Much progress has occurred with draft offers for legally binding commitments being made in the liberalization of investment, trade in services, and reduction of the respective negative lists in the goods sector.
Trade-in-services negotiations have taken place on a positive list, request-offer approach akin to the General Agreement on Trade and Services. This approach provides Sri Lanka with the fl exibility to schedule only those sectors that are within developmental interests and comfort zones. This has been important given the perceptions that services liberalization will result in fl ooding of the domestic service market by Indian professionals. With the positive list approach, Sri Lanka was able to make draft offers in areas where there are shortages in certain subsectors that have constrained the performance of other sectors. For example, in the maritime services sector certain skilled labor categories were not produced by Sri Lankan training facilities, and Sri Lanka made draft offers to allow the import of Indian labor within certain limitations in these categories. Furthermore, Sri Lanka recognizes the value of a ser-vices agreement in terms of attracting investment. A legally binding commitment to a particular level of liberalization provides investors with the confi dence that is not available with a unilateral liberalization regime
Bilateral Free Trade Agreements in SAARC 99
that can be backtracked overnight. Many economies are at present negotiating agreements with India, recognizing the fact that India will undoubtedly become an economic superpower sooner rather than later. The European Union, Association of Southeast Asian Nations (ASEAN), and countries like the Republic of Korea are in the process of negotiating similar agreements and, unsurprisingly, Singapore beat them all to it. Thus, in terms of export interest as well, it is important from a Sri Lankan perspective to secure legally binding market access to the Indian eco-nomy. This applies to trade in goods, services, and investment. The current level of liberalization in any country is contingent on both the domestic and international political economic climate. A shift toward a more protectionist regime could reverse the progress made in economic liberalization. In such a scenario, only a legally binding framework could ensure the continuation of at least the present status quo.
3. PAKISTAN–SRI LANKA FTA
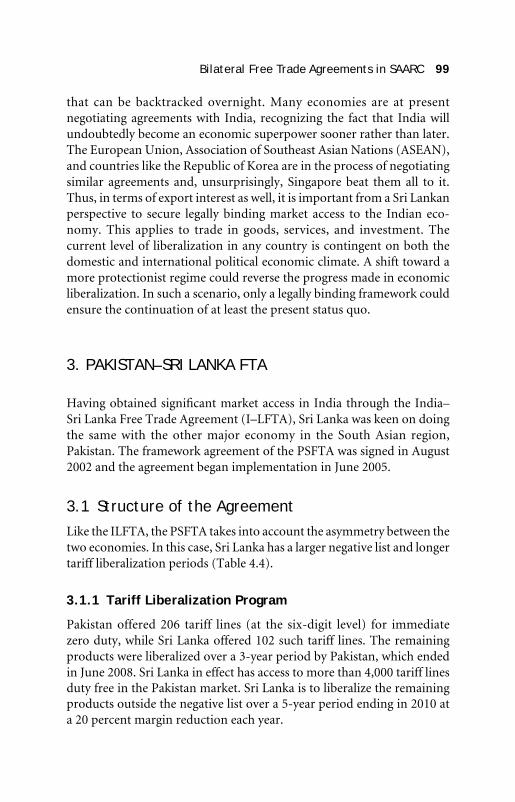
Having obtained signifi cant market access in India through the India–Sri Lanka Free Trade Agreement (I–LFTA), Sri Lanka was keen on doing the same with the other major economy in the South Asian region, Pakistan. The framework agreement of the PSFTA was signed in August 2002 and the agreement began implementation in June 2005.
3.1 Structure of the AgreementLike the ILFTA, the PSFTA takes into account the asymmetry between the two economies. In this case, Sri Lanka has a larger negative list and longer tariff liberalization periods (Table 4.4).
3.1.1 Tariff Liberalization Program
Pakistan offered 206 tariff lines (at the six-digit level) for immediate zero duty, while Sri Lanka offered 102 such tariff lines. The remaining products were liberalized over a 3-year period by Pakistan, which ended in June 2008. Sri Lanka in effect has access to more than 4,000 tariff lines duty free in the Pakistan market. Sri Lanka is to liberalize the remaining products outside the negative list over a 5-year period ending in 2010 at a 20 percent margin reduction each year.
100 Deshal de Mel
3.1.2 Negative Lists
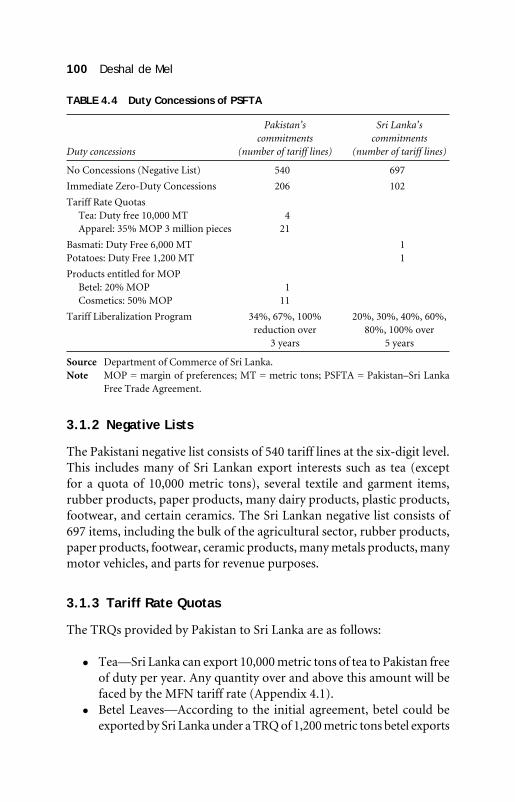
The Pakistani negative list consists of 540 tariff lines at the six-digit level. This includes many of Sri Lankan export interests such as tea (except for a quota of 10,000 metric tons), several textile and garment items, rubber products, paper products, many dairy products, plastic products, footwear, and certain ceramics. The Sri Lankan negative list consists of 697 items, including the bulk of the agricultural sector, rubber products, paper products, footwear, ceramic products, many metals products, many motor vehicles, and parts for revenue purposes.
3.1.3 Tariff Rate Quotas
The TRQs provided by Pakistan to Sri Lanka are as follows:
Tea—Sri Lanka can export 10,000 metric tons of tea to Pakistan free of duty per year. Any quantity over and above this amount will be faced by the MFN tariff rate (Appendix 4.1).
Betel Leaves—According to the initial agreement, betel could be exported by Sri Lanka under a TRQ of 1,200 metric tons betel exports
TABLE 4.4 Duty Concessions of PSFTA
Duty concessions
Pakistan’s commitments
(number of tariff lines)
Sri Lanka’s commitments
(number of tariff lines)
No Concessions (Negative List) 540 697
Immediate Zero-Duty Concessions 206 102
Tariff Rate Quotas Tea: Duty free 10,000 MTApparel: 35% MOP 3 million pieces
421
Basmati: Duty Free 6,000 MT Potatoes: Duty Free 1,200 MT
11
Products entitled for MOPBetel: 20% MOP Cosmetics: 50% MOP
111
Tariff Liberalization Program 34%, 67%, 100% reduction over
3 years
20%, 30%, 40%, 60%, 80%, 100% over
5 years
Source Department of Commerce of Sri Lanka.Note MOP = margin of preferences; MT = metric tons; PSFTA = Pakistan–Sri Lanka
Free Trade Agreement.
Bilateral Free Trade Agreements in SAARC 101
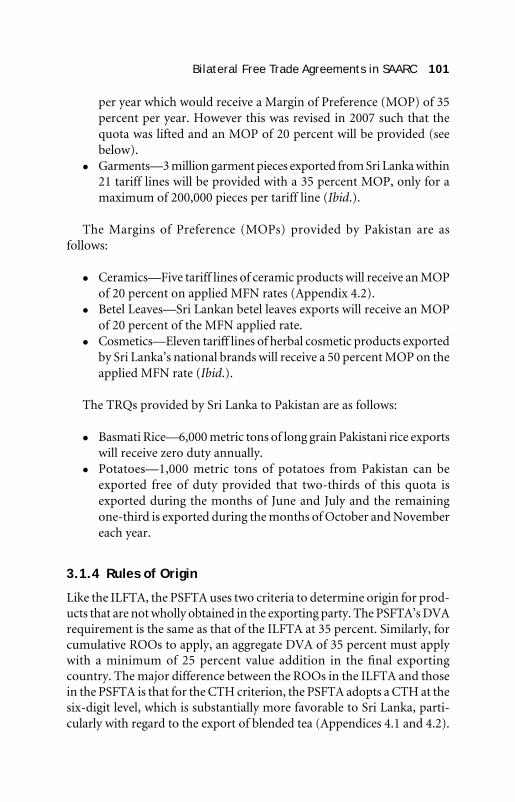
per year which would receive a Margin of Preference (MOP) of 35 percent per year. However this was revised in 2007 such that the quota was lifted and an MOP of 20 percent will be provided (see below).
Garments—3 million garment pieces exported from Sri Lanka within 21 tariff lines will be provided with a 35 percent MOP, only for a maximum of 200,000 pieces per tariff line (Ibid.).
The Margins of Preference (MOPs) provided by Pakistan are as follows:
Ceramics—Five tariff lines of ceramic products will receive an MOP of 20 percent on applied MFN rates (Appendix 4.2).
Betel Leaves—Sri Lankan betel leaves exports will receive an MOP of 20 percent of the MFN applied rate.
Cosmetics—Eleven tariff lines of herbal cosmetic products exported by Sri Lanka’s national brands will receive a 50 percent MOP on the applied MFN rate (Ibid.).
The TRQs provided by Sri Lanka to Pakistan are as follows:
Basmati Rice—6,000 metric tons of long grain Pakistani rice exports will receive zero duty annually.
Potatoes—1,000 metric tons of potatoes from Pakistan can be exported free of duty provided that two-thirds of this quota is exported during the months of June and July and the remaining one-third is exported during the months of October and November each year.
3.1.4 Rules of Origin
Like the ILFTA, the PSFTA uses two criteria to determine origin for prod-ucts that are not wholly obtained in the exporting party. The PSFTA’s DVA requirement is the same as that of the ILFTA at 35 percent. Similarly, for cumulative ROOs to apply, an aggregate DVA of 35 percent must apply with a minimum of 25 percent value addition in the fi nal exporting country. The major difference between the ROOs in the ILFTA and those in the PSFTA is that for the CTH criterion, the PSFTA adopts a CTH at the six-digit level, which is substantially more favorable to Sri Lanka, parti-cularly with regard to the export of blended tea (Appendices 4.1 and 4.2).
102 Deshal de Mel
3.2 Economic Impacts
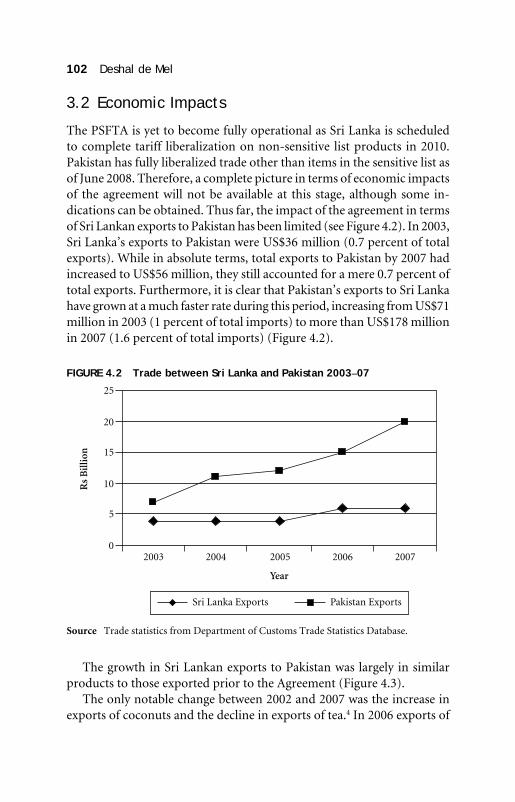
The PSFTA is yet to become fully operational as Sri Lanka is scheduled to complete tariff liberalization on non-sensitive list products in 2010. Pakistan has fully liberalized trade other than items in the sensitive list as of June 2008. Therefore, a complete picture in terms of economic impacts of the agreement will not be available at this stage, although some in-dications can be obtained. Thus far, the impact of the agreement in terms of Sri Lankan exports to Pakistan has been limited (see Figure 4.2). In 2003, Sri Lanka’s exports to Pakistan were US$36 million (0.7 percent of total exports). While in absolute terms, total exports to Pakistan by 2007 had increased to US$56 million, they still accounted for a mere 0.7 percent of total exports. Furthermore, it is clear that Pakistan’s exports to Sri Lanka have grown at a much faster rate during this period, increasing from US$71 million in 2003 (1 percent of total imports) to more than US$178 million in 2007 (1.6 percent of total imports) (Figure 4.2).
FIGURE 4.2 Trade between Sri Lanka and Pakistan 2003–07
Source Trade statistics from Department of Customs Trade Statistics Database.
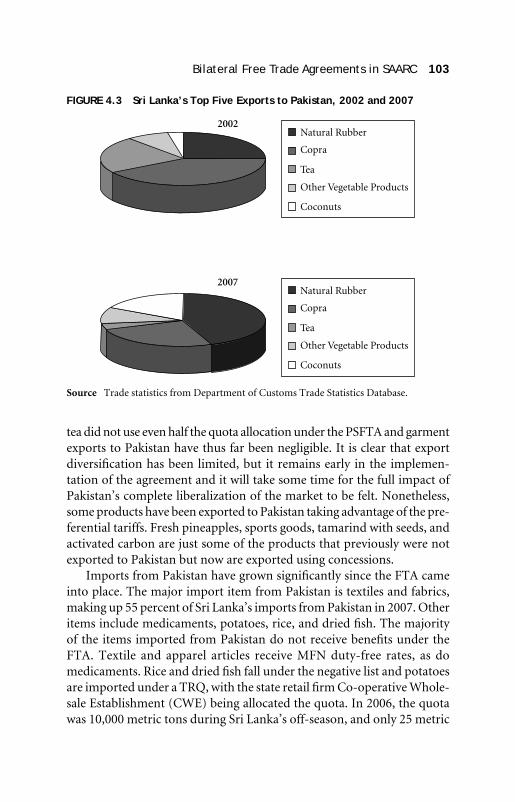
The growth in Sri Lankan exports to Pakistan was largely in similar products to those exported prior to the Agreement (Figure 4.3).
The only notable change between 2002 and 2007 was the increase in exports of coconuts and the decline in exports of tea.4 In 2006 exports of
Bilateral Free Trade Agreements in SAARC 103
tea did not use even half the quota allocation under the PSFTA and garment exports to Pakistan have thus far been negligible. It is clear that export diversifi cation has been limited, but it remains early in the implemen-tation of the agreement and it will take some time for the full impact of Pakistan’s complete liberalization of the market to be felt. Nonetheless, some products have been exported to Pakistan taking advantage of the pre-ferential tariffs. Fresh pineapples, sports goods, tamarind with seeds, and activated carbon are just some of the products that previously were not exported to Pakistan but now are exported using concessions.
Imports from Pakistan have grown signifi cantly since the FTA came into place. The major import item from Pakistan is textiles and fabrics, making up 55 percent of Sri Lanka’s imports from Pakistan in 2007. Other items include medicaments, potatoes, rice, and dried fi sh. The majority of the items imported from Pakistan do not receive benefi ts under the FTA. Textile and apparel articles receive MFN duty-free rates, as do medicaments. Rice and dried fi sh fall under the negative list and potatoes are imported under a TRQ, with the state retail fi rm Co-operative Whole-sale Establishment (CWE) being allocated the quota. In 2006, the quota was 10,000 metric tons during Sri Lanka’s off-season, and only 25 metric
FIGURE 4.3 Sri Lanka’s Top Five Exports to Pakistan, 2002 and 2007
Source Trade statistics from Department of Customs Trade Statistics Database.
104 Deshal de Mel
tons was imported by the CWE from Pakistan in that year (State of the Economy 2008).
3.3 A Way Forward
At the fi rst PSFTA review meeting, both countries agreed to deepen the existing FTA to form a CEPA. Thus far, one round of technical-level ne-gotiations has taken place and the CEPA is due to include trade in ser-vices and investment and to deepen commitments in trade in goods by gradually reducing the size of negative lists. In terms of moving forward with economic relations between Sri Lanka and Pakistan, the CEPA is a rational move because it would at least bind existing levels of liberal-ization between the two countries. As with the case of India, it would take time for Sri Lankan producers to shift preferences and consider new markets such as Pakistan to which certain niche products could be successfully exported.
4. COMPARISON WITH SAFTA
Despite the fact that regional economic liberalization in South Asia (SAPTA commenced in 1995) began a long time before bilateral liberalization took place in the region (ILFTA began implementation in 2000), the existing bilateral agreements have signifi cantly outpaced regional agreements. Fur-thermore, the depth of preferences available in both bilateral agreements is substantially greater than those of SAFTA. As a result, there is a risk that the relevance of SAFTA is diminished for countries that do enter into bilateral agreements within the region. This is certainly the case for Sri Lanka, as it has deeper access to the two largest markets in the region than what will be possible through SAFTA. This section will examine some of the differences in the agreements and suggest some steps that can be taken in SAFTA to remedy the situation.
4.1 Differences in the Structures of the Agreements
4.1.1 Negative Lists
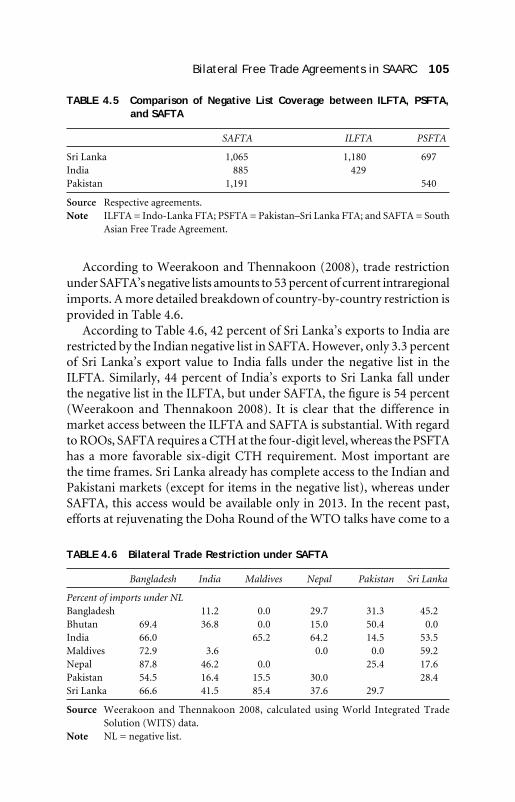
The negative lists of India, Pakistan, and Sri Lanka in SAFTA are sub-stantially larger than those in the respective bilateral trade agreements (Table 4.5).
Bilateral Free Trade Agreements in SAARC 105
According to Weerakoon and Thennakoon (2008), trade restriction under SAFTA’s negative lists amounts to 53 percent of current intraregional imports. A more detailed breakdown of country-by-country restriction is provided in Table 4.6.
According to Table 4.6, 42 percent of Sri Lanka’s exports to India are restricted by the Indian negative list in SAFTA. However, only 3.3 percent of Sri Lanka’s export value to India falls under the negative list in the ILFTA. Similarly, 44 percent of India’s exports to Sri Lanka fall under the negative list in the ILFTA, but under SAFTA, the fi gure is 54 percent (Weerakoon and Thennakoon 2008). It is clear that the difference in market access between the ILFTA and SAFTA is substantial. With regard to ROOs, SAFTA requires a CTH at the four-digit level, whereas the PSFTA has a more favorable six-digit CTH requirement. Most important are the time frames. Sri Lanka already has complete access to the Indian and Pakistani markets (except for items in the negative list), whereas under SAFTA, this access would be available only in 2013. In the recent past, efforts at rejuvenating the Doha Round of the WTO talks have come to a
TABLE 4.5 Comparison of Negative List Coverage between ILFTA, PSFTA, and SAFTA
SAFTA ILFTA PSFTA
Sri Lanka 1,065 1,180 697India 885 429Pakistan 1,191 540
Source Respective agreements.Note ILFTA = Indo-Lanka FTA; PSFTA = Pakistan–Sri Lanka FTA; and SAFTA = South
Asian Free Trade Agreement.
TABLE 4.6 Bilateral Trade Restriction under SAFTA
Bangladesh India Maldives Nepal Pakistan Sri Lanka
Percent of imports under NLBangladesh 11.2 0.0 29.7 31.3 45.2Bhutan 69.4 36.8 0.0 15.0 50.4 0.0India 66.0 65.2 64.2 14.5 53.5Maldives 72.9 3.6 0.0 0.0 59.2Nepal 87.8 46.2 0.0 25.4 17.6Pakistan 54.5 16.4 15.5 30.0 28.4Sri Lanka 66.6 41.5 85.4 37.6 29.7
Source Weerakoon and Thennakoon 2008, calculated using World Integrated Trade Solution (WITS) data.
Note NL = negative list.
106 Deshal de Mel
standstill, and in this backdrop, other South Asian countries, particularly Bangladesh, have been considering the possibility of engaging in Bilateral FTAs with other SAARC members—further threatening the relevance of SAFTA.
4.2 Improvements Required in SAFTA
Despite the identifi ed drawbacks in SAFTA, improvement in the agreement could salvage some degree of relevance. In the TLP, SAFTA could identify some heavily traded products in the region and provide a fast-track liber-alization process for these items. In terms of trade coverage, the agreement could incorporate a binding provision to reduce the size of negative lists. As it stands, the agreement only has a vague best endeavors clause to reduce the size of negative lists within a 4-year time horizon; however, there is no binding provision. Nontariff barriers (NTBs) continue to be a problem in the implementation of the bilateral agreements, and SAFTA could score in this area if it incorporates binding commitments for the reduction of NTBs. Trade facilitation is included in SAFTA, but again it is in the form of best endeavors clauses with limited practical realism. It would be more practical to tackle a few key areas of trade facilitation, such as simplifi cation of customs operations, transit procedures, and standards harmonization, and implement binding requirements on these measures, with special anddifferential treatment for least developed countries (LDCs). Finally, although CEPAs are being negotiated in the ILFTA and the PSFTA, they have not been implemented as yet. SAFTA, as it stands, covers only trade in goods, and to be a meaningful agreement, it must incorporate trade in services more substantially than what will be covered in the India–Lanka CEPA and Pakistan–Sri Lanka CEPA. In this regard, it is important to consider innovative measures to encourage commitments by the respective members, such as the common subsector approach5 that was adopted in ASEAN. If such steps are adopted, SAFTA could still capture the interest of member countries and provide a useful format for regional economic cooperation.
5. CONCLUSION
This chapter examines the bilateral trade agreements that Sri Lanka has implemented with India and Pakistan, providing analysis on the structure
Bilateral Free Trade Agreements in SAARC 107
of the respective agreements and their trade impacts. It was found that although the agreements have provided signifi cant market access to Sri Lanka, full advantage has not been taken of this market access for a combination of reasons. Certain impediments to trade remain despite the existence of the FTAs. Furthermore, Sri Lankan entrepreneurs need to be more open to diversifying from traditional export markets in the United States and European Union and need to consider markets in neighboring countries as well. Finally, a comparison of bilateral agreements with SAFTA found that the latter requires much improvement to have an impact on trade within the region.
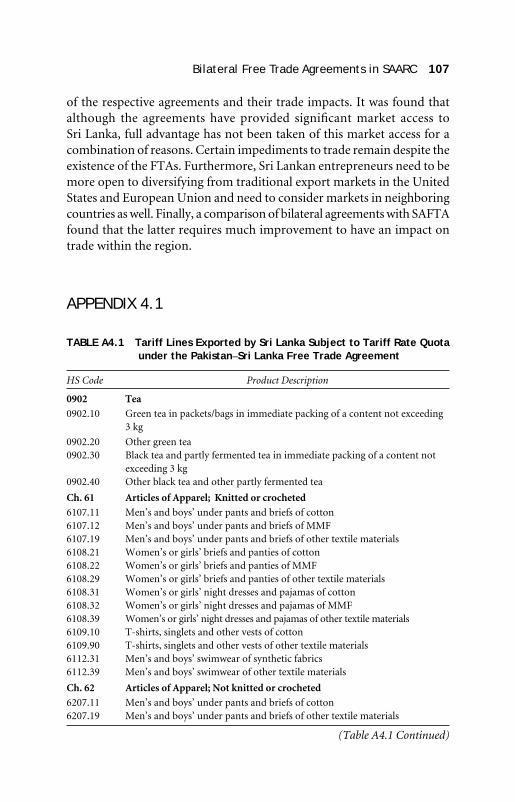
APPENDIX 4.1
TABLE A4.1 Tariff Lines Exported by Sri Lanka Subject to Tariff Rate Quota under the Pakistan–Sri Lanka Free Trade Agreement
HS Code Product Description
0902 Tea
0902.10 Green tea in packets/bags in immediate packing of a content not exceeding 3 kg
0902.20 Other green tea0902.30 Black tea and partly fermented tea in immediate packing of a content not
exceeding 3 kg0902.40 Other black tea and other partly fermented tea
Ch. 61 Articles of Apparel; Knitted or crocheted
6107.11 Men’s and boys’ under pants and briefs of cotton6107.12 Men’s and boys’ under pants and briefs of MMF6107.19 Men’s and boys’ under pants and briefs of other textile materials6108.21 Women’s or girls’ briefs and panties of cotton 6108.22 Women’s or girls’ briefs and panties of MMF6108.29 Women’s or girls’ briefs and panties of other textile materials 6108.31 Women’s or girls’ night dresses and pajamas of cotton 6108.32 Women’s or girls’ night dresses and pajamas of MMF6108.39 Women’s or girls’ night dresses and pajamas of other textile materials6109.10 T-shirts, singlets and other vests of cotton6109.90 T-shirts, singlets and other vests of other textile materials6112.31 Men’s and boys’ swimwear of synthetic fabrics 6112.39 Men’s and boys’ swimwear of other textile materials
Ch. 62 Articles of Apparel; Not knitted or crocheted
6207.11 Men’s and boys’ under pants and briefs of cotton6207.19 Men’s and boys’ under pants and briefs of other textile materials
(Table A4.1 Continued)
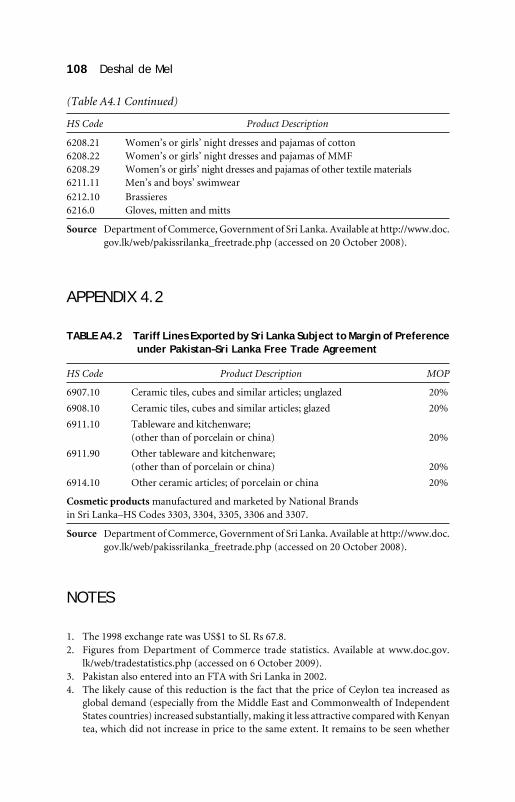
108 Deshal de Mel
HS Code Product Description
6208.21 Women’s or girls’ night dresses and pajamas of cotton6208.22 Women’s or girls’ night dresses and pajamas of MMF6208.29 Women’s or girls’ night dresses and pajamas of other textile materials6211.11 Men’s and boys’ swimwear
6212.10 Brassieres6216.0 Gloves, mitten and mitts
Source Department of Commerce, Government of Sri Lanka. Available at http://www.doc.gov.lk/web/pakissrilanka_freetrade.php (accessed on 20 October 2008).
APPENDIX 4.2
TABLE A4.2 Tariff Lines Exported by Sri Lanka Subject to Margin of Preference under Pakistan–Sri Lanka Free Trade Agreement
HS Code Product Description MOP
6907.10 Ceramic tiles, cubes and similar articles; unglazed 20%
6908.10 Ceramic tiles, cubes and similar articles; glazed 20%
6911.10 Tableware and kitchenware; (other than of porcelain or china) 20%
6911.90 Other tableware and kitchenware; (other than of porcelain or china) 20%
6914.10 Other ceramic articles; of porcelain or china 20%
Cosmetic products manufactured and marketed by National Brands in Sri Lanka–HS Codes 3303, 3304, 3305, 3306 and 3307.
Source Department of Commerce, Government of Sri Lanka. Available at http://www.doc.gov.lk/web/pakissrilanka_freetrade.php (accessed on 20 October 2008).
NOTES
1. The 1998 exchange rate was US$1 to SL Rs 67.8.2. Figures from Department of Commerce trade statistics. Available at www.doc.gov.
lk/web/tradestatistics.php (accessed on 6 October 2009).3. Pakistan also entered into an FTA with Sri Lanka in 2002.4. The likely cause of this reduction is the fact that the price of Ceylon tea increased as
global demand (especially from the Middle East and Commonwealth of Independent States countries) increased substantially, making it less attractive compared with Kenyan tea, which did not increase in price to the same extent. It remains to be seen whether
(Table A4.1 Continued)
Bilateral Free Trade Agreements in SAARC 109
the decline in tea exports is a one-off event or a continuing trend—the former is more likely given the unusually high commodity prices that prevailed through the latter half of 2007.
5. If more than three countries (including at least two LDCs) make commitments in a particular subsector, all countries have to make some commitment in that subsector. This encourages countries to make commitments in sectors that are of real trade interest.
REFERENCES
Department of Commerce. Sri Lanka. Available at http://www.doc.gov.lk/web/index.php (accessed on 6 October 2009).
Institute of Policy Studies of Sri Lanka (IPSSL). 2008. Sri Lanka: State of the Economy 2008. Colombo: IPSSL.
Kelegama, S., and I. Mukherjee. 2007. Indo-Lanka Bilateral Free Trade Agreement: Six Year Performance and Beyond. Research and Information Systems (RIS) for Developing Countries. New Delhi.
Weerakoon, D., and J. Thennakoon. 2008. “SAFTA: Which Way Forward?” Journal of South Asian Development 3 (1) 135–49.
Wickremasinghe, U. 2006. “Indo-Lanka Free Trade Agreement: A Survey of Progress and Lessons for the Future.” Paper presented at the Roundtable on Regional Integration, Colombo, 24 November 2006.
World Trade Organization. 2006. WTO Tariff Profi les 2006. Geneva: WTO.