Someone to BELIEVE in- Journey 2 Success with Pete Asmus-Force your dreams chapter 2- belief

Big Dreams + Hard Work = Success!
1
W. D. Richards Elementary School
School Improvement Plan
2013 - 2014 W. D. Richards Elementary School
3311 Fairlawn Drive Columbus, Indiana 47203
Principal: Darin Sprong
Phone: 812-376-4311

Big Dreams + Hard Work = Success!
2
Table of Contents
Table of Contents
Glossary of Acronyms and Abbreviations
Organizational Profile
Preface
Section 1: Leadership
Section 2: Strategic Planning
Section 3: Customer Focus
Section 4: Measurement, Analysis, and Knowledge
Section 5: Workforce Focus
Section 6: Process Management
Section 7: Results

Big Dreams + Hard Work = Success!
3
Glossary of Acronyms
ATTEND Agencies Teaming Together Ending Non-attendance Dilemmas
AYP Adequate Yearly Progress
BCSC Bartholomew Consolidated School Corporation
CEA Columbus Educators Association
CIC Continuous Improvement Council
CCIC Corporation Continuous Improvement Council
CTL Center for Teaching and Learning
ELL English Language Learners
ESL English as a Second Language
GAT Goal Action Teams
HEO High Expectation Objectives
IAS Indiana Academic Standards
IASP Indiana Association of School Principals
ICT Instructional Consultation Team
IDOE Indiana Department of Education
IEP Individualized Education Plan
IRA Indiana Reading Association
IREAD Indiana Reading Diagnostic Assessment
ISTA Indiana State Teachers Association
ISTEP+ Indiana Statewide Test of Educational Progress
IUPUC Indiana University Purdue University Columbus
LEP Limited English Proficiency
NCLB No Child Left Behind Act
PBIS Positive Behavior Instruction and Support
PDCI Plan, Do, Check, Improve
PL 221 Public Law 221
PTO Parent Teacher Organization
RCIC Richards’ Continuous Improvement Council
RES Richards Elementary School
SFG Structured Facilitated Groups
UDL Universal Design for Learning

Big Dreams + Hard Work = Success!
Administrator: Darin Sprong, Principal
Supporting Services
Office Staff
Technical Support
Custodians
Transportation
Food Services
Nurse
Big Dreams + Hard Work = Success!
4
Administrator: Darin Sprong, Principal
Student Instruction Decision
Teachers:
General Education,
Special Education,
Related Arts,
Special Areas
Counselor
Teacher Assistants
and Tutors
Library Staff
Volunteers … Parents,
Book Buddies, Minds
on Math, Secondary,
Post-Secondary
Decision-Making
Richards’
Continuous
Improvement
Council
R.C.I.C.
Grade Level
Teams
Instructional
Consultation
Team
Goal Action
Teams
Building
Mentors

Big Dreams + Hard Work = Success!
5
Preface: Organizational Profile P.1. Organizational Description: W. D.
Richards Elementary School, located at 3311
Fairlawn Drive, Columbus, Indiana, is one of eleven
public elementary schools in the Bartholomew
Consolidated School Corporation (BCSC). W.D.
Richards’ boundaries cover mainly the north
eastern section of the county and the area of
Columbus located north of 25th
Street and east of
Taylor Road. The housing within the schools’
boundaries consists of single family residences,
apartment complexes, modular housing and rental
homes. With an enrollment of 572 students, W.D.
Richards is the 5th
largest elementary school in
Bartholomew County. Students are supported by a
staff of __ certified staff members and __ additional
support staff members who provide direct services
to the students. In addition, we have bus drivers,
custodial staff, food services staff, and numerous
volunteers that support our students every day.
P.1.a. Organizational Environment P.1.a. (1) Educational Programs, Offerings, and/or Services: W.D. Richards provides
academic instruction; related arts instruction in the
areas of art, band, music and physical education;
basic health services; transportation services; food
services; counseling services; inclusionary special
education services; and a before-school choir and
symphony program. In addition, remediation and
classroom support is provided for the ELL students
and students reading below grade level.
Opportunities exist for after school social,
behavioral, physical and academic help and
enrichment.
Instructional programs are provided in self-
contained independent classrooms utilizing the
Universal Design for Learning Framework. As a
component of UDL, our Instructional Consultation
Team is fully implemented and provides
instructional support to students and staff to
increase, improve, and enhance student and staff
learning. A clustering model is utilized to place
students in classes for maximum teaching
effectiveness. W.D. Richards’ academic programs
offer a school-wide focus on K – 6 literacy in
language arts (reading, phonics, spelling, and
writing), and hands-on mathematics instruction.
Literacy and Math Stations are an integral
component of daily instruction at all grade levels. In
grades 4, 5, and 6 students who have been
identified as High Ability learners through BCSC
screening are clustered into mixed ability classes
taught by staff with specific training in the areas of
the gifted and talented learners. A media center,
one computer lab, and two mobile carts with 60
laptops are available for reading, resource, testing,
and research needs. iPads are utilized by staff and
students in Kindergarten and 1st
grade classrooms.
In addition, iPods are available to Kindergarten, 1st
grade, and 2nd
grade staff and students.
P.1.a (2) Organizational Framework:
W. D. Richards Elementary School is committed
to continual improvement processes that mandate
a focus on student learning and achievement. We
are committed to our mission and vision. Our
goals, strategies, measures, and action plans are
developed, deployed, managed, and
communicated through our organization’s High
Expectation Objectives (HEO’s). Strategies for
deploying HEO’s involve a process throughout
the organization to ensure alignment and linkage.
Through this process, everyone at W. D. Richards
Elementary School is assured of understanding
the improvement work they do and how it relates
to the strategic direction of the school.
Figure P.1-5 BCSC High Expectation Objectives
1. Provide a welcoming and diverse learning culture of respect,
fairness and trust
2. Advance a deep community commitment to all learner’ health,
personal and academic success
3. Enable achievement of core academic knowledge and varied
levels of critical thinking
4. Foster multiple perspectives to develop global citizens
5. Provide multiple pathways that intellectually engage all learners
6. Promote and support modern, collaborative learning
environments
7. Cultivate a commitment to a life-long learning process for all

Big Dreams + Hard Work = Success!
6
W. D. Richards Elementary School’s Vision
Statement reflects our key student and stakeholder
requirements. The vision is developed with input
from the CCIC, students, staff, and parents. It is
reviewed every year and updated as necessary. This
vision appears throughout the building, in
publications, and in conversations. Richards’ Vision
and Goals are put into practice daily as staff,
students, and stakeholders interact.
Figure P.1-6 W. D. Richards Elementary School Vision
W.D. Richards vision and core values are aligned to
the district’s mission and ensure a quality education
for each child delivered by adults modeling the
school goals of:
Figure P.1-9 W.D. Richards Goals
P.1.a (4) Technology: The BCSC’s Technology Plan has helped shape the incremental placement of computer technology throughout the district. The Internet is used regularly for assignment completion, research, and providing scaffolding for students. P. 1. A (5) Regulatory: W. D. Richards is a public
school. The leadership team ensures all safety
regulations, staff certification requirements,
curriculum, hours of operation; accountability,
Teacher Success Rubric, and staff development
plans are followed. W.D. Richards follows the
Indiana Academic Standards as the foundation of its
curriculum. mCLASS is given three times a year in
grades K, 1, and 2. ISTEP+ is given in grades 3
through 6 during the spring of each year. W.D.
Richards meets all of the requirements of P.L. 221
by submitting a school improvement plan annually.
W. D. Richards is required by law to follow
regulations for the Americans with Disabilities Act,
Title 1 programs, and Special Education.
Figure P. 1 – 13 W.D. Richards Demographic Trends
Indicator
2010-11
2011-12
2012-13
Enrollment 604 582 572
Free/Reduced
Lunch
182/66
41%
171/44
43%
178/51
39.4%
Special Ed 68
11.3%
86
14.7%
93
16.2%
Deaf and
Hard Hearing 1 2
Academic
Challenge 25 27
Speech 45 57
Male 294 271 261
Female 310 311 311
White 495 451 482
Black 11 15 12
Hispanic 37 43 39
Asian 18 19 16
Native
American 2 2 4
Multiracial 41 31 8
ELL 43
7.1%
43
7.4%
57
10%
P.1.(B) Organizational Relationships P.1.b (1) Organizational Structure and Governance System: W.D. Richards Elementary School, as one of the
eleven elementary schools in BCSC, follows the mandates
of BCSC and its Board of Trustees. At the building level,
leadership is provided by one principal and two major
decision-making committees. Richards’ Continuous
Improvement Council (RCIC) is responsible for
continuous improvement of organizational performance
and reviewing building processes and the Crisis Response
Team, responsible for monitoring building procedures in
times of unexpected or crisis situations. There are Goal
Action Teams and Mentors, who share strategies,
measures, and action plans for specific goals.
P.1.b (2) Key Stakeholder Groups: At W.D. Richards the
elementary students’ ages range from 6 to 12 and
Big Dreams + Hard Work = Success!
1. Achieve exemplary academic status achievement.
2. Deploy Continuous Improvement Process.
3. Provide a safe, healthy, well-disciplined and
positive learning environment.
4. Create an inclusive culture of respect, equity and
trust.

Big Dreams + Hard Work = Success!
7
comprise the bulk of the student body. These students
may attend Kindergarten through sixth grade; however,
students enroll and withdraw each year in all grades.
The stakeholders include the students, parents, staff,
middle schools, high schools, and community members.
These stakeholders require that BCSC meet the standards
established in its mission and vision and that it exceeds
the requirements mandated by the State of Indiana.
The enrollment numbers and diversity at W.D. Richards
have remained relatively consistent throughout the past
three years. The Free and Reduced Lunch student
population has seen an 11% increase since the 2009
school year. The mobility rate for W.D. Richards’
students has increased as well….going from 10% in 2009
to 15% in 2011. It is a significant enough gain to warrant
an exit interview whenever possible. This data will
continue to be monitored more closely in the future for
its impact on student performances.
The number of students leaving elementary school and
going to middle school is at 100% over the past three
years. Retention is extremely rare at the upper level.
Generally, 85% of the sixth grade students attend one
middle school, so the primary stakeholder is Central
Middle School. Communication between the middle
schools and W.D. Richards is ongoing and strives to
create a smooth transition to a different facility and
academic success in the classrooms. School visitations,
parent information nights, dances, and written
communications are a part of the process in ensuring this
transition is comfortable for the students and parents.
Figure P.1.14 W.D.Richards’ Enrollment Numbers (September 2012)
Grade Sections Enrollment Class
Average
Kindergarten 3 83 27.6
Grade 1 3 76 25.3
Grade 2 3 73 24.3
Grade 3 4 81 20.25
Grade 4 3 77 25.6
Grade 5 3 80 26.6
Grade 6 4 102 25.5
Total 23 572
P.1.b. (3) Supplier/Partner Relationships: At W.D. Richards
a number of partnership relationships exist. These
partnerships create a fuller program for the students.
Parents, community volunteers, and staff work to
address the academic, social, and emotional needs of the
students. Parents are encouraged to read with their
children, help them set goals, stop by for lunch, and
volunteer in the classroom or at PTO and school-wide
events. Other adult role models include students from
the high schools, staff members, IUPUC teacher
candidates, Big Brother/Big Sister mentors, Book
Buddies, Minds on Math, iCare, and guest speakers. P. 2. Organizational Situation P.2.a (1) Competitive environment: Although students
have multiple pathways to choose from as educational
options within BCSC through the CSA schools and AC
programs housed at Southside and Parkside, and several
parochial schools, two Montessori schools, and home
school opportunities; 2% or less of the student
population chose to leave W.D. Richards for these
programs. As a neighborhood school, W.D. Richards’
growth has largely depended on the community
development within the school boundaries. This
development has been minimal within the past three
years and the student growth has remained at an
average enrollment level of 575 students.
P.2.a (2) Principle Factors that Determine Success: W.D. Richards’ staff, students, and parents are dedicated
to school improvement and continuous growth. Principle
factors that determine success are maintaining and
improving the academic programs available to students.
W.D. Richards’ faculty strives to participate in high
quality professional development opportunities. Staffing
needs should be addressed so that the best teachers are
hired and a low student-to-faculty ratio is maintained at
each grade level.
P.2.a (3) Sources of Comparative Date: W.D. Richards is
able to obtain comparative data by utilizing the IDOE
website. This website allows schools to compare data
with the state average, schools scoring at the 90th
percentile, or even schools of similar makeup and
demographics.
P.2.b. Strategic Context Key Strategic Challenges: There are many challenges facing the leadership team of
W.D. Richards. Deployment of the vision, core values,
and goals to result in improved student performance
utilizing the principles of Universal Design for Learning,
Positive Behavior Instructional Support, and stakeholder
satisfaction are key challenges. Efforts to improve
curriculum utilizing multiple means of engagement,
representation, and action/expression include:

Big Dreams + Hard Work = Success!
8
instructional calendars, C.A.S.T. teacher materials, UDL
Facilitator Support, K-6 Literacy Initiatives, BCSC Writing
Process Framework, Everyday Math materials, inclusion
practices, increase technology focus. This process is
continually improving and evolving but remain a primary
focus for student success. It will continue to take the
effort of all staff members, students, parents, and
community helpers to make the success at the level all
expect. Specific challenges for the 2013-2014 school
year are listed in Figure P.2-1.
Figure P.2-1 W.D. Richards Key Strategic Challenges for 2012-2013 P.2.c. Performance Improvement System Maintaining Organizational Focus on Performance Improvement:
The “Baldrige Education Criteria for Performance
Excellence” is helping W.D. Richards maintain its focus on
performance. W.D. Richards conducts a yearly self-
assessment that is submitted to the CCIC for review and
comment. Based on this feedback and the concept of
continuous improvement, W.D. Richards staff institute
improvements.
Staff and students are trained in this method as well as
the Plan, Do, Check, Improve (PDCI) process.
W.D. Richard’s leadership team continues to analyze the
needs of the students and staff. Data is collected to drive
changes in instructional delivery, processes, and
communication.
• Provide equitable technology for students and faculty to
meet the principles of UDL.
• Provide curriculum and instruction for the diverse needs
of our learners.
• Maintaining and improving quality of instruction.
• Improve collaboration between special services staff and
general education staff to increase inclusion.
• Utilizing data to improve instruction.
• Keeping pace with national, state, and district initiatives,
especially national common core standards.
W.D. Richards Elementary School School Improvement Plan Page 1.1
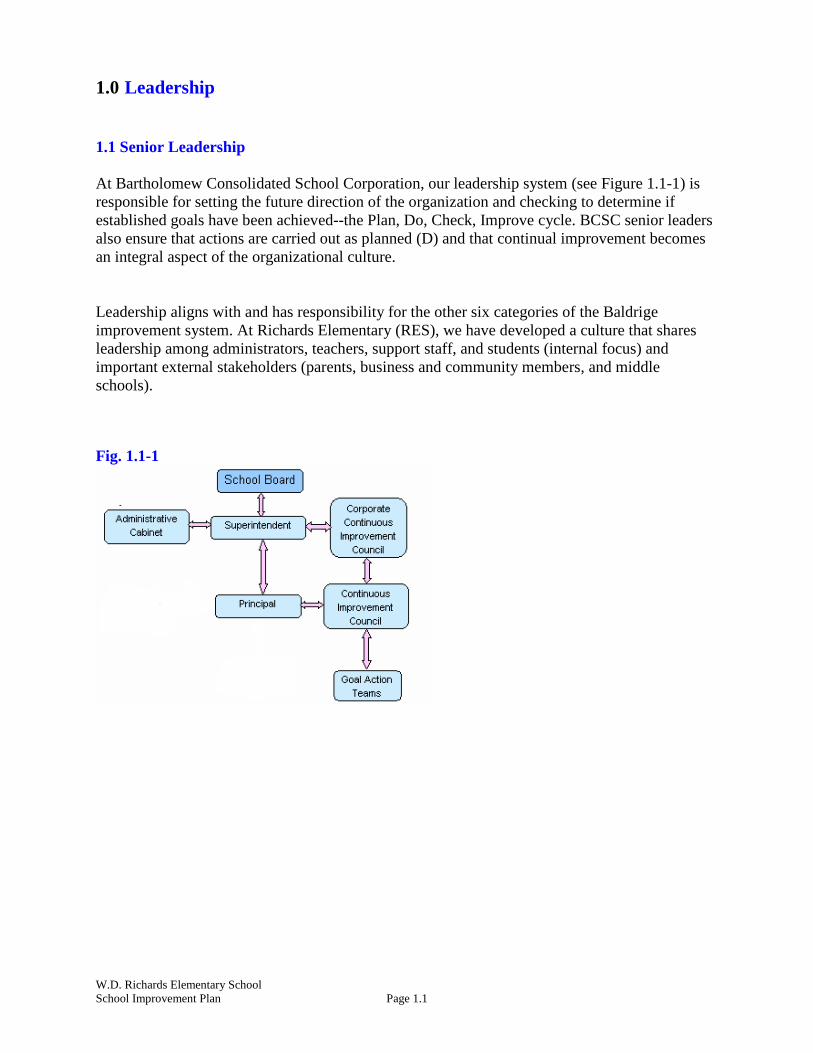
1.0 Leadership 1.1 Senior Leadership At Bartholomew Consolidated School Corporation, our leadership system (see Figure 1.1-1) is responsible for setting the future direction of the organization and checking to determine if established goals have been achieved--the Plan, Do, Check, Improve cycle. BCSC senior leaders also ensure that actions are carried out as planned (D) and that continual improvement becomes an integral aspect of the organizational culture. Leadership aligns with and has responsibility for the other six categories of the Baldrige improvement system. At Richards Elementary (RES), we have developed a culture that shares leadership among administrators, teachers, support staff, and students (internal focus) and important external stakeholders (parents, business and community members, and middle schools). Fig. 1.1-1

W.D. Richards Elementary School School Improvement Plan Page 1.2
1.1.a Vision and Values 1.1.a (1) The District Senior Leadership Team provides a framework for district direction by submitting a District Improvement Plan based on the Baldrige Criteria. Each school and program leadership team then prepares a detailed plan for the direction given by the district leadership and the plans developed for the needs of the school or program. Fig. 1.1-2
District Mission
Deeper Learning is our individualized approach for preparing all learners to succeed in a competitive global economy and democratic society and to tackle the complex issues they will encounter.
District Vision
BCSC demonstrates a community commitment to deeper learning for one…and all.
High Expectation Objectives
BCSC will ensure a balanced, intentional and forward looking approach to meet the following objectives:
• Provide a welcoming and diverse learning culture of respect, fairness and trust • Advance a deep community commitment to all learners’ health, personal an academic success • Enable achievement of core academic knowledge and varied levels of critical thinking • Foster multiple perspectives to develop global citizens • Provide multiple perspectives to develop global citizens • Promote and support modern, collaborative learning environments • Cultivate a commitment to a life-long learning process for all

W.D. Richards Elementary School School Improvement Plan Page 1.3
At RES, the BCSC and RES vision statements are displayed in the main office, on our website, in our monthly newsletter and in our parent/student handbook. BCSC’s mission, vision, core values and HEO’s are used for decision making at Richards’ Elementary School. Richards Elementary School’s Vision Statement: Big Dreams + Hard Work = Success The senior leadership team at Richards includes the principal and Continuous Improvement Council (CIC). Various grade level teachers, support staff, and community members make up the CIC at RES. The CIC works with the principal, and receives direction and input from the Corporation Continuous Council (CCIC). Richards CIC has the responsibility of setting the direction for the School Improvement Plan and ensures that the plan is implemented. CIC is also responsible for guiding and monitoring Goal Action Teams (GAT), implementing professional development, collecting and revising data for purposeful improvement, and overseeing RES’s organizational performance. RES’s GAT’s are responsible for the curriculum planning of the school based on research based instruction and school data. Richards’ PBIS Goal Action Team is responsible for the climate of the school. This includes encouraging school attendance, working on the bullying policies and positive behavior modifications. 1.1.a. (2) The ethical and legal behaviors expected of students, teachers, administrators and other stakeholders are detailed in our Student/Parent handbook. They are also described in our strategic planning process. We conduct surveys, do walk through assessments, and review all Federal, State and District requirements during our yearly planning process. The most important way this is deployed is by example. Senior leaders and participants at all levels believe that our students are the most important part of our school system and we want students, teachers and administrators to be treated fairly and equitably. These values are covered during our hiring process, new employee training and performance appraisal process. RES continues to use assessment data, research based instruction, and UDL principles to guide curriculum to meet the needs of all learners. 1.1.a (3) The primary way senior leaders create a sustainable organization is through the involvement of all stakeholders in assessing what is going well, what needs improvement, putting plans in place to improve those things needing improvement, tracking progress on implementation and monitoring results to see that improvements stay in place. This is essentially our PDCI (Plan Do Check Improve) approach to improvement. The principal and Richard’s CIC provide key direction and leadership for this process but many of the improvement ideas and implementation come from teachers and other stakeholders. RES regularly conducts a review of GAT progress toward goals by reviewing strategies and action items for improvement. Richards also implements and manages professional development in order to improve organizational performance. Richards Elementary School CIC Charter Statement: Our purpose is to establish a collaborative working relationship among all stakeholders to lead and manage continuous improvement, which supports the student learning environment at Richards Elementary School. We recognize our stakeholders as students, parents, staff, Bartholomew Consolidated School Corporation, and the Richards community. The improvements in Richards processes in order to achieve higher academic performance are the responsibility of the CIC.

W.D. Richards Elementary School School Improvement Plan Page 1.4
In addition, the CIC will produce the School Improvement Plan, align the district/school/classroom goals and strategies, and continually improve the operational processes of the Richards CIC. The Richards CIC also insures implementation of research based best practices for all staff members and supports the use of UDL principles. Membership of the Richards CIC consists of the principal, association representative, classroom teachers, support staff representatives, and parent representatives. All members of the CIC have specific roles and responsibilities. All members agree to specific terms including: attending meetings regularly, demonstrate active involvement, follow through on CIC commitments, be honest and direct, and be non-judgmental and supportive of all team members. Specific term limits and replacement procedures are clearly established for all CIC members. The Richards CIC meets on a monthly basis and as necessary to plan and implement the School Improvement Plan.
Richards Elementary School CIC Membership 2013-2014 Sponsors: Darin Sprong, Principal Karen Weaver, Association Representative Staff Members: Kelly Anderson (Grade K/parent), Barry Grimes (Grade 6/ parent), Jonathan Martin (P.E./parent), Billie Park (Grade K), Tracey Stevens (Grade 3/parent), Ginger Williams (Grade 5), Deanna Wenzler (Grade 4/parent)
Membership Roles Co-sponsors’ responsibilities
1. Select team members according to the procedure outlined in this document 2. Provide resources 3. Remove barriers 4. Lead the CIC
Recorder Responsibilities
1. Keeps record of meetings, actions taken, decisions and assignments made 2. Summarizes key findings, decisions, or conclusions reached at meetings 3. Places notes on the Richards shared folder after monthly meetings
Timekeeper Responsibilities
1. Monitors and directs flow of meeting discussions Team Member Responsibilities
1. Represent and maintain two-way communications with stakeholders 2. Support team approach, consensus process, and goal achievement
All members will:
1. Have regular attendance at meetings 2. Demonstrate active involvement and effort 3. Keep an open mind 4. Listen
W.D. Richards Elementary School School Improvement Plan Page 1.5
5. Ask questions 6. Follow through on CIC commitments 7. Be honest and direct with feedback 8. Be non-judgmental and supportive of all team members
Term Limits
Richards CIC: Principal – Permanent Appointee I – 2 years support staff Appointee II – 1 year non-certified staff Community – 3 years Parent – 1 year CEA representative – 3 years Teacher I – 3 years Teacher II – 3 years Teacher III – 2 years As team members leave the CIC, the principal and the CEA representative will gather information concerning the qualities needed of the new member. An exit interview will occur between the co-sponsors and the retiring member. In the interview, data will be gathered from both parties concerning the viewed strengths of the retiring member and recommendations will be sought to best try to replace that member. In the event that no one is found to replace the departing member, the member could be given the opportunity to remain. The co-sponsors will also seek interested candidates and decide collaboratively on replacements. The final decision will be a consensus decision between the co-sponsors. 1.1.b. (1) Communication and organization Performance 1.1.b (1a)Our leadership group communicates with and engages the entire workforce by holding CIC and GAT meetings where policy, direction, strategy and performance decisions are made and evaluated. Once strategies are put in place the performance against the strategy is evaluated and determination is made whether to continue the strategy or drop it in favor of one that may have more favorable research or performance data on the improvement of student skills. (1b) Empower, motivate and encourage high performance: RES monitors performance results continually as new data is made available, by again using a Plan, Do, Check, Improve process for analysis. Improvement decisions are therefore data based and processes can be changed by adjusting minimum expectations or, in the case of positive results, adjusting goals, setting new standards and recognizing best practices.

W.D. Richards Elementary School School Improvement Plan Page 1.6
The principal, along with the CIC and GAT, regularly review the data listed in the balanced score card in section 2 based on the responsibility of the teams. Richards’ current CIC is made up of eight members including our principal, an Association Member, support staff, parents, and teachers. Examples of the Goal Action Teams are listed in Fig. 1.1-3. Fig. 1.1-3 Goal Action Teams
Math/Science Literacy
Instructional Consultation
Positive Behavior Instructional Supports
An example of how the teams use the data is as follows: Key academic results including ISTEP+, Acuity scores, subject grade reports and skill demonstration are all used to determine skill level of students. For example, ISTEP+ results are available in August and provide norm referenced and criterion referenced results. They also permit comparisons to original baselines updated yearly.
Every year, RES administers a Satisfaction Survey, an assessment of the opinions of staff, students and parents. Richards CIC uses information from the survey as a way to monitor stakeholder input.
1.1.b (2a) Student performance results from national, state and local assessments are reviewed in order to guide instruction. Teachers use a variety of assessment tools in order to improve instruction and for strategic planning. Assessments and tools used include: ISTEP+, mCLASS, Acuity, Accelerated Reading, IREAD, and curriculum based assessments. 1.1.b (2b) Creating a focus on action to attain vision and balance performance expectations: Student performance assessment results from national, state and local assessments are reviewed annually. The Satisfaction Survey provides direct feedback on the school environment, staff, and principal effectiveness. This information is integrated into the annual performance review for the school and helps to guide the strategic planning process. 1.2 Governance and Social Responsibility Richards’ administration and staff realize their responsibilities to community stakeholders as role models and take active roles in civic and community organizations that impact BCSC students and families. This participation provides opportunities to gather input and build relationships in the community.
1.2.a. Organizational Governance

W.D. Richards Elementary School School Improvement Plan Page 1.7
1.2.a (1) Governance System: Richards pursues accreditation regularly through the Indiana Department of Education (IDOE) via our School Improvement Plans. Richards follows each cohort group as they move on to middle school to assist in the analysis of our instruction and curriculum planning. As a public school in a community that expects excellence, Richards monitors key processes annually to ensure processes (Fig. 1.2-1) are in place for safe environments conducive to learning and achievement for all students and staff. Fig. 1.2-1 Key Safety Processes
Targets for school safety Monthly fire drills Regulatory requirements Tornado drills ADA regulations Code Blue drills Certification requirements for employees Earthquake preparedness Background checks on all employees and volunteers
Fig. 1.2-2 School Governance TEAM MEMBERSHIP RESPONSIBLITIES
CIC Principal AR – Teacher Five teachers/parents Two teachers
Reviews/revises SIP Monitors progress on goals and strategies through GAT Professional development Collect/analyze date for purposeful improvement Reviews building processes
GAT Literacy Math/Science Positive Behavior Instructional Supports Instructional Consultation
Determine strategies, measures, and action plan for each goal Analyze data and determine areas for improvement Evaluate progress of strategies/revise strategies
UDL All teachers Implement UDL best practices in classrooms
1.2.a (2) Performance of Senior Leaders: Data from the Satisfaction Survey provides feedback from teachers, staff, parents, and students relative to the services and operations of RES. In addition, the Principal and CIC monitor services and operations at quarterly meetings. Additional meetings are scheduled as needed. Richards’ administration and staff realize their responsibilities to all stakeholders. The RES CIC actively seeks input from all stakeholders including staff, students, parents and community members and uses the information for strategic planning.

W.D. Richards Elementary School School Improvement Plan Page 1.8
1.2.b (1&2) Legal and ethical behavior: As a public entity whose primary job is teaching and learning, it is essential that RES monitor ethical practices throughout the organization. The primary responsibility for ethical practice lands with senior leaders in both policy and practice. The Principal and CIC monitor staff and student behaviors and are required by law to report any inappropriate actions that take place, including reports of child abuse. Statements on diversity, inclusive practices and nondiscrimination clauses are reviewed annually in the RES handbook.
2.c. Support of Key Communities
RES encourages and promotes active support of key community initiatives. Richards supports local organizations that in turn help the students and families of our school. Some of these organizations include: A number of partnership relationships exist at RES. Parents, community volunteers, and staff work to address the academic, social, and emotional needs of the students. Parents are encouraged to read to their children, help them set goals, stop by for lunch, and volunteer in the classroom or at PTO events. Other adult role models include former RES students returning to speak to students, complete senior projects, etc., cadet teachers, staff members, and Book Buddies. Communication tools include personal contacts, teacher websites, e-mail, school newsletter, phone calls and postal messages. Parents can personally access their child’s academic progress, attendance records, and missing assignments using Parent Connect. Parents also now have access to the Accelerated Reader program to check student progress in independent reading. Richards uses the community to support learning through the use of a variety of services and activities including: DARE, Foundation for Youth, Cadet teaching, Literacy Festival, Reading Family Fun Nights, Math Family Fun Nights, Science Nights, Minds on Math, and Boy and Girl Scouts.
RICHARDS RAVES!
Our students participate in a
number of outreach programs such
as:
• American Cancer Society
Penny Drive
• United Way Fund Drive
• Humane Society Christmas
sponsorship
• Nursing home visits
• Recycling program
• Service learning projects
• Kindergarten Make a
Difference Day canned
food drive
• Hoop Shoot Mania
supporting Big Brothers
and Big Sisters
• Ronald McDonald House

W.D. Richards Elementary School School Improvement Plan Page 1.9
Fig. 2.1 Key Community Support Organization Assistance Provided Classroom volunteers Tutoring and other classroom assistance Marsh, Kroger, Campbell’s Labels, Box Top for Education (General Mills)
Cash payment or incentive gifts to Richards
Area restaurants: Applebees, Fazoli’s, Pizza Hut, Golden Corral, Texas Roadhouse
Incentive programs for students
Bartholomew Waste Management Field trips, lesson plans, recycling Retired teachers/community members Book Buddies Columbus Police Department D.A.R.E. leader Community volunteers Guest speakers Columbus Fire Department Fire Safety program Columbus Service League RIF books Purdue Extension Provides lesson plans Bartholomew Healthy Communities Guidance, support, and competitions
1
2.0 Strategic Planning
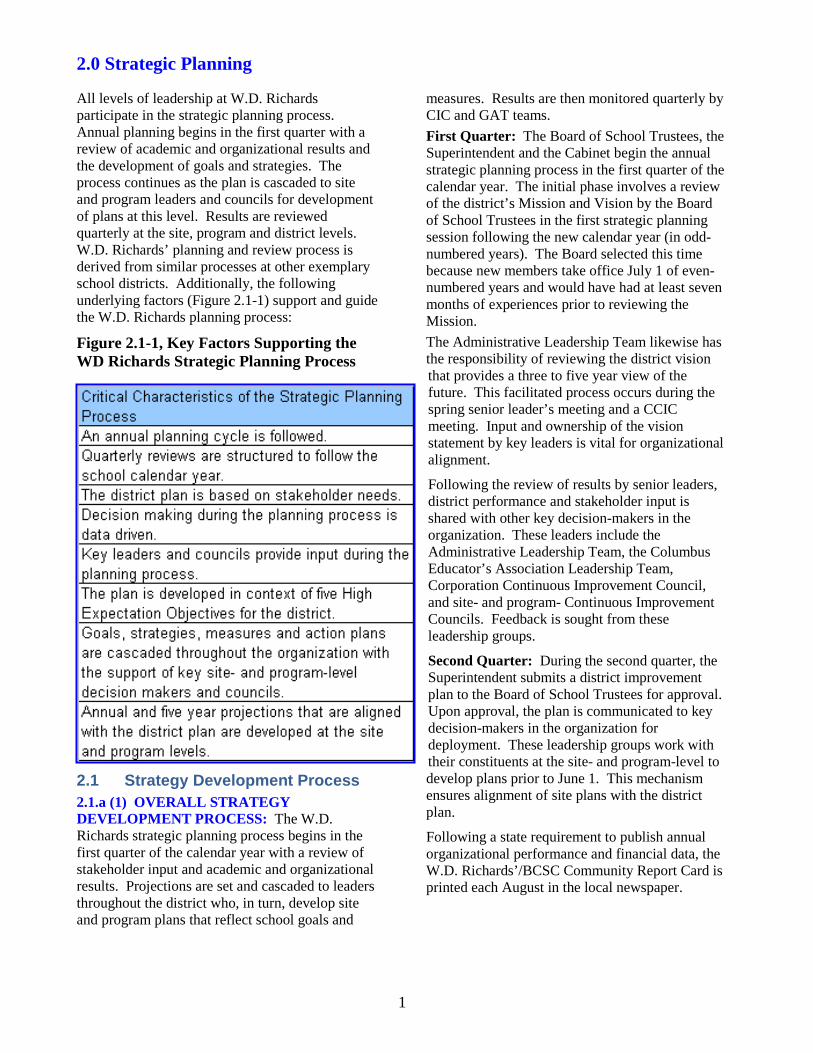
All levels of leadership at W.D. Richards participate in the strategic planning process. Annual planning begins in the first quarter with a review of academic and organizational results and the development of goals and strategies. The process continues as the plan is cascaded to site and program leaders and councils for development of plans at this level. Results are reviewed quarterly at the site, program and district levels. W.D. Richards’ planning and review process is derived from similar processes at other exemplary school districts. Additionally, the following underlying factors (Figure 2.1-1) support and guide the W.D. Richards planning process:
Figure 2.1-1, Key Factors Supporting the WD Richards Strategic Planning Process
2.1 Strategy Development Process 2.1.a (1) OVERALL STRATEGY DEVELOPMENT PROCESS: The W.D. Richards strategic planning process begins in the first quarter of the calendar year with a review of stakeholder input and academic and organizational results. Projections are set and cascaded to leaders throughout the district who, in turn, develop site and program plans that reflect school goals and
measures. Results are then monitored quarterly by CIC and GAT teams.
First Quarter: The Board of School Trustees, the Superintendent and the Cabinet begin the annual strategic planning process in the first quarter of the calendar year. The initial phase involves a review of the district’s Mission and Vision by the Board of School Trustees in the first strategic planning session following the new calendar year (in odd-numbered years). The Board selected this time because new members take office July 1 of even-numbered years and would have had at least seven months of experiences prior to reviewing the Mission.
The Administrative Leadership Team likewise has the responsibility of reviewing the district vision that provides a three to five year view of the future. This facilitated process occurs during the spring senior leader’s meeting and a CCIC meeting. Input and ownership of the vision statement by key leaders is vital for organizational alignment.
Following the review of results by senior leaders, district performance and stakeholder input is shared with other key decision-makers in the organization. These leaders include the Administrative Leadership Team, the Columbus Educator’s Association Leadership Team, Corporation Continuous Improvement Council, and site- and program- Continuous Improvement Councils. Feedback is sought from these leadership groups.
Second Quarter: During the second quarter, the Superintendent submits a district improvement plan to the Board of School Trustees for approval. Upon approval, the plan is communicated to key decision-makers in the organization for deployment. These leadership groups work with their constituents at the site- and program-level to develop plans prior to June 1. This mechanism ensures alignment of site plans with the district plan.
Following a state requirement to publish annual organizational performance and financial data, the W.D. Richards’/BCSC Community Report Card is printed each August in the local newspaper.

2
Figure 2.1-2 Annual Strategic Planning Process Task/Responsibility J J A S O N D J F M A M
Submit PL221 plan to the Superintendent as required. (CIC)
X
Principal and CIC review: Stakeholder Input, Mission, Vision, Core Values, AIMS and Balanced Scorecard/District Dashboard for alignment and improvement. (CIC)
X
The Principal, CIC, and Goal Action Teams collect and document performance data. Conduct gap analysis. (CIC, GATs)
X X X X X X X X X X
Review the district improvement plan with the CIC. Update five-year performance projections, confirm or add/modify effectiveness of strategies and document corrective action plans. (CIC)
X
The Principal and CIC work with faculty and staff to develop and/or align action plans with the district plan. Make necessary changes to the school or program strategic plan. (CIC)
X X X
Review resource requirements to support the strategies and determine sources of resources or determine reallocation of resources ($, people, time). Align next calendar year budget with strategic plan. (Administrators)
X
Communicate the school improvement and action plan for deployment. (CIC)
X X X
Conduct System-to-system (S2S) discussions with all parties. (Administrators)
X X X X X X X X X X
Measure and monitor action plan execution and interim performance results. (CIC)
X X X X X X
Develop schedule and conduct Goal Action Teams and Grade Level discussions. (Administrators)
X X X X X X X X X X
WD Richards’ Strategic Planning Process is shown in Figure 2.1-2. Trend data is used to graphically illustrate organizational performance, for example, student achievement and other test results for the current year and comparisons to previous years.

3
2.1.a.(2) RELEVANT DATA AND INFORMATION: Relevant data (see Figure 2.1-4) are a key consideration in the performance review and strategic planning process. A variety of approaches are used to survey key stakeholders (questionnaires, open forums, plus/delta feedback, PTO meetings, classroom-based root cause and impact analysis). Students, parents, staff and others are involved formally on a yearly basis. At W.D. Richards the staff and parents are surveyed to identify important curricular areas, technology, safety concerns, student achievement, and overall satisfaction in order to validate our aims. Goals are set based on areas of low performance on ISTEP+. Strategies are discussed and implemented to improve student performance. Disaggregated data will indicate segments in need of
remediation. Individual students are identified for remediation efforts during the school day.
In addition, national, state and local stakeholders provide BCSC various kinds of data as follows:
• State and national test scores during the first quarter
• Input from various stakeholders including regulatory requirements from the Indiana General Assembly during the second quarter
• Regulatory requirements from the Indiana Department of Education during the third quarter
• Satisfaction data from the Satisfaction Surveys during the school year
• Site based inputs and data
Figure 2.1-4, Relevant Data and Measurement Source
Data Measurement Source Student Performance Data
Kindergarten Screening mCLASS IREAD Acuity BCSC Writing prompts administered four times annually Adopted reading textbook unit tests Adopted math textbook unit tests Basic facts tests administered four times annually STAR Reading tests given four times annually AR Reading tests on students independent reading comprehension ISTEP + administered annually to students in grades 3,4,5,6
Attendance Data
Student attendance/absence examined daily, weekly, quarterly Number of students arriving after 8:10 to class.
Expulsion / Behavior Data
Number of students expelled Number and type of disciplinary referrals
Student / Stakeholder Input
Satisfaction survey information administered during the year Olweus Bully survey
Enrollment Data
Enrollment by classroom and grade level
Common Core Standards
Used by classroom teachers to plan curriculum and instruction
Continuous Improvement Processes
Validate strengths and identify areas for improvement
Demographic Data
Gender, Ethnicity, Socio-economic status, Special Education
Financial Data School Budget and operating information
4
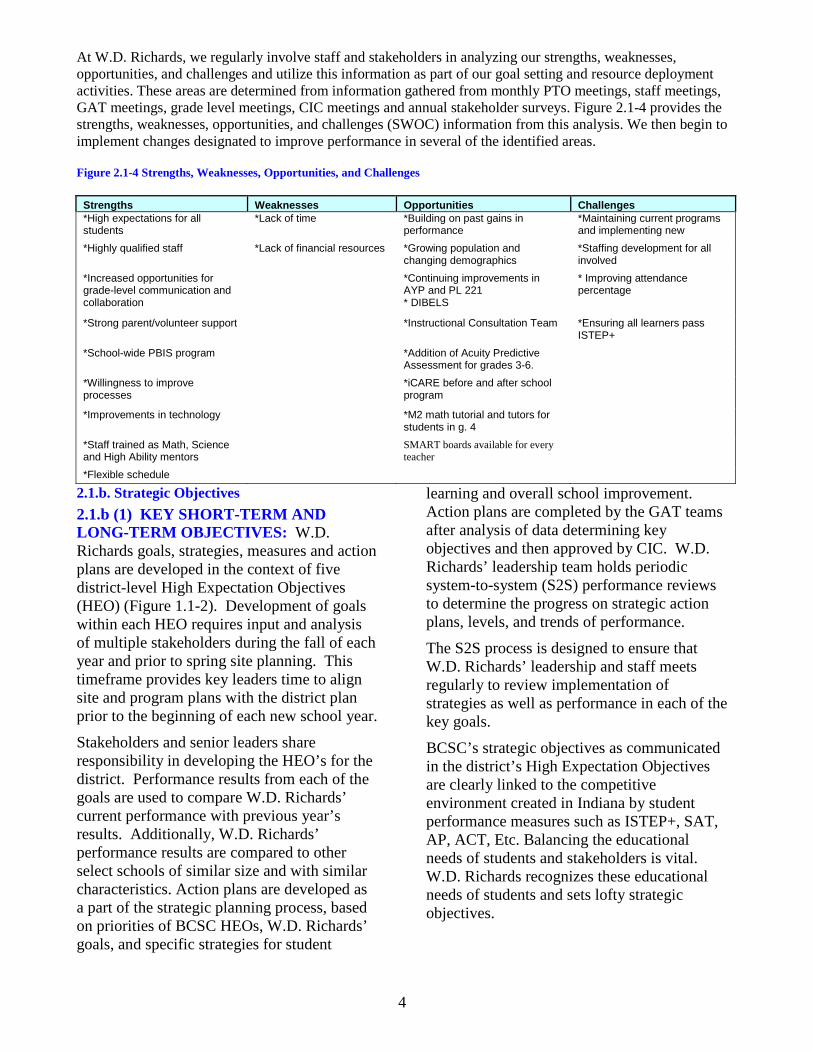
At W.D. Richards, we regularly involve staff and stakeholders in analyzing our strengths, weaknesses, opportunities, and challenges and utilize this information as part of our goal setting and resource deployment activities. These areas are determined from information gathered from monthly PTO meetings, staff meetings, GAT meetings, grade level meetings, CIC meetings and annual stakeholder surveys. Figure 2.1-4 provides the strengths, weaknesses, opportunities, and challenges (SWOC) information from this analysis. We then begin to implement changes designated to improve performance in several of the identified areas.
Figure 2.1-4 Strengths, Weaknesses, Opportunities, and Challenges
Strengths Weaknesses Opportunities Challenges *High expectations for all students
*Lack of time *Building on past gains in performance
*Maintaining current programs and implementing new
*Highly qualified staff *Lack of financial resources *Growing population and changing demographics
*Staffing development for all involved
*Increased opportunities for grade-level communication and collaboration
*Continuing improvements in AYP and PL 221 * DIBELS
* Improving attendance percentage
*Strong parent/volunteer support *Instructional Consultation Team *Ensuring all learners pass ISTEP+
*School-wide PBIS program *Addition of Acuity Predictive Assessment for grades 3-6.
*Willingness to improve processes
*iCARE before and after school program
*Improvements in technology *M2 math tutorial and tutors for students in g. 4
*Staff trained as Math, Science and High Ability mentors
SMART boards available for every teacher
*Flexible schedule
2.1.b. Strategic Objectives
2.1.b (1) KEY SHORT-TERM AND LONG-TERM OBJECTIVES: W.D. Richards goals, strategies, measures and action plans are developed in the context of five district-level High Expectation Objectives (HEO) (Figure 1.1-2). Development of goals within each HEO requires input and analysis of multiple stakeholders during the fall of each year and prior to spring site planning. This timeframe provides key leaders time to align site and program plans with the district plan prior to the beginning of each new school year.
Stakeholders and senior leaders share responsibility in developing the HEO’s for the district. Performance results from each of the goals are used to compare W.D. Richards’ current performance with previous year’s results. Additionally, W.D. Richards’ performance results are compared to other select schools of similar size and with similar characteristics. Action plans are developed as a part of the strategic planning process, based on priorities of BCSC HEOs, W.D. Richards’ goals, and specific strategies for student
learning and overall school improvement. Action plans are completed by the GAT teams after analysis of data determining key objectives and then approved by CIC. W.D. Richards’ leadership team holds periodic system-to-system (S2S) performance reviews to determine the progress on strategic action plans, levels, and trends of performance.
The S2S process is designed to ensure that W.D. Richards’ leadership and staff meets regularly to review implementation of strategies as well as performance in each of the key goals.
BCSC’s strategic objectives as communicated in the district’s High Expectation Objectives are clearly linked to the competitive environment created in Indiana by student performance measures such as ISTEP+, SAT, AP, ACT, Etc. Balancing the educational needs of students and stakeholders is vital. W.D. Richards recognizes these educational needs of students and sets lofty strategic objectives.

5
2.1.b. (2) STRATEGIC OBJECTIVES:
W.D. Richards staff views students’ needs as the first priority. In developing strategies for continuous improvement of students’ all-around learning, the GATs choose to use staff development as a tool with which to meet the challenges of the continuous improvement process. Multiple strategies based on best practices research, differentiation of instruction, and flexible grouping based on student needs and strengths are being utilized. Universal Design for Learning (UDL), will assist teachers in providing a more flexible instructional delivery. UDL helps teachers modify lessons using different presentations, set differentiated goals for students, and to be flexible in motivating students.
A K-6 Literacy program, including literacy stations, is being implemented to provide consistency in language arts instruction in all grades K-6
Through the creation and implementation of the BCSC Evaluation System, teachers and building administrators will be working closely to complete the Teacher Success Rubric. The process utilizes goal setting, conferences and observations to evaluate and improve instruction. Heavy emphasis is placed on demonstration of the Universal Design for Learning Framework being incorporated into daily instruction.
Figure 2.1-5 Sequence of BCSC Evaluation System
Through the use of these strategies and measures, W.D. Richards’ stakeholders benefit. Parents, as stakeholders, see a consistent means of evaluation. Middle schools, as stakeholder, will use projections of student achievement and conversations with grade level representatives to plan effectively
for their incoming student population. The community of W.D. Richards, as stakeholders, will see the benefits of these many strategies in the population of W.D. Richards’ students.
W.D. Richards’ goals, benchmarks and five-year targets are presented in the context of a “balanced scorecard” (see Figure 2.2-1). A balanced scorecard reflects an organization’s comprehensive set of performance measures, and also provides a strategic measurement and management system.
2.2.a(1) ACTION PLAN DEVELOPMENT AND DEPLOYMENT: After BCSC goals are established, school and program leaders develop goals, measures, and action plans that support district goals. Best practice research, data derived from ongoing operations, benchmarking visits, and root cause analyses are used to create robust action plans.
W.D. Richards’ and CIC implement the GAT teams’ recommended strategies into an action plan to accomplish the short and long-term goals. W.D. Richards’ GATs develop short-term steps toward achieving the goal. Each year the GATs have provided instructional strategies for grade level teams. Time is allocated through a weekly schedule so that communication can take place within grade levels. Instructional calendars were established by grade level teams outlining Indiana Academic Standards needing additional instruction based on grade-level teams selected assessments. Within these goals, strategies with timelines are included to facilitate improvement. The GATs evaluate the progress, along with CIC, and add or delete strategies as needed. The action plans remain flexible. GATs have been empowered to recommend changes in school-wide programs and facilitate this overall improvement.
2.2.a (2) KEY SHORT-TERM AND LONG-TERM STRATEGIES: Following each goal statement and performance projection is a description of the strategies needed to achieve the goals. After district goals are established, school and program leaders develop goals, measures, and action plans that support district goals.
1. Goal Setting/Pre-Observation Conference (May – August)
2. Formal Observation (August – April and conducted 2 times per year)
3. Post-Observation Conference (7 days after observation)
4. Summative Conference (April – June)

6
W.D. Richard’s Elementary
School Dashboard and Balanced
Scorecard Academic
Skills HEO #1
App
lies
To
Spring 2010
Spring 2011
Spring 2012
Spring 2013
Goal for 2014
ISTEP+ % pass both Language Arts and Math
Gr 3
79.5% 86.5% 81.1% 86% 87%
Gr 4
87% 83.4% 77.8% 72% 90%
Gr 5
86% 83.5% 78.9% 85% 80%
Gr 6
81% 78.5% 79.0% 77% 88%
ISTEP+ % pass and pass plus
Language Arts
Gr 3
86% 88% 91.1% 92% 90%
Gr 4
88% 83% 91.7% 87% 94%
Gr 5
87% 80% 85.3% 94% 90%
Gr 6
77% 81% 87.7% 80% 95%
ISTEP+ % pass/pass plus
Math
Gr 3
76%* 85% 86.5% 86% 88%
Gr 4
70% 83% 80.6% 72% 89%
Gr 5
86% 87% 87.4% 85% 80%
Gr 6
85% 76% 85.2% 92% 88%
ISTEP+ % Pass/pass plus Social Studies
Gr 5
72% 72% 75% 88% 90%
ISTEP+ % Passing Science
Grade 6
Gr 4
75% 80% 91.7% 85%
Gr 6
62% 78% 65.4% 85%
Figure 2.2 – 1 Academic Dashboard by
Grade level cohort groups

7
Percent Passing ISTEP+ at Richards – Disaggregated Data
3rd
Grade 3rd
Grade English/LA Spring
2010
Spring
2011
Spring
2012
Spring
2013
Math Spring
2010
Spring
2011
Spring
2012
Spring
2013
All students 83% 88% 92% 92% All students 76% 85% 87% 86%
Male 80% 87% 95% 94% Male 78% 87% 95% 87%
Female 85% 89% 88% 91% Female 74% 83% 76% 85%
Minority 75% 75% 88% Minority 67% 67% 75%
White 85% 89% 93% 93% White 82% 89% 90% 89%
Free/R lunch 70% 82% 90% 90% Free/R lunch 59% 79% 87% 79%
Paid Lunch 93% 92% 93% 94% Paid Lunch 90% 89% 86% 90%
Limited Eng (6) (4) (9) 67% Limited Eng (6) (4) (9) 50%
Non Lim ELL 83% 87% 94% 94% Non Lim ELL 77% 85% 86% 89%
General Ed 90% 90% 93% 92% General Ed 82% 86% 87% 85%
Spec. Ed 20% (8) (8) 100% Spec. Ed 30% (8) (8) 100%
4th
Grade 4th
Grade English/LA Spring
2010
Spring
2011
Spring
2012
Spring
2013
Math Spring
2010
Spring
2011
Spring
2012
Spring
2013
All students 78% 83% 92% 87% All students 70% 83% 80% 72%
Male 67% 79% 84% 90% Male 69% 82% 76% 78%
Female 91% 85% 95% 86% Female 72% 83% 80% 64%
Minority (6) 92% (7) 62% Minority (6) 83% (7) 46%
White 83% 84% 91% 93% White 73% 84% 83% 79%
Free/R lunch 65% 69% 83% 81% Free/R lunch 53% 72% 72% 61%
Paid Lunch 87% 92% 98% 93% Paid Lunch 81% 91% 86% 80%
Limited Eng (4) (7) (2) 56% Limited Eng (4) (7) (2) 56%
Non Lim ELL 77% 85% 81% 92% Non Lim ELL 70% 85% 81% 75%
General Ed 84% 86% 92% 86% General Ed 75% 87% 81% 73%
Spec. Ed 46% (9) (8) 100% Spec. Ed 38% (9) (8) 67%
Figure 2.2-2 Disaggregated ISTEP+ Data

8
Percent Passing ISTEP+ at Richards – Disaggregated Data
5th
Grade 5th
Grade English/LA Spring
2010
Spring
2011
Spring
2012
Spring
2013
Math Spring
2010
Spring
2011
Spring
2012
Spring
2013
All students 72% 80% 85% 94% All students 76% 87% 87% 85%
Male 67% 76% 82% 88% Male 78% 83% 88% 82%
Female 79% 85% 87% 100% Female 74% 90% 87% 87%
Minority (4) (2) 60% 86% Minority (4) (2) 70% 71%
White 71% 81% 89% 97% White 76% 88% 92% 88%
Free/R lunch 59% 71% 76% 86% Free/R lunch 72% 79% 82% 69%
Paid Lunch 80% 85% 90% 100% Paid Lunch 78% 91% 90% 95%
Limited Eng (3) (1) (7) 67% Limited Eng (3) (1) (7) 33%
Non Lim ELL 71% 80% 86% 96% Non Lim ELL 75% 86% 88% 87%
General Ed 79% 85% 87% 94% General Ed 80% 86% 89% 84%
Spec. Ed 33% (9) (9) 100% Spec. Ed 50% (9) (9) 90%
6
th Grade 6
th Grade
English/LA Spring
2010
Spring
2011
Spring
2012
Spring
2013
Math Spring
2010
Spring
2011
Spring
2012
Spring
2013
All students 72% 80% 88% 80% All students 78% 76% 85%
92%
Male 67% 76% 83% 80% Male 78% 73% 88% 93%
Female 79% 85% 92% 80% Female 78% 80% 87% 91%
Minority (4) (2) (2) 64% Minority (7) (6) (2) 92%
White 71% 81% 86% 86% White 74% 80% 86% 92%
Free/R lunch 59% 71% 82% 71% Free/R lunch 65% 57% 74% 85%
Paid Lunch 80% 85% 91% 86% Paid Lunch 86% 87% 91% 95%
Limited Eng (3) (1) (6) 22% Limited Eng (5) (2) (6) 78%
Non Lim ELL 71% 80% 88% 86% Non Lim ELL 79% 76% 85% 93%
General Ed 79% 85% 90% 83% General Ed 85% 77% 86% 93%
Spec. Ed 33% (9) (8) 50% Spec. Ed (9) (5) (8) 75%
Figure 2.2-3 Disaggregated ISTEP+ Data

9
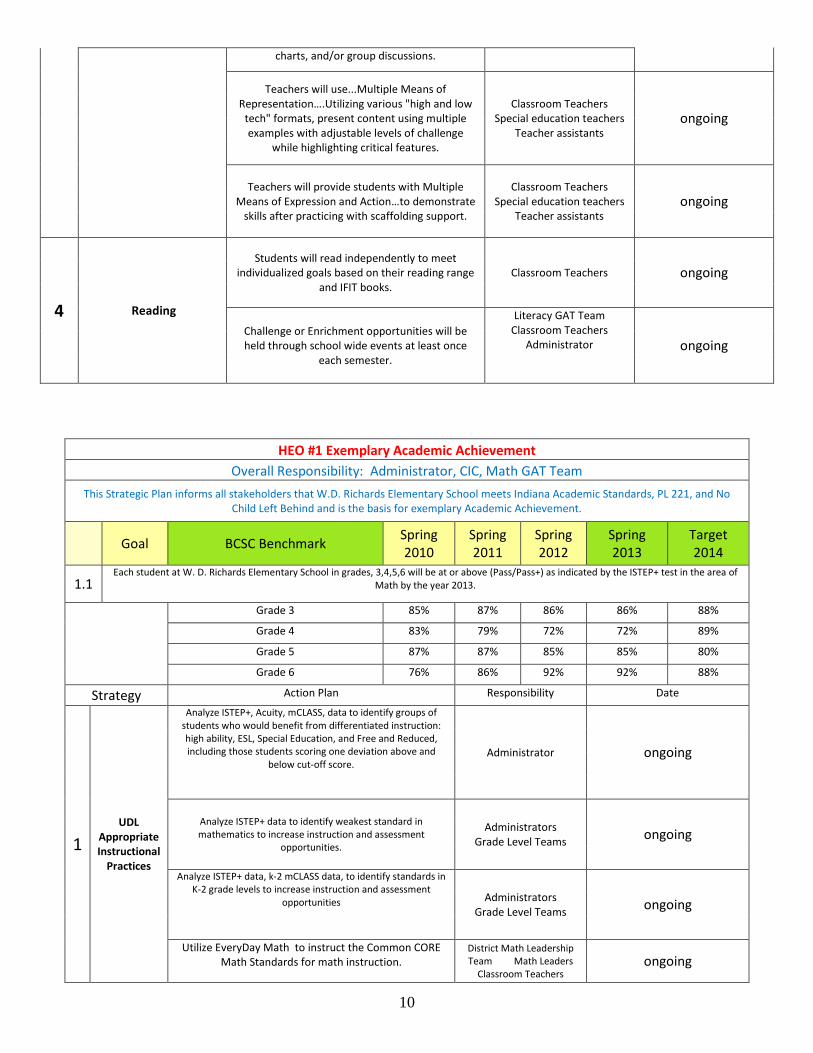
This Strategic Plan informs all stakeholders that W.D. Richards Elementary School meets Indiana Academic Standards, PL 221, and No Child Left
Behind and is the basis for exemplary Academic Achievement.
Goal BCSC Benchmark
Spring
2010
Spring
2011
Spring
2012
Spring
2013
Target
2014
1.1 Each student at W. D. Richards Elementary School in grades, 3,4,5,6 will be at or above (Pass/Pass+) as indicated by the ISTEP+ test in the area of
English/Language Arts and the Writing portion of Applied Skills by the year 2013.
Grade 3 83% 88% 92% 92% 90%
Grade 4 76% 85% 90% 87% 94%
Grade 5 72% 80% 85% 94% 90%
Grade 6 72% 80% 85% 80% 95%
Strategy Action Plan Responsibility Date
1 UDL Appropriate
Instructional Practices
Analyze iSTEP+, Acuity, mCLASS, IREAD data to identify
groups of students who would benefit from
differentiated instruction: high ability, ESL, Special
Education, and Free and Reduced, including those
students scoring one deviation above and below cut-off
score.
Administrators ongoing
Analyze ISTEP+ data to identify weakest standard
Language Arts to increase instruction and assessment
opportunities.
Administrators
Grade Level Teams ongoing
Analyze 3rd grade IREAD data, ISTEP+ data, k-2 mCLASS
data to identify standards in K-2 grade levels to increase
instruction and assessment opportunities Administrators
Grade Level Teams ongoing
Create and Implement plan for remediation and
enrichment. Administrators Teachers
Literacy Coaches ongoing
Language Arts
Identify language arts areas in which students are
struggling and prioritize those areas to be
addressed throughout the year.
Grade Level Teams
Classroom Teachers ongoing
2
Develop units to be used and create a grade level
map for each until which delineates the essential
question, content, skills, standards, lessons,
modifications/accommodations and assessments. Grade Level Teams
Classroom Teachers ongoing
Conduct regular grade level meetings to review
curriculum maps and add and edit data. Share
with building principal
Administrator
Classroom Teachers ongoing
3 Universal Design for
Learning
Implementation
Clarify instructional goals and recognize the need
for different objectives for various learners.
(Individual Goals)
Classroom Teachers
Special education teachers
Teacher assistants
ongoing
Teachers will use….Multiple Means of
Engagement…to encourage students to connect
prior learning experiences with new content
through the use of graphic organizers, K-W-L
Classroom Teachers
Special education teachers
Teacher assistants
ongoing
10
charts, and/or group discussions.
Teachers will use...Multiple Means of
Representation….Utilizing various "high and low
tech" formats, present content using multiple
examples with adjustable levels of challenge
while highlighting critical features.
Classroom Teachers
Special education teachers
Teacher assistants
ongoing
Teachers will provide students with Multiple
Means of Expression and Action…to demonstrate
skills after practicing with scaffolding support.
Classroom Teachers
Special education teachers
Teacher assistants
ongoing
4 Reading
Students will read independently to meet
individualized goals based on their reading range
and IFIT books.
Classroom Teachers ongoing
Challenge or Enrichment opportunities will be
held through school wide events at least once
each semester.
Literacy GAT Team
Classroom Teachers
Administrator ongoing
HEO #1 Exemplary Academic Achievement
Overall Responsibility: Administrator, CIC, Math GAT Team
This Strategic Plan informs all stakeholders that W.D. Richards Elementary School meets Indiana Academic Standards, PL 221, and No
Child Left Behind and is the basis for exemplary Academic Achievement.
Goal BCSC Benchmark
Spring
2010
Spring
2011
Spring
2012
Spring
2013
Target
2014
1.1 Each student at W. D. Richards Elementary School in grades, 3,4,5,6 will be at or above (Pass/Pass+) as indicated by the ISTEP+ test in the area of
Math by the year 2013.
Grade 3 85% 87% 86% 86% 88%
Grade 4 83% 79% 72% 72% 89%
Grade 5 87% 87% 85% 85% 80%
Grade 6 76% 86% 92% 92% 88%
Strategy Action Plan Responsibility Date
1
UDL
Appropriate
Instructional
Practices
Analyze ISTEP+, Acuity, mCLASS, data to identify groups of
students who would benefit from differentiated instruction:
high ability, ESL, Special Education, and Free and Reduced,
including those students scoring one deviation above and
below cut-off score. Administrator ongoing
Analyze ISTEP+ data to identify weakest standard in
mathematics to increase instruction and assessment
opportunities.
Administrators
Grade Level Teams ongoing
Analyze ISTEP+ data, k-2 mCLASS data, to identify standards in
K-2 grade levels to increase instruction and assessment
opportunities Administrators
Grade Level Teams ongoing
Utilize EveryDay Math to instruct the Common CORE
Math Standards for math instruction.
District Math Leadership
Team Math Leaders
Classroom Teachers ongoing

11
2
Collect and
analyze
data from
Math Facts
Timed
Tests
Students will take a series of timed tests during the
school year.
Grade Level Teams
Classroom Teachers
ongoing
3
Universal
Design for
Learning
Implement
ation
Clarify instructional goals and recognize the need
for different objectives for various learners.
(Individual Goals)
Classroom Teachers
Special education
teachers
Teacher assistants
ongoing
Teachers will use….Multiple Means of Engagement…to
encourage students to connect prior learning
experiences with new content through the use of
graphic organizers, K-W-L charts, and/or group
discussions.
Classroom Teachers
Special education
teachers
Teacher assistants
ongoing
Teachers will use...Multiple Means of
Representation….Utilizing various "high and low tech"
formats, present content using multiple examples with
adjustable levels of challenge while highlighting critical
features.
Classroom Teachers
Special education
teachers
Teacher assistants
ongoing
Teachers will provide students with Multiple Means of
Expression and Action…to demonstrate skills after
practicing with scaffolding support.
Classroom Teachers
Special education
teachers
Teacher assistants
ongoing
4 Professional
Development
Provide focused time for Math Leaders to share
instructional strategies - Mentor Share Fair Literacy Mentors
Administrator CIC monthly
Provide professional development based on "best
practices" in Mathematics.

12
HEO #2 Continuous Improvement
Overall Responsibility: Administrator, CIC
This Action Plan aligns with the strategies and directions identified in Section 1 and 2 of the School Improvement Plan. The Goals and
strategies are translated into specific actions with responsibilities and completion dates. The Continuous Improvement PRocess is
identified and explained in Section 5 of the School Improvement Plan.
Goal
BCSC
Benchmark
Spring
2010
Spring
2011
Spring
2012
Spring
2013
2014
Target
W.D. Richards Elementary School will be recognized with a letter grade of “A” as determined by PL 221 criteria.
1.1 W.D. Richards will be recognized as an exemplary school
by 2012
Academic
Progress
Letter
Grade C
Letter
Grade A
Letter
Grade A
1.2
W.D. Richards CIC will develop a continuous
improvement process which supports the student UDL
learning environment.
Strategy Action Plan Responsibility Date
1
Student Data
Folders (Option to
Classroom
Teachers)
Students chart relevant data: attendance, writing, behavior, etc. in
data folders provided.
Administrator CIC Classroom
teachers ongoing
CIC will share samples data collection forms, goals, action plans, and
provide training for staff. Administrators Grade
Level Teams ongoing
2 UDL/Inclusion
Action Plans
Inclusion plan used as "roadmap" for year wide study and
implementation of UDL.
Administrator, CIC ongoing
Resources will be sought through technology monies and
grants to support equitable distribution of equipment.
Administrator, CIC, Classroom
Teachers ongoing
3
Conferences
for student
progress
Parent, child, teacher conferences to plan goals for
the year and examine student progress during the
year will be planned and held as needed or twice a
year if corporation directive.
W.D. Richards' Teachers,
Administrator ongoing
S 2 S Meetings
Grade level teams meet twice a year with previous and next
grade levels to discuss student instructional needs and grade
placement for next school year.
Classroom Teachers, Special
education teachers ongoing
Monthly grade level meetings are held with administrator
and staff to discuss instructional needs.
Administrator, CIC, Classroom
teachers ongoing
Administrator meets quarterly with BCSC cabinet to discuss
building needs.
Administrator
5 Goal Action
Teams
CIC will work with Goal Action Teams and building mentors
to enhance curriculum development.
Administrator, CIC ongoing

13
HEO #3 Effective and Efficient Use of Financial Resources
Overall Responsibility: Administrator, Office Staff BCSC will maintain a 7-9% operating balance in the General Fund by 2012. All units of BCSC will address ways that can improve
efficiency and effectiveness. BCSC will explore partnerships and research to help generate revenue for school instruction.
Goal BCSC Benchmark
Spring
2010
Spring
2011
Spring
2012
Spring
2013
2013
Target
1.1
W.D. Richards
will practice
effective and
efficient use
of financial
resources
100% 100% 100% 100% 100%
Strategy Action Plan Responsibility Date
1 Documenting
Funds
All monies are turned into office and deposited in proper
account.
Office Team ongoing
Fundraisers are pre-approved. Administrator
Office Team ongoing
2 Audits
State Board of Account Audits are passed. Administrator, CIC ongoing
3 Professional
Development
Funds
Funds will be allocated based on availability of
money in budget, goals and action plans
Administrator ongoing

14
HEO #4 Safe and Healthy Learning Environment Vision - W. D. Richards students will feel safe and secure so that they can focus on improving their academic skills.
Goal BCSC Benchmark 2010 2011 2012 2013
2014
Target
1.1
Improve satisfaction
with W.D. Richards
Elementary School –
Those who feel valued
78% 71% 81% 96% 100%
Strategy Action Plan Responsibility Date
1 Continue high level of
satisfaction at W.D.
Richards
Monitor with survey during 2013-2014 year Stakeholder Satisfaction Team ongoing
Administrator Office
Team ongoing
2 Continue
implementation of
school-wide PBIS plan
Conduct school-wide PBIS training the first two weeks
of school in classrooms and throughout building.
Administrator PBIS GAT Team,
Teachers ongoing
Meet monthly to review PBIS Data, Office Discipline
Referrals and Richards Raves
Conduct school-wide reteaching as needed and conduct
school-wide motivational program when available
Distribute Richards Raves Cards to each student and
after receiving five staff signatures name goes into a
drawing
3 Anti Bullying
programming
Continue to use and follow Olweus bullying prevention
guidelines
Administrator ongoing
Survey 5th and 6th grade students per BCSC
implementation
Ongoing education of all students about
bullying prevention.
4
Healthy Initiatives
Grant
Support the grant parameters with diet,
exercise, and nutrition education. Administrator, School Nurse,
Cafeteria Manager, and Gym
Teacher
ongoing

15
Figure 2.2- 2 WD Richards’ Balanced Scorecard: Attendance, Continuous Improvement, Financial, Technology
W.D. Richards Dashboard and
Balance Scorecard Technology HEO
#4
2009 -
2010
2010 -
2011
2011 -
2012
2012 –
2013
Goal
2013-2014
Number of students per computer 3 to 1 3 to 1 2 to 1 2 to 1
2 to 1
Assistive technology per
classroom…Document Camera,
SMART Board 17 17 19 24
24
W. D. Richard’s Elementary School Dashboard and Balance Scorecard Attendance
2009 – 2010
2010-2011
2011-2012
2012- 2013
Goal 2013-2014
Student Attendance Rate (All grades, Chart 7.3.4)
97.6%
96.8%
97.2%
97.2%
98%
W.D. Richards Dashboard and Balance
Scorecard Aligned Continuous
improvement HEO #2
2008 -
2009
2010 –
2011
2011 –
2012
2012-
2013
Goal
2013-
2014
Number of CIC Meetings held and
recorded 10 10 10 10
10

1
3.0 Student, Stakeholder, and Market Focus
W.D. Richards considers knowledge of student and stakeholder needs essential to its success and the
ability to articulate where performance is meeting goals and where improvement is required.
Awareness of student and stakeholder needs is central to achievement of the district’s HEOs. W.D.
Richards’ key stakeholder groups include:
• Students (Current, Former and Future)
• Staff
• Families of students
• Neighbors
• The business community
• Higher education
• Government (Local, State and Federal)
3.1 Student, Stakeholder, and Market Knowledge
3.1.a (1) KNOWLEDGE OF STUDENT AND MARKET NEEDS AND EXPECTATIONS:
We get satisfaction information from surveys conducted yearly. As shown in Figure 7.2.1– 7.3.1. We
believe the best way to obtain parent, community and business involvement is through input collected
from surveys, school functions, and volunteers.
In addition, W.D. Richards’ has a Continuous Improvement Council that has representatives from
teachers, parents, and the community. This group is in charge of reviewing the progress of skills
development of the students, planning strategies for improving those skills, overseeing the action plans
for implementation and monitoring the results. With this system there is a constant scrutiny of data to
prioritize resources for optimum student achievement. Examples of how expectations, needs and
results are identified are shown in Fig. 3.1-1

2
Fig 3.1-1
Needs Determination Method Information Collected and Frequency
PARENTS
Surveys, feedback through parent involvement, feedback through parent conferences and other
meetings with faculty and staff.
STAKEHOLDERS
PTO meetings, School Board meetings, RCIC, and diverse student population
BUSINESS
Information provided from RCIC business consultant and business partners
LOCAL, STATE, AND FEDERAL GOVERNMENT AND REGULATORY AGENCIES Education standards and requirements
Collected as it becomes available, a minimum of twice yearly, analyzed and made available to our school,
RCIC, and staff.
Collected as it becomes available, analyzed and made available to the appropriate level.
Analyzed and made available to the appropriate area.
3.1.a (2) LISTENING AND LEARNING METHODS: W.D. Richards monitors its programs and
services to accommodate the needs of students. Richards’ leadership reviews programs to prioritize and
plan for future staffing and facility needs.
Examples include:
• Gathering enrollment data at all grade levels
• Monitoring daily attendance
• Administering staff, student, and parent surveys
• Monitoring legislation regarding federal and state educational requirements
• Incorporating student incident data to determine weak areas in the learning process.
• Implementing BCSC Positive Behavior Supports initiative.
• Monitoring student ISTEP+ Indiana Academic Skills mastery.
• Monitoring student IREAD Indiana Academic Skills mastery, k-2
• Monitoring DIBELS Assessments
• Standards Based Report Cards for grades k-1

4
Input and information for determining facility needs is summarized in Fig. 3.1-2.
Fig. 3.1-2. Expectations and Feedback
3.1.a (3) KEEPING LISTENING AND LEARNING CURRENT WITH CHANGES IN EDUCATION COMMUNITY
W.D. Richards relies on information from external professional sources and organizations to keep learning and listening methods current. Some of the methods include:
• Professional development opportunities provided through BCSC
• Two Science Mentors attending quarterly meetings
• Two Literacy Mentors attending quarterly meetings
• Two Math Mentors attending quarterly meetings
• One High Ability Mentor
• Instructional Consultation Team comprised of seven W. D. Richards staff members.
• UDL Facilitator
• UDL Instructional Specialists
• Positive Behavior Support initiative
• CCIC provided training on SIP document
P r o f e s s i o n a l D e v e lo p m e n t
W o r k w i t h C o l l e g e sA c a d e m ic C o m m i t t e e s
C o n t i n u o u s I m p r o v e m e n t C o u n c i l s
S t a t e S t a n d a r d sS t a k e h o l d e r S a t i s f a c t i o n
S u r v e y sO lw e u s B u l l y i n g S u r v e y s
T h o s e i d e n t i f i e d a b o v e a n d a l s o I S T E P + r e s u l t s
A c u i t y D ia g n o s t i c T e s t i n g
S T A R R e a d i n g A s s e s s m e n t
E x p e c t a t i o n s id e n t i f i e d b y :

4
• Ongoing interaction with stakeholders face-to face in community meetings, such as PTO and
Family Nights
• Providing Book Buddies and literacy opportunities via the Bartholomew County Literacy Task
Force.
• M2 community volunteers
3.2 Student and Stakeholder Relationships and Satisfaction
2.a(1) BUILDING RELATIONSHIPS:
W.D. Richards believes that having a clear understanding of who its stakeholders are and how their
needs impact the district underlies its ability to provide quality educational programs and services within
the district.
Fig. 3.2-1 illustrates the objectives of W. D. Richards’ stakeholder relationships.
Fig. 3.2-1, Methods to Support Achievement of Key Objectives
Stakeholder and Key Objectives of Relationships
Methods to Support Educational Delivery
STUDENTS
• Mutual commitment to educational excellence
• Well-prepared student
• Use of UDL Framework
• Student Dashboards
• Utilization of IC Team
• Utilization of UDL Facilitator
• Standards Based Report Cards
• Open House
• Project Based Learning
• Literacy and Math Family Fun Night
• Voice/E-mail for all teachers
• Curriculum aligned to Indiana’s academic standards
• Differentiated instruction
• Daily announcements
• Extracurricular events
• Student Council
• Academic Bowl competition teams
• Destination Imagination
• Grade Level and Teacher Web sites
• Use of SMART Boards™
• School wide Communication folders
• Use of teacher assistants in instructional delivery
• Use of parent volunteers
• Field Trips
• Convocations

5
PARENTS
Active support and involvement in parent’s education
• Parent-Teacher conferences
• Back to school nights
• Voice/E-mail for all teachers
• Math and Literacy Family Fun Nights
• Open houses
• PTO
• Grade Level, Teacher and School Web sites
• Parent Connect
• Classroom Programs and Events
• Assessment reports
• School wide Newsletter (Electronic and hard copy)
• Classroom newsletters
DISTRICT RESIDENTS
High quality educational programs for all learners
• Communication at public meetings
• Community meetings and forums
• Board of School Trustees meetings
• Web site
• Veteran’s Day Program
BUSINESS
Preparation of a qualified workforce
• Book Buddies
• Business partners/mentors that support each school and program.
• CIC, CCIC membership
HIGHER EDUCATION
Seamless education services.
• Student Teacher placement
• Cadet Teachers from East High School
LOCAL, STATE AND FEDERAL GOVERNMENTS AND REGULATORY
AGENCIES
• Public Law 221
• No Child Left Behind Act
• Individual Education Plan (Special Education)
• 504 Plans
1.2.a (2) MANAGING RELATIONSHIPS: W. D. Richards uses surveys, direct involvement and
interaction to manage its relationship with stakeholders. Feedback through interaction in a variety of
ways is reviewed at various levels and then translated into improvement actions. Fig. 3.2-2 on the
following page provides information about how W. D. Richards addresses key stakeholder relationships.
RICHARDS RAVES!
Richards is pleased to have an active and supportive PTO. Support is
given to the staff through funding for professional development, staff
appreciation events, volunteer work within the school, general school
fundraising, contributions to student activities/trips, and specific
monetary donations to all staff for educational materials.

6
3.0 Student, Stakeholder, and Market Focus, Continued
Fig. 3.2-2, Student and Stakeholder Relationship Management
How Relationship Needs are Addressed
Building Relationships/ Follow up Partnerships
STUDENTS
• Social
• Behavioral
• Academic
• Wellness
• DARE program for 6th graders sponsored by CPD.
• Homework Helps…after school program for homework assistance.
• Monthly Skating Parties sponsored by PTO.
• Fall Fun Festival/Book Fair
• School Wide Literacy Events…
• Quarterly Awards Convocations
• Year End Field Day
• Student Council
• Academic Teams
• Lego Team
• Destination Imagination Teams
• Athletic Teams
• Literacy Festival
• Columbus Philharmonic
• Green Team
• Family Services
• CPD
• First Baptist Church
• PTO
• Indiana State
• Student Council
• Book Buddies
• East High School
• North High School
• Skateland
FUTURE STUDENTS
• Demographic data
• Community-based services (Caring Parents, Healthy Community Initiative)
• Kindergarten orientation
• Back to school nights
• Pre-kindergarten available to students in each elementary attendance area.
• Family Math and Literacy Events
• W.D. Richards Family Events
• Community Literacy Event
• Family School partners.
• Private kindergartens
• Head Start
• Busy Bees

PARENTS
• Open door policy
• Parent-Teacher meetings
• CCIC and RCIC membership
• Athletic Events
• Parent Teacher Conferences
• Home to School Communication…Newsletter, Web Site, ParentPortal
• PTO
• Representation on committees (curriculum review, textbook adoption, etc.)
• Literacy Fun Night
• Math Fun Night
• Members in school and program CIC’s.
• Members in CCIC
• Richards Staff
• PTO
COMMUNITY RESIDENTS
• Open door policy
• CCIC and CIC membership
• North and East High School Students
• Volunteer Efforts
• Homework Helps … partnership with First Baptist Church across the street.
• Face-to-face interactions
• ISTEP+ and IREAD Results printed in local newspaper
• Representation on committees (curriculum review, textbook adoption, etc.)
• Book Buddies
• Senior Projects
• Community service organization boards
• Columbus Regional Hospital
• North and East High Schools
BUSINESS
• Open door policy
• Columbus Skate Land
• Ivy Tech
• IUPUC
• Membership on CCIC
• Business partners at each school and program
• Columbus Quality Improvement Center (CQIC)
• Baldridge in education mentoring and training
• Cummins
HIGHER EDUCATION
• Articulation agreements
• Professional Development
• Student Teacher mentors
• Middle School Transitioning Visits
• IUPUC
• IVY Tech
• North
• East
• Northside
• Central

3.0 Student, Stakeholder, and Market Focus , Continued
3.2.a (3) COMPLAINT RESOLUTION PROCESS: To effectively manage complaints, W. D. Richards employs
a Complaint Resolution Process (Fig. 3.2-3). Students and parents receive guidelines on where to take
concerns at the beginning of the school year. Staff is instructed where to direct complaints in each
school/department. All complaints are logged and categorized. School leadership reviews the
complaint log as part of the strategic planning process.
Fig. 3.2-3, W. D. Richards Complaint Resolution Process
STEP ACTION
1 Complainant addresses complaint to teacher or appropriate staff member for discussion. If resolution not attained or assistance is needed, direct complaint to building principal or administrator.
2 Building principal or administrator arrange meeting with complainant and staff member to discuss complaint.
3 If complainant or subject of the complaint is not satisfied with the resolution, superintendent, or designee, meet with complainant and appropriate representatives from the school to resolve complaint.
4 • If complainant is not satisfied with resolution, complainant completes a formal Complaint Resolution form and sends it to the office of the Superintendent or designee.
• Confirmation that complaint has been received is mailed within five days.
• Complaint is referred to the Complaint Resolution Committee.
5 Superintendent, or designee, facilitates Complaint Resolution Committee meeting to resolve complaint.
6 Complaint Resolution Committee recommends appropriate action to superintendent.
7 Superintendent determines what action to take.
8 Superintendent notifies complainant and the subject of the complaint in writing of the action taken within seven days.
9 If complainant or subject of complaint is not satisfied with the resolution, they may make an appeal in writing to the Board of School Trustees.
See policies - 9130 - PUBLIC COMPLAINTS AND CONCERNS , 5710 - STUDENT COMPLAINTS
3362 - ANTI-HARASSMENT
3.2.a (4) APPROACHES TO MANAGING EFFECTIVE RELATIONSHIPS: When W. D.
Richards student and stakeholder needs change, it is determined how best to respond and deploy a
revised approach. The “Plan, Do. Check, and Improve” process is used and adjustments are made as
warranted. If a new practice meets the needs of students and stakeholders, the approach is adopted as
common practice, documented and communicated and staff is trained accordingly.

9
3.2.b. Student and Stakeholder Satisfaction Determ ination
3.2.b (1) STUDENT AND STAKEHOLDER SATISFACTION DETERMINATION: Student and stakeholder satisfaction levels are measured using a variety of methods and reviewed at the building and district levels. Data is used as input in the strategic planning process and to determine student needs. Currently, the Olweus Anti-Bullying program survey is administered to 5th and 6th graders.
3.2.b (2) FOLLOWING UP ON INTERACTIONS WITH STUDENTS AND STAKEHOLDERS: Faculty, staff and administrators are responsible for following up on interactions with students and other stakeholders in order to get prompt and actionable feedback following complaints (see Fig. 3.2-3, Complaint Resolution Process).
3.2.b (3) USING SATISFACTION MEASURES AND BENCHMARKS: W. D. Richards administers the satisfaction surveys at the school level.
3.2.b (4) APPROACHES TO MAINTAINING SATISFACTION: When needs change, W. D. Richards determines how to best respond and pilots a revised approach. The pilot is monitored and adjustments are made when warranted. When the new approach is proven to be workable, the practice is standardized and deployed where needed and staff is trained accordingly. This year, the ACUITY predictive on-line assessment will be given three times to determine the areas students need to gain proficiency in for ISTEP+. In addition, DIBELS is administered three times per year to students in K-2nd grades to measure growth in the areas of language arts and math.

4.0 Information and Analysis
4.1 Measurement and Analysis of Organizational Perf ormance
BCSC academic and organizational information is collected and analyzed using a variety of tools throughout BCSC at the district, building, classroom and student level.
4.1.a (1,2 and 3) Performance Measurement BCSC’s selection and use of data is driven by the five district HEOs from which key performance measures and supporting data have been identified. The HEOs and performance measures are also reviewed against Indiana Law 221 and National Program ‘No Child Left Behind’ to assure all relevant measures of performance has been covered.
At the district level, the Cabinet and Principal/Directors set the objectives and determine measures that will assess progress toward achieving the objectives. The district wide measures are then reviewed at the school and program level and the strategies and implementation plans are developed. Some of the strategies are district wide and some are school and program specific. The measures are then developed to determine if the strategies are making progress toward meeting the objectives. Measures that do not lead to an objective are reviewed and dropped if they are not adding value. The process is depicted in Fig. 4.1-1.
BCSC Continuous Improvement Initiative
District Mission
Deeper Learning is our individualized approach for preparing all learners to succeed in a competitive global economy and democratic society and to tackle the complex issues they will encounter.
District Vision
BCSC demonstrates a community commitment to deeper learning for one…and all.
District High Expectation Objectives
BCSC will ensure a balanced, intentional and forward looking approach to meet
the following objectives:
• Provide a welcoming and diverse learning culture of respect, fairness and trust
• Advance a deep community commitment to all learners’ health, personal and academic success
• Enable achievement of core academic knowledge and varied levels of critical thinking
• Foster multiple perspectives to develop global citizens
• Provide multiple pathways that intellectually engage all learners
• Provide multiple pathways that intellectually engage all learners
• Promote and support modern, collaborative learning environments
• Cultivate a commitment to a life-long learning process for all
Fig. 4.1-1
1
O b je c t iv e s , G o a lsa n d M e a s u r e s
S t ra te g ie s to A c h ie v e G o a ls
Im p le m e n t S t ra te g ie sa n d A c t io n P la n s
R e v ie w re s u lts a n d a s s e s s w h a t a c t io n n e e d s to b e ta k e n
W h a t a n d W h y
H o w
S p e c if ic s te p s , w h o , w h e n , w h e r e , h o w m u c h
E v a lu a te a n d a d ju s t

The CCIC uses the Baldrige assessment to monitor the systems and process planning and implementation of School Improvement Plans. Schools are measured on systems improvement as well as results improvement. The primary end result measures are ISTEP+ results for Elementary Schools. Since the results are taken just once a year, they are supplemented with IREAD, mCLASS, DIBELS, STAR and 9 week assessments, as well as Acuity assessments. The data collection and analysis of this data has been automated into an Access database and is identified by staff and parents as the Student Dashboard (figure 4.1-2).
The Student Dashboards create a one page visual of each student’s assessment results for parents, teachers, and administrators to get a quick snapshot of the student’s performance on district assessments. Another innovation from this process is the fact that we want the students to not just obtain facts but to continue to build their own learning skills. We have begun using rubrics data in some areas to measure some of the thinking skills and not just the paper-pencil skills of standardized testing.
Fig. 4.1-2
2

Bartholomew Consolidated School Corporation Page 4.3 Document Created: 10/6/04 District Continuous Improvement Plan Document Revision: 1/23/05, Rev 4 ww
W.D. Richards uses a variety of both short and long term assessments to drive decision making regarding student instruction and student success that includes:
• Acuity Predictive, grades 3-6
• Read 180 for grades 5,6
• Book Buddies …grades 2 and 3 tutoring
• Minds on Math…grade 4 tutoring
• Reading story and unit tests
• mCLASS for K-2 reading and math
• IREAD for K–2 reading proficiency
• Basic math facts tests
• ISTEP+ results
• Student Profile grade level placement form
• Classroom incentive programs for behavior, academic, and attendance achievement
• BURST (Grades K,1,2)
• Progress Monitoring
• Beginning/End of year assessments in reading and math
Fig. 4.1-3, BCSC’s Proposed Assessment Plan (2013-2014)
Assessment Frequency K 1 2 3 4 5 6 7 8 9 10 11 12
Kindergarten Screening 1 time X
BCSC Writing Assessment
4 times/year X X X X X X X X X
IREAD Spring X X X X
ISTEP+ Spring X X X X
Acuity 3 times yearly X X X X
mCLASS 3 times yearly x x x
STAR 4 times yearly x X X X X X X
4.1.a (3) COMPARATIVE DATA SELECTION: BCSC selects comparative data from highest performing school districts throughout the United States for use as benchmarks. Schools do a comprehensive Satisfaction Measure survey. The survey measures satisfaction ratings of staff, parents, and students across key school areas such as climate, instruction, and safety. This allows us to access trend and improvement related data.
4.1.b Performance Analysis
4.1.b (1) DATA ANALYSIS: Several data analysis tools, common to organizations following total quality management principles, are used by BCSC at the district, building, classroom and individual student level. BCSC follows the “Plan, Do, Check, Improve” process shown in Fig. 1.1-4, in Section 1. BCSC uses the PDCI process to review all types of student, student
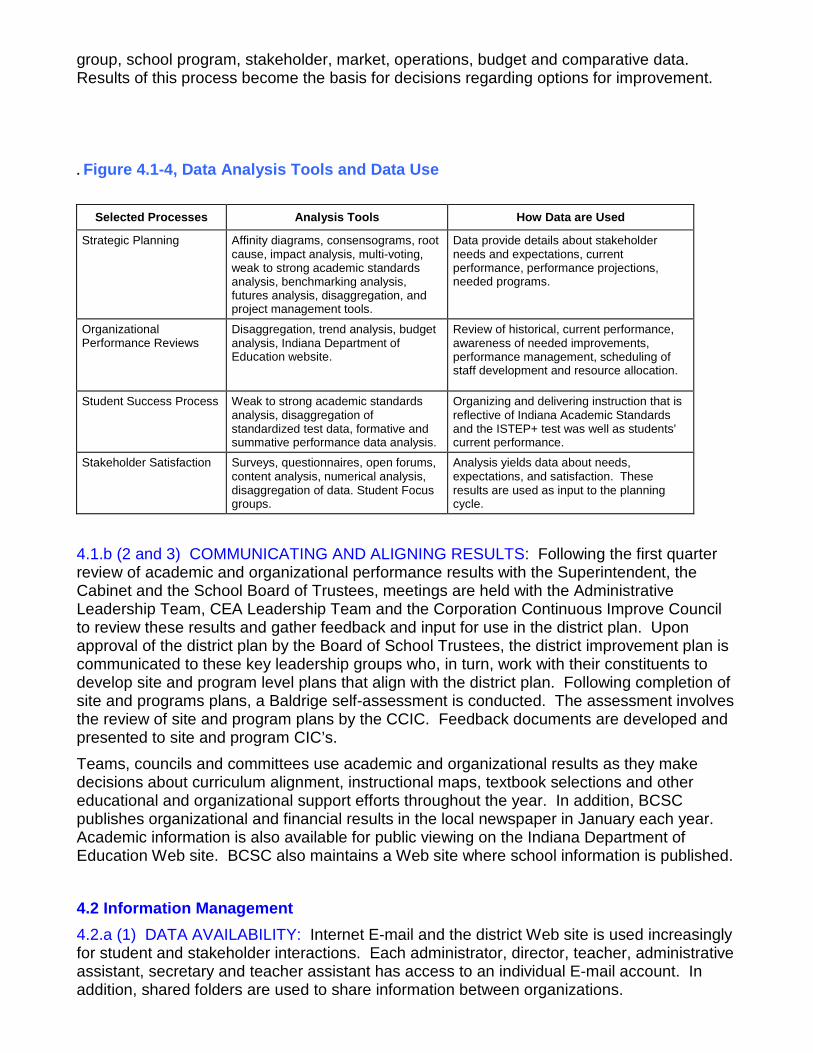
group, school program, stakeholder, market, operations, budget and comparative data. Results of this process become the basis for decisions regarding options for improvement.
. Figure 4.1-4, Data Analysis Tools and Data Use
Selected Processes Analysis Tools How Data are Used
Strategic Planning Affinity diagrams, consensograms, root cause, impact analysis, multi-voting, weak to strong academic standards analysis, benchmarking analysis, futures analysis, disaggregation, and project management tools.
Data provide details about stakeholder needs and expectations, current performance, performance projections, needed programs.
Organizational Performance Reviews
Disaggregation, trend analysis, budget analysis, Indiana Department of Education website.
Review of historical, current performance, awareness of needed improvements, performance management, scheduling of staff development and resource allocation.
Student Success Process
Weak to strong academic standards analysis, disaggregation of standardized test data, formative and summative performance data analysis.
Organizing and delivering instruction that is reflective of Indiana Academic Standards and the ISTEP+ test was well as students’ current performance.
Stakeholder Satisfaction
Surveys, questionnaires, open forums, content analysis, numerical analysis, disaggregation of data. Student Focus groups.
Analysis yields data about needs, expectations, and satisfaction. These results are used as input to the planning cycle.
4.1.b (2 and 3) COMMUNICATING AND ALIGNING RESULTS: Following the first quarter review of academic and organizational performance results with the Superintendent, the Cabinet and the School Board of Trustees, meetings are held with the Administrative Leadership Team, CEA Leadership Team and the Corporation Continuous Improve Council to review these results and gather feedback and input for use in the district plan. Upon approval of the district plan by the Board of School Trustees, the district improvement plan is communicated to these key leadership groups who, in turn, work with their constituents to develop site and program level plans that align with the district plan. Following completion of site and programs plans, a Baldrige self-assessment is conducted. The assessment involves the review of site and program plans by the CCIC. Feedback documents are developed and presented to site and program CIC’s.
Teams, councils and committees use academic and organizational results as they make decisions about curriculum alignment, instructional maps, textbook selections and other educational and organizational support efforts throughout the year. In addition, BCSC publishes organizational and financial results in the local newspaper in January each year. Academic information is also available for public viewing on the Indiana Department of Education Web site. BCSC also maintains a Web site where school information is published.
4.2 Information Management
4.2.a (1) DATA AVAILABILITY: Internet E-mail and the district Web site is used increasingly for student and stakeholder interactions. Each administrator, director, teacher, administrative assistant, secretary and teacher assistant has access to an individual E-mail account. In addition, shared folders are used to share information between organizations.

Data and results are communicated to stakeholders through electronic, print and a wide variety of face-to-face interactions including public forums and meetings as well as faculty and staff meetings, and committee and task force meetings. Formative data is shared in order to inform key stakeholders of progress toward goals.
Parent Portal is an initiative that allows parents access to their students performance in regard to grades, discipline, homework status, and attendance.
4.2.a (2) DATA INTEGRITY: Fig. 4.1-5 shows how BCSC ensures data integrity, reliability, accuracy, timeliness, security, and confidentiality.
Fig. 4.1-5, Data Management Criteria
Criteria How BCSC Achieves the Criteria
Integrity (Validity)
All data collected and used are aligned with the HEO’s / goals. If not, we do not gather (unless for state and federal compliance).
Reliability We use standardized, computer-based measures where possible (ISTEP+, Acuity, mCLASS, BCSC Developmental Reading and Math Assessments) doing so allows state and national comparisons. When results of surveys are analyzed, the rule of three applies (at least three people reach consensus on results). We use the same surveys, tests, over time to ensure test reliability.
Accuracy BCSC uses standardized, computer-based measures where possible.
Timeliness All survey data are analyzed and results provided as soon as the results are available. This enables each person to be in control of the assessment process as much as possible to ensure timeliness of student and teacher performance data. Formal performance review meetings are conducted (principal and all staff) two or three times yearly.
Security/ Confidentiality
Teachers maintain security and confidentiality of standardized test records, cognitive skills data, special education-related information, and all other potentially sensitive information. Counselors, secretarial staff, administrators, and all other staff ensure that no confidential information escapes beyond the “need to know” circle. Certain information (permanent records, health information, financial records) are kept in secure areas.
4.2.a (3) MAINTAINING CURRENT DATA AND INFORMATION AVAILABILITY: User requirements are defined regarding data and information availability is gathered through meetings, conferences and other face-to-face interactions.
4.2.b Hardware and Software Quality
4.2.b (1) HARDWARE AND SOFTWARE RELIABILITY AND EASE OF USE: The BCSC Technology Continuous Improvement Council reviews site and program annual improvement plans to ensure alignment with the district’s technology plan. The district plan guides the adoption of new hardware and software. Additionally, the district technology department continuously seeks input from users regarding user-friendliness and reliability of hardware and software. The technology department leads or participates in development of software and hardware that supports continuous improvement programs and initiatives. One example includes the implementation of computer-generated report cards for elementary students that the implementation of a district-wide electronic gradebook.
The technology division continually upgrades or replaces every major administrative system. These systems include the student administration system, the financial and HR system, the cafeteria management system, the transportation and logistic system, and the school library system. Automated interfaces are being implemented to improve the transfer of information from one system to another.
4.2.b (2) MAINTAINING CURRENT HARDWARE AND SOFTWARE: The district’s technology plan provides a mechanism for gathering information about the latest technology and its possible use in BCSC classrooms and by administrative support personnel. BCSC’s

technology department provides teacher and student training and support for hardware maintenance and repair.
1
5.0 Faculty and Staff Focus
5.1 Work Systems
W.D. Richards organizes all work and jobs around BCSC vision of deeper learning for achievement of student success. The human resources (students, teachers, parents, support staff, counselors, principal and community resources) are critical to student achievement.
5.1.a (1) Organization and Management of Work: The organization and management of work and jobs begins with high expectation objectives determined by BCSC.
W.D. Richards staff members play an important role in the execution of all improvement plans. Staff members serve on Goal Action Teams. An Action Team has been established for each major goal area. Goal Action Teams meet monthly as structured, facilitated groups to monitor progress toward their established goals, to discuss difficulties in day to day procedures, to prepare status reports for all other systems, to celebrate successes, and to participate in staff development opportunities provided by co-workers or an outside presenter.
In order to promote cooperation, collaboration, initiative, innovation, and flexibility, faculty and staff have designed, organized, and managed execution of all plans. Schedules provide joint planning opportunities. Monthly staff meetings, e-mail, and weekly Staff Newsletters enhance communication by allowing staff to share best practices and progress toward school aims. Collaboration and representation are enhanced in the leadership system where each Goal Action Team is represented on the CIC. W.D. Richards teachers focus on the five components of literacy during a ninety minute language arts block. We continue to develop the staff’s understanding and pursue full implementation of the Universal Design for Learning principles. Professional development for staff meetings is designed around implementing the UDL principles in the classroom learning environment.
W. D. Richards’ teachers collaborate in professional learning communities to improve teacher and student performance. A professional learning community is defined as more than one staff member working together for continuous improvement.
5.1.a (2) Capitalizing on Diverse Ideas: W.D. Richards teachers are encouraged to develop their full potential through professional learning communities. These communities include:
• Summer Academies through BCSC to earn knowledge and Professional Growth Points
• Continuous Education
• Center for Teaching and Learning Workshops
• UDL Institute
• Workshops and trainings related to teacher interests

2
• Becoming teacher trainers in specific areas
• Grade-level meetings
• Professional Development at Staff Meetings
• Structured Facilitated Groups
• Goal Action Teams
Our principal participates in a variety of professional development opportunities on the following topics:
• Universal Design for Learning
• Positive Behavior Instructional Supports
• Anti-Bullying Task Force
• Instructional Consultation
Richards support staff participates in a variety of training related to their specific job responsibilities:
• ESL
• Library Workshop for new materials
• Media Center circulation training
• Technology meeting
• Teacher Assistant informational meetings
• Power School
• Power Teacher
• Cafeteria-related trainings and workshops
• Custodial trainings
• School bus safety procedures training
• Professional development at Teacher Assistant Meetings
5.1.b Faculty and Staff Performance Management System
The teacher evaluation system is a professional growth system that ties teacher growth and development to the BCSC Teacher Success Rubric which includes sections on Academic Citizenship, Academic Success/Learning Outcomes, PBIS, and UDL. The evaluation system includes a Goal Setting Conferences, Pre-Observation Conferences, Formal Observations, Post-Observation Conferences, and Summative Conferences conducted with the building administrator. Formal observations are conducted two times per year with each certified staff member. Follow up conferences are held within

3
seven days after each observation to discuss progress made towards previously set goals and to create a plan for growth.
Monthly staff meetings are designed around professional development needs. Topics for each meeting are based on corporation initiatives, building goals, and staff interests. Professional development meetings are led by GAT team members, SFG leaders, staff members trained in relevant topics, and corporation leaders.
5.1.c (1) Hiring and Career Progression
There are opportunities for employees to progress to positions with additional responsibilities and compensation. The principal provides leadership type experiences for staff members who are interested in attaining administrative positions. Being designated the person in charge when the principal is absent from the building, serving as leaders of GAT teams, Literacy Mentors, Math and Science Mentors, SFG facilitator, High Ability Mentors and being a member the RCIC.
Hiring for all positions at Richards involves a team of staff members. The team consists of relevant staff members which could include CIC members, grade level members, principal, and/or support staff. Hiring decisions are based on team input with final building decision determined by building principal.
5.1.c (2 and 3) Skills Needed By Potential Faculty/Staff:
Potential staff members will exhibit characteristics that align with principles of UDL as well as BCSC and Richards vision. The interview process involves teachers, stakeholders, and building leaders in selection of new employees. Candidates will demonstrate the following characteristics:
• Positive flexible learning environment
• Collaboration to improve learning
• Citizenship
• Evidence of UDL principles
1. Provide Multiple Means of Representation
2. Provide Multiple Means of Action and Expression
3. Provide Multiple Means of Engagement
5.2 Faculty and Staff Learning and Motivation 5.2.a (1 and 2) Education and Training/Use of Faculty and Staff Input: The BCSC professional development plan links professional development opportunities with district goals. There are several ways that these opportunities are provided to Richards Staff:
4
*Richards staff members conduct monthly professional development trainings. Trainings focus on research based instruction that align with UDL concepts for engagement, representation, and expression. *Literacy Mentors and Math/Science Mentors and other district level staff present learning opportunities for the entire staff one on one training as requested. *Common plan times are built into the master schedule to allow teachers to work collaboratively. *Summer Academy course offerings provide the opportunity for all faculty and staff to enhance their skills and knowledge at no cost to the individual. As we learn instructional excellence practices is one area we transfer that learning to other areas to support continuous improvement. *The Columbus Learning Center provides opportunities for specific course work. These courses are offered in conjunction with Indiana University-Purdue University at Columbus, Purdue Statewide Technology, Ivy Tech State College and Workforce Development. Richards also utilizes an Instructional Consultation Team (ICT). The goal of the ICT is to enhance, improve, and increase student and staff performance. Objectives of ICT include: *Develop a systematic support network within our building, including a trained Instructional Consultation Team *Enhance teachers’ skills in and application of best practices of instructional assessment and delivery. *Develop school-wide norms of collaboration and problem solving. *Utilize data for classroom and school decisions. The Instructional Consultation Team receives simple requests for assistance from teachers around individual student, group, or whole class concerns in reading, writing, math, and/or behavior. At that point, a single team member (case manager) works shoulder-to-shoulder with the requesting teacher to clarify the concerns, conduct instructional assessments, develop goals, design interventions that are implemented in the general education classroom, and monitor student progress. In weekly meetings, the ICT reviews cases, collects program-wide data, problem-solves tough cases, and engages in ongoing professional development for all team members. Evaluation data is collected yearly and entered into an on-line tracking system that generates reports useful for evaluation of ICT training, implementation, and outcomes. Instructional Consultation Team data also provides a means for evaluating resource allocation by connecting service delivery to student outcomes. In addition, school and district levels can cross-reference the on-line data with those from other monitoring systems including ISTEP+.

5
5.2. a (3) Addressing Staff and Faculty Training: There is an orientation for all teachers who are new to the district regardless of their years of experience. Each district employee must receive training in dealing with blood-borne pathogens. The Director of Nursing monitors employee participation levels. Maintenance and food service employees receive safety training in each of their areas. 5.2 a (4, 5, and 6)Faculty and Staff Training Delivery and New Knowledge Deployment. A new approach to knowledge deployment at staff meetings has been the addition of Structured Facilitated Groups using protocols to disperse knowledge. Staff members are responsible for demonstrating research based instruction used in their classrooms for the rest of the staff. District level resources and building level mentors are also used by staff to learn best practices.
5.3 FACULTY AND STAFF WELL-BEING AND SATISFACTION
5.3.a (1) KEY FACTORS AFFECTING WELL BEING, SATISFACTION, and MOTIVATION:
A positive, supportive environment contributes to increased productivity and student achievement, as well as greater satisfaction among all stakeholders. Noteworthy health, safety and ergonomic factors include:
• Health
o Construction of a walking track around the perimeter of the playground
o An Automated External Defibrillator
o Wellness Program
o Healthy Communities Activities
o 4H Enrichment Program
o Medical/Health Speakers
• Safety
o Use of 2-way radio sets to increase response time in an emergency
o Secure entry to ensure all visitors enter the building through the main office
o School Crisis Plan
o Early Dismissal Plan
o Principal cell phone
o Visitor Sign-in Procedure

6
o Limited Criminal History checks
o Exterior doors that are locked
o Surveillance cameras
Additional detailed information can be found in the Crisis Plan that can be found in the Richards’ office.
5.3.b (1) KEY FACTORS EFFECTING WELL BEING, SATISFACTION, and MOTIVATION: A Richards stakeholder survey is administered every year to determine faculty and staff satisfaction. Responses are segmented into teacher and staff groups so that improvement can be targeted for the most effective results. Each CIC receives the data for their building or program and develops a plan of action based on the information provided.
The CEA monitors satisfaction and work environments. Concerns are brought to monthly Discussion Committee meetings for input and resolution. The Discussion Committee is composed of administrators and CEA leaders who address those topics discussable under Indiana Public Law 217.
The Support Staff Roundtable serves as a voice for support staff personnel. They meet monthly or quarterly and discuss issues important to each group.
5.3.b (2) EVALUATION METHODS:
The Teacher Success Rubric is used for evaluation purposes. The rubric includes sections on Academic Citizenship, Academic Success/Learning Outcomes, PBIS, and UDL. The evaluation system includes a Goal Setting Conferences, Pre-Observation Conferences, Formal Observations, Post-Observation Conferences, and Summative Conferences conducted with the building administrator.
Each employee group has a grievance procedure available to it. These grievances are monitored by the district office.
5.3.c (3 and 4) Assessment Methods and Measures:
The CIC determines which results of the Parent Satisfaction Survey are key to the achievement of its goals. Plans of action relative to improvement are developed. The CCIC oversees this area of improvement for the district.
A faculty and staff survey offers information regarding faculty and staff well being, satisfaction, and motivation. Other data indicators are compiled by the Stakeholder Satisfaction committee including staff retention, staff attendance, and grievances filed. Current trends reflect a positive satisfaction level.
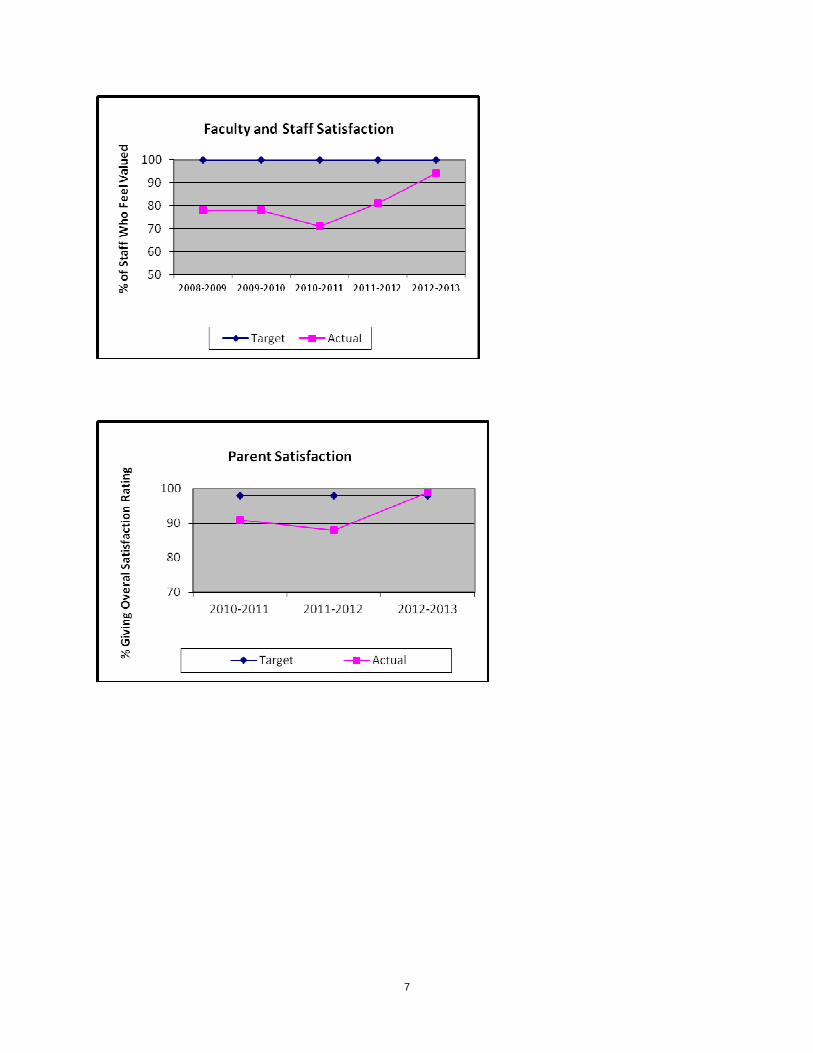
7

6.0 Process Management 6.1 Work Systems 6.1.a. Determining learning centered UDL processes and student success:
Learning centered UDL processes are determined by studying the flow and delivery of education
activities and the variables that impact the quality of the UDL learning experience. Figure 6.1.1 helps to
describe what factors are considered in optimizing the UDL learning experience for all students and
stakeholders.
W.D. Richards establishes its UDL learning centered processes by assessing the needs of the students,
the community, and all stakeholders in the education process. In addition, W.D. Richards considers the
research of leading educational scholars and monitors the application of the principles of UDL to meet
the skill needs of the learners. Also, strengths, weaknesses and areas of interest of instructional staff
are assessed for planning professional development to consistently build capacity.
6.1-1 UDL Learning Centered Processes
6.1.a. (1) Identifying key learning center requirements.
Student learner needs are identified using the following criteria:
• Federal and state requirements
• UDL Principles to help meet the needs of diverse populations of students and learning preferences
• Helping students achieve academic excellence
• Community expectations
• Research based materials and delivery processes
From studying the learning system and variables affective the quality of the learning experiences, we determine
the core processes to be those shown in Figure 6.1-2:
Figure 6.1-2 Core Processes Utilizing staff effectively through the school’s master schedule. (flowchart 6.1-2a)
Selecting, implementing and delivering common standards based instructional material and data. (flowchart 6.1-2b)
Lifelong
Learners

Determining optimum instructional delivery methods with a focus on the individual student by utilizing the concepts of UDL.
(flowchart 6.1-2c)
Understanding each student’s learning style, approach to learning and constantly improving the learning process for each
student through the use of technology. (flowchart 6.1-2d)
Providing a variety of experiences that enhance learning in a positive and nurturing environment. (flowchart 6.1-2e)
The following flowcharts illustrate the core processes of RIES in the areas of personnel, instruction, instructional
materials and resources, climate and culture, and safety/emergency plans.
• The personnel flowchart illustrates how the CIC constructs the master schedule each year to best utilize
staff resources.
• The instruction process flowchart illustrates how the concepts of UDL instruction at Richards.
• The instructional materials and resources flowchart illustrates how technology is to be used to maximize
efficiency and effectiveness.
• The climate and culture flowchart illustrates Richards use of PBIS concepts to reward the positive
behavior of our students.
• The safety/emergency plan flowchart illustrates the Richards process of building security.
These core processes are reviewed with staff at the beginning of the year and reinforced throughout the year as
needed. The processes are then reviewed by the Richards CIC at the end of the each school year and adjustments
are made to the processes as needed based on the Plan, Do, Check, Improve cycle.
Flowchart 6.1-2a Personnel: Master Schedule
Determine lunch/recess times
Assess certified staff
Determine when classrooms
Schedule intervention times
Schedule support staff based
Receive input from staff and
Implement master schedule
Master Schedule Creation
# of classroom teachers Departmentalizing needs
90 minutes of math 90 minutes of language arts
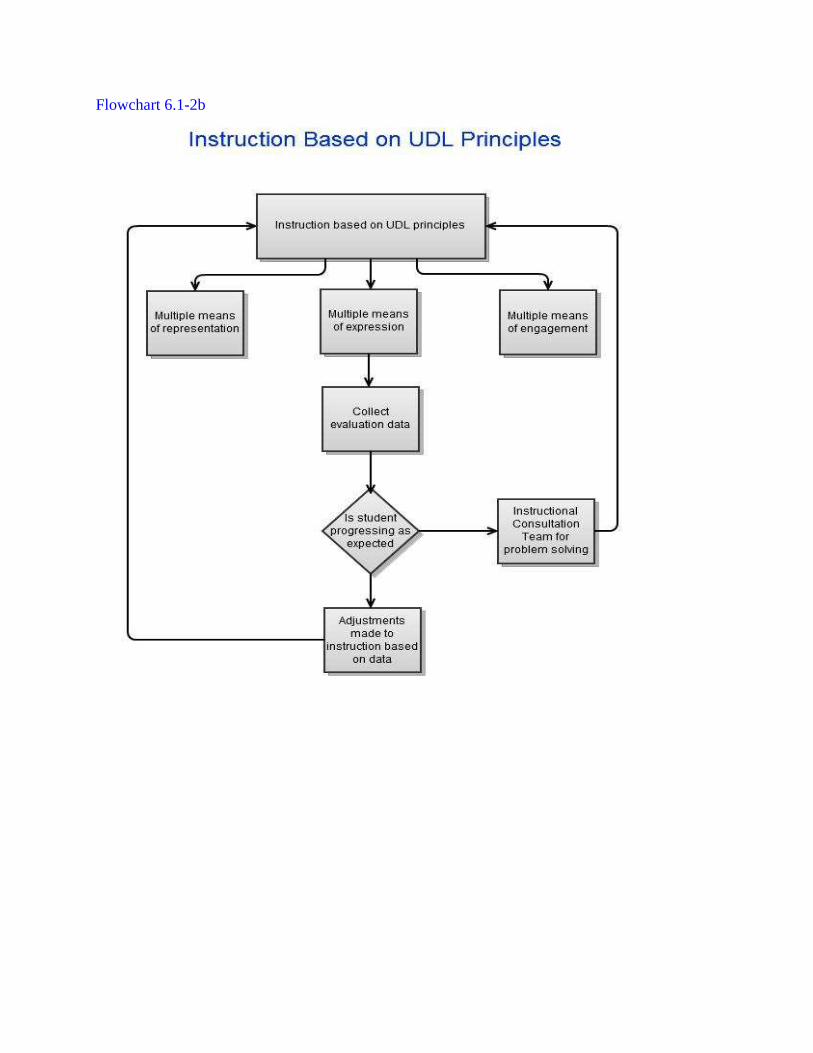
Flowchart 6.1-2b

Flowchart 6.1-2c Instructional Materials and Resources Technology
Flowchart 6.1-2d
Staff is provided wtih
technology
Support is provided for
hardware/software by staff and tech dept
Training provided for
new hardware and software by request
Expectations for use of
technology are presented to staff
Staff presents
technology uses at staff meetings
Use is monitored by
principal walk throughs
Staff gives feedback on
technology needs
Students taught the
Raider Way
Safe
Respectful
Responsible
Students
demonstrating the
Raider Way skills are
given Rave tickets
Rave tickets are
exchanged for teacher
signatures on a Rave
card
After 5 signatures on the Rave card,
it can be entered into the “lucky
dozen” drawing on Fridays.
PBIS Behavior Reinforcement Plan

Flowchart 6.1-2e
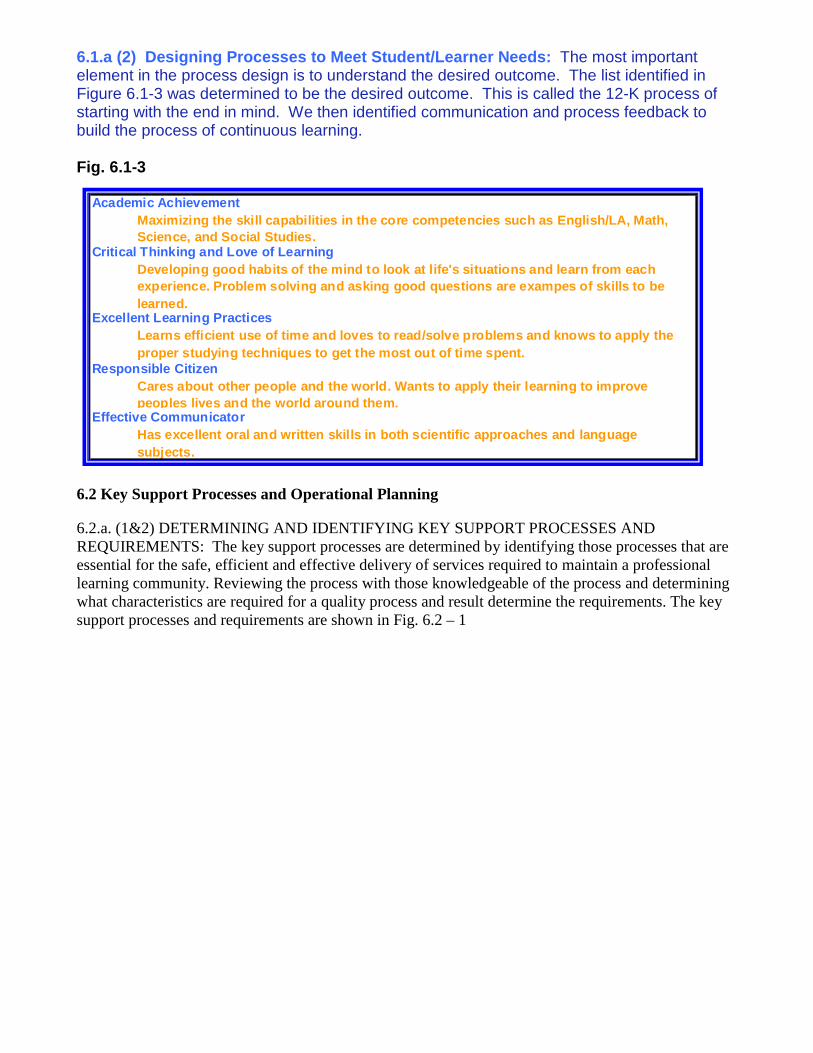
6.1.a (2) Designing Processes to Meet Student/Learner Needs: The most important element in the process design is to understand the desired outcome. The list identified in Figure 6.1-3 was determined to be the desired outcome. This is called the 12-K process of starting with the end in mind. We then identified communication and process feedback to build the process of continuous learning. Fig. 6.1-3
6.2 Key Support Processes and Operational Planning
6.2.a. (1&2) DETERMINING AND IDENTIFYING KEY SUPPORT PROCESSES AND REQUIREMENTS: The key support processes are determined by identifying those processes that are essential for the safe, efficient and effective delivery of services required to maintain a professional learning community. Reviewing the process with those knowledgeable of the process and determining what characteristics are required for a quality process and result determine the requirements. The key support processes and requirements are shown in Fig. 6.2 – 1
Academic AchievementMaximizing the skill capabilities in the core compe tencies such as English/LA, Math, Science, and Social Studies.
Critical Thinking and Love of LearningDeveloping good habits of the mind to look at life' s situations and learn from each experience. Problem solving and asking good questio ns are exampes of skills to be learned.
Excellent Learning PracticesLearns efficient use of time and loves to read/solv e problems and knows to apply the proper studying techniques to get the most out of t ime spent.
Responsible CitizenCares about other people and the world. Wants to ap ply their learning to improve peoples lives and the world around them.
Effective CommunicatorHas excellent oral and written skills in both scien tific approaches and language subjects.

Fig. 6.2 – 1
6.2.a (3) PROCESS DESIGN TO MEET KEY REQUIREMENTS: The key support processes are designed by first determining the customer requirements for excellence. This means interviewing and recording what is important for customers of the process. The next step is to determine the flow of work to accomplish the desired results. In addition we identify what variables can affect the results and how they can be optimized for the best results. We then discuss with suppliers to the process and owners of the process how they will document their workflows and put controls on those variables that will impact the quality of the results of their process. Measures of cycle time, productivity, value added and resource requirements are used to assess how well the process is designed.
6.2.a (4) KEY PERFORMANCE AND IN-PROCESS MEASURES: Student and Stakeholder input is obtained through satisfaction surveys, focus groups and interviewing processes.
6.2.a (5) MINIMIZING COST AND PREVENTING ERRORS: Each support process is based on the principle of value added performance. The inspection and testing of supplied product is minimized by having well defined requirements so that suppliers know what is important to us. We also purchase material from suppliers with known quality only. We do encourage auditing and sampling of products and processes to determine how well the process is working and putting corrective action in place when problems are identified. Errors are prevented by using only known quality suppliers and regularly scheduled maintenance and inspection when required. For example school bus inspections are carried out and maintenance records are kept and audited to assure breakdowns are avoided. We also have a bus replacement policy that takes older buses out of service and replaces them before failures.
6.2.a (6) ORGANIZATIONAL LEARNING AND INNOVATION: Organizational learning is carried out in several ways. 1. We track the results of current instruction and identify excellent practices within our own organization. 2. We benchmark excellent organizations and learn from them what approaches
Financial and Budget
Management
Assure efficient and effective spending practice including budgeting, purchasing and grant utilization.
Balanced budget Return on resources
Food ServicesProvide nutritious and healthy food for students and staff that
is cost effective and meets all regulatory requirements.% Satisfaction % on budget
Human Resources
Support
Provides professional development and training to all of the faculty and staff of BCSC.
% Certified Teachers # positions filled/ open
TechnologyProvides up to date technology for the efficient and effective
instruction for students and staff.
% Current Technology % Satisfaction
Response to requests
TransportationProvides and coordinates safe, on time and cost effective
services.
Safety Record Bus audit results
Regulation compliance
PTO
Monthly meetings to address school issus. Provides recreational and family activities to promote the school and
home relationship. Provides support to the parents as well as fund programs within the school.
% Satisfied
Parent/Student/Staff Surveys
Provide faculty and staff with data to determine area of the school environment that need improvement or are doing well.
% Satisfied

or strategies have made them successful. 3. We follow instructional research and published articles about what others have found to be successful. 4. We follow the PDCI approach to improvement. Basically we a) determine what strategies we will use at the district and school level. b) Benchmark those who are getting the best results internally or externally c) put action plans in place to implement the identified strategies. d) Measure the results of defining our strategy and deploying it across schools. e) Look at trend and gap analysis information to determine effectiveness of strategy and if it needs to be changed. See Fig. 6.2-2 for an illustration of the process.
6.2.b Operational Planning
Objectives, Goalsand Measures
Strategies to Achieve Goals
Implement Strategiesand Action Plans
Review results and assess what action needs to be taken
What and Why
How
Specific steps, who, when, where, how much
Evaluate and adjust
Fig. 6.2-2

9
6.2.b (1) RESOURCE PLANNING AND FINANCIAL RISK MANAGEMENT: The resource planning and financial risk management consists of the following Steps District Policy Numbers and Some of the key points of each.
Goal Setting/Pre-Observation Conference
Formal Observation #1
Post-Observation Conference #1
Formal Observation #2
Post-Observation Conference #2
Summative Conference
Sequence of BCSC Evaluation System

1
7.0 Organizational Performance Results for W. D. Richards Elementary School Section 7.0 Organizational Performance Results details to what extent W. D. Richards Elementary School has achieved its stated goals. Key measures for student academic performance reflects W. D. Richards Elementary School results for BCSC’s High Expectations Objective: Exemplary Academic Achievement. This section reports organizational effectiveness and efficiency relative to the school’s mission, vision, aims, and goals. Section 7.0 organizes performance results links with each of the previous six categories. Although much more work needs to be accomplished, we are happy that many of our indicators are pointing toward improvements. 7.1 Student Performance Results Key measures for student academic performance reflects district results for W.D. Richards Elementary School’s High Expectation Objective: Exemplary Academic Achievement. These measures include results from a variety of assessment tools including the ISTEP+. The Indiana DOE develops and mandates annual testing of the ISTEP+ test for grades 3, 4, 5, and 6. The IDOE compares results from this testing process to a specified set of criteria used for determining the overall level of performance of a school district. Results from the ISTEP+ provide a data set of academic progress across all tested grades for the district each school year. Figure 7.1 – 1 compares ISTEP+ state average with RES for all grades passing E/LA and Math.
50
60
70
80
90
100
2008-2009 2009-2010 2010-2011 2011-2012 2012-2013
% P
ass
ing
% Passing ISTEP+ Math
W. D. Richards State

2
Figure 7.1 – 1 ISTEP+ results, all students passing math and E/LA 7.1 Student Performance Results
Figures 7.1-2, 7.1-3, 7.1-4, and 7.1-5 reflect W. D. Richards Elementary School’s performance on the ISTEP+ in grades 3-6.
Figure 7.1-2a Grade 3 Language Arts
ISTEP+ Results
Figure 7.1-2b Grade 3 Math ISTEP+ Results
50
60
70
80
90
100
2008-2009 2009-2010 2010-2011 2011-2012 2012-2013
% P
ass
ing
% Passing ISTEP+ English LA
W. D. Richards State
60
70
80
90
100
2005-
2006
2006-
2007
2007-
2008
2008-
2009
2009-
2010
2010-
2011
2011-
2012
2012-
2013
% P
ass
ing
En
gli
sh/L
A
Grade 3 Students Passing English/LA ISTEP+
60
70
80
90
100
2005-
2006
2006-
2007
2007-
2008
2008-
2009
2009-
2010
2010-
2011
2011-
2012
2012-
2013
% P
ass
ing
Ma
th
Grade 3 Students Passing Math ISTEP+

3
Figure 7.1-3a Grade 4 ISTEP+ Language Arts
Results
Figure 7.1-4a Grade 5 Language Arts ISTEP+ Results
Figure 7.1-5a Grade 6 Language Arts
ISTEP+ Results
Figure 7.1-3b Grade 4 ISTEP+ Math Results
Figure 7.1-4b Grade 5 Math ISTEP+ Results
R
Figure 7.1-5b Grade 6 Math ISTEP+ Results
60
70
80
90
100
2005-
2006
2006-
2007
2007-
2008
2008-
2009
2009-
2010
2010-
2011
2011-
2012
2012-
2013
% P
ass
ing
En
gli
sh/L
AGrade 4 Students Passing English/LA ISTEP+
50
60
70
80
90
100
2005-
2006
2006-
2007
2007-
2008
2008-
2009
2009-
2010
2010-
2011
2011-
2012
2012-
2013
% p
ass
ing
En
gli
sh/L
A
Grade 5 Students Passing English/LA ISTEP+
50
60
70
80
90
100
2005-
2006
2006-
2007
2007-
2008
2008-
2009
2009-
2010
2010-
2011
2011-
2012
2012-
2013
% P
ass
ing
En
gli
sh/L
A
Grade 6 Students Passing English/LA
60
70
80
90
100
2005-
2006
2006-
2007
2007-
2008
2008-
2009
2009-
2010
2010-
2011
2011-
2012
2012-
2013
% P
ass
ing
Ma
th
Grade 4 Students Passing Math ISTEP+
50
60
70
80
90
100
2005-
2006
2006-
2007
2007-
2008
2008-
2009
2009-
2010
2010-
2011
2011-
2012
2012-
2013
% p
ass
ing
Ma
th
Grade 5 Students Passing Math ISTEP+
50
60
70
80
90
100
2005-
2006
2006-
2007
2007-
2008
2008-
2009
2009-
2010
2010-
2011
2011-
2012
2012-
2013
% P
ass
ing
Ma
th
Grade 6 Students Passing Math ISTEP+

4
Figures 7.1-6, 7.1-7, 7.1-8, and 7.1-9 reflect the ISTEP+ passing percentages of students receiving services from Special Education and English Language Learner programs. The staff as W. D. Richards Elementary is utilizing UDL principles and other research-based instruction in the areas of Math and Language Arts to increase these passing percentages.
Figure 7.1-6 Grades 3-6 % Passing ISTEP+ Results
Figure 7.1-8 Grades 3-6 % Passing ISTEP+ Results
Figure 7.1-7 Grades 3-6 % Passing ISTEP+ Results
Figure 7.1-9 Grades 3-6 % Passing ISTEP+ Results
30
40
50
60
70
80
90
100
2008-
2009
2009-
2010
2010-
2011
2011-
2012
2012-
2013
% p
ass
ing
En
gli
sh/L
A
Grades 3-6 Special Education Students
Passing ISTEP+ English/LA
40
50
60
70
80
90
100
2008-
2009
2009-
2010
2010-
2011
2011-
2012
2012-
2013
% p
ass
ing
En
gli
sh/L
A
Grades 3-6 English Language Learners
Passing ISTEP+ English/LA
30
40
50
60
70
80
90
100
2008-
2009
2009-
2010
2010-
2011
2011-
2012
2012-
2013
% p
ass
ing
En
gli
sh/L
A
Grades 3-6 Special Education Students
Passing ISTEP+ Math
30
40
50
60
70
80
90
100
2008-
2009
2009-
2010
2010-
2011
2011-
2012
2012-
2013
% p
ass
ing
En
gli
sh/L
A
Grades 3-6 English Language Learners
Passing ISTEP+ Math

5
A specific breakout group the W. D. Richards Elementary staff continues to monitor achievement of is the group of students who qualify for free and reduced lunch at each grade level. This group has been consistently decreasing the gap between free and reduced and paid lunch students. Figures 7.1-10 through 7.1-13 reflect the percentage of paid lunch students passing ISTEP+ at grades 3 and 6 compared to the percentage of free/reduced lunch students.
Figure 7.1-10 Grade 3 Free/Reduced Language Arts ISTEP+ Results
Figure 7.1-12 Grade 6 Free/Reduced Language Arts ISTEP+ Results
Figure 7.1-11 Grade 3 Free/Reduced Math ISTEP+ Results
Figure 7.1-13 Grade 6 Free/Reduced Math ISTEP+ Results
W. D. Richards’ staff continually monitor data for any gaps in achievement measures between male and female students. Figures 7.1-14 through 7.1-21.
50
60
70
80
90
100
2008-
2009
2009-
2010
2010-
2011
2011-
2012
2012-
2013
% P
ass
ing
En
gli
sh/L
A
Grade 3 Students Passing English/LA ISTEP+
Paid Free/Reduced
50
60
70
80
90
100
2008-
2009
2009-
2010
2010-
2011
2011-
2012
2012-
2013
% P
ass
ing
Ma
th
Grade 6 Students Passing English/LA
ISTEP+
Paid Free/Reduced
40
50
60
70
80
90
100
2008-
2009
2009-
2010
2010-
2011
2011-
2012
2012-
2013
% P
ass
ing
Ma
th
Grade 3 Students Passing Math ISTEP+
Paid Free/Reduced
50
60
70
80
90
100
2008-
2009
2009-
2010
2010-
2011
2011-
2012
2012-
2013
% P
ass
ing
Ma
th
Grade 6 Students Passing Math ISTEP+
Paid Free/Reduced

6
Figure 7.1-14 Grade 3 English/LA Disaggregated by Gender
Figure 7.1-16 Grade 4 English/LA Disaggregated by Gender
Figure 7.1-18 Grade 5 English/LA Disaggregated by Gender
Figure 7.1-15 Grade 3 Math Disaggregated by Gender
Figure 7.1-17 Grade 4 Math Disaggregated by Gender
Figure 7.1-19 Grade 5 Math Disaggregated by Gender
50
60
70
80
90
100
% P
ass
ing
En
gli
sh/L
A
Grade 3 Students Passing English/LA ISTEP+
Disaggregated by Gender
Male
Female
5060708090
100
% P
ass
ing
En
gli
sh/L
A
Grade 4 Students Passing English/LA ISTEP+
Disaggregated by Gender
Male
Female
50
60
70
80
90
100
% P
ass
ing
En
gli
sh/L
A
Grade 5 Students Passing English/LA ISTEP+
Disaggregated by Gender
Male
Female
50
60
70
80
90
100
% P
ass
ing
Ma
th
Grade 3 Students Passing Math ISTEP+
Disaggregated by Gender
Male
Female
5060708090
100%
Pa
ssin
g M
ath
Grade 4 Students Passing Math ISTEP+
Disaggregated by Gender
Male
Female
50
60
70
80
90
100
% P
ass
ing
Ma
th
Grade 5 Students Passing Math ISTEP+
Disaggregated by Gender
Male
Female
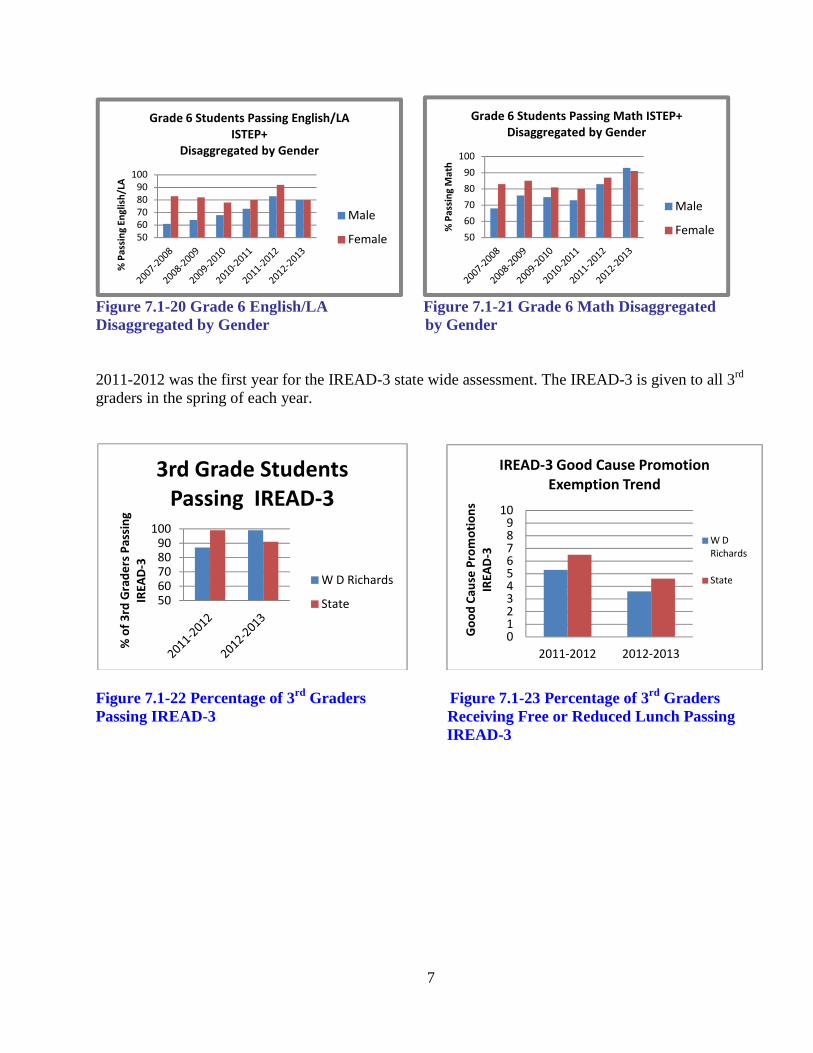
7
Figure 7.1-20 Grade 6 English/LA Figure 7.1-21 Grade 6 Math Disaggregated Disaggregated by Gender by Gender 2011-2012 was the first year for the IREAD-3 state wide assessment. The IREAD-3 is given to all 3rd graders in the spring of each year.
Figure 7.1-22 Percentage of 3rd Graders Figure 7.1-23 Percentage of 3rd Graders Passing IREAD-3 Receiving Free or Reduced Lunch Passing IREAD-3
50
60
70
80
90
100
% P
ass
ing
En
gli
sh/L
AGrade 6 Students Passing English/LA
ISTEP+
Disaggregated by Gender
Male
Female 50
60
70
80
90
100
% P
ass
ing
Ma
th
Grade 6 Students Passing Math ISTEP+
Disaggregated by Gender
Male
Female
5060708090
100
% o
f 3
rd G
rad
ers
Pa
ssin
g
IRE
AD
-3
3rd Grade Students
Passing IREAD-3
W D Richards
State
0123456789
10
2011-2012 2012-2013
Go
od
Ca
use
Pro
mo
tio
ns
IRE
AD
-3
IREAD-3 Good Cause Promotion
Exemption Trend
W D
Richards
State

8
7.2 Student and Stakeholder Results Overall student satisfaction results for W. D. Richards Elementary are shown in Figure 7.2.1. For the years 2009 - 2013 students completed an Olweus Questionnaire in grades 5 and 6. The percentage of students both "liking school” and “feeling good about school” are reported.
Figure 7.2.1 Students Surveyed by Olweus Questionnaire Figure 7.2.2 show the satisfaction of parents with W.D. Richards Elementary School. Parents completed a building-developed survey for the 2010 - 2011 through 2012-13 year. The results indicate the overall percentage of parents who are satisfied with their child’s education.
Figure 7.2.2 Overall Satisfaction Rating as Being Good or Excellent
70
80
90
100
2009-2010 2010-2011 2011-2012 2012-2013
% L
ikin
g S
cho
ol
Student Satisfaction
Target Actual
70
80
90
100
2010-2011 2011-2012 2012-2013
% G
ivin
g O
ve
rall
Sa
tisf
act
ion
Ra
tin
g
Parent Satisfaction
Target Actual

9
7.3 Faculty and Staff Results Faculty and staff satisfaction is important in creating and maintaining a positive, productive, learning-centered and caring work environment. Figure 7.3.1 shows the level of satisfaction of W. D. Richards’ faculty and staff. Teachers and staff responding were asked if they felt valued by administration and staff for the 2008-2009 through 2012-2013 school year.
Figure 7.3.1 % of Staff Who Feel Valued Figure 7.3.2 shows a low overall number of student out-of-school suspensions at W.D. Richards. W.D. Richards participates in the Positive Behavioral Intervention Support program in order to improve student behavior and provide alternatives to out of school suspension.
Figure 7.3.2 Number of School Suspensions
50
60
70
80
90
100
2008-2009 2009-2010 2010-2011 2011-2012 2012-2013% o
f S
taff
Wh
o F
ee
l V
alu
ed
Faculty and Staff Satisfaction
Target Actual
0
5
10
15
20
25
2010-2011 2011-2012 2012-2013
# of
Sus
pens
ions
Number of Suspensions
Target Actual

10
Figure 7.3.4 shows student attendance at W.D. Richards Elementary. The staff has been working closely with students and parents to improve attendance, knowing that a strong correlation exists between attendance and increase in student achievement. The staff has implemented an attendance awards program including numerous competitions and follow ATTEND guidelines.
Figure 7.3.4 Student Attendance 7.4 Instructional Consultation Teams Instructional Consultation Teams were introduced to the W.D. Richards staff during the 2010-2011 school year. Instructional Consultation Teams allow educators to work in a collaborative manner to assess, intervene, and document student performance. Participation in the program is voluntary. The Instructional Consultation Team will work toward the goal of having 80% of classroom teachers utilizing the team. Figure 7.4.1 shows the percentage of teachers who requested assistance and participated in the Instructional Consultation Team process.
2007-
2008
2008-
2009
2009-
2010
2010-
2011
2011-
2012
2012-
2013
Attendance 96.8 97.6 97.6 96.8 97.2 97.2
Attendance Goal 98 98 98 98 98 98
96
96.5
97
97.5
98
% o
f A
tte
nd
an
ce
Student Attendance
50
60
70
80
90
100
2009-2010 2010-2011 2011-2012 2012-2013
% o
f Tea
cher
s
% of Teachers Participating in ICT
Target Actual

11
Figure 7.4.1 % of Teachers Participating in ICT Process Figure 7.4.2 shows the percentage of students making progress toward their goals due to participation in the Instructional Consultation Team process.
Figure 7.4.2 % of Students Making Progress Toward Goal Conclusion W. D. Richards Elementary School has made progress in many areas, but still has many areas for improvement. Listed below are the efforts to be implemented or further developed for the school year 2013-2014:
• W. D. Richards will continue to strive to be a fully inclusive school. Special efforts are in place for additional special education students to pass ISTEP+ in all areas, especially language arts standards.
• Literacy programs will continue to be in place including Read 180, and Book Buddies. • W. D. Richards will continue to bring teachers together once a month for professional development • Science, math, and literacy and high ability mentors will provide resources and support to all staff. • CIC and GAT teams will meet on a monthly basis. • Instructional Consultation Team will be fully implemented to enhance and improve student and staff
performance during the 2012-2013 school year. • Positive Behavioral Support Systems will continue during the 2012-2013 school year. • Research on “hot spots” as indicated in the parent, staff, and students surveys will continue to be
researched and analyzed to better meet the needs of students. • W.D. Richards will continue the practice of the Universal Design for Learning in all classrooms.
The Universal Design for Learning practices will benefit all students of all abilities—Special Education, ESL students, low income students, and provide challenges for gifted students.
70
75
80
85
90
95
100
2009-2010 2010-2011 2011-2012 2012-2013
% o
f Stu
dent
Goa
ls M
et
% of Student Making Progress Toward Goal
Target Actual

12