Big Data Visual Analytics: Machine Learning Meets...
28
Jaegul Choo Assistant Professor Dept. of Computer Science and Engineering Korea University Big Data Visual Analytics: Machine Learning Meets Visualization
Transcript of Big Data Visual Analytics: Machine Learning Meets...

Jaegul ChooAssistant Professor
Dept. of Computer Science and Engineering
Korea University
Big Data Visual Analytics: Machine Learning
MeetsVisualization

About MeGoogle ‘Jaegul Choo’
2
Assistant Professor at Computer Science dept. in Korea Univ.
B.S. (2001) in Electrical Engineering at SNU
M.S. (2009) and Ph.D (2013) at Georgia Tech
Main Research
Main Expertise: Dimension Reduction and Clustering
Published >50 research articles (>300 citations)
Machine
LearningVisualization
Visual Analytics
+
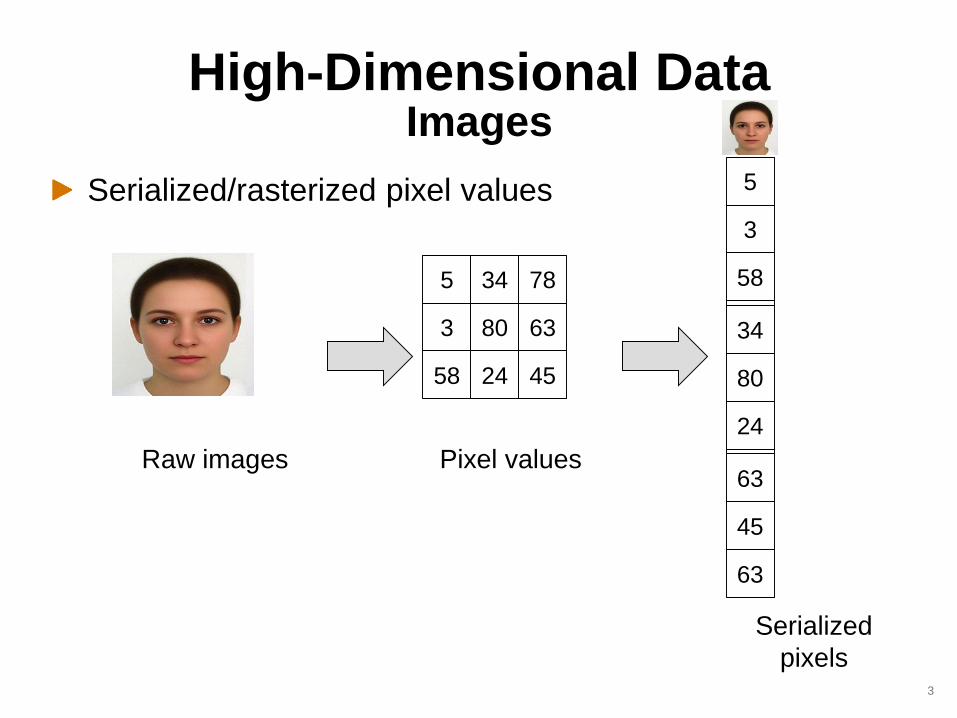
Serialized/rasterized pixel values
High-Dimensional DataImages
3
3 80
2458
63
45
3
80
24
58
63
45
5 34 78
Raw images Pixel values
5
34
63
Serialized
pixels

3 80
2458
63
45
5 34 78
49 54
7814
67
36
22 86 15
Serialized pixel values
Huge dimensions640x480 image size → 307,200 dimensions
High-Dimensional DataImages
4
3
80
24
58
63
45
Raw images Pixel values
5
34
63
Serialized
pixels
49
54
78
14
15
67
22
86
36
…

High-Dimensional DataDocuments
5
Bag-of-words vector
Document 1 = “John likes movies. Mary likes too.”
Document 2 = “John also likes football.”
John
likes
movies
also
football
Mary
too
Vocabulary Doc 1 Doc 2
1
1
0
1
1
0
0
…
1
2
1
0
0
1
1

Two Approaches for Data Analysis
Automated Interactive (human in the loop)
Clearly defined tasks Exploratory analysis
Fast computation Deeper understanding
>Millions of data items Thousands of data items
Machine
LearningVisualization
6

My Research:
True Integration of Both Worlds
7
Machine
LearningVisualization
Visual Analytics
+
Data Mining Methods
for Visual Analytics
Visual Analytics Systems
for Real-World Tasks
High-Impact
Applications
New
Computing
Paradigms

Visual Insight to Machine LearningHandwritten Digit Recognition
Visualization generated by p-Isomap [SDM’11]8
Subcluster #1
Subcluster #2
Subclusters in
digit ‘5’
Handling them as
separate clusters
Better prediction
(89%→ 93%)

Visualization generated by p-Isomap [SDM’10]9
Major group
Minor group #1
Minor group #2
Visual Insight to Machine LearningHandwritten Digit Recognition

Challenges in Machine Learning + Visualization
10
Visualization
Interpretation
Interaction
Machine
Learning
Screen space
Human
NumbersData
• More interpretable
• More user-interactive
• Real-time responsive, i.e., faster
Machine learning methods should be
When Used in Visual Analytics…

11
UTOPIAN: User-Driven Topic Modeling Based on Interactive NMF
[TVCG 2013]
11
Topic merging
Topic splitting
Doc-induced
topic creation
Keyword-induced
topic creation

Visualization Example:Car Reviews
Topic summaries are NOT perfect.
UTOPIAN allows user interactions for improving them. 12

Interaction Demo Videohttp://tinyurl.com/UTOPIAN2013
13
After topic splitting (triangle)
and topic merging (circle)
Before interaction
InfoVis-VAST Paper Data

• Refining topic keywords
• Merging topics
• Splitting a topic
• Creating new topics from seed
documents/keywords
UTOPIANInteractions and Key Techniques
Visualization
• Supervised t-SNETopic modeling
• NMF
Interaction
Weakly-
supervised
NMF
Per-Iteration
Visualization
Framework14

Original t-SNE
• Documents do not have clear topic clusters.
Supervised t-SNE: Visualizing documents
Supervised t-SNE
• d(xi, xj) ← α•d(xi, xj) if xi and xjbelong to the same topic. (e.g., α = 0.3)

Weakly Supervised NMF: Supporting user interactions
Weakly supervised NMF [DMKD 2014]
min ||A – WH ||F2 + α||(W – Wr)MW ||F
2 + β||MH(H – DHHr) ||F2
W>=0, H>=0
Wr, Hr : reference matrices for W and H (user-input)
MW, MH : diagonal matrices for weighting/masking columns and rows of W and H
Algorithm: block-coordinate descent framework
16

Per-iteration routine
...Computational method
Visualization
Interaction
Input data
PIVE: (Per-Iteration Visualization Environment)
Standard approach
Input data
Interaction
Per-iteration routine
Visualization
Thread 1 Thread 2
...
PIVE approach
https://youtu.be/zURFA9P5E_s
Motivation
Many algorithms are iterative methods.
PIVE
Integration methodology of iterative methods for Real-Time interactive visualization [Choo et al., VAST’14 Poster]
17

Compare and Contrast: Joint Topic Discovery
[KDD’15]
18
Formulation
min 1/n1|| A1 – W1H1 ||F2 + 1/n2|| A2 – W2H2 ||F
2 +W>=0, H>=0 α|| W1,c – W2,c ||F
2 + β||WT1,d W2,d ||F
2
where Wi = [Wi,c Wi,d ]
2000-2005 2006-2008Common
topics in DM

Compare and Contrast: Joint Topic Discovery
[KDD’15]
19
Formulation
min 1/n1|| A1 – W1H1 ||F2 + 1/n2|| A2 – W2H2 ||F
2 +W>=0, H>=0 α|| W1,c – W2,c ||F
2 + β||WT1,d W2,d ||F
2
where Wi = [Wi,c Wi,d ]
VAST InfoVisCommon
topics

Geospatio-Temporal Topic Modeling
20
http://aperture.xdataonline.com/#/

TopicLens: Efficient Multi-Level Visual Topic Exploration
[Under submission]
21

TopicLens: Efficient Multi-Level Visual Topic Exploration
[Under submission]
22
Key aspects of backend topic modeling and dimension reduction methods
Real-time response
How can we ensure real-time response against highly-dynamic user interactions such as lens?
Continuity and consistency with previous results
How can we allow users to maintain the continuity and consistency between the previous and the new results?

InterAxis: Steering Scatterplot Axesvia Observation-Level Interaction
[TVCG’15]
23
http://www.cc.gatech.edu/~hkim708/InterAxis/

ConceptVector: Building User-Driven Concepts via Word Embedding
[Under submission]
24
http://conceptvector.org/

Perception- and Screen Space-Driven Integration Framework
[CG&A, 2013]
Motivation
Humans and computer screens do not require high precision.
Approach
Approximate computing
25
Double-precision PCA Single-precision PCAComputing time
vs. data size

16x12 48x36 80x60
New Computing Paradigms for Visual Analytics
Adaptive hierarchical refinement
Leveraging ideas from other literatures, e.g., wavelet
Images src: http://www.cse.lehigh.edu/~spletzer/rip_f06/lectures/lec013_Pyramids.pdf26

On-going Work
27
Real-time visual analytics for deep learning
Visualizing the training process in real time
Steering the model in a user-driven manner
Large-scale geospatio-temporal topic modeling
Improving NMF capability on tile-based visualization for large-scale topic modeling
Nonlinear extension of Interaxis
Interactive nonlinear dimension reduction
Semi-supervised principal curves
Novel applications
Recommendations based on brand-movie-music association

28
Thank you! Jaegul Choo [email protected]
Collaborators from academia, industry, and the governmentA. Endert, A. Gray, A. White, B. Drake, B. Dilkina, B. Kwon, C. Görg, C. Reddy, C. Lee, C. Stolper, D. Lee, E. Clarkson, E. Fujimoto, F. Li, G. Nakamura, H. Park, H. Pileggi, H. Lee, H. Zha, H. Kim, J. Eisenstein, J. Shim, J. Park, J. Kihm, J. Yi, J. Ye, J. Kang, J. Stasko, J. Turgeson, K. Joo, M. Hu, P. Walteros, P. Chau, R. Sadana, R. Decuir, R. Boyd, S. Yang, S. Bohn, S. Muthiah, T. Liu, W. Zhuo, Y. Han, Z. Liu, …
Selected PapersInterAxis: Observation-level Interactive Axis Steering for Scatterplots of Multi-Dimensional Data Visualization, TVCG, 2015
VisOHC: Designing Visual Analytics for Online Health Communities, TVCG, 2015
Simultaneous Discovery of Common and Discriminative Topics via Joint Nonnegative Matrix Factorization, KDD, 2015
To Gather Together for a Better World: Understanding and Leveraging Communities in Micro-lending Recommendation, WWW, 2014
Understanding and Promoting Micro-finance Activities in Kiva.org, WSDM, 2014
Weakly Supervised Nonnegative Matrix Factorization for User-Driven Clustering, DMKD, 2014
Document Topic Modeling and Discovery in Visual Analytics via Nonnegative Matrix Factorization, TVCG, 2013
Screen space- and Perception-based Framework for Efficient Computational Algorithms in Large-scale Visual Analytics, CG&A, 2013
Heterogeneous Data Fusion via Space Alignment Using Nonmetric Multidimensional Scaling,” SDM, 2012
iVisClassifier: An Interactive Visual Analytics System for Classification based on Supervised Dimension Reduction, VAST, 2010
p-ISOMAP: An Efficient Parametric Update for ISOMAP for Visual Analytics, SDM, 2009


![[RakutenTechConf2013] [A-0] Security Meets Analytics](https://static.fdocuments.net/doc/165x107/544408a7b1af9f640a8b474b/rakutentechconf2013-a-0-security-meets-analytics.jpg)