
big data: to smart data
23
1 © GfK 2014 Big Data to Smart Data BIG DATA: IT MAY BE BIG BUT IS IT SMART? Turning Big Data into winning strategies A GfK Point-of-view
-
Upload
atner-yegorov -
Category
Data & Analytics
-
view
155 -
download
2
Transcript of big data: to smart data

1 © GfK 2014 Big Data to Smart Data
BIG DATA:
IT MAY BE BIG BUT IS IT SMART? Turning Big Data into winning strategies
A GfK
Point-of-view

2 © GfK 2014 Big Data to Smart Data
?#!
%&
Variety (data in many forms)
Data in different formats,
versions, from different
sources, with different
dimensionality and structure
Velocity (data in motion)
Welcome to the fire hose.
The real-time data flow never
stops. Today's data will be
history tomorrow
Volume (data in huge quantity)
Data in massive quantity.
"Collect first, think later".
Big Data requires sophisticated
infrastructures
Veracity (data in doubt)
Volume doesn't automatically
increase precision. Managing
accuracy and reliability requires
significant analytical expertise
Big Data is complex…
Typical ‘Big Data’ characteristics

3 © GfK 2014 Big Data to Smart Data
…and can be misleading
So what is required? Thorough analytics expertise and a reference frame
Biasedness Big Data is often highly selective and
unsystematic
Analytic limitations Standard approaches to data processing,
modeling and analytics not feasible
Incompleteness Data streams are "happening", not designed for
information gathering

4 © GfK 2014 Big Data to Smart Data
Elements of our Big Data Experience @ GfK
Established Pilot projects, R&D
Mobile Insights
GfK proprietary Big Data Algorithms
Social Media Intelligence (SMI)
Location Insights
Digital Behavioural Tracking
Cookie tracking
Analytic Integration of SMI & Survey Data
Datafication of Games
Social Network Analysis
Integration of (Digital)
Behavioural Tracking and SMI
Analytic Integration of SMI & Sales Data

5 © GfK 2014 Big Data to Smart Data
Smart Data in the real world Use cases

6 © GfK 2014 Big Data to Smart Data
Use Case #1: Purchase Journey
7 © GfK 2014 Big Data to Smart Data
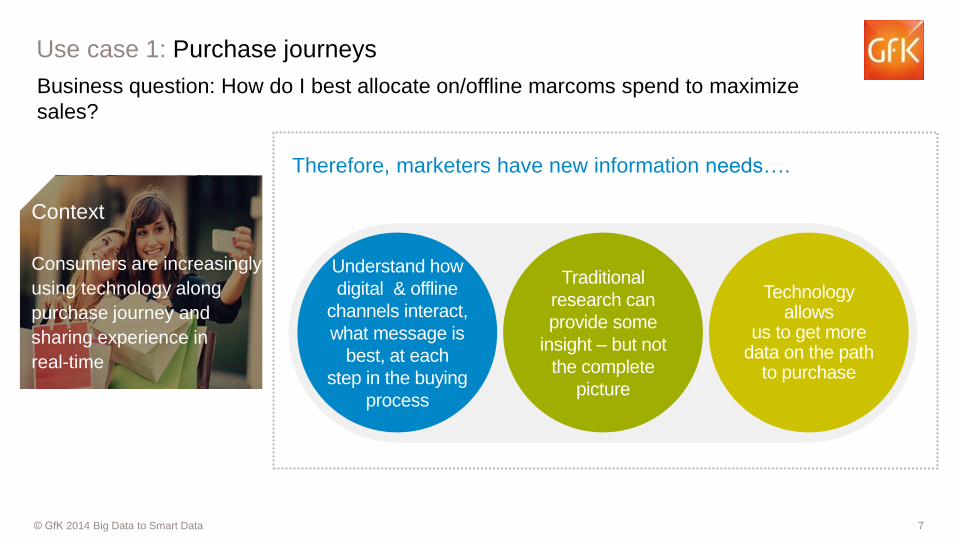
Use case 1: Purchase journeys
Therefore, marketers have new information needs….
Understand how
digital & offline
channels interact,
what message is
best, at each
step in the buying
process
Context
Consumers are increasingly
using technology along
purchase journey and
sharing experience in
real-time
Traditional
research can
provide some
insight – but not
the complete
picture
Technology allows
us to get more data on the path
to purchase
Business question: How do I best allocate on/offline marcoms spend to maximize
sales?

8 © GfK 2014 Big Data to Smart Data
Use case 1: Purchase Journeys Example: Magnitude of digital behavioral tracking data in the travel industry
• 10,000 Users in the panel
• 2,100,000 Page Impressions at major
search engine
• 30,000,000 Navigation events overall
• 1,140,000,000 Server requests
• 1,500,000,000 MB of textual content
• Categorize 1,322 Websites as
Retailers, Aggregators,
Accommodation, Airlines,
Destinations, etc..
• Categorize 16,011 Search Keywords as
Travel Organization, Accommodation,
Generic, etc..
• Identify relevant data on which we can now complete analysis
• 59 Offline Bookers, 148 online Bookers, 20 Bookers @ specific portal
• 33,570 relevant Navigation Events (0,1%)
One month of data in our GfK
Media Efficiency Panel
E.g. create a taxonomy for
the travel industry
Analyze purchase journeys for a
selected client
1 2 3 The haystack Organize the haystack Find the needle

9 © GfK 2014 Big Data to Smart Data
Source: Smartphone Purchase Journey, Russia
The purchase journey can be really complex, but still there are
certain patterns…
Finish
Click & mortar
Start
Forums /
blogs / review
sites
Brand sites
Social
networks
Pure online
retailers
Aggregators
2 Search 1
3

10 © GfK 2014 Big Data to Smart Data
Click & mortar
Search engines
Pure players
Aggregators
Manufacturers
Telecom operators
Social networks
Forums / blogs
Which touchpoints have a higher impact on brand purchase?

11 © GfK 2014 Big Data to Smart Data
Typical purchase pathway – Consumer Segment X
Visits in
online:
25
Offline
contacts:
3
Trigger:
keep up
with trends
Purchased
brand:
Samsung
purchased
ONLINE
Ag
gre
-
gato
rs
Sea
rch
eng
ine
Cli
ck &
mort
ar
Pu
re
on
lin
e
Foru
ms
&
blo
gs
Man
u-
fact
ure
rs

12 © GfK 2014 Big Data to Smart Data
Use Case #2: Integrating Social Media Intelligence
into Decision Making

13 © GfK 2014 Big Data to Smart Data
Use case 2: Social media Business question: how is social media affecting product sales?
Therefore, organizations are no longer in control
of their own brand
Understanding what is being said
about you (and competitors) in earned media,
how sentiment is trending, what is
influencing trends
Traditional research still
provides valuable insight – but not
the complete picture.
Technology allows us to take the pulse of the digital world – in near real-time.
Context
Fast adoption and
widespread use of social
media = everything more
spontaneous, immediate,
and dynamic

14 © GfK 2014 Big Data to Smart Data
• 3,162,185 pieces of content found
• 11,579 single domains crawled
• 44,942 API requests
• After cleaning 1,786,353 pieces
of content for further analysis we…
• Categorized content into 8 channels:
Blogs, Forums, Video, Web, SocialNets,
MicroBlogs, News and eCommerce
• Separated user and non-user content
• Clustered content into pre-defined topics
• Identified the best days for launch
announcement and first client feedback
• Identified top 15 domains for ongoing
monitoring
• Identified top 5 key issues that are
evaluated negatively by customers
• Identified impact of social media
communication on retail sales
One month of data for an Social Media Intelligence Monitoring in six countries for a product launch
Create a basis for analysis
Put the social media results into context for the client and connect it with other data sources e.g. retail sales data
1 2 3 The haystack Organize the haystack Find the needle
Use case 2: Social media Example: Magnitude of digital information available to monitor a product
launch in the tech industry

15 © GfK 2014 Big Data to Smart Data
Integrating Social Media Analysis into Brand Trackers
Case study: Sam Adams vs. Budweiser
2012 – 2013 Trend | Action Signals
Budweiser Sam Adams
Buy
Use
No Action
Not Use
Drop
0%10%20%30%40%50%60%70% 0% 10% 20% 30% 40% 50% 60% 70%
Positive: 37% 30%
Negative: 4% 2%
Net: +33% +28%
Positive: 61% 66%
Negative: 3% 1%
Net: +39% +65%
Wave 1
Wave 2
Use (Have, use or consume a product)
Buy (Wanting, buying or planning on buying a product, shop for, search for, looking for a product)
Not Use (Not have, not use or not consume a product)
Drop (Switching, getting rid of,
dropping rejecting a product, stop using)

16 © GfK 2014 Big Data to Smart Data
Integrating Social Media and real observed purchase behavior* to
reliably calculate Social ROI
Unique User (in Tsd.) selected URLs
*GfK Media Efficiency Panel, Germany
94
291
299
86
121
506
230
475
482
+ 19.6% € 14.13 € 11.85 + 7.7% € 12.72 € 11.85 + 9.1% € 12.89 € 11.85
Change in % Customer Value SoM Customer Value Buyers Total
Facebook-Sites YouTube-Channels Blogs & Boards

17 © GfK 2014 Big Data to Smart Data
Integrating Social Media Listening and GfK Retail Sales Data (example of GfK dashboards)

18 © GfK 2014 Big Data to Smart Data
Use Case #3: Mobile Insights

19 © GfK 2014 Big Data to Smart Data
Mobile Audience Measurement
Define mobile internet audience by demographics, device usage and behavior.
• What is the mobile web behavior of a certain target audience?
• How and where are brand’s targets spending mobile web time?
• How does mobile relate to their total media usage?
• How is the competition doing compared to a specific brand in reaching its own targets?

20 © GfK 2014 Big Data to Smart Data
Household income • Ikea.com’s penetration is similar
across the income brackets, but peaks
in the low end (under £20k).
Ikea.com vs. Johnlewis.com – Oct ‘13 John Lewis saw over 50k more mobile site visitors than IKEA
50k 100k 150k 200k 250k
Device
Location Demographics
Johnlewis.com is stronger amongst slightly
older females (25-54 years old), who
represent a potentially more affluent sector.
3.9% Ikea.com penetration
amongst females.
• In contrast, Johnlewis.com peaks
within the highest income bracket
(over £50k).
• Therefore, this represent a key target
area for IKEA.
Ikea.com penetration
amongst under 25 year
olds.
3.7%
Ikea.com sees its highest level of
penetration in London (4.5%).
However, opportunities remain in Northern
Ireland & Yorkshire, where penetration is
only 2%.
Both ikea.com &
johnlewis.com see a
higher level of
penetration on iOS
devices. Therefore,
the opportunity
remains for IKEA to
cement themselves
on Android.
% = penetration of retail sites.
Mobile websites
£20k
3.5%
Source: GfK Mobile Insights, UK (based on mobile operator data analysis)
21 © GfK 2014 Big Data to Smart Data
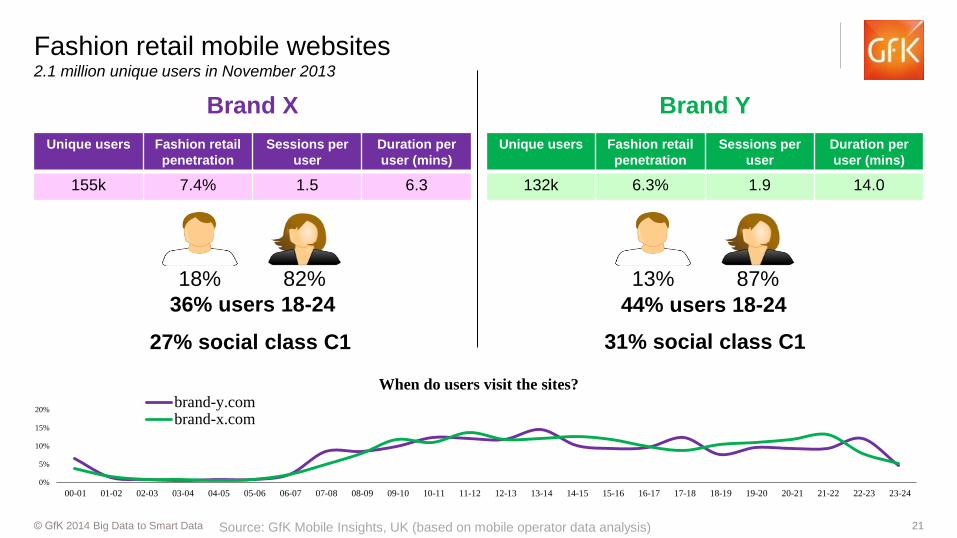
Fashion retail mobile websites 2.1 million unique users in November 2013
Unique users Fashion retail
penetration
Sessions per
user
Duration per
user (mins)
155k 7.4% 1.5 6.3
Unique users Fashion retail
penetration
Sessions per
user
Duration per
user (mins)
132k 6.3% 1.9 14.0
18% 82% 13% 87%
36% users 18-24 44% users 18-24
27% social class C1 31% social class C1
Brand X Brand Y
0%
5%
10%
15%
20%
00-01 01-02 02-03 03-04 04-05 05-06 06-07 07-08 08-09 09-10 10-11 11-12 12-13 13-14 14-15 15-16 16-17 17-18 18-19 19-20 20-21 21-22 22-23 23-24
When do users visit the sites? brand-y.combrand-x.com
Source: GfK Mobile Insights, UK (based on mobile operator data analysis)

22 © GfK 2014 Big Data to Smart Data
Key take-aways
Don’t necessarily rely on ‘Big Data’ on its own – it might not tell you the
whole story
Without understanding the consumer context, the value of Big Data for
marketers is limited
Combine consumer data with ‘reference’ data for better insights

23 © GfK 2014 Big Data to Smart Data