Big data journey_to_value_v5_john_sing
48
© 2014 John Sing – All Rights Reserved Big Data’s Journey to Value Making Data Actionable Opening video John Sing, Executive IT Architect
-
Upload
john-sing -
Category
Technology
-
view
375 -
download
0
Transcript of Big data journey_to_value_v5_john_sing

© 2014 John Sing – All Rights Reserved
Big Data’s Journey to Value
Making Data Actionable
Opening video
John Sing, Executive IT Architect

© 2015 John Sing – All Rights Reserved
University of South Florida - Spring 2015
2
John Sing 32 years of experience in enterprise servers, storage, and software
– 2015: IBM Product Manager – Spectrum Scale Storage
– 2014: Director of Technology, 4cube – Infrastructure for Tomorrow
– 2009 – 2013: IBM Executive IT Consultant: IT Strategy and Planning, Enterprise Large Scale Storage, Internet Scale Workloads and Data Center Design, Big Data Analytics, HA/DR/BC
– 2002-2008: IBM IT Data Center Strategy, Large Scale Systems, Business Continuity, HA/DR/BC, IBM Storage
– 1998-2001: IBM Storage Subsystems Group – Worldwide Marketing, Technical Support, Product Planner, Product Manager
– Before that: • IBM Hong Kong, IBM China, IBM USA
Follow me on Twitter: http://twitter.com/john_sing
Follow me on Slideshare.net:– http://www.slideshare.net/johnsing1
Blog: – http://johnsing.technology
LinkedIn:– http://www.linkedin.com/in/johnsing

© 2015 John Sing – All Rights Reserved
University of South Florida - Spring 2015
3
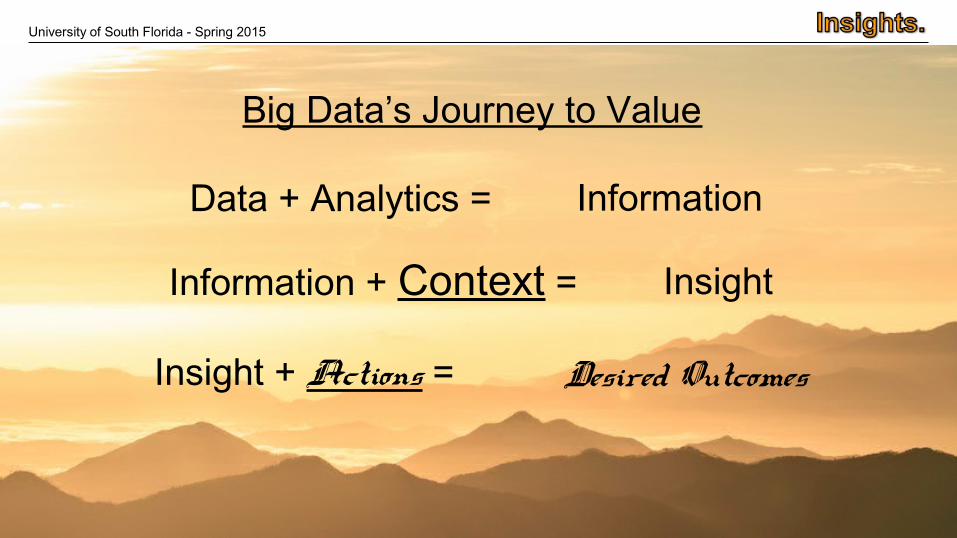
Big Data’s Journey to Value
Data + Analytics = Information
Insight
Desired Outcomes
Information + Context =
Insight + Actions =

© 2015 John Sing – All Rights Reserved
University of South Florida - Spring 2015
4
You know howmuch data there is…

© 2015 John Sing – All Rights Reserved
University of South Florida - Spring 2015
5
You know how to analyze Big DataGoal: Analyze *all* the data real time
Original source: Wikibon.org, “Big Data”, http://wikibon.org/blog/ten-%E2%80%9Cbig-data%E2%80%9D-realities-and-what-they-mean-to-you/
Very large
Looselystructured
Often incomplete
Sampling not strategically competitive

© 2015 John Sing – All Rights Reserved
University of South Florida - Spring 2015
6
TimeCom
puti
ng P
ower
Gro
wth
Traditional business “sensemaking” capability
Available datafor observation
ContextEnterpriseAmnesia
What “Big Data” solves:
Chart by: Jeff Jonas/Las Vegas/IBM, Chief Scientist, Context Computing: http://jeffjonas.typepad.com/

© 2015 John Sing – All Rights Reserved
University of South Florida - Spring 2015
7
Enterprise Amnesia, definition
A defect in memory, resulting in missed opportunity, wasted resources, lower revenues, unnecessary fraud losses, and other bad news.

© 2015 John Sing – All Rights Reserved
University of South Florida - Spring 2015
8
TimeCom
puti
ng P
ower
Gro
wth
Traditional business “sensemaking” capability
Available datafor observation
ContextEnterpriseAmnesia
Enterprise Amnesia examples…..
Chart by: Jeff Jonas/Las Vegas/IBM, Chief Scientist, Context Computing: http://jeffjonas.typepad.com/

© 2015 John Sing – All Rights Reserved
University of South Florida - Spring 2015
9
TimeCom
puti
ng P
ower
Gro
wth
Data + Analytics = “Information”
Traditional business“sensemaking”
Available ObservationSpace
Context Big Dataacquisition
= New, Useful InformationAdd: Analytics
What comes after “Information”?
© 2015 John Sing – All Rights Reserved
University of South Florida - Spring 2015
10
Big Data’s Journey to Value
Data + Analytics = Information
Insight
Desired Outcomes
Information + Context =
Insight + Actions =

© 2015 John Sing – All Rights Reserved
University of South Florida - Spring 2015
11
Context
More about Jeff Jonas, IBM Chief Scientist, Context Computing: http://bit.ly/1g3z9ZQ
Jeff Jonas, IBM Chief Scientist
Context Computing

© 2015 John Sing – All Rights Reserved
University of South Florida - Spring 2015
12
Here’s morefrom IBM’s
Jeff Jonas
about “Context”:
Tubechop: http://www.tubechop.com/watch/5634618

© 2015 John Sing – All Rights Reserved
University of South Florida - Spring 2015
13
No Context

© 2015 John Sing – All Rights Reserved
University of South Florida - Spring 2015
14
Context, definition
Better understanding something by taking into account the things around it.

© 2015 John Sing – All Rights Reserved
University of South Florida - Spring 2015
15
Information in Context … = Insights
Top 200Customer
Job Applicant
IdentityThief
CriminalInvestigation

© 2015 John Sing – All Rights Reserved
University of South Florida - Spring 2015
16
The Puzzle Metaphor: what we mean by “Context”
Imagine an ever-growing pile of puzzle pieces of varying sizes, shapes and colors
What it represents is unknown – there is no picture on hand
Is it one puzzle, 15 puzzles, or 1,500 different puzzles?
Some pieces are duplicates, missing, incomplete, low quality, or have been misinterpreted
Some pieces may even be professionally fabricated lies
Until you take the pieces to the table and attempt assembly, you don’t know what you are dealing with

© 2015 John Sing – All Rights Reserved
University of South Florida - Spring 2015
17
Here’s a “context” example…….. “Puzzling”
270 pieces90%
200 pieces66%
150 pieces50%
6 pieces2%(pure noise)
30 pieces10% (duplicates)

© 2015 John Sing – All Rights Reserved
University of South Florida - Spring 2015
18

© 2015 John Sing – All Rights Reserved
University of South Florida - Spring 2015
19

© 2015 John Sing – All Rights Reserved
University of South Florida - Spring 2015
20
First Discovery
© 2015 John Sing – All Rights Reserved
University of South Florida - Spring 2015
21
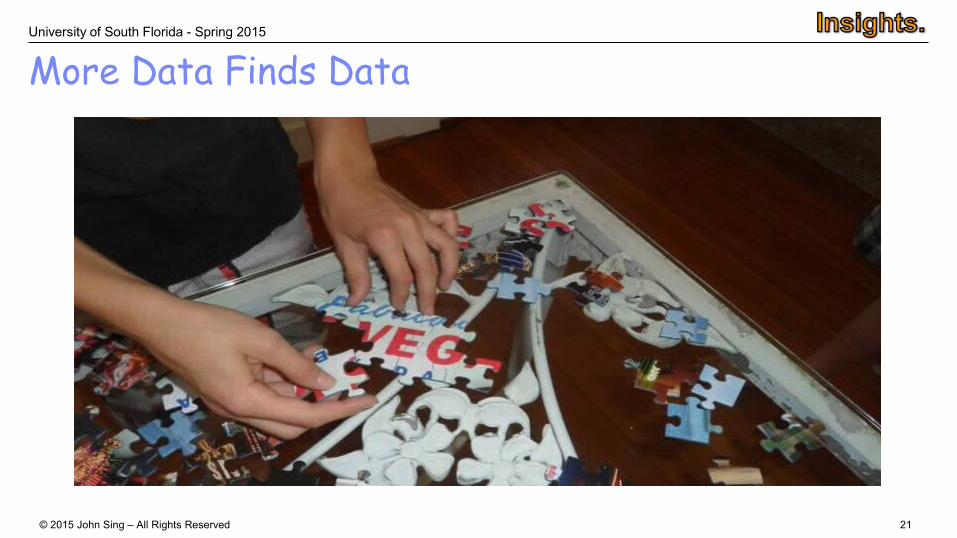
More Data Finds Data

© 2015 John Sing – All Rights Reserved
University of South Florida - Spring 2015
22
Duplicates in Front Of Your Eyes

© 2015 John Sing – All Rights Reserved
University of South Florida - Spring 2015
23
First Duplicate Found Here

© 2015 John Sing – All Rights Reserved
University of South Florida - Spring 2015
24

© 2015 John Sing – All Rights Reserved
University of South Florida - Spring 2015
25

© 2015 John Sing – All Rights Reserved
University of South Florida - Spring 2015
26
Incremental Context – Incremental Discovery
6:40pm START
22min “Hey, this one is a duplicate!”
35min “I think some pieces are missing.”
37min “Looks like a bunch of hillbillies on a porch.”
44min “Hillbillies, playing guitars, sitting on a porch, near a barber sign … and a banjo!”

© 2015 John Sing – All Rights Reserved
University of South Florida - Spring 2015
27
150 pieces50%

© 2015 John Sing – All Rights Reserved
University of South Florida - Spring 2015
28
Incremental Context – Incremental Discovery
47min “We should take the sky and grass off the table.”
2hr “Let’s switch sides, and see if we can make sense of this from different perspectives.”
2hr10m “Wait, there are three … no, four puzzles.”
2hr17m “We need a bigger table.”
2hr18m “I think you threw in a few random pieces.”

© 2015 John Sing – All Rights Reserved
University of South Florida - Spring 2015
29

© 2015 John Sing – All Rights Reserved
University of South Florida - Spring 2015
30

© 2015 John Sing – All Rights Reserved
University of South Florida - Spring 2015
31
Context Accumulates….. Into “Insights”
With each new observation … one of three assertions are made: – 1) Un-associated; – 2) placed near like neighbors; or – 3) connected
New observations sometimes reverse earlier assertions Some observations produce new discovery As the working space expands, computational effort increases
Given sufficient observations, there can come a tipping point. Thereafter, confidence improves while computational effort decreases!

© 2015 John Sing – All Rights Reserved
University of South Florida - Spring 2015
32
WhatCan you See in
Context
now?

© 2015 John Sing – All Rights Reserved
University of South Florida - Spring 2015
33
Big Data [in context] = Insights.
More data: better the predictions– Lower false positives– Lower false negatives
More data: bad data … good– Suddenly glad your data was not perfect
More data: less compute

© 2015 John Sing – All Rights Reserved
University of South Florida - Spring 2015
34
Big Data’s Journey to Value
Data + Analytics = Information
Insight
Desired Outcomes
Information + Context =
Insight + Actions =

© 2015 John Sing – All Rights Reserved
University of South Florida - Spring 2015
35
Now that I create Insights..…. how do I take Action?
Chart in public domain: IEEE Massive File Storage presentation, author: Bill Kramer, NCSA: http://storageconference.org/2010/Presentations/MSST/1.Kramer.pdf:
© 2015 John Sing – All Rights Reserved
University of South Florida - Spring 2015
36
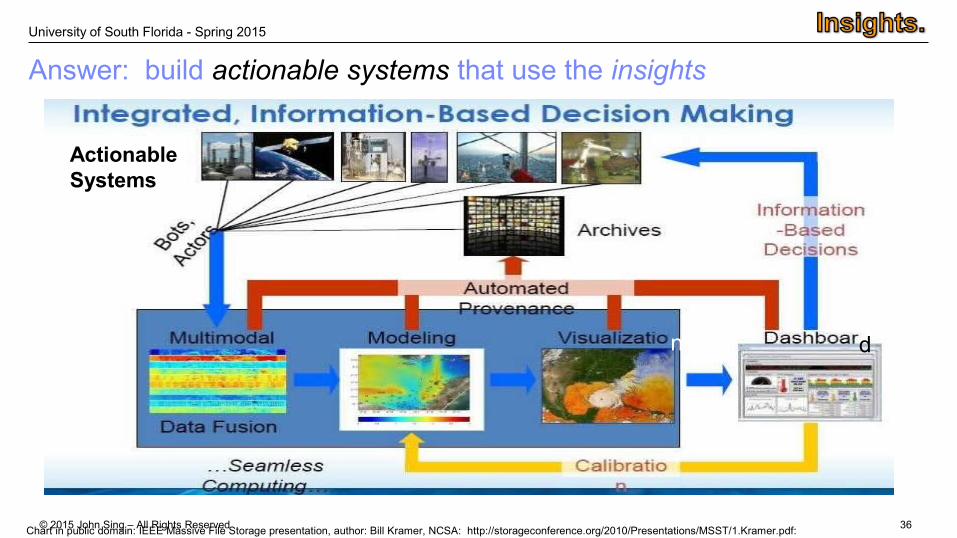
Answer: build actionable systems that use the insights
Chart in public domain: IEEE Massive File Storage presentation, author: Bill Kramer, NCSA: http://storageconference.org/2010/Presentations/MSST/1.Kramer.pdf:
n d
ActionableSystems

© 2015 John Sing – All Rights Reserved
University of South Florida - Spring 2015
37
Projected traffic Insights
•10 minute-ahead volume forecast (blue) vs. actual value (black)
•10 minute-ahead speed forecast (blue) vs. actual value (black).
Black line: actions via signals = desired outcome Stockholm: http://www.youtube.com/watch?v=rfMylzF4lv8
Actionable traffic signals
Blue line: analytics prediction 10 minutes in advance

© 2015 John Sing – All Rights Reserved
University of South Florida - Spring 2015
38
Insights based on crime actions: where to deploy of officers
Blue CRUSH predictive analysis for officer deployment & risk management generated easy-to-read crime maps every four hours Richmond, VA: Violent crime decreased in the first year by 32%, another 40% thereafter,
moving Richmond from #5 on the list of the most dangerous US cities to #99
Memphis Blue CRUSH MapMemphis Blue CRUSH Map
Police videos: http://www.youtube.com/watch?v=8SJQtn4RO7I
Playvideo
https://www.youtube.com/watch?v=_xsffIAHY3I

© 2015 John Sing – All Rights Reserved
University of South Florida - Spring 2015
39
Local Applications: Big Data’s Journey to Value
Data + Analytics = Information
Insight
Desired Outcomes
Information + Context =
Insight + Actions =

© 2015 John Sing – All Rights Reserved
University of South Florida - Spring 2015
40
Local examples

© 2015 John Sing – All Rights Reserved
University of South Florida - Spring 2015
41
Local examples

© 2015 John Sing – All Rights Reserved
University of South Florida - Spring 2015
42
Local examples

© 2015 John Sing – All Rights Reserved
University of South Florida - Spring 2015
43
Quiz: in following Futuristic videosee if you can identify:
Data + Analytics = Information
Information + Context = Insight
Insight + Actions = Desired Outcomes

© 2015 John Sing – All Rights Reserved
University of South Florida - Spring 2015
44
Cognitive Video
The Future – Creating Actionable Big Data

© 2015 John Sing – All Rights Reserved
University of South Florida - Spring 2015
45
Final Quiz: Big Data’s Journey to Value
Data + Analytics = Information
Insight
Desired Outcomes
Information + Context =
Insight + Actions =

© 2015 John Sing – All Rights Reserved
University of South Florida - Spring 2015
46
Thank YouMerci
Grazie
ObrigadoDankeJapanese
Hebrew
English
French
Russian
German
Italian
Brazilian PortugueseArabic
Traditional Chinese
Simplified Chinese
Hindi
Tamil Korean
Thai
TesekkurlerTurkish

© 2015 John Sing – All Rights Reserved
University of South Florida - Spring 2015
47

© 2015 John Sing – All Rights Reserved
University of South Florida - Spring 2015
48
Does Corning understand“Actionable” data?
Predicting the future …..https://www.youtube.com/watch?v=PfgmlVxLC9w