Big Data and Advanced Analytics Technologies for the … · Big Data and Advanced Analytics...
51
Big Data and Advanced Analytics Technologies for the Smart Grid Arnie de Castro, PhD SAS Institute IEEE PES 2014 General Meeting July 27-31, 2014 Panel Session: Using Smart Grid Data to Improve Planning, Analytics, and Operation of the US Capital region T&D Systems 1
Transcript of Big Data and Advanced Analytics Technologies for the … · Big Data and Advanced Analytics...

Big Data and Advanced Analytics Technologies for the Smart Grid
Arnie de Castro, PhDSAS Institute
IEEE PES 2014 General MeetingJuly 27-31, 2014
Panel Session: Using Smart Grid Data to Improve Planning, Analytics, and Operation of the US Capital region T&D Systems
1

BIG DATA
Meter Traditional AMI Meter PMU
Reads/month 1 2,880 77,760,000
Big Data is Relative, not Absolute
When volume, velocity and variety of data exceeds an organization’s storage or compute capacity for accurate and timely decision-making

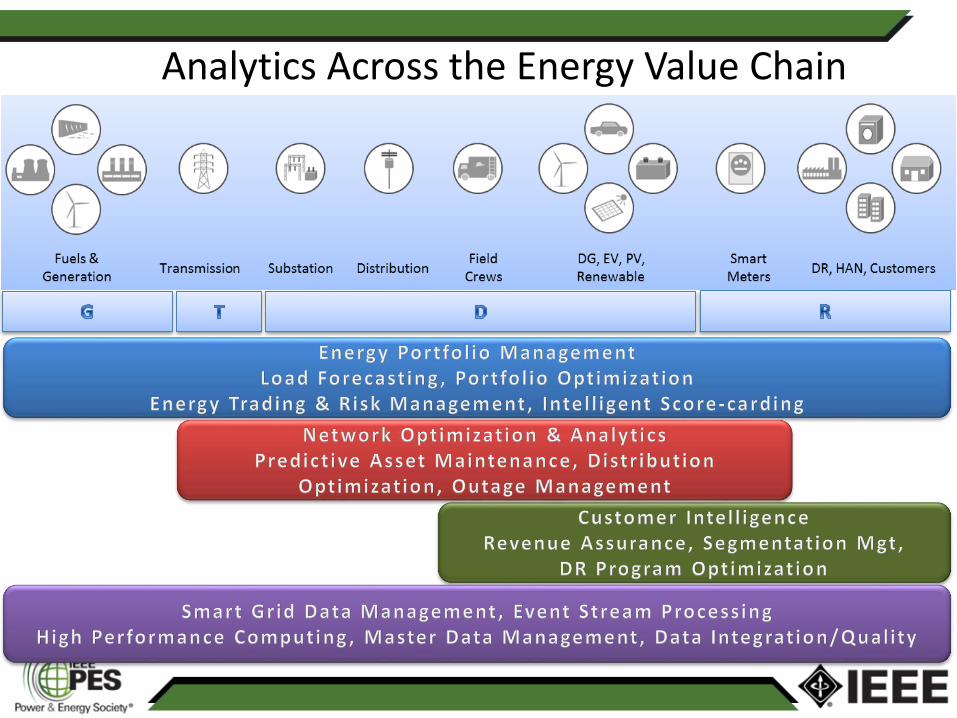
Analytics Across the Energy Value Chain

Technologies for the Smart Grid
• Enterprise Analytics
– Situational Awareness, Descriptive to Predictive, Visualization
• Grid Operations Analytics
– Predictive Asset Maintenance, Outage Management, PMU Monitoring and Analytics, Smart Meter Analytics, Distribution Optimization
• Consumer Analytics
– Energy Forecasting, Consumption Analysis, Revenue Protection
5
ENTERPRISE ANALYTICS

Innovative
Strategies for
Big Data
Analytics
• A flexible enterprise architecture that supports many data types and usage patterns
• Upstream use of analytics to optimize data relevance
• Real-time visualization and advanced analytics to accelerate understanding and action
• Common analytical framework across the enterprise
GRID OPTIMIZATION ANALYTICS

Predictive Asset MaintenanceIdentify equipment that is likely to fail
and/or determine its remaining lifetime
Prioritize problems based on business
impact
Determine root cause more quickly
Provide automated reporting and
alerting
Provide a collaborative environment

Copyr i g ht © 2012, SAS Ins t i tu t e Inc . A l l r ights reser ve d .
The Problem: humidity sensor failure
Pi graph: Indicates key parameters during the humidity
sensor failure.
NOTE: Humidity Sensor failed High
NOx limit is 20ppm (we are seeing ~30 ppm below).
Magenta line is instantaneous NOx ppm.

Copyr i g ht © 2012, SAS Ins t i tu t e Inc . A l l r ights reser ve d .
Root Cause Analysis

Diagnostic Sequence Diagram:
•


OUTAGE OPTIMIZATION

Outage Optimization- Balancing Customer Satisfaction and Reliability: SAIDI, SAIFI
0
500
1000
1500
Hospital High Business High ResidentialHigh
ResidentialLow
ResidentialMedium
Police High EmergencyServices High
SchoolMedium
Outages 30 - 60 Outage 60 - 90 Outage > 90
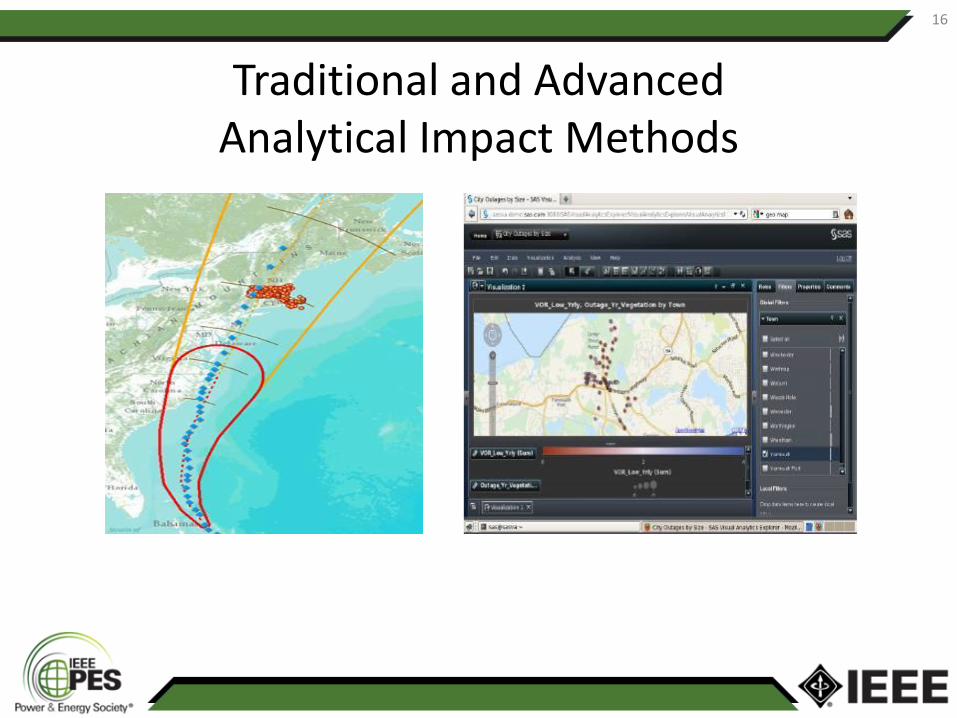
Traditional and Advanced Analytical Impact Methods
16

Outages by City during Hurricane Irene 2011
17

Predicting Outages
• Narrowing Down the Variables Affecting Asset Failure
• Survival Analyses Modeling Asset Potential Storm Failure
• Outage Prediction Model Scoring
18
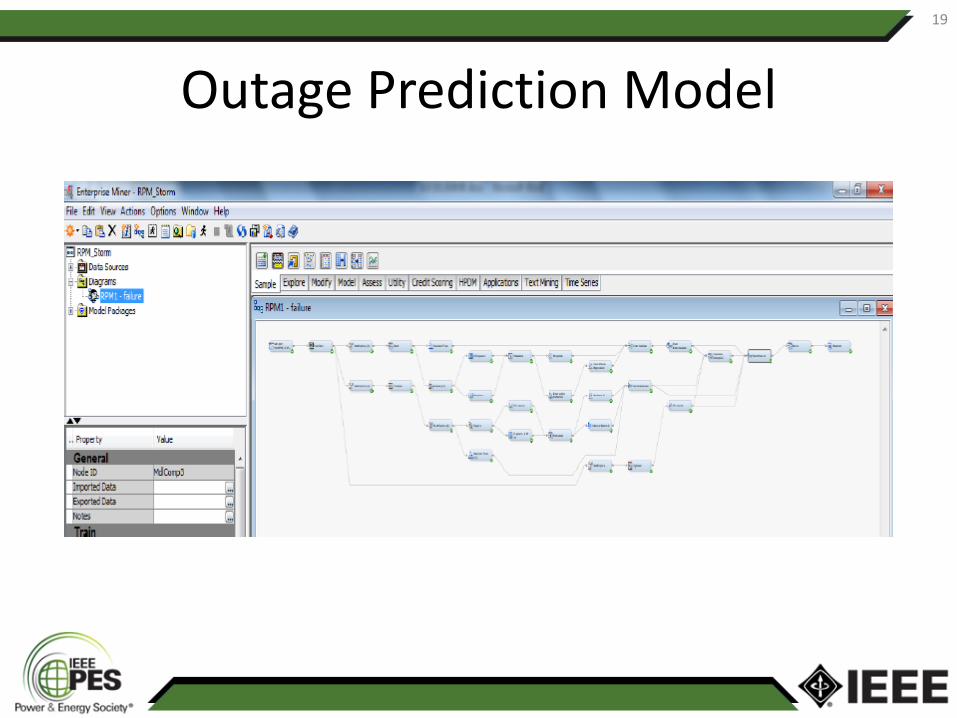
Outage Prediction Model
19

After the Storm Analytics
• Travel time calculation
• Modify MILP Framework for Customer Restoration Constraints
• MILP Solver to Create Optimal Solutions versus Standard Utility Routing
20
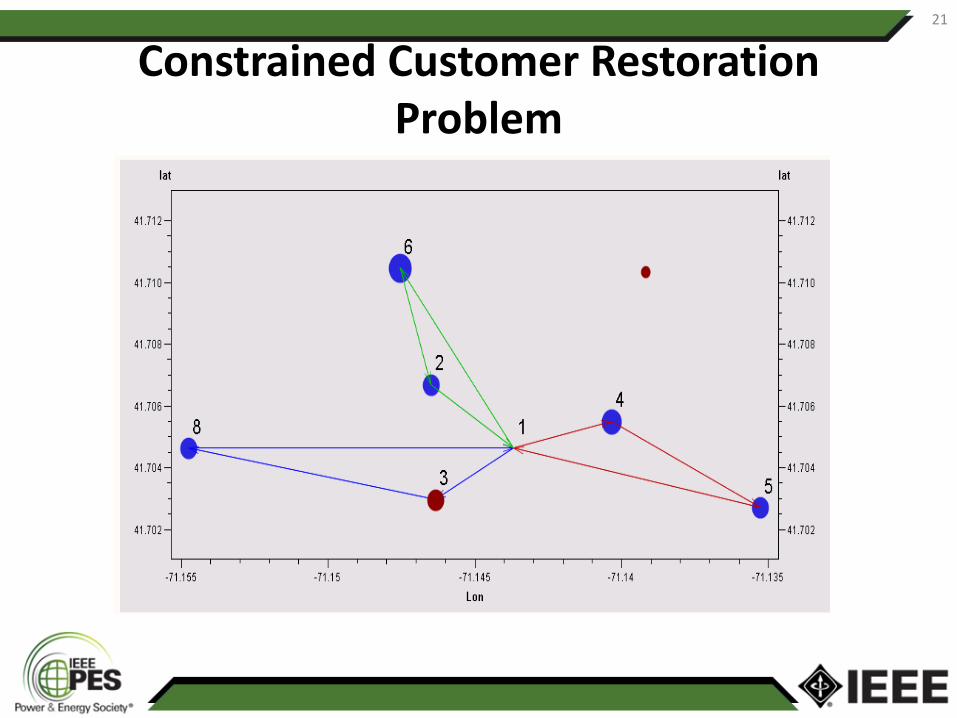
Constrained Customer Restoration Problem
21
PMU MONITORING AND ANALYTICS
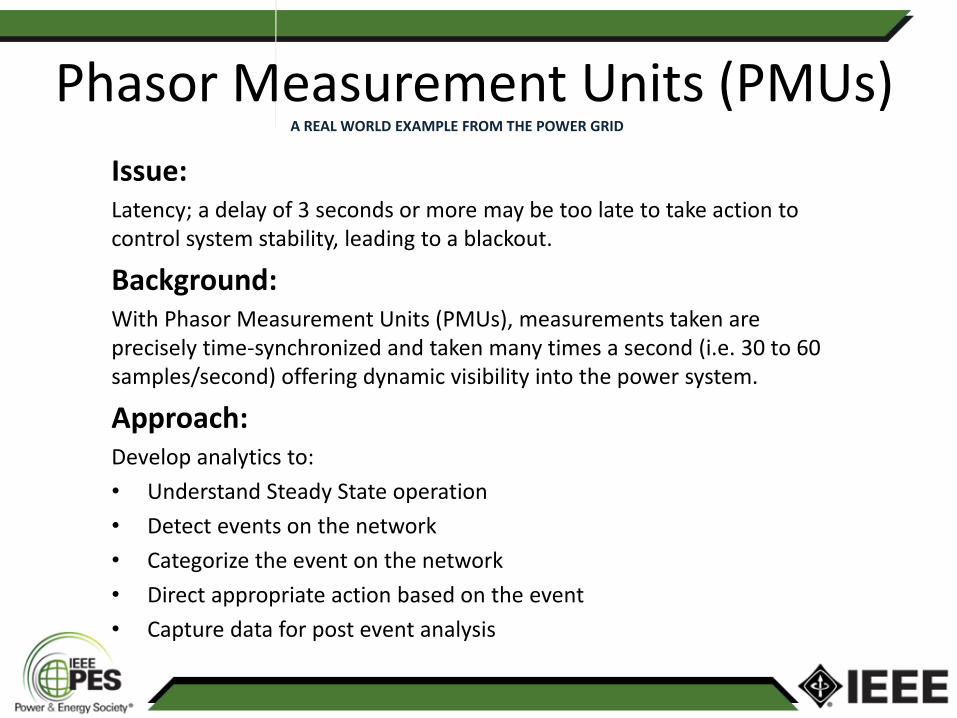
Phasor Measurement Units (PMUs)A REAL WORLD EXAMPLE FROM THE POWER GRID
Issue:Latency; a delay of 3 seconds or more may be too late to take action to control system stability, leading to a blackout.
Background:With Phasor Measurement Units (PMUs), measurements taken are precisely time-synchronized and taken many times a second (i.e. 30 to 60 samples/second) offering dynamic visibility into the power system.
Approach:Develop analytics to:
• Understand Steady State operation
• Detect events on the network
• Categorize the event on the network
• Direct appropriate action based on the event
• Capture data for post event analysis
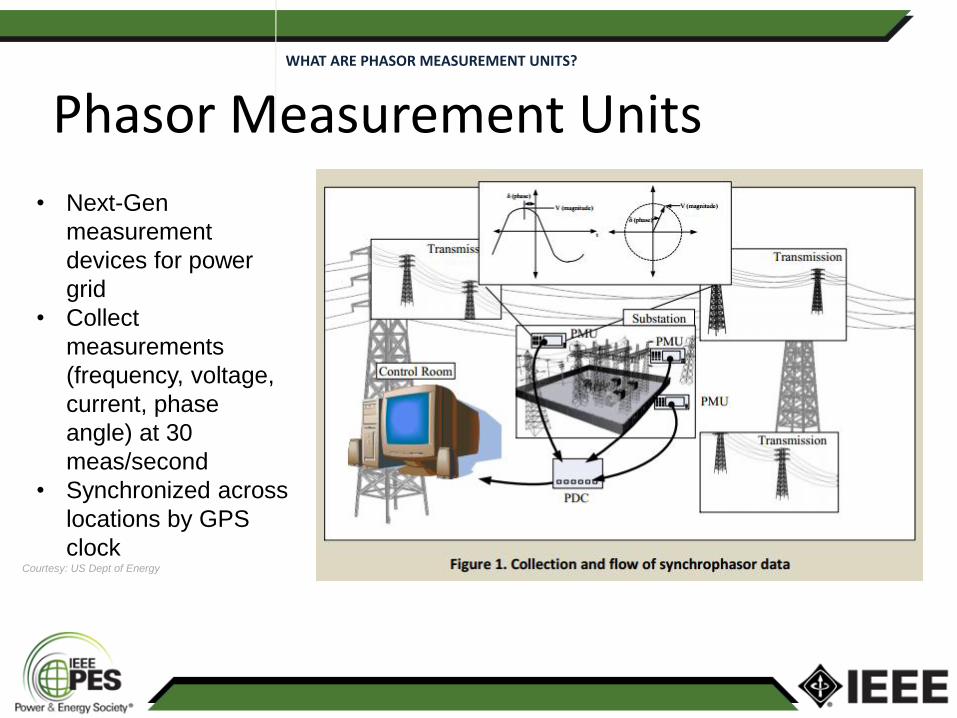
Phasor Measurement UnitsWHAT ARE PHASOR MEASUREMENT UNITS?
Courtesy: US Dept of Energy
• Next-Gen
measurement
devices for power
grid
• Collect
measurements
(frequency, voltage,
current, phase
angle) at 30
meas/second
• Synchronized across
locations by GPS
clock
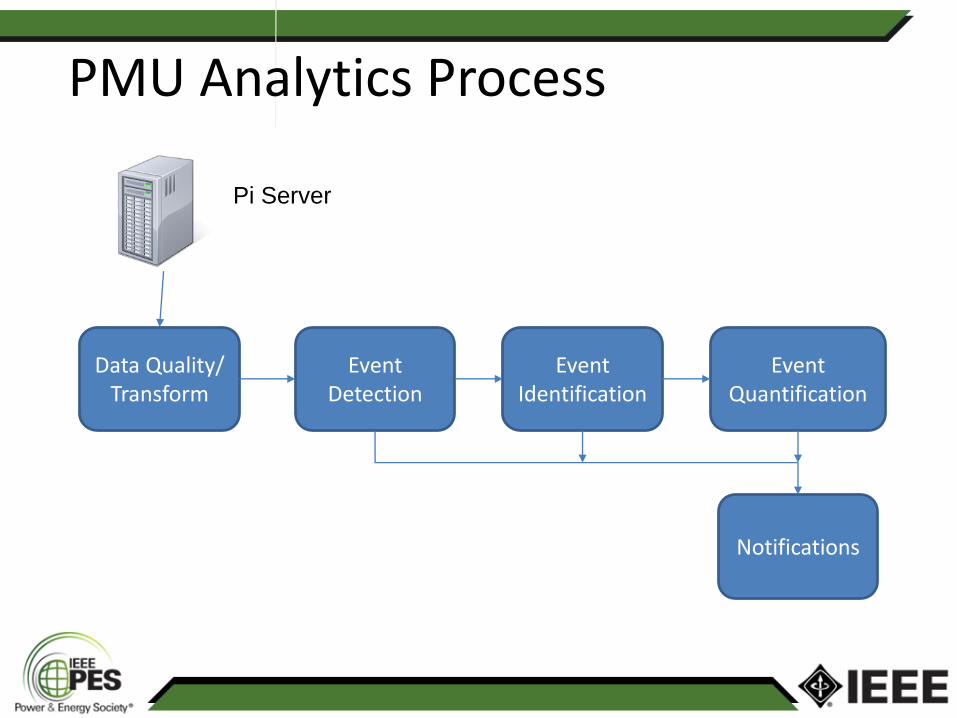
PMU Analytics Process
Data Quality/Transform
Event Detection
Event Identification
Event Quantification
Notifications
Pi Server

PMU Event AnalysisDETAIL CHARTS FOR EVENT
• Current oscillates
after event, but then
dampens down to
normal

Event IdentificationSIMILARITY ANALYSIS
• Reference time
series for various
events
• Incoming data
stream is compared
to reference time
series

Event IdentificationSIMILARITY ANALYSIS
• Similarity between
incoming stream
and reference time
series is measured
and quantified

SMART METER ANALYTICS

Smart Meter Analytics
30

Customer Analysis
31

Load Analysis
32
DISTRIBUTION OPTIMIZATION

Distribution Optimization
Distribution Network Model
GIS, OMSSCADA/DMS, Meter Data,Sensor Data
Network Operations Model
Distribution Optimization
ConservationVoltageReduction
Loss Minimization
Tap Changing Transformers
Capacitors
Regulators
Direct Load Control
CostOptimization
Distributed Intelligence
Distributed Generation
Energy Storage
Load Forecasts
Load Models
Load Analytics
Measurement and Verification
Connectivity(Static) Data
Operational (Dynamic) Data
Optimization Software

ENERGY FORECASTING

Energy Forecasting
• Spatial load forecasting
• Outlier detection
• Demand response forecasting
• Weather forecasting
• Hydro/wind/solar generation forecasting
• Price forecasting

CONSUMPTION ANALYSIS

Load Profile Comparisons via Segmentation

ENABLING TECHNOLOGIES

HIGH PERFORMANCE ANALYTICS

HIGH-
PERFORMANCE
ANALYTICS

Analytics Server Architecture
Metadata
Mid-Tier
SAS VA Server
Workspace Server
Co-Located Data Storage
SAS® LASR Analytic Server
LASR Cluster
HadoopRDBMS Nonrelational ERP unstructured PC Files
MEMORY
STORAGE
PROCESSING
DATA
SOURCES
Co-Located Data Storage
SAS® LASR Analytic Server
LASR Cluster
Co-Located Data Storage
SAS® LASR Analytic Server
LASR Cluster
Massively Parallel Processing (‘MPP’) in the context of SAS® Visual Analytics…
HIGH PERFORMANCE ANALYTICS TECHNIQUES

Copyright © 2012, SAS Institute Inc. All rights reserved.
FORECASTING
DATA MINING
TEXT ANALYTICS
OPTIMIZATION
STATISTICS
Finding treasures in unstructured data
like social media or survey tools
that could uncover insights
about consumer sentiment
Mine transaction databases
for usage patterns that
indicate abnormalities
Leveraging historical data
to drive better insight into
decision-making
for the future
Analyze massive
amounts of data in
order to accurately
identify areas likely to
produce the most
profitable results
ANALYTICS
INFORMATION
MANAGEMENT

EVENT STREAM PROCESSING
Copyr i g ht © 2012, SAS Ins t i tu t e Inc . A l l r ights reser ve d .
Event Stream Processing (ESP)
ESP is a subcategory of Complex Event
Processing (CEP) focused on
analyzing/processing ‘events in motion’
called Event Streams.*
The SAS ESP is an embeddable engine
that can be integrated into or front-end
SAS solutions.
* This is the definition provided by the Event Processing Technical Society

Copyr i g ht © 2012, SAS Ins t i tu t e Inc . A l l r ights reser ve d .
• Continuous queries on data in motion (with incremental results)
• Moves analytics from centralized data warehouse to edge analytics (closer to the occurrence of the events)
• Very low (max) event processing latencies (i.e., µsecs-msecs)
• High volumes (>100k events/sec)
• Derived event windows with retention policies
• Memory constrained for performance (i.e., Bounded state)
• Predetermined data mining, decision making, alerting, position management, scoring, profiling, …
TYPICAL CHARACTERISTICS OF
EVENT STREAM PROCESSING
APPLICATIONS:

Copyr i g ht © 2012, SAS Ins t i tu t e Inc . A l l r ights reser ve d .
Hybrid (Multi-staged) Analytics:Streaming Analytics front-ending historical/predictive analytics
ESP
ESPs store the
queries
and
continuously
stream data
through the
queries
RDBMS
Databases store
the data
and periodically
run queries
against the stored
data
EVENTSINCREMENTAL
RESULTSQUERIES RESULTS

Data Flow Model:
Meter readings are continuously published into
Readings source window
Event Stream Processing Server
SubstationsReadings(source)
vminGTvmax(copy)
Grid
Management
Console
Meter
Readings
ESP Utilities Power Grid Management
Monitor the Power Grid for Concerning Meter Reading Patterns Suggestive of Less Than Optimal Health
readingsWstats(aggregate)
volChk4(filter)
volChk3(filter)
volChk2(filter)
volChk1(filter) sigma2
(filter & pattern)
integral(pattern)
downtrend(pattern)
sigma1(filter & pattern)
Cleanse readings(compute&
procedural)
Slot1: vmin>vmax
Slot 0: vmin<=vmax
Downtrend: trend of 6 points in a row either
increasing or decreasing
Readings window uses output slot feature with
exvolion vmin>vmax to send bad readings to
vminGTvmax window & good readings to
cleanse readings window
DataFlux data quality functions are used to cleanse
the readings. Null fields are fixed via procedural
window using prior state.
Aggregate window adds meter stats to readings:
count, ave ave vmax, ave vmin, stdev, stdev
vmax, stdev vmin
volChk1: vmin<minThresh1 or vmax>maxThresh1
volchk2: vmin<miinThresh2or vmax>maxThresh2
volChk3: vmin<=0 or vmax<=0
volChk4: vmin>aveVMIN+2*stdVMIN or
vmin<aveVMIN-2*stdVMIN or :
vmax>aveVMAX+2*stdVMAX or vmax<aveVMAX-
2*stdVMAX
sigma1: 4 out of 5 consecutive points fall beyond
1σ, on the same side of the centerline (mean)
Sigma2: 2 out of 3 consecutive points beyond 2σ,
on the same side of the centerline (mean)
Integral: 9 consecutive points either above or
below the centerline (mean)

EVENT STREAM PROCESSING
Connected DevicePROCESS REFERENCE ARCHITECTURE
Workflows/ Case Management
Mobile Dashboard/ Alerts
Dashboard/Alerts
Data VisualizationStreaming Data Access/Cleanse
Maintenance/ Quality
Customer Seg/ Next Best Offer
Fraud & Compliance
Network Security/ Management
……Data Management
Low Latency
Batch Processing Data
Model Deployment
Sensor Data/ Smart Device
Telemetry
Trade/ Financial Feeds
Databases
Routers, switches
• Threshold• Models• Patterns• Queries
SOURCE DATA
ACCESS ENGINES
ACCESS SERVER
• Data In-Memory• Extreme Parallelism• Distribution of
Analytics Processes
MODEL DEVELOPMENT / BATCH ANALYSIS / ALERT / REPORT / ROOT CAUSE / ADJUDICATE
Batch Processing
Network Traffic
10011 01 100111

Analytics Solutions Across the Energy Value Chain