Big Data Analytics in SAI India - intosaicommunity.net€¦ · Web viewFor an auditor the above...
20
Big Data Analytics in SAI India 1. Introduction As governments and other audited entities transition into digital environment, they generate, process and store voluminous data. Also, useful and relevant data in disparate forms are incessantly produced by various agencies and entities, such as Census, Sample Surveys, industry/domain specific data etc. When collated, they provide the contextual framework and valuable insight into the functioning of an audited organization. The idea is not to restrict oneself to data analysis on the data from the audited entity but to link the data with multiple data sources related to the functioning of the organization and get meaningful insights for audit. With the increasing size and complexity of the data from various sources, the challenge for the auditor is also technical to bring all the different data source into same platform and to have necessary tools/human expertise to do analysis on the Big Data. This paper explores SAI India's effort in reorienting its audit process in wake of the Big Data revolution 2. Big Data Big Data refers to extremely large, complex data sets that exceed the traditional processing capabilities of the IT infrastructure due to their size, format diversity and speed of generation. It is collated from all imaginable sources and leverages information as the vital asset. It includes: - Structured and unstructured data - internal and external data - formal and informal communication There are three dimensions of big data which are to be considered while designing a management framework for big data
Transcript of Big Data Analytics in SAI India - intosaicommunity.net€¦ · Web viewFor an auditor the above...
Big Data Analytics in SAI India
1. Introduction
As governments and other audited entities transition into digital environment, they generate, process and store voluminous data. Also, useful and relevant data in disparate forms are incessantly produced by various agencies and entities, such as Census, Sample Surveys, industry/domain specific data etc. When collated, they provide the contextual framework and valuable insight into the functioning of an audited organization. The idea is not to restrict oneself to data analysis on the data from the audited entity but to link the data with multiple data sources related to the functioning of the organization and get meaningful insights for audit. With the increasing size and complexity of the data from various sources, the challenge for the auditor is also technical to bring all the different data source into same platform and to have necessary tools/human expertise to do analysis on the Big Data. This paper explores SAI India's effort in reorienting its audit process in wake of the Big Data revolution
2. Big Data
Big Data refers to extremely large, complex data sets that exceed the traditional processing capabilities of the IT infrastructure due to their size, format diversity and speed of generation. It is collated from all imaginable sources and leverages information as the vital asset. It includes:
- Structured and unstructured data- internal and external data- formal and informal communication
There are three dimensions of big data which are to be considered while designing a management framework for big data
1) Distinguishing featuresa. Volume - quantity, the amount of datab. Variety – formats, the data types, data from various sourcesc. Velocity – speed, the speed of data going in and outd. Veracity – quality of data
2) Processesa. capture- obtaining data in various formsb. curate -synthesizing data for use and reusec. store -preservationd. search -exploration e. share–distribution and accessf. transfer– move
3) Results - visualization and analysis
The insights from Big Data analysis is all around us even if one is not realizing it conspicuously. How Amazon identifies books of interest to you or Google showing links to ads which you are likely to click are all example of analyzing data in the range of hundreds of petabytes and to use the insights gained in bringing the data more relevant to the consumer. An auditor can also similarly gain from the big data techniques to understand the audited entity which would he have normally failed to notice
3. Auditing Big Data
Capacity and infrastructure limitations have thus far restricted the reach of auditors in the big data environment. The technological advancements in recent times in the form of Cost effective tools, technology platforms and solutions is a big boon for the auditors in handling and analyzing big data. Big data analytics enhances risk assessment by discovering red flags, outliers, abnormal behavior and by providing deeper insights. It facilitates predictive analysis and use of advanced statistics for transformation of data into actionable information. It thus, contributes to greater level of assurance in audits. Overall it enables the SAIs to aid governance by providing insights to the executive for evidence based decision making.
Big Data from the perspective of SAIs need not be strictly seen as per the conventional definition of the term. The data that SAIs may encounter may not be as big or as complex as in private firms, say for social media companies nor Big Data platforms like Hadoop may be always required for handling the data. Big Data in audit is not to be seen from the technical angle but idea here is to have the Big Data approach to audit. Big data approach to audit implies a paradigm shift, which by design envisages synthesizing and integrating relevant data from various sources and in various formats to transform data into actionable information.
While using Big Data for audit analysis, some fundamental differences needs to be understood. For example, a social media is the owner of the data it is processing and hence can design the entire IT system to enable Big Data Analysis that suits its requirements. An organization owning the data can have advanced data warehousing platforms since it’s essentially the same data set they are analyzing day in and out. Hence standardized models can be built upon which can give output as required for its business
For an auditor the above mentioned luxury is not there and he usually has to work with the data that is provided to him or with the restricted access to the IT system of the

organization. In most of the cases, the auditor can't have a data warehousing model since it's not data from the same organization he is operating all the time. Data warehousing of data from all the audited entities may also not be cost effective for auditors especially for SAIs with hundreds of audited entities under their purview. Auditor generally pushes the data at the time of audit, do the processing and then pushes out the data after analysis so that he can bring new data from a different source to his analytic platform for doing audit. Moreover he is constrained by the limited time available for audit during which he has to understand the data, analyze it and get output which substantiates his audit. Auditors need to keep these in mind while designing their Big Data strategies.
4. Big Data Policy Framework
In order to realize the potential of Big Data Analytics, the policy framework on Big Data of SAI India addresses the following issues:
Identification of data sources Establishing Data Management Protocols Data Analytics Infrastructure, capacity building and change management
A) Identification of data sources
Identification of the various sources of data available and accessible to the Department is the corner stone of the data management framework. Data can be categorized as:
Internal Data sources - Data created/maintained by the Department Audited entities’ data sources -This data is available with the Department in its
professional capacity and such data comprises the following:a. Financial and non-financial data of audited entitiesb. Programme specific data including beneficiary databasesc. Other data pertaining to audited entities
Third party data sources- This comprises data, which are available in the public domain such as:
Census data Sample Survey data Data published by the various Ministries/Departments Reports of various commissions Other Reports and data pertaining to Union Government /States
Other data available in public domain Surveys and information published by NGOs Industry specific information published by, CII, FICCI/NASSCOM etc. Sector specific information published by various organizations Social media etc.
B) Establishing Data Management Protocols
The Data Management protocols have to ensure that data satisfies the following characteristics:
a. Authenticity – Data is created through the process it claimsb. Integrity – Data is complete, accurate and trustworthy.c. Relevance – Data is appropriate and relevant for the identified purpose.d. Usability– Data is readily accessible in a convenient manner.e. Security – Data is secure and accessible only to authorised parties.
The data management protocols would also address: data access arrangements including agreements with external sources data sensitivities associated with access and usage of various sources of data criteria for assessing veracity of data involving an assessment of strengths and
weaknesses of various sources and their application at various stages of audit (risk assessment, sample selection, benchmarking, reporting).
privacy and confidentiality issues covering procedures of aggregation and anonymization and
compliance with legislative and regulatory requirements.
C) Data Analytics
Data Analytics refers to the process of integration and synthesis of the varied forms of data to:
- provide deep insights- discover patterns (correlation and causation)- throw up abnormal behavior, red flags and outliers that are otherwise hidden- predict and plan audits- support audit analysis

Data Analytics leverages the evidence based approach and is deployed at the audit planning stage for a macro level analysis of almost the entire range of data, rather than on a small representative sample. It requires knowing what data is needed to answer questions, where to find it and having the analytic tools to capitalize on that knowledge. It is through these platforms that real value is realized from big data. Data Analytics will involve the following:
Understanding the Data
The very first assumption on which we proceed in audit is that when the data lands on the table (or computer) of the data analytics professional, he has very little prior knowledge of the data. This needs to be acknowledged as a very important challenge for the audit professionals doing data analytics. Unlike regular analytics professionals who are internal to the organization or contracted by the organization- thus a friend, audit professionals necessarily deal with a large number of organizations and often the cooperation that is needed to understand the complex data is not forthcoming in full measure.
We need therefore to develop certain basic protocols to receive the data. Each set of data must be accompanied with data dictionary which will help audit professionals to understand the contents of the columns. Each such database must be complete, reliable and accurate. Since for an audit professional, there is no way to ascertain the completeness, reliability and accuracy of the given database, it will be better to obtain a written assurance from the organization that the database is complete, reliable and accuracy.
Very broadly speaking, a database can be in the nature of master database or transaction database. Master database in this context, we define as a database containing such information which are not changed very frequently. This can be updated infrequently but not modified or deleted frequently. A transaction database, on the other hand, is a repository of transaction data which are appended as and when a transaction takes place. It is important for audit to ascertain the date up to which the database has been appended or modified.
The phase of understanding the data will involve getting answer to some key questions relating to the database. Examples of these questions1 are:
(a) Whose data it is?(The data belongs to X department of Government of Y)
(b) What the data is about?(The data is the record of all receipts of Passenger Tax. It is updated till 31 March 2015.)
(c) What is the nature of the data?
1 Naturally, these questions and their answers are illustrative, not exhaustive.
(The data is both master and transaction; it records names of all from whom passenger tax is collected, the amount assessed and collected; it also records the address and other details of the tax payer.)
(d) How big is the database?(The database contains 15 lakh records; the size is about 10 GB)
(e) What is the environment of the data- operating system, database system?(Oracle RDBMS; on a Linux platform)
(f) What is the structure of the database? (It contains 10 tables; all relational; Four of them contain master data, six transactional data)
(g) What are the Table structures?(Tables have small number of columns. Only one table has more than 10 columns. The database has optimum normalized structure.)
(h) What are the column structures?(String, Numeric etc. etc.)
(i) What do the columns signify?(Essentially data dictionary. Should understand that PN_Code signifies PINCODE which is string column with length of six.)
(j) How does the data look?(A little lazy browsing of the data provides great insight. One can see the null values, how the data is populated, big gaps if any, sometimes dummy data like a date field containing data like 1.1.1900 will indicate possibility of legacy data being imported.)
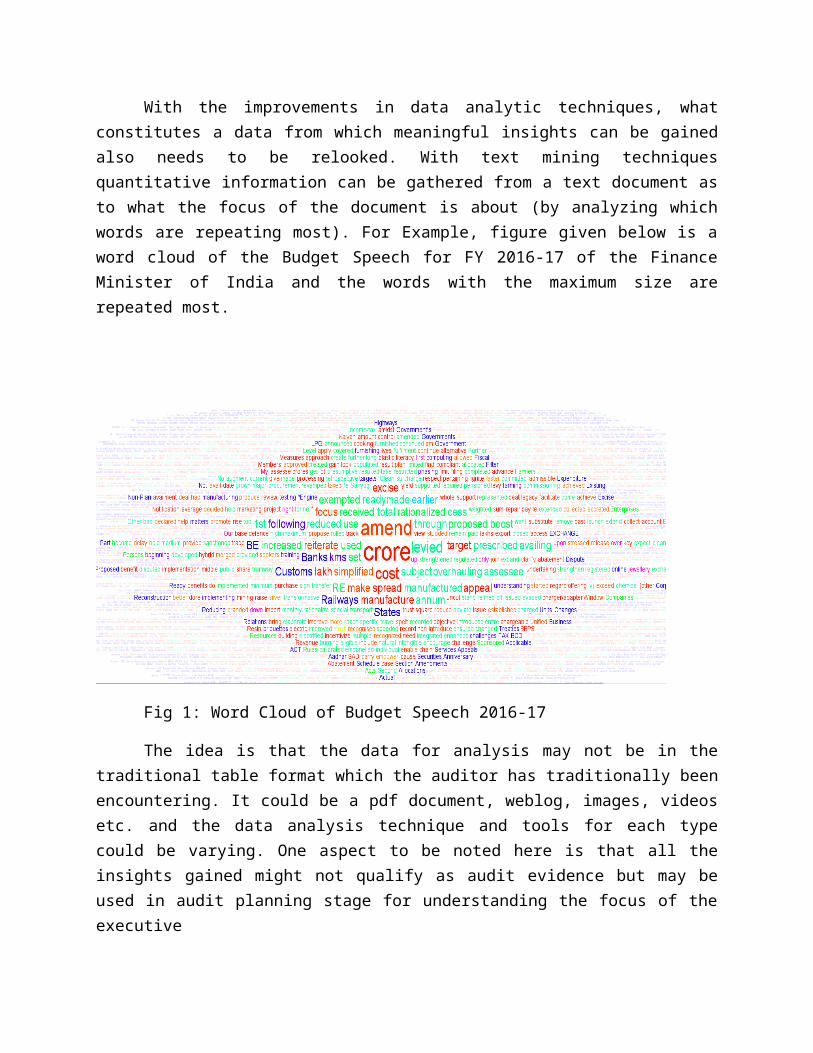
With the improvements in data analytic techniques, what constitutes a data from which meaningful insights can be gained also needs to be relooked. With text mining techniques quantitative information can be gathered from a text document as to what the focus of the document is about (by analyzing which words are repeating most). For Example, figure given below is a word cloud of the Budget Speech for FY 2016-17 of the Finance Minister of India and the words with the maximum size are repeated most.

Fig 1: Word Cloud of Budget Speech 2016-17
The idea is that the data for analysis may not be in the traditional table format which the auditor has traditionally been encountering. It could be a pdf document, weblog, images, videos etc. and the data analysis technique and tools for each type could be varying. One aspect to be noted here is that all the insights gained might not qualify as audit evidence but may be used in audit planning stage for understanding the focus of the executive
Exploring the data
Now that one has appreciated the scope of understanding, the task of exploring the data starts. At this juncture, it is important to be very clear about the scope and objective of data analysis. Analysis of big data can be meandering and may fail to provide meaningful results if we are not clear about what we want to know from the data. It is also important to remember that part of the exploring also enhances our understanding of the data in a more scientific way.
Visualization of data could be a good starting point to explore the data. Plotting the key fields of the data will give an overview of the distribution of data. Line plots, scatter plots, bars and many other forms can be used for understanding the data visually. The advantage with visual exploration is that various characteristics of data like its distribution pattern, its range of values, the crowding of values around mean, the outliners etc. can be readily identified and this will help in making further data analysis and audit probe.
Statistics is the backbone of data analytics .Several statistical measures can be calculated on each numeric variable of interest (Mean, Median, Mode, Standard Deviation, lower and upper quartile, extreme outliers etc.) These statistics are considered robust statistics

and provide invaluable insights into the data. Histogram including interactive histogram between two data series or time series is another interesting method. Histograms can be done on the basis of sum or average of a numerical columns and provides interesting comparisons. Most of the packages provide functionality of conditional plotting. This further improves the analysis to find out the statistical measures fulfilling conditions relating to another variable.
The statistical analysis can be further built upon with co-relation and regression analyses. A multivariate linear correlation will throw up the relationship among the different variables. Fig2 is an example of correlation analysis on variables from different data sets. Here individual household level data is taken from Census of India, 2011 to get availability of good quality water district wise in the state of Rajasthan. Similarly district wise Infant Mortality Rate (IMR) data is taken from health records. The plotting of bad water is showing a definite correlation with the IMR. This may be just correlation with no causal relation but further analysis or studies may also prove with great certainty the causal relation. If that’s established, then audit of programmes targeting IMR reduction can also look into the efforts in providing good quality water within the audit scheme.
Fig 2: Relation between Water Quality and IMR
A regression analysis on the other hand indicates the movement of an independent variable on the movements of the dependent variable(s). This is also the first step of prediction. Predictive
modeling can be taken to another level with machine learning, fuzzy rules etc. The possibilities are immense. The challenge is in building the skills to desired level to take advantage of the opportunities available.
Once the data analysis has given sufficient insight into the data and pointers to specific risk, querying can be conducted to get actual instances of irregularities. The better understanding of the data from previous analysis and the auditor’s intuition will be the key in framing proper querying and thus good audit findings.
One key aspect with regard to Big Data approach will be to not treat data from different sources individually but to create meaningful linkages between different data sets so that they can be analyzed as a whole. Here the choice of data sources need not be limited to the data of the audited entities but any relevant data set could be employed.
Data Analytics and types of audit
The benefits of data analytics could be multiple across various types of benefits. Better audit planning, risk analysis, sample selection etc. can be put into application for all types of audit. Standard dashboards can be built which can be used by various audit team by selecting the units relevant to them. Hence those information which needs to be looked into by all audit teams can be built as standard models rather than audit party recreating those every time during visit to auditee units. An example of this is given as Annexure1
In Compliance Audit, with Big Data Analytics audit of hundred percent transaction can be conducted rather than following a sample based approach. Advancement in hardware and software capabilities in recent times have greatly reduced the time and cost involved in running queries into huge databases. In Financial Audit, applications could be build which monitors various financial parameters and ratios. These dashboards can provide warning signs when the parameters exceed the specified limits. Similarly drill down facility available with most of the tools would help in going down to the exact cause of the abnormality. An example of how this is done in Annexure 2
In Performance Audit, the benefits from data analytics are enormous. Consider a Performance Audit being undertaken to evaluate the improvement in health parameters in the country. For simplicity sake, we may limit our analysis on one parameter, say Infant Mortality Rate (IMR). In conventional audit we would collect data from health ministry regarding the schemes targeted at IMR reduction and mostly limit our analysis on implementation of the scheme. Here we are not able to analyze fully whether the scheme itself is addressing all the factors causing IMR.

Using data analysis, we can vastly improve the value addition provided by audit. We can start of by collecting data from various sources which may have linkages with IMR. This could be data on demographics (Census), socio-economic conditions (NSSO). Health facilities (from health ministry), finances of health schemes (Accounts), research papers on health etc. Now that the data is available, Risk analysis can be made more objective with text mining of previous Inspection Reports, academic research papers on IMR. Correlation analysis of the various parameters from Census (say sanitation facilities), NSSO (education) etc. could be done against IMR. Those variables showing high correlation could be put for regression analysis and variables could be identified which are significant and regression equation could be framed to see the impact of each variable on IMR. Similarly a time series analysis can also be done on the financial allocation vis-à-vis outcome (IMR reduction) to see the impact of higher budget allocation. Predictive modeling on the budget allocation may give an idea of the finances required to reduce the IMR to a specific target over the next few years. Thus we can see that data can help us to get into the issues which might have been overlooked in a conventional audit. More over the recommendations will be more specific and useful to the executive in framing policy. In this method, audit is more useful to the executive since many factors which they have overlooked can be brought into limelight.
Data Analytics and IT Audit
Data analytics is integral part of IT Audit, though it must be said that both are not one and the same thing. For IT Audit, the primary objective is to draw assurance about the integrity of the IS System and to achieve that assurance, the auditor might among other things, resort to data analytics. The primary objective of the data analytics however is to gain meaningful insights into the data and even use predictive modeling techniques in order to understand how a phenomenon might evolve based on the datasets available.
D) Infrastructure, capacity building and change management
CAG of India has set up a task force to provide a framework for Big Data Analytics in audit. The Task Force is at present evaluating various open source and licensed Big Data analytical and visualization tools and platforms like Knime, Tableau, R, Hadoop etc. for adoption in the department.
The objective is to develop a set of standard operating procedures for data analytics to be used in the organization. These procedures will include multiple skill sets in big data analytics, statistical analysis and audit procedures. It is also intended to develop a data analytic culture across the department. To facilitate this, it is intended to develop a structured training

module to train at least 5000 personnel in the department. While the emphasis is to develop in house skills, the organization is also on the look out to hire technical personnel from outside to assist in data analytics.
It is intended to adopt open source tools as much as possible for the reason that the field offices will have easier and unlimited access to powerful Analytic tools. They can be adopted in the entire department without worrying about costs and procurement cycle. Preliminary experiences with an open source software Knime has been encouraging and the tool was found to be quite robust.
Way Forward
With the Big Data revolution in the external environment and specifically in the audited entities, auditors can’t remain immune to the changes. SAI India has realized the importance of adopting the technical advancements and necessity of building the capabilities in the organization in this arena to make the audit more meaningful and relevant to the stakeholders. Going forward, SAI India intends to operationalize a Centre for Big Data Analytics within the department. This Centre is intended to be a nodal organ which will steer the department in the arena of Analytics. Capacity building, keeping up to date with technological changes, identifying necessary tools, building standard dashboards etc. are the major duties identified for the Centre. The challenges and resources required in building the required capabilities may be huge but the benefits far outweigh the costs. The option of not getting into Big Data Analytics is not there going forward .If the question is only when to do it, the answer is earlier the better and SAI India is at the start of that long trip
Annexure 1
This Annexure gives snapshots of a standard dash boards prepared for use by various audit team. Figure below shows the standard view
When a specific audit unit is selected (DDO Name Field), graphs and tables summarizes the transaction related to that unit only. The team doing audit of the specific unit will have to only select that unit from the list

The explanation of previous view is as follows:
Similarly the same dash board can be used in Performance Audits as shown below:
Annexure 2
The chart below shows the month wise expenditure pattern of the State Government of Tamil Nadu against the Budget Provisions for the year accounting year 2014-15.
Drilling down to a specific grant/department (Information and Publicity)
The pattern of expenditure of Information and Publicity Department, for the year 2014-15 throws an abnormal pattern
The same grant was checked in the previous year to see if this is a continuous phenomenon, on selecting year 2013-14 in the dash board, the following is observed.
This shows systemic budgeting issues in the department. Similar exercise could be repeated for all the grants, for both/all years.