Big Data: A Small Introduction - Aidan HoganAidanhogan.com/docs/bits2014.pdfBig Data: A Small...
12
Big Data: A Small Introduction Aidan Hogan July 18, 2014 The Value of Data Soho, London, August 1854: seven years before the discovery of germs by Louis Pasteur, people were dying in their hundreds from a mysterious disease called cholera. The wisdom of the time was that cholera was caused by miasma : something bad in the air—a foul fog of disease that would naturally build up in heavily populated areas. But John Snow, a physician working in London, was sceptical of this theory—and so he set out to find a better one. Snow began by surveying those affected by cholera in the area, marking in a journal their names, gender, ages, locations, date of illness, date of death, daily habits, and so forth, applying various statistical and analytical techniques over the data. From his survey, he mapped out all of the Soho cholera cases, per Figure 1. Each dark rectangle indicates a case of cholera at that location and each stack represents a household or a workplace. Using a Voronoi diagram, it became clear that the cases of cholera were clustered around the water pump on the intersection of Broad Street and Cambridge Street; people living closer to another pump were not affected. Snow convinced the authorities to remove the handle from the pump. New cases of cholera ceased. Even though the microscopes of the day could not see the physical cause of disease swimming in the water, 616 deaths and 8 days later, Snow’s data had found the cause: an infected well dug close to a cess-pit of sewage. This was a revolutionary finding: cholera was not something in the air, but rather something in the water. As computer scientists, we sometimes forget the value of data. Like a locksmith might consider keys as pieces of metal that have to be cut and sold, we tend to consider data as something that has to be stored or parsed, something that moves from input to output: composed of bytes in a machine, terminals in a grammar. It is only with a sense of the importance of data to other fields – and the ability to refine knowledge from it – that the recent and unusual hype around “Big Data ” can be understood. John Snow understood the value of data. His work in Soho, 1854, set the precedent for the field of epidemiology : the analysis of data to extract the patterns of causality of illness and disease in populated areas, encompassing public health screening, clinical trials, the cause and spread of infectious diseases, outbreak investigation and simulation, and so forth. Epidemiology’s success stories include, amongst others, the eradication of smallpox, the isolation of polio to localised areas, and a marked reduction in cases of malaria and cholera. Of course the value of data is appreciated not only in the field of epidemiology, or the field of genetics, or the field of medicine, or of observational astronomy, or of experimental physics, or of climatology or oceanography or geology or ecology or sociology, or even of science or enterprise. Data take centre stage in many scientific, commercial and social aspects of life. Like the work of 1
Transcript of Big Data: A Small Introduction - Aidan HoganAidanhogan.com/docs/bits2014.pdfBig Data: A Small...

Big Data: A Small Introduction
Aidan Hogan
July 18, 2014
The Value of Data
Soho, London, August 1854: seven years before the discovery of germs by Louis Pasteur, peoplewere dying in their hundreds from a mysterious disease called cholera. The wisdom of the time wasthat cholera was caused by miasma: something bad in the air—a foul fog of disease that wouldnaturally build up in heavily populated areas. But John Snow, a physician working in London, wassceptical of this theory—and so he set out to find a better one.
Snow began by surveying those affected by cholera in the area, marking in a journal their names,gender, ages, locations, date of illness, date of death, daily habits, and so forth, applying variousstatistical and analytical techniques over the data. From his survey, he mapped out all of the Sohocholera cases, per Figure 1. Each dark rectangle indicates a case of cholera at that location andeach stack represents a household or a workplace. Using a Voronoi diagram, it became clear thatthe cases of cholera were clustered around the water pump on the intersection of Broad Street andCambridge Street; people living closer to another pump were not affected. Snow convinced theauthorities to remove the handle from the pump. New cases of cholera ceased.
Even though the microscopes of the day could not see the physical cause of disease swimmingin the water, 616 deaths and 8 days later, Snow’s data had found the cause: an infected well dugclose to a cess-pit of sewage. This was a revolutionary finding: cholera was not something in theair, but rather something in the water.
As computer scientists, we sometimes forget the value of data. Like a locksmith might considerkeys as pieces of metal that have to be cut and sold, we tend to consider data as something thathas to be stored or parsed, something that moves from input to output: composed of bytes in amachine, terminals in a grammar. It is only with a sense of the importance of data to other fields –and the ability to refine knowledge from it – that the recent and unusual hype around “Big Data”can be understood.
John Snow understood the value of data. His work in Soho, 1854, set the precedent for thefield of epidemiology : the analysis of data to extract the patterns of causality of illness and diseasein populated areas, encompassing public health screening, clinical trials, the cause and spreadof infectious diseases, outbreak investigation and simulation, and so forth. Epidemiology’s successstories include, amongst others, the eradication of smallpox, the isolation of polio to localised areas,and a marked reduction in cases of malaria and cholera.
Of course the value of data is appreciated not only in the field of epidemiology, or the field ofgenetics, or the field of medicine, or of observational astronomy, or of experimental physics, or ofclimatology or oceanography or geology or ecology or sociology, or even of science or enterprise.Data take centre stage in many scientific, commercial and social aspects of life. Like the work of
1

Figure 1: Part of Snow’s map of cholera cases in Soho, 1854
Snow, common methodologies exist in all fields that craft data: data collection, curation, hypothesisgeneration, statistical testing, visualisation, etc. Unlike the work of Snow, computers are nowavailable to collect, manage and process data with levels of scale and efficiency that Snow couldscarcely have imagined.
But still it seems that as society’s capacity to capture more and more data about the worldaround us continues to grow, conventional computational techniques are not enough to make senseof the result.
Big Data
Big Data, at its core, is a cross-disciplinary idea: having more data than you can make sense out of.Big Data is a call for us computer scientists to once again provide even better methods to cruncheven more diverse, even more complex, even more dynamic, even more fine-grained, even largerdata.
It is also not difficult to see why so many computer scientists feel (quietly?) dismissive of the BigData buzz. In our field, core topics – like databases, logic, the Web, software engineering, machinelearning, etc. – are founded in technologies with a rich pedigree. By contrast, “Big Data” is prettyfluffy. However, it is difficult to remain entirely dismissive once one sees headlines such as the $200million investment by the US government into a series of national projects called the “Big DataInitiative”, or the £30 million investment – by the UK government and a private philanthropist –
2

into a “Big Data Institute” at Oxford to work on epidemiology and drug discovery; or similar suchnews stories.
So what is “Big Data”? The most canonical (but still quite fluffy) definition of Big Data isas referring to any data-intensive scenario where the volume, velocity and/or variety of the datamake it difficult to process using “conventional data management techniques”. These are known asthe three ‘v’s (in English at least) and most of the emphasis thus far has been on the challenges ofvolume and (to a lesser extent) velocity.
New Breeds of Database
The traditional answer to working with large amounts of structured data has always been simple: usea relational database. If the volume or velocity of your data precluded using a relational database,then you were either (i) a company like Facebook where your team of highly-paid engineers couldfigure out a custom solution, or (ii) out of luck. If you face a similar problem these days, then youhave what is called a “Big Data” problem.
The realisation that the relational database management system (RDBMS) is not – in the wordsof Stonebraker [10] – a “one size fits all” solution took many years, but the database landscape hasnow been demonopolised under the banner of “Big Data”. Figure 2 provides a broad perspective ofthis modern database landscape with a selection of the main systems in each family: systems withlarger font-sizes are considered more prominent in terms of adoption.1
NoSQL
AnalyticalHadoop
MapReduce
Key–Value Redis
MemcachedRiak
DynamoDB
EhCache SimpleDB
Document
MongoDBCouchDB
CouchBaseRavenDB
Graph
PregelGiraph
Neo4j TitanInfiniteGraph
Sparksee
InfoGridGraphBase
FlockDB
Column Family
CassandraBigTable Accumulo
HBaseHypertable
Relational
OracleMySQL
SQL Server
PostgreSQL
DB2MS Access
Sybase ASE
SQLLite
NewSQL
VoltDB
H–Store ClustrixDB
Spanner/F1
NuoDB
MemSQL
Splice
Translattice
Drizzle
Infobright
Vectorwise
HANA
Vertica
RDF
VirtuosoSesame
Jena
AllegroGraphOWLIM
RedlandStardog
4store Object
Versant
Db4oCache
ObjectStoreObjectivity/DB
ObjectDBPerst
XML
Sedna
TaminoBaseX
eXist-db
MarkLogic
Figure 2: Modern database system landscape
1Specifically, we rely heavily on http://db-engines.com/en/ranking to judge system popularity, which itselfaggregates mentions of systems in web-pages, Google searches, LinkedIn profiles, job postings, technical Q&A sites,Twitter, and so forth. In order of largest to smallest, the font sizes in the figure refer to positions 1, 2–20, 21–50,51–100, 101–150, 150+, resp. in the list.
3

In the top right-hand corner, we see familiar traditional relational database systems presentedwith large font-sizes. These are still the most prevalent technology, offering the security of transac-tional guarantees (ACID) and a powerful query language (SQL). However, these features come ata cost . . .
Taking a modern open-source in-memory database (Shore) and a standard benchmark (TPC-C), Harizopoulos [5] showed that while the off-the-shelf system could perform 640 transactions persecond, by turning off all features relating to transactions and persistence such as logging, latching,locking and buffer management, the same system could perform 12,700 transactions per second.The authors thus estimated that the database was only spending 6.8% of the time performing“useful work” [5]. Of course the latter system could no longer provide ACID guarantees, and themilage for other systems may vary, but in scenarios where such requirements can be relaxed, thecore message of this anecdotal experiment is that huge performance and scalability benefits can begained by minimising administrative work for transactions.
Following this reasoning, and the old idiom “necessity is the mother of invention”, a new wave ofNoSQL (Not Only SQL) databases emerged from the “Web 2.0” era where companies like Facebook,Google, Amazon, Twitter, etc., faced an unprecedented volume and velocity of user-contributeddata. Many of these NoSQL systems were inspired by white-papers emerging from companies likeGoogle and Amazon [1, 4] describing the (often lightweight) alternatives to relational databasesthat they had developed to meet these new challenges.
NoSQL: Not Only SQL
The aim of NoSQL stores is to enable high levels of horizontal scale (scaling out across multiplemachines) and high throughput by simplifying the database model, query language and safety guar-antees offered. By relaxing ACID and SQL requirements, and exploiting distribution, these systemsclaim to enable levels of scale and performance unattainable by traditional relational databases.
With respect to data models, as per Figure 2, four main categories of NoSQL system haveemerged:
Key–Value: stores based on a simple associative array/map. Such systems allow for lookupson a single key, returning a given value that may follow a custom structure. Values areoften subject to versioning rather than overwriting. Emphasis is placed on distribution andreplication, typically following consistent hashing schemes [6]. Many of the systems in thisfamily are inspired by the details of Amazon’s Dynamo system [4], which were published in2007.
Document: stores based on a key–value scheme, but where values refer to complex “documents”over which built-in functions can be executed. One of the main stores in this family isMongoDB, where values are akin to JSON documents.
Column-Family: stores that implement a loose form of the relational model over a key–valueabstraction, where keys are akin to primary keys and values are multi-dimensional and conformto a flexible tabular schema. Key–values with similar dimensions are organised into column-families, akin to relational tables. Versioning is typically applied on a “cell”-level. Likewisetables are typically sorted by key, allowing range-queries on index prefixes. Stores in thisfamily are typically inspired by the design of Google’s BigTable system [1], details of whichwere published in 2008.
4

Graph: stores that implement adjacencies into their indexes such that traversing from one datanode to another does not require another index lookup, but rather a pointer traversal.Regular-expression–like path languages allow for transitive navigation of data nodes. Oneof the most prominent systems in this family is Neo4J.
Each store typically supports a lightweight custom query language, which range from key/versionlookups for key–value stores, to keys with embedded JSON/XML expressions for document stores,to a very limited and thus efficient form of SQL for column-family stores, to languages with pathexpressions for graph stores. As a trade-off for losing SQL, developers must often implement featuressuch as joins, aggregates and transactions in the application code.
In terms of the guarantees a distributed database can offer, the CAP theorem states that asystem cannot guarantee consistency (global agreement on state/data), availability (every requestis serviced) and partition tolerance (functionality even if messages are lost) all at the same time.In a NoSQL setting, partition tolerance is a key objective since data may reside on hundreds orthousands of machines, increasing the likelihood of failures.
Thereafter, systems find different trade-offs between availability and consistency: a key notionis eventual consistency whereby machines can converge towards global agreement after a requesthas been acknowledged, translating into higher availability and reduced messages, but at the cost ofconsistency. Thus if you are Amazon, for example, under eventual consistency your users may seeone-day-old data about product ratings but your system will not reject new ratings due to messagefailures, and eventually all operational machines will see these new ratings. On the other end ofthe spectrum, consensus protocols – such as two-phase commits, three-phase commits or Lamport’sPAXOS algorithm [9] – incur high communication costs, less scalability of writes across machinesand may imply more frequent downtimes (lower availability) but can ensure stronger notions ofconsistency.
The result of these performance-enhancing trade-offs is the now widespread use of NoSQL storesin data-intensive scenarios, most prominently in Web companies such as Google, Facebook, Twitter,etc., but also in many other areas: for example, document-centric stores such as MongoDB andCouchDB have been deployed at CERN to manage the vast amount of aggregated data producedby the particle detectors in the Large Hadron Collider [7].
NewSQL: Not Only NoSQL
NoSQL stores have been the subject of considerable criticism in terms of being overused and over-hyped. Though these types of stores undoubtedly have valid use-cases, not everyone faces the samedata-intensive challenges as Facebook or CERN. Their naive use may imply an unnecessary riskof data loss or inconsistency. Weakened safety guarantees and lower-level query languages pushmore responsibility on the application developer to ensure that the database remains stable andthe performance of more complex queries acceptable. To quote a recent Google white-paper on the“Spanner” database:
We believe it is better to have application programmers deal with performance problemsdue to overuse of transactions as bottlenecks arise, rather than always coding aroundthe lack of transactions [2].
5

Although the features of traditional relational databases that NoSQL stores dispense with areexpensive, they are important for many (though perhaps not all) applications: they were originallyimplemented and added to databases for a good reason.
The NewSQL family of databases (depicted in Figure 2) has recently emerged to strike a compro-mise between the features of traditional relational databases and the performance of NoSQL stores.NewSQL systems aim to support SQL and uphold ACID but at greater levels of performance andscale than traditional databases (at least in fixed scenarios). The main approach to NewSQL isto design databases from scratch that exploit modern computer architectures, leveraging multiplecores, large main memory capacity, GPUs, or shared-nothing clusters. Likewise, many NewSQLstores opt for column-oriented indexing schemes that enable more efficient aggregation and filteringover the values of entire columns than traditional row-oriented stores.
However, databases are not designed for large-scale data analytics, but rather for executinglive queries. Likewise, many forms of off-line analytics do not require the expense of building andmaintaining persistent indexes.
Distributed Analytical Frameworks
In Figure 2, we include the Analytical category for distributed data-processing frameworks: thoughthey are not strictly speaking databases, they offer an alternative to databases for analytics.
Google first proposed the MapReduce framework in 2004 [3] as an abstraction for executingbatch-processing tasks over large-scale flat data (unindexed/raw files) in a distributed setting. Manydifferent types of distributed processing tasks (as run by Google, for example) require commonelements: partitioning the data over the machines, supporting fail-safes in case of machine failures,running the processing on each machine, merging the results from each machine into a final result,etc. Thus, the goal of MapReduce is to offer an interface that abstracts these common elementsand allows for higher-level development of distributed processing code.
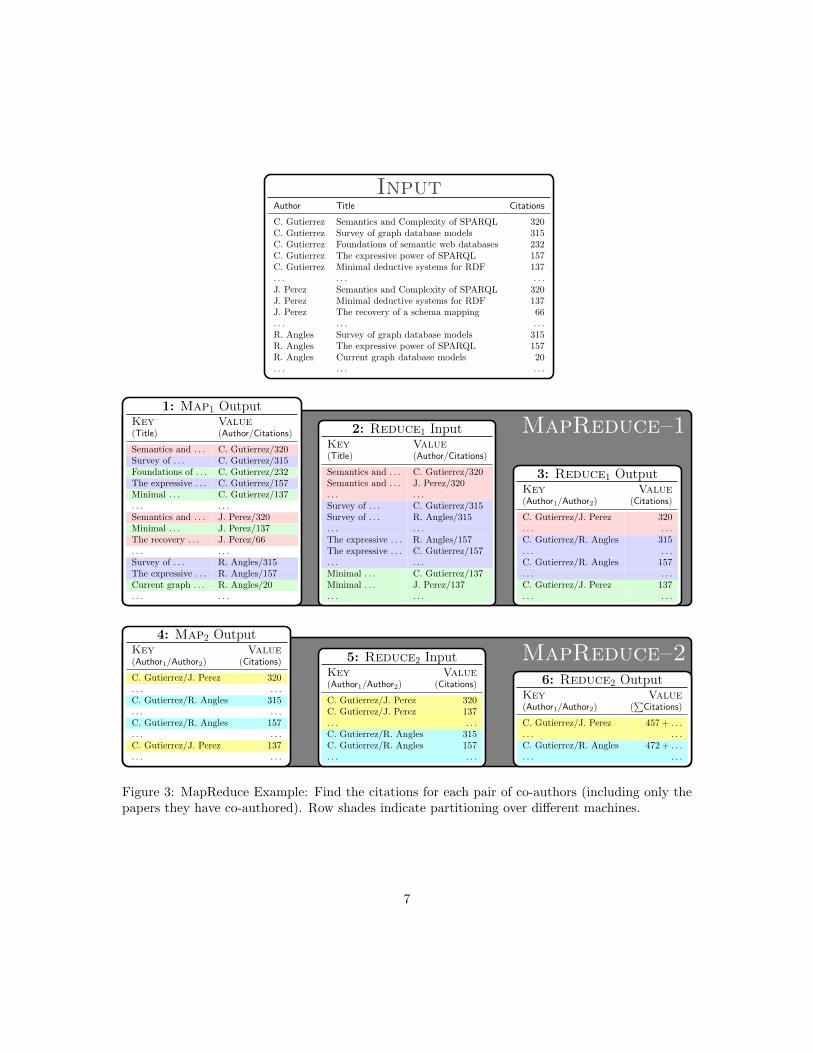
Since MapReduce is considered one of the core Big Data technologies, we’ll take a moment toget the gist of how it operates with the example illustrated in Figure 3. The input data are sortedby author, and include papers and citations (note the repetition of paper titles and citations foreach author). We can consider this table to be a flat file (e.g., a CSV or TSV file) and to be verylarge: “frillions” of rows. Now we’d like to see who are the most productive pairs of co-authors inour table: we want to see how many citations pairs of co-authors have counting only those papersthey have co-authored together. And we have lots of machines to do this with.
MapReduce performs aggregation/joins in batch by sorting data. Taking a trivial example, sincethe raw input data are sorted by author name, we can easily get the total citation count for eachauthor, having to store in memory only the current author and their running count, outputting thispair when the author changes. If we consider a distributed setting, aside from the sorting, we haveto ensure that all papers for an author end up on one machine.
Returning to our original non-trivial task of finding productive co-author pairs, MapReduceconsists of two main phases: Map and Reduce. we first need to figure out pairs of co-authors. Todo this, we need to do a distributed join on paper title/citations.
Map1: For each tuple Ai = (Authori,Titlei,Citationi) from the input data, create key–value pairsof the following form: (Titlei, <Authori,Citationsi>), where the key is Titlei and the value is<Authori,Citationsi>.
6
InputAuthor Title Citations
C. Gutierrez Semantics and Complexity of SPARQL 320C. Gutierrez Survey of graph database models 315C. Gutierrez Foundations of semantic web databases 232C. Gutierrez The expressive power of SPARQL 157C. Gutierrez Minimal deductive systems for RDF 137. . . . . . . . .J. Perez Semantics and Complexity of SPARQL 320J. Perez Minimal deductive systems for RDF 137J. Perez The recovery of a schema mapping 66. . . . . . . . .R. Angles Survey of graph database models 315R. Angles The expressive power of SPARQL 157R. Angles Current graph database models 20. . . . . . . . .
MapReduce–11: Map1 Output
Key Value(Title) (Author/Citations)
Semantics and . . . C. Gutierrez/320Survey of . . . C. Gutierrez/315Foundations of . . . C. Gutierrez/232The expressive . . . C. Gutierrez/157Minimal . . . C. Gutierrez/137. . . . . .Semantics and . . . J. Perez/320Minimal . . . J. Perez/137The recovery . . . J. Perez/66. . . . . .Survey of . . . R. Angles/315The expressive . . . R. Angles/157Current graph . . . R. Angles/20. . . . . .
2: Reduce1 InputKey Value(Title) (Author/Citations)
Semantics and . . . C. Gutierrez/320Semantics and . . . J. Perez/320. . . . . .Survey of . . . C. Gutierrez/315Survey of . . . R. Angles/315. . . . . .The expressive . . . R. Angles/157The expressive . . . C. Gutierrez/157. . . . . .Minimal . . . C. Gutierrez/137Minimal . . . J. Perez/137. . . . . .
3: Reduce1 OutputKey Value(Author1/Author2) (Citations)
C. Gutierrez/J. Perez 320. . . . . .C. Gutierrez/R. Angles 315. . . . . .C. Gutierrez/R. Angles 157. . . . . .C. Gutierrez/J. Perez 137. . . . . .
MapReduce–24: Map2 Output
Key Value(Author1/Author2) (Citations)
C. Gutierrez/J. Perez 320. . . . . .C. Gutierrez/R. Angles 315. . . . . .C. Gutierrez/R. Angles 157. . . . . .C. Gutierrez/J. Perez 137. . . . . .
5: Reduce2 InputKey Value(Author1/Author2) (Citations)
C. Gutierrez/J. Perez 320C. Gutierrez/J. Perez 137. . . . . .C. Gutierrez/R. Angles 315C. Gutierrez/R. Angles 157. . . . . .
6: Reduce2 OutputKey Value(Author1/Author2) (
∑Citations)
C. Gutierrez/J. Perez 457 + . . .. . . . . .C. Gutierrez/R. Angles 472 + . . .. . . . . .
Figure 3: MapReduce Example: Find the citations for each pair of co-authors (including only thepapers they have co-authored). Row shades indicate partitioning over different machines.
7

MapReduce will assign key–value pairs with the same key to the same machine (e.g., using ahash function on the key). That machine will sort the pairs assigned to it by the Map according totheir key. Partitioning and sorting are usually taken care of by the framework, meaning that thedeveloper need not worry about what data goes to which physical machine. However, the defaultpartitioning methods and sorting orders can be overriden if necessary.
Now each machine has its own bag of key–value pairs sorted by Title, with all authors for eachpaper locally available. The next phase is the reduce phase:
Reduce1: In preparation for the reduce, the sort phase will group the key–value pairs (emit-ted from Map1) by title: (Titlei, {<Authori,1,Citationsi>), . . . , <Authori,n,Citationsi>}). Foreach such group, Reduce will output a set of tuples representing each unique pair of co-authors: {(<Authori,j ,Authori,k>,Citationsi) | 1 ≤ j < k ≤ n}.2
The result of the reduce phase is a bag of unique pairs of co-authors and their citations for eachpaper (we no longer need the name of the paper). Our final task is to add up the total citationsper co-author pair. In the previous stage, the data were sorted/joined on the paper title, so nowwe need to perform another Map/Reduce phase.
Map2: For each tuple (<Authorx,Authory>,Citationsz) from the intermediate data, map the samekey–value pair.
This map does not transform the values, but merely ensures that the same co-author pairs endup sorted on the same machine for the final reduce phase.
Reduce2: With groups (<Authorx,Authory>, {Citations1, . . . ,Citationsn}), sum the citations ineach bag and produce a single output pair: (<Authorx,Authory>,
∑nz=1 Citationsz).
We now have our final result. If we wanted to extract top-k results, we could pass MapReducea descending sort order and map total citations as key.
In terms of coding effort, the developer must implement the map phases and the reduce phases.The MapReduce framework itself will take care of load-balancing, fault tolerance, and so forth.With a cluster of machines running the MapReduce framework, tasks can be run by multiple usersin parallel where the framework will aim to make the best of the resources available. LikewiseMapReduce jobs are portable: jobs can be run on any cluster of machines so long as the frameworkis installed (and the data available).
MapReduce enables scale but, of course, it does not ensure scale: intractable tasks will stillbe intractable on multiple machines. In our example, Reduce1 produces a quadratic number of
co-author pairs per paper (n(n−1)2 ), but since author-lists are generally short, we can expect the
Reduce1 to perform near-linearly. With the assumption that tasks can be decomposed into suchMap/Reduce phases, and that these phases are not computationally expensive or increase datavolumes too much, the framework offers a convenient and powerful abstraction for those wishing towork with Big Data.
Unfortunately, the MapReduce system itself is proprietary and kept closed by Google. How-ever, the Apache Hadoop open source project offers a mature implementation of the MapReduceframework and is in widespread use.
2We assume Authorx < Authory if and only if x < y, etc., to ensure consistent pairs across papers.
8

In Figure 2, one may note two other systems in the intersection of Graph and Analytical: Pregeland Giraph. These are both MapReduce style frameworks designed specifically for processinggraphs. Pregel was first introduced by Google in 2009 [8] for distributed computation on very largegraphs, where Apache Giraph is an open source implementation of the same ideas (built on topof Hadoop). In brief, the core computational model of Pregel/Giraph is a message passing systembetween vertices in a graph. Computation is organised into iterations. A vertex may read messagessent to it in the previous iteration, may change its (possibly continuous) state, and may forwardmessages to other vertices for the next iteration. Messages can be forwarded to any vertex witha locally known id, but typically these are the linked vertices. These computational frameworksoffer an intuitive abstraction for applying graph-based analytics – for running tasks such as shortestpath, computing connected components, clustering, centrality measures such as PageRank, etc. –while transparently distributing the computation: handling load balancing, efficient batching ofmessages and fault tolerance.
Other models: Object, XML, RDF
With respect to Figure 2, we are thus left with three (relatively traditional) database families inthe top left corner: Object, XML and RDF.
Object databases allow for storing data in the form of objects as familiar from object-orientedsoftware. The primary motivation for such databases is to offer the option of persistence for soft-ware objects in a native format. Typically object databases tailor towards a fixed set of objectoriented programming languages, offering the possibility for tight integration between the execu-tion environment and the database. Object databases typically support a query language to searchfor objects with certain fields or member values; likewise pointers are used between objects to avoidthe need for joins. Systems may support various other features, including versioning, constraints,triggers, etc.
XML databases refer specifically to native XML databases, where data are stored in an XML-likedata structure. Given the relative popularity of XML as a model for data exchange and its useon the Web (e.g., XHTML, RSS and ATOM feeds, SOAP messages, etc.), XML databases storesuch data in a native format that enables them to be queried directly through languages such asXQuery, XPath or XSLT.
RDF databases focus on providing query functionality over data represented in the core SemanticWeb data model. Such stores typically implement optimised storage schemes designed for RDF andoffer query functionality using the W3C-recommended SPARQL query language. Furthermore,engines may implement features related to reasoning, typically with respect to the RDFS and/orOWL standards.
Though these three families of databases have received significant attention in the researchliterature over the past decade(s), as can be seen from Figure 2, they largely remain a nichetechnology when considered as part of the broader database landscape.
Variety?
We have talked a lot about volume – e.g., scaling out across multiple machines – and velocity – e.g.,increases write throughput by relaxing consistency guarantees. However, we have not spoken muchabout the third challenge of Big Data: “variety”. Whereas the problems of volume and velocity tie
9

in with performance and can be approached from an engineering perspective by composing exist-ing techniques – such as sharding, replication, distributed sorts, consistent hashing, compression,batching, bloom filters, Merkle trees, column-oriented indexing, etc. – in the design of a maturesystem, the problem of variety raises questions of a more conceptual nature.
Arguably, the NoSQL family of databases offers some advantages with respect to traditionalrelational databases when it comes to processing diverse datasets: by relaxing the relational model,data can be stored in a “quick and dirty” non-normalised form. Although this may save time withrespect to schema management, and is more flexible for loading incomplete or otherwise jaggeddata, employing simpler data models once again pushes a further burden onto the application layer,where developers must ensure that data remain consistent and that indexes are present to efficientlycover the expected workload of queries.
Likewise variety is partially supported by the range of database types available today. Forexample, one may use an XML database to store XML data, use a relational database to storerelational data, use a graph database for graph-structured data, and so forth. Multiple databasescan thus be composed to tackle the variety problem; however, again the burden is put on theapplication developers to connect the databases and to ensure that data remains consistent acrossthe various systems.
In general, the problem of variety goes much deeper than the shape or the incompleteness ofthe data. Variety is also far from being a new problem: various sub-areas of Computer Sciencehave come across the hurdle of “data integration”, be it combining multiple databases into one,or combining documents from millions of Web sources, or combining source-code repositories fromvarious projects, or . . .
Data Are Evolving
It seems that the only practical approach to solving the variety bottleneck in Big Data is to rethinkwhat we mean by “data”. From Snow’s days of paper and ink, data have evolved through Morsecode, punch cards, binary formats, ASCII, markup, and so forth. The evolution of data has alwaysbeen towards improved machine readability. Much like it would be considered unfeasible to doa count of the occurrences of the word “broccoli” in all books currently shelved in a well-stockedlibrary (and trivial to do so for an electronic text file), there are many data-intensive tasks consideredunfeasible by today’s standard simply because our notion of data does not enable them.
Currently, we have a plethora of data models and data syntaxes available that allow informationto be structured and parsed. However, for the most part, machines still need data-specific code tointerpret said data. For example, browsers are built specifically to interpret HTML-related data.
In terms of the evolution of data, it seems that the only natural way forward is to make explicitthe semantics of the data being understood, such that machines can, with increasing depth, processthe meaning of data. Machines still cannot learn from natural language and still cannot adapt wellto new problems; hence semantics need to be made explicit as part of the data to help overcometrue variety in structured data: i.e., the ability to incorporate unforeseen datasets.
In terms of making semantics explicit, it can start by simply using global identifiers for itemsdescribed in the data such that a machine can know, for example, that the “Boston” described inone dataset is the same “Boston” as described in another dataset (e.g., using URIs as identifiers);now the machine can run joins over the two datasets. Even better if the machine can know thatthe “Boston” in question is the music band, not the U.S. city (e.g., using a classification system);now the machine can return results about “Boston” for queries about music bands. Even better
10

still if the machine can know that music bands have members, and typically release albums and . . .(e.g., through a domain ontology).
Big Semantic Data?
Many of these principles have been well-explored by the Semantic Web community; in this author’sbiased opinion, techniques from the Semantic Web could yet have a large role to play in the areaof Big Data, particularly towards tackling diversity. The Semantic Web has long been frownedupon by many as a fruitless academic exercise, doomed to failure due to any number of concerns.And there are grains of truth in these concerns. Many of the techniques proposed in the area ofontologies and deductive reasoning methods are not well suited for scenarios involving lots of data,and certainly not for scenarios involving lots of messy (Web) data. However, the challenges are notinsurmountable: a little semantics can go a long way.
Recently companies such as Google, Facebook, Yahoo!, Microsoft, etc., are starting to use partsof Semantic Web technologies to power new applications. For example, in June 2011, Bing, Google,and Yahoo! announced the schema.org ontology for webmasters to make structured data availableon their site. Google has used semantic knowledge-bases in the construction of their Knowledge-Graph application. Facebook’s Open Graph protocol – trying to create a decentralised connectednetwork of data – uses RDFa: a Semantic Web standard. More recently, Google announced supportfor semantic markup in GMail using the JSON-LD syntax. In such case, these major companieshave turned to Semantic Web techniques to build applications over huge sets of diverse sourcescoming from millions of arbitrary providers. And this trend of using semantics to tackle diversitylooks set to continue.
Conclusion
Big Data is a call for Computer Scientists to investigate methods to handle data with more volume,more velocity and more variety. Though relational databases have served as a reliable work-horse formany years, people are beginning to realise that new alternatives are needed to face the upcomingchallenges posed by the emerging flood of data.
The main Big Data technologies that have emerged thus far primarily focus on the challengesof data volume and velocity. NoSQL stores boast new levels of scale by distributing data manage-ment over multiple machines, by relaxing traditional ACID guarantees, and by supporting querylanguages more lightweight than SQL. NewSQL aim to seek a balance by supporting ACID/SQLas per traditional relational databases while trying to compete with the performance and scale ofNoSQL systems. Likewise, distributed processing frameworks such as MapReduce offer a convenientabstraction for clients wishing to perform large-scale analytical tasks.
However, variety remains an open problem. In particular, the goal of being able to buildapplications that can robustly discover and incorporate new sources of data remains elusive. Toovercome this hurdle, we may need to rethink our conceptualisation of data. Versus the days ofJohn Snow, nowadays we appreciate the convenience of working with data serialised in an electronicformat that can be parsed by a machine. Likewise, having data with explicit semantics may becomethe norm in the decades to come.
11

References
[1] F. Chang, J. Dean, S. Ghemawat, W. C. Hsieh, D. A. Wallach, M. Burrows, T. Chandra,A. Fikes, and R. E. Gruber. Bigtable: A Distributed Storage System for Structured Data.ACM Trans. Comput. Syst., 26(2), 2008.
[2] J. C. Corbett, J. Dean, M. Epstein, A. Fikes, C. Frost, J. J. Furman, S. Ghemawat, A. Gubarev,C. Heiser, P. Hochschild, W. C. Hsieh, S. Kanthak, E. Kogan, H. Li, A. Lloyd, S. Melnik,D. Mwaura, D. Nagle, S. Quinlan, R. Rao, L. Rolig, Y. Saito, M. Szymaniak, C. Taylor,R. Wang, and D. Woodford. Spanner: Google’s Globally-Distributed Database. In OSDI,pages 261–264, 2012.
[3] J. Dean and S. Ghemawat. MapReduce: Simplified Data Processing on Large Clusters. InOSDI, pages 137–150, 2004.
[4] G. DeCandia, D. Hastorun, M. Jampani, G. Kakulapati, A. Lakshman, A. Pilchin, S. Sivasub-ramanian, P. Vosshall, and W. Vogels. Dynamo: Amazon’s highly available key–value store.In SOSP, pages 205–220, 2007.
[5] S. Harizopoulos, D. J. Abadi, S. Madden, and M. Stonebraker. OLTP through the lookingglass, and what we found there. In SIGMOD Conference, pages 981–992, 2008.
[6] D. R. Karger, E. Lehman, F. T. Leighton, R. Panigrahy, M. S. Levine, and D. Lewin. ConsistentHashing and Random Trees: Distributed Caching Protocols for Relieving Hot Spots on theWorld Wide Web. In STOC, pages 654–663, 1997.
[7] V. Kuznetsov, D. Evans, and S. Metson. The CMS data aggregation system. In ICCS, num-ber 1, pages 1535–1543, 2010.
[8] G. Malewicz, M. H. Austern, A. J. C. Bik, J. C. Dehnert, I. Horn, N. Leiser, and G. Czajkowski.Pregel: a system for large-scale graph processing. In SIGMOD Conference, pages 135–146,2010.
[9] M. C. Pease, R. E. Shostak, and L. Lamport. Reaching agreement in the presence of faults. J.ACM, 27(2):228–234, 1980.
[10] M. Stonebraker. One size fits all: an idea whose time has come and gone. Commun. ACM,51(12):76, 2008.
12