Big, Beautiful Sky
56
Produced by and for Hot Science - Cool Talks by the Environmental Science Institute. We request that the use of these materials include an acknowledgement of the presenter and Hot Science - Cool Talks by the Environmental Science Institute at UT Austin. We hope you find these materials educational and enjoyable. Dr. David Allen September 5, 2003 Big, Beautiful Sky: The State and Future of Texas’ Air # 25
Transcript of Big, Beautiful Sky

Produced by and for Hot Science - Cool Talks by the Environmental Science Institute. We request that
the use of these materials include an acknowledgement of the presenter and Hot Science - Cool Talks
by the Environmental Science Institute at UT Austin. We hope you find these materials educational
and enjoyable.
Dr. David Allen
September 5, 2003
Big, Beautiful Sky:
The State and Future of Texas’ Air
# 25
Preserving air quality in Texas
Professor David AllenDepartment of Chemical Engineering
Center for Energy and Environmental Resources
University of Texas
Big, Beautiful
Sky?

Every breath you take…
The Houston region has one of the highest national ozone levels. Asthma prevalence in inner-city Houston school children approaches twice the national average.
Fourteen Americans die every day from asthma, a rate three times greater than just 20 years ago. 673,076 adults and 401, 289 children suffer from asthma in Texas.
Ozone can cause coughing, throat irritation, reduced lung function, and pain when taking a deep breath.

Breath of Life?
Scientists have estimated that the number of deaths in the United States associated with air pollution range from 50,000 to 100,000 per year.
While particulate matter is the form of air pollution most prominently linked to premature death, there is increasing evidence that ozone plays a role.

Outline What are the components of air pollution and how is
Texas doing?
What is photochemical smog and how is it formed?
A tale of two cities: Austin
How do we understand air pollution and who sets air quality standards?
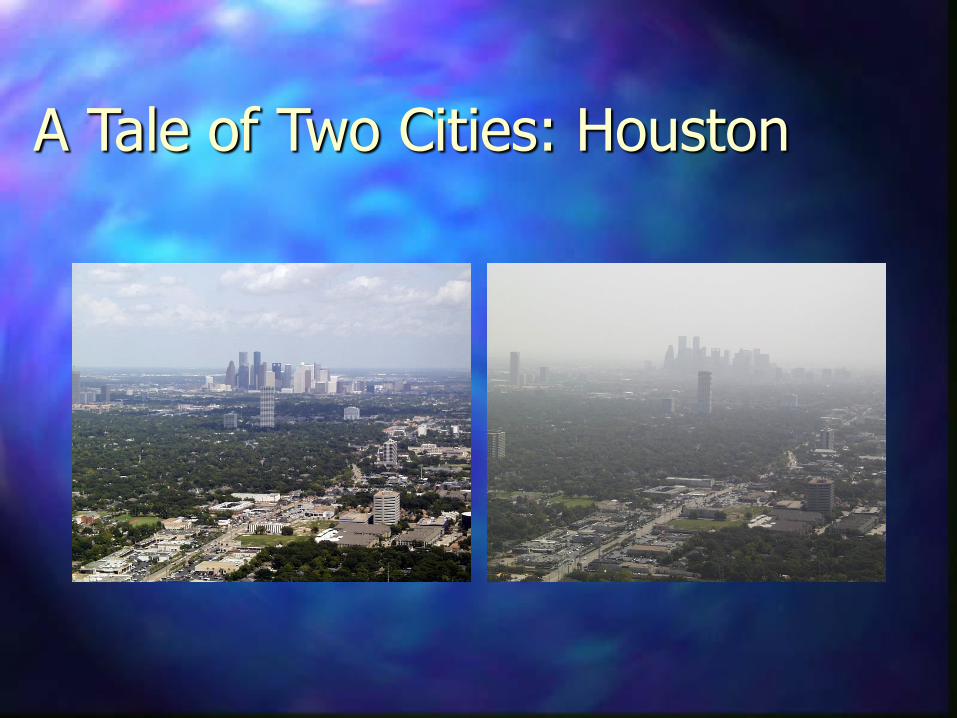
A tale of tow cities: Houston
What are scientists and officials doing so we can breath easier?
What can all of us do?

Air Quality in Texas cities
Houston, Dallas/Fort Worth and El Paso violate the current ozone standard and Austin, San Antonio and Longview would violate the new ozone standard.
El Paso violates the current particulate matter standard. Houston and possibly DFW would likely violate the new particulate matter standard.

Air pollutants of concern in TexasPM10 and PM2.5 - Fine particulate matter suspended in
the atmosphere degrades visibility and has been
associated with increased rates of mortality
O3 - Ozone at ground level is an irritant, and is
associated with increased incidence of respiratory
disease and decreased respiratory function
Hazardous air pollutants – A variety of health impacts
associated with exposure to HAPs

Air pollutant formation
• OZONE = Reactive Organic Compounds *
Oxides of Nitrogen * Sunlight *
Stagnant Air
• PARTICULATE = Sulfur Oxides, Reactive Organic MATTER Compounds, Oxides of Nitrogen, Ammonia, Direct emissions +
Sunlight + Stagnant Air
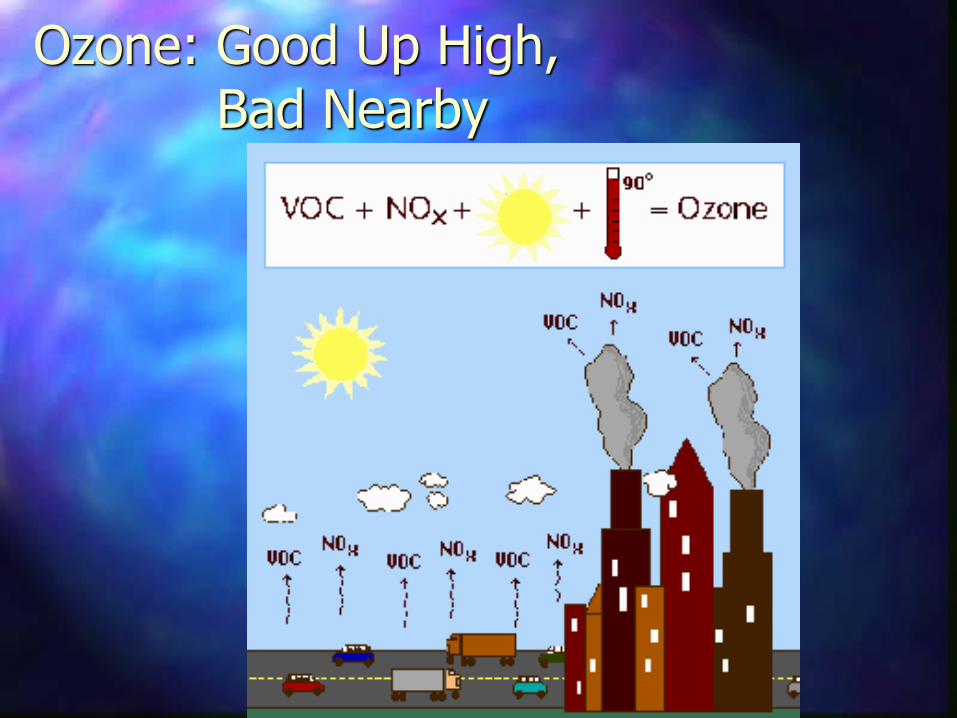
Ozone: Good Up High, Bad Nearby

Understanding atmospheric chemistry is crucial to understanding
air pollution Ozone is formed in the atmosphere by the
reactions of volatile organic compounds (VOCs) and oxides of nitrogen (NOx) –Relative effectiveness of VOC and NOx emission reductions varies between cities
Particulate matter is emitted directly and is formed in the atmosphere by the reactions of VOCs, NOx, SOx, and ammonia Relative effectiveness of emission reductions varies between cities
A Tale of Two Cities: Austin
Austin: Moderate ozone and fine particulate matter concentrations; air quality dependent on both local and regional sources
Houston: Sees some of the highest ozone concentrations in the United States but relatively moderate particulate matter concentrations; dominated by a mix of local emissions, industrial and urban

Austin’s status
All monitors meet the current National Ambient Air Quality Standards – no local regulations in place –only national initiatives (for example, cleaner cars)
The region would be in non-attainment for the new, more stringent NAAQS, due to be implemented in 2004
An Early Action Compact has been initiated

What do we need to know to improve air quality?
Emission inventory development
Air quality modeling
Air quality monitoring

How do we improve air quality?
National Ambient air Quality Standards (NAAQS) set the threshold for action for many air pollutants
States prepare plans (State Implementation Plans or SIPs) for individual cities

Who sets air quality standards?

Emission inventories
On-road and
non-road
mobile sources
Point
sources
Area
sources
Biogenic emissions
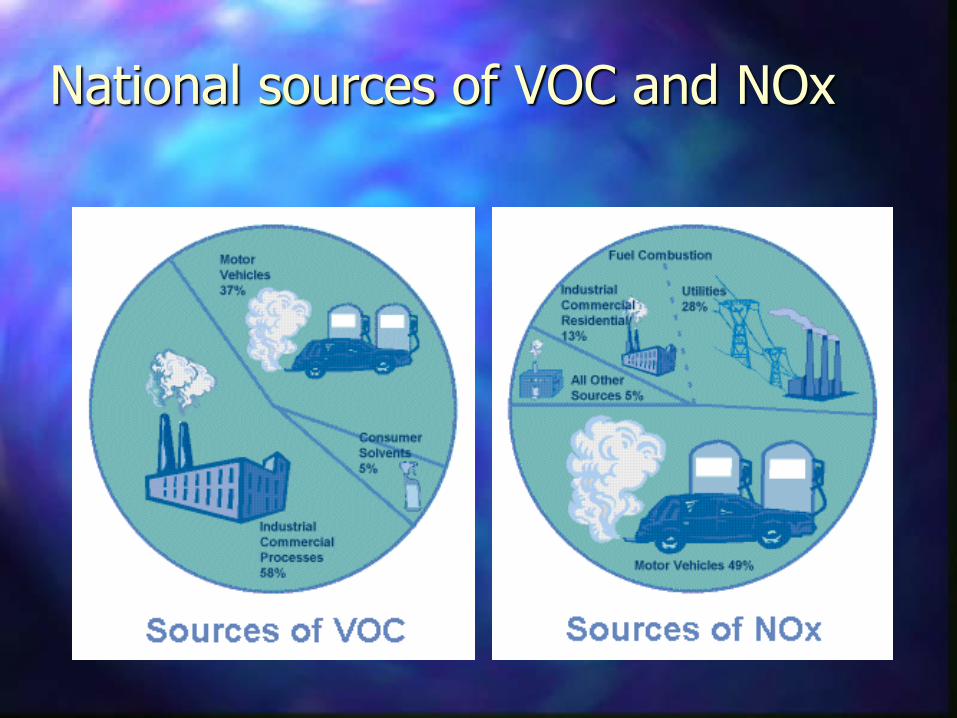
National sources of VOC and NOx
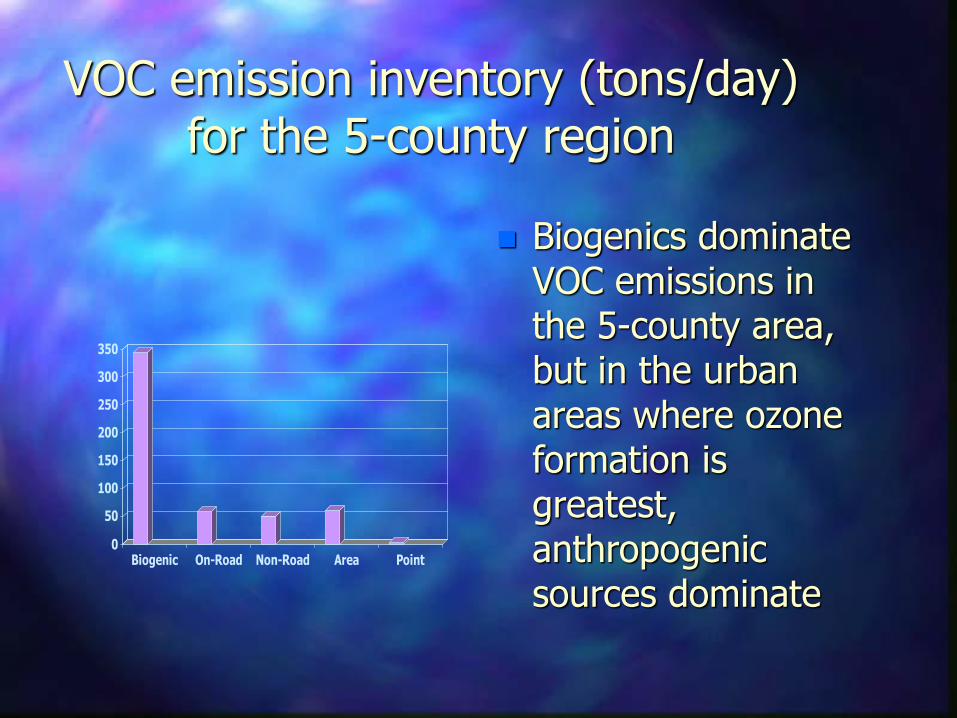
VOC emission inventory (tons/day)for the 5-county region
Biogenics dominate VOC emissions in the 5-county area, but in the urban areas where ozone formation is greatest, anthropogenic sources dominate
0
50
100
150
200
250
300
350
Biogenic On-Road Non-Road Area Point

Anthropogenic VOC emissions (tons/day) for the 5-county region
Travis County dominates anthropogenic VOC emissions, and these emissions are equally divided among on-road, non-road and area sources
020406080100120140
Bastrop
Caldwell
Hays
Travis
Williamson
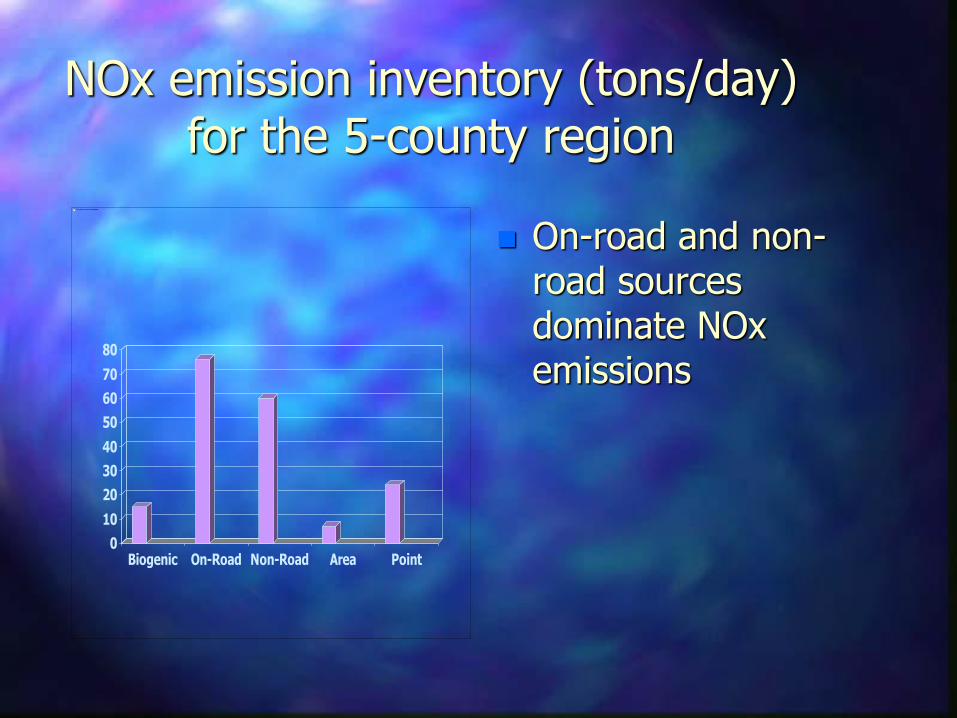
NOx emission inventory (tons/day)for the 5-county region
On-road and non-road sources dominate NOx emissions
0
10
20
30
40
50
60
70
80
Biogenic On-Road Non-Road Area Point
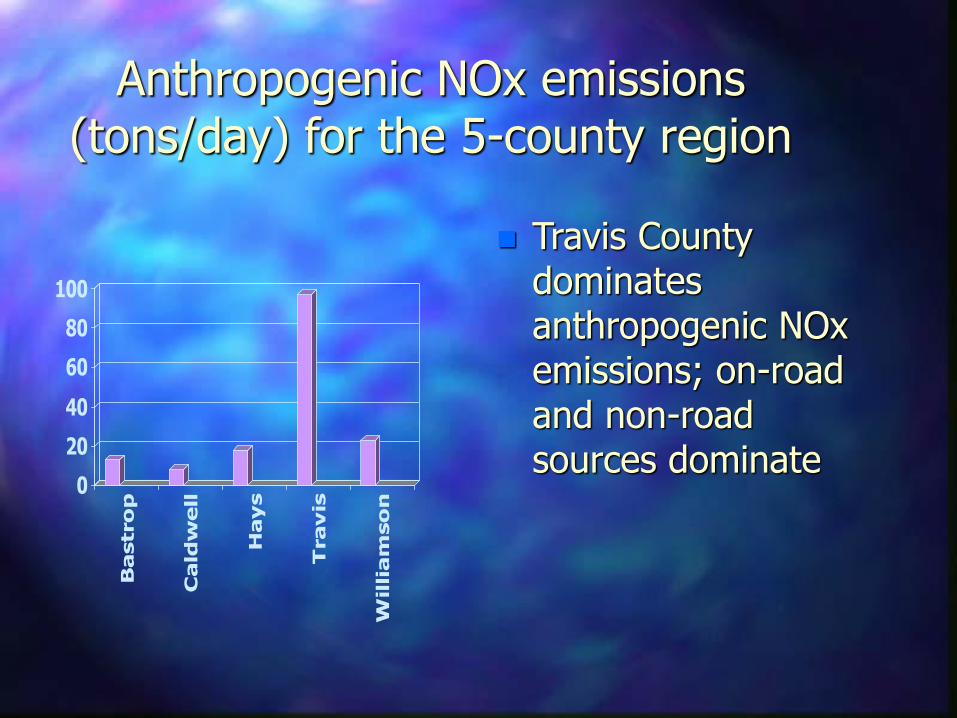
Anthropogenic NOx emissions (tons/day) for the 5-county region
Travis County dominates anthropogenic NOx emissions; on-road and non-road sources dominate
0
20
40
60
80
100
Bastrop
Caldwell
Hays
Travis
Williamson

Along with inventories we need to develop air quality models.
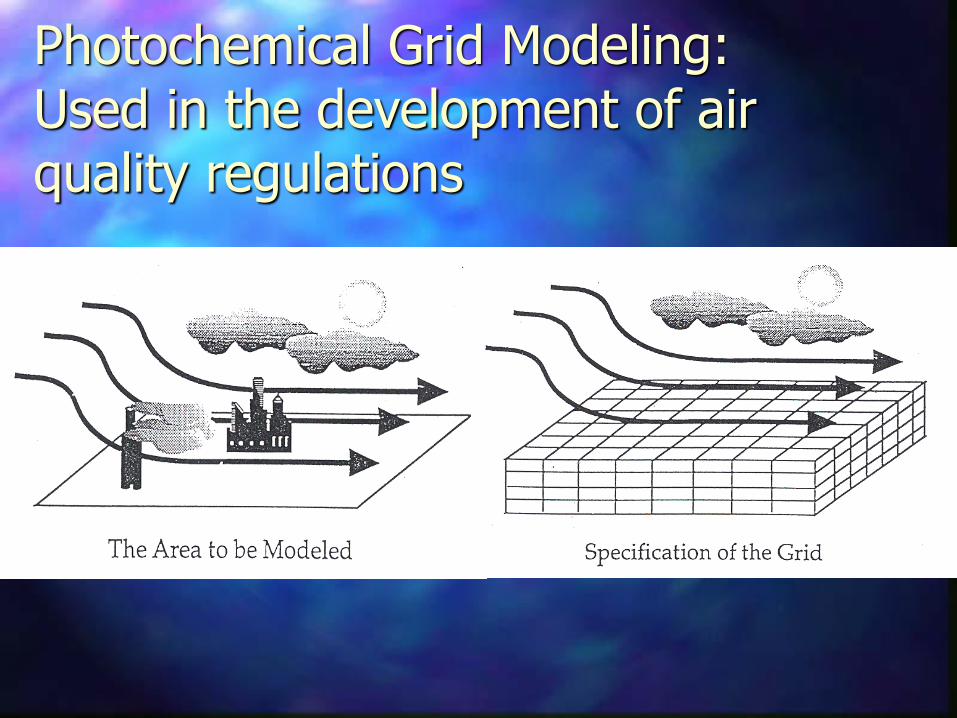
Photochemical Grid Modeling: Used in the development of air quality regulations
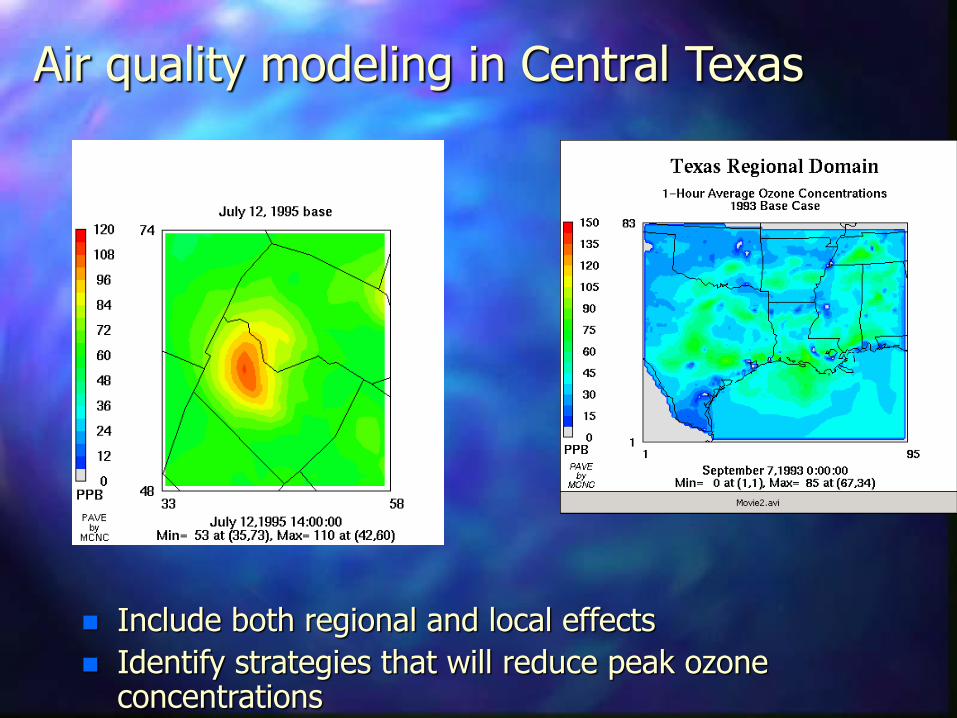
Air quality modeling in Central Texas
Include both regional and local effects
Identify strategies that will reduce peak ozone concentrations
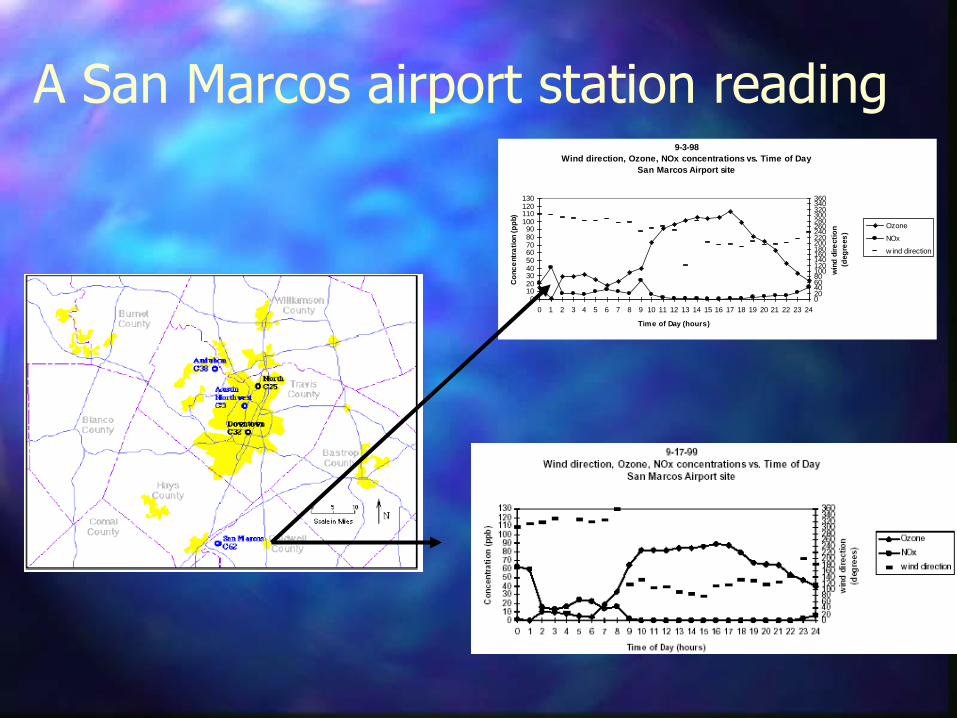
A San Marcos airport station reading9-3-98
Wind direction, Ozone, NOx concentrations vs. Time of Day
San Marcos Airport site
0102030405060708090
100110120130
0 1 2 3 4 5 6 7 8 9 10 11 12 13 14 15 16 17 18 19 20 21 22 23 24
Time of Day (hours)
Co
nc
entr
ati
on
(p
pb)
020406080100120140160180200220240260280300320340360
win
d d
ire
cti
on
(deg
rees
)
Ozone
NOx
w ind direction

What emission sources contribute to ozone formation?
Evolution of ozone concentrations at a monitor in Austin, over the course of a day, with sources attributed
Ozone Contribution by Type at an Austin Urban Location
0
20
40
60
80
100
120
9am 10am 11am 12pm 1pm 2pm 3pm 4pm 5pm 6pm 7pm 8pm 9pm
Time of Day (7-12-95)
Ozo
ne
(p
pb
) VOC-limited
NOx-limited
Other
IC
BC
O3 concentration by type at an
Austin Urban Location

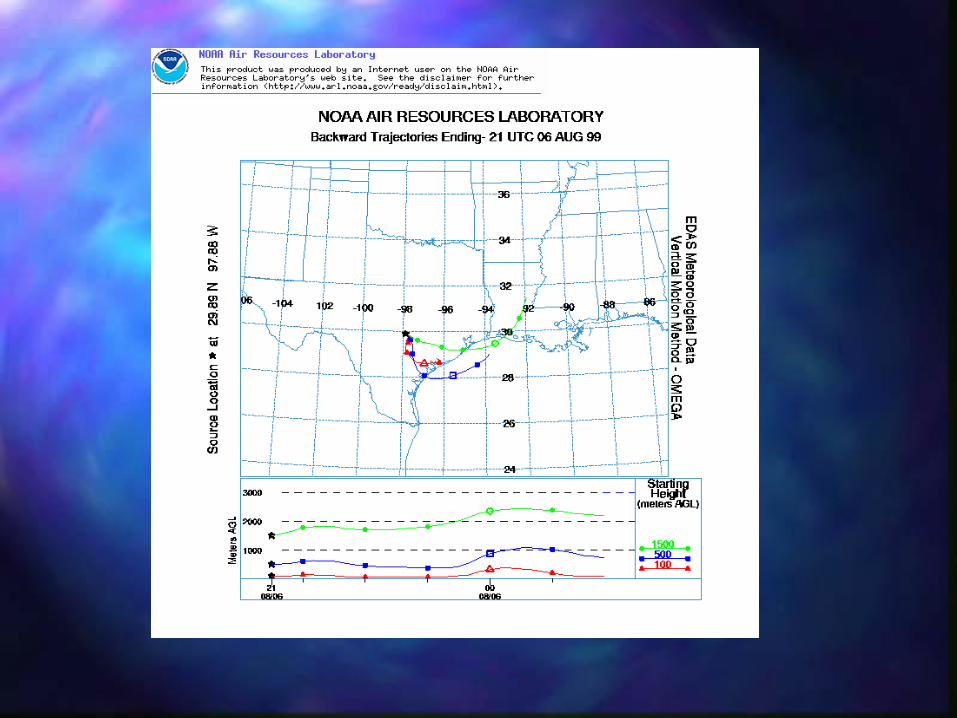
Sample back trajectories for high ozone episodes in Austin…..
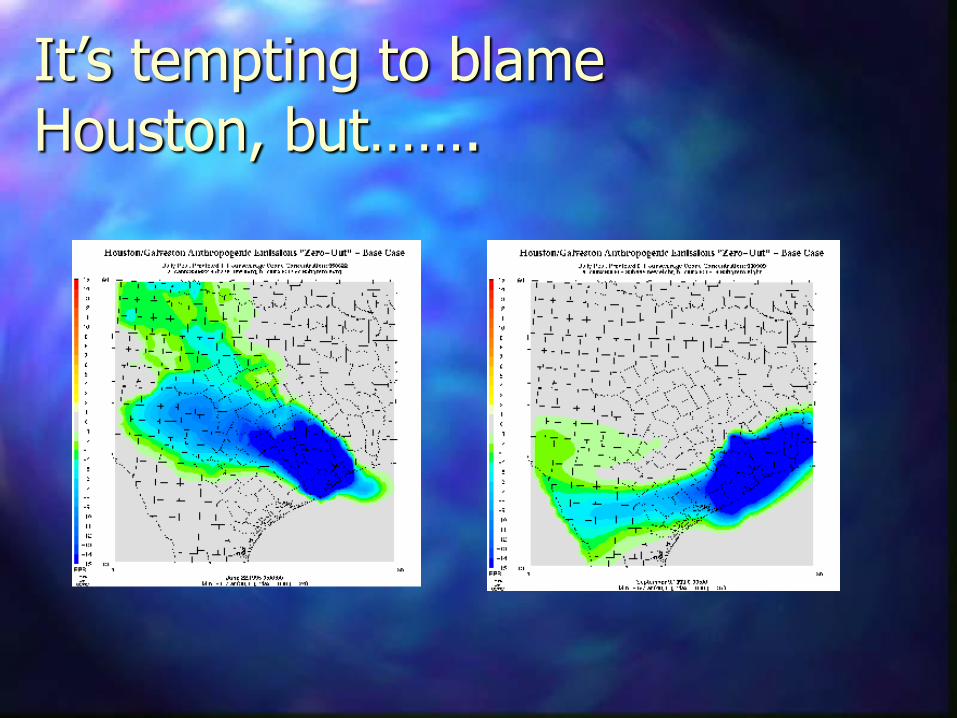
It’s tempting to blame Houston, but…….

Every city in eastern Texas has an impact on at least one other city

32-Hour back trajectories for days with peak
8-hour ozone levels over 75 ppb. 1993-1999

So we understand the problem. What do we do?
Main local source is due to vehicles and for on-road vehicles 10% of the vehicles give 50% of the emissions
Regional benefits of emission reductions in other Texas cities
What are the benefits?
0
10
20
30
40
50
60
70
80
Biogenic On-Road Non-Road Area Point
8-hour average data
0
1000
2000
3000
4000
5000
6000
7000
8000
9000
0 10 20 30 40 50 60 70 80
% anthropogenic NOx reduction
Are
a *
exc
ee
da
nce
(km
2*p
pb
)
A Tale of Two Cities: Houston

•The Houston-Galveston area is a severe ozone non-
attainment area
•The current State Implementation Plan (SIP) calls for
significant NOx emission reductions (approximately 70%
of the projected 2007 inventory; 90+% for point sources)
•SIP also calls for VOC emission reductions
(approximately 25% of the projected 2007 inventory)
•Costs and benefits of controls have been estimated to be
~5 billion/yr

Ozone formation in Houston is qualitatively different than in most other urban areas

Ozone formation in Houston is formed rapidly and efficiently

Rapid ozone formation can be localized, and narrow plumes/high ozone air parcels can persist for long distances.

What causes these events?
Localized, high hydrocarbon concentrations
0
5
10
15
20
25
30
35
40
Top 10%MeanBottom 10%
AnthropogenicBiogenicCOMethane
OH
Rea
ctivity (
s-1
)

Where do we find rapid ozone
formation/high hydrocarbon concentrations?
29
29.2
29.4
29.6
29.8
30
30.2
30.4
-95.6 -95.4 -95.2 -95 -94.8 -94.6
Ozone FormationRate, ppb/h
P(O3) > 50 ppb/h
20 - 5010 - 20<10
Latitu
de
Longitude

What are these
hydrocarbons?
•low molecular weight
alkenes (propene, ethene
and butenes) are a major
source of hydrocarbon
reactivity for ozone
formation.
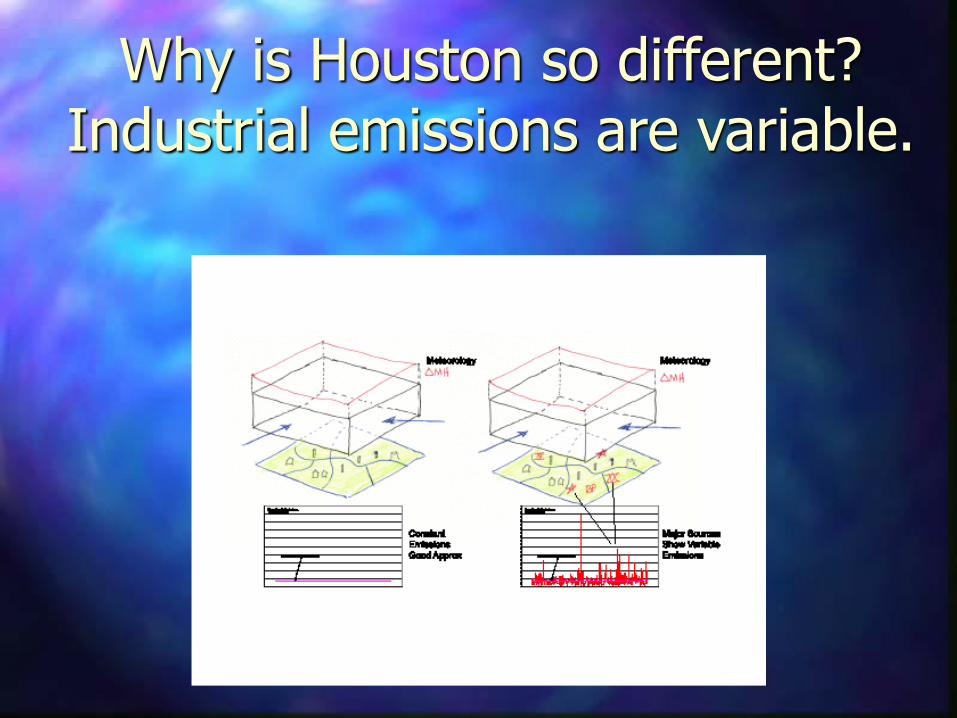
Why is Houston so different?Industrial emissions are variable.

Texas Air Quality Study -2000(TEXAQS - 2000)
Provide scientific basis for air quality management strategies in southeast Texas
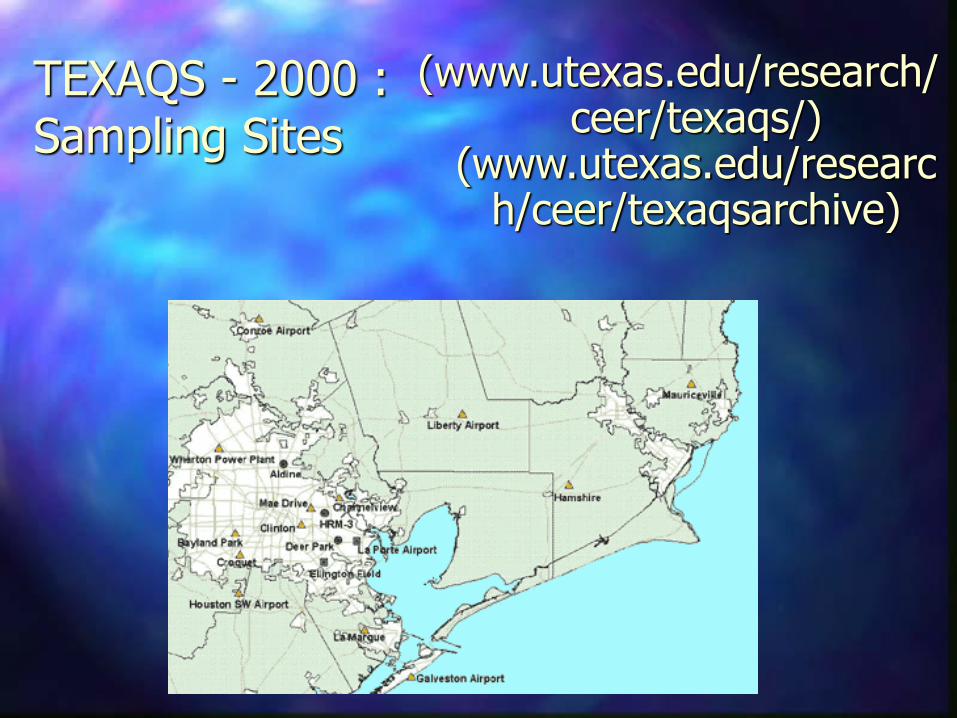
TEXAQS - 2000 :Sampling Sites
(www.utexas.edu/research/ceer/texaqs/)
(www.utexas.edu/research/ceer/texaqsarchive)
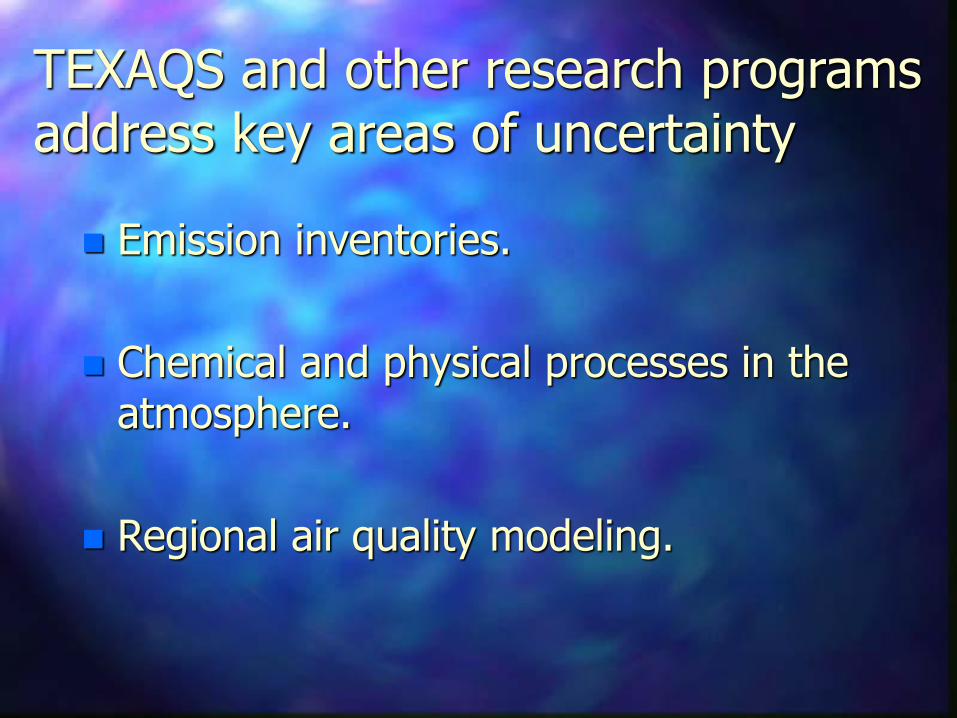
TEXAQS and other research programs address key areas of uncertainty
Emission inventories.
Chemical and physical processes in the atmosphere.
Regional air quality modeling.

TexAQS and other research programs indicate:
Emission inventories: Data from TexAQS suggest that the VOC emission inventory is low by a factor of 3-10
Emissions are variable: Daily variations can change emissions from any single facility by a factor of 100 or more
Air quality models, on which regulations are based, are unable to describe the spatial variability that we see Existing regulatory models have been unable to replicate critical observations
How did our improved scientific understanding get incorporated into the regulations?
Accelerated Science Evaluation
TCEQ commissioners to decide whether to stay with existing plan or to craft a “mid-course correction”
For updates, see the web site: (www.utexas.edu/research/ceer/texaqsarchive)

Actions taken by the TCEQ
Based on the data from TexAQS, which indicate that VOC emissions from industrial facilities are underestimated, new rules have been proposed for emissions of reactive hydrocarbons from flares, cooling towers and fugitive sources

Benefits of better scientific understanding to the State of Texas
More effective SIP
More confidence by policy-makers in the decision making process
Demonstration of the value of timely scientific analyses
Demonstration of the value of federal/state scientific partnerships
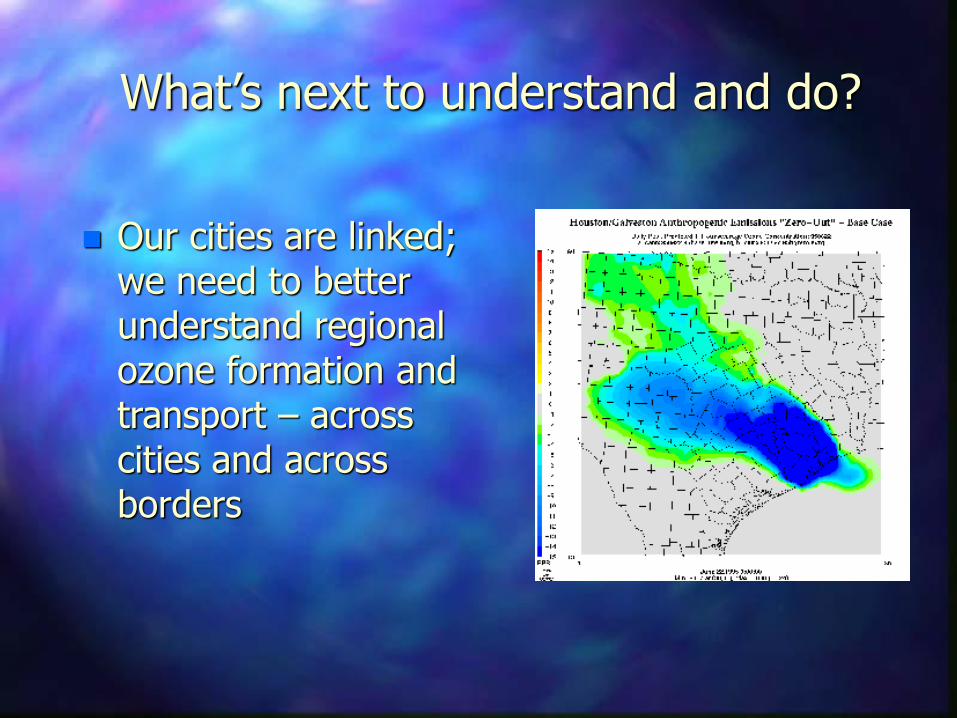
What’s next to understand and do?
Our cities are linked; we need to better understand regional ozone formation and transport – across cities and across borders

What’s next…
Need to better understand fine particulate matter and regional haze

Second Texas Air Quality Study (STAQS)A New Strategic Texas Air Quality Study
Texas must begin now developing science base for control of 8-Hour
ozone, fine particulate matter (PM2.5) and regional haze
STAQS is a five-year field investigation aimed at developing the
underlying science for effective control policies
Study will utilize experienced TexAQS 2000 study team;
Leadership provided by Texas universities, TNRCC, Texas
Environmental Research Consortium, NARSTO and Southern Oxidants
Study
The UT-Austin Center for Energy and Environmental Resources will
provide overall study coordination and administration.
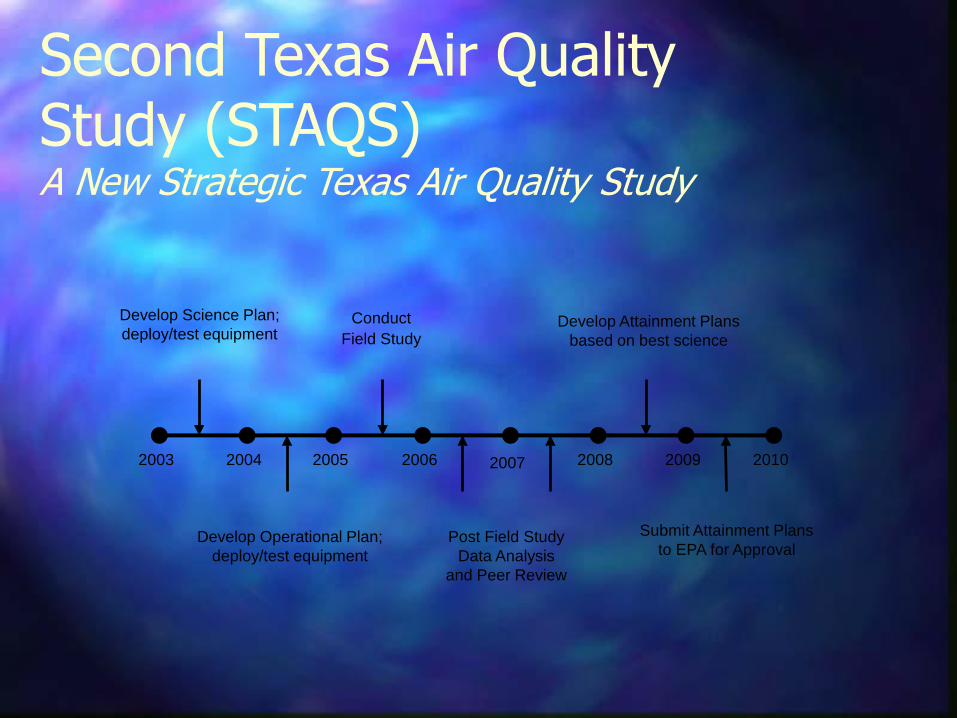
2003 2004 2005 2006 2007 2008 2009 2010
Develop Science Plan;
deploy/test equipment
Develop Operational Plan;
deploy/test equipment
Conduct
Field Study
Post Field Study
Data Analysis
and Peer Review
Develop Attainment Plans
based on best science
Submit Attainment Plans
to EPA for Approval
Second Texas Air Quality Study (STAQS)A New Strategic Texas Air Quality Study

What can we do?•Keep your automobile well tuned and maintained.
•Carpool, use mass transit, walk, bicycle, and/or reduce driving,
especially on hot summer days.
•During the summer, fill your gas tank during the cooler evening
hours.
•Participate in your local utility's energy conservation programs.
•Seal containers of household cleaners, workshop chemicals and
solvents, and garden chemicals to prevent VOC from evaporating
into the air. Dispose of them properly.

Questions?
David Allen
www.utexas.edu/research/ceer/airquality
www.utexas.edu/research/ceer/texaqs
www.utexas.edu/research/ceer/texaqsarchive

Dr. David AllenDr. David Allen is the Melvin H. Gertz Regents Chair in Chemical Engineering and
the Director of the Center for Energy and Environmental Resources at the University
of Texas at Austin. Dr. Allen’s research addresses issues related to air quality in
Texas. He was a lead investigator in one of the largest and most successful air
quality studies ever undertaken: the Texas Air Quality Study
(www.utexas.edu/research/ceer/texaqs).
His current work is focused on using the results from that study to provide a sound
scientific basis for air quality management in Texas. Dr. Allen also serves as the
Chair of the Texas Council on Environmental Technology(TCET), which was
established by the 77th Legislature. TCET is charged with encouraging the
development, demonstration, certification and deployment of novel technologies for
cost-effectively reducing emissions to air, water and land in Texas. At the national
level, Dr. Allen serves on the Science Advisory Board of the EPA, dealing with issues
of air quality modeling and cost-benefit analysis of the Clean Air Act. He also serves
on the National Research Council’s Board on Environmental Studies and
Toxicology.
Dr. Allen received his B.S. degree in Chemical Engineering, with distinction, from
Cornell University in 1979. His M.S. and Ph.D. degrees in Chemical Engineering
were awarded by the California Institute of Technology in 1981 and 1983. He is the
author of4 books and more than 150 technical papers. He has held faculty
appointments at UCLA and the California Institute of Technology; he joined the
University of Texas in 1995.