Biases and Blind-Spots in Genome-Wide CRISPR Knockout Screens · systematic gene knockout studies...
44
Biases and Blind-Spots in Genome-Wide CRISPR Knockout Screens Merve Dede 1,2 , Eiru Kim 1 , Traver Hart 1,3 * 1 Department of Bioinformatics and Computational Biology, The University of Texas MD Anderson Cancer Center, Houston, Texas, USA 2 Graduate School of Biological Sciences, The University of Texas MD Anderson Cancer Center, Houston, Texas, USA 3 Department of Cancer Biology, The University of Texas MD Anderson Cancer Center, Houston, Texas, USA *Corresponding author: [email protected] . CC-BY 4.0 International license (which was not certified by peer review) is the author/funder. It is made available under a The copyright holder for this preprint this version posted January 17, 2020. . https://doi.org/10.1101/2020.01.16.909606 doi: bioRxiv preprint
Transcript of Biases and Blind-Spots in Genome-Wide CRISPR Knockout Screens · systematic gene knockout studies...

Biases and Blind-Spots in Genome-Wide CRISPR Knockout Screens
Merve Dede1,2, Eiru Kim1, Traver Hart1,3*
1 Department of Bioinformatics and Computational Biology, The University of Texas MD Anderson
Cancer Center, Houston, Texas, USA
2 Graduate School of Biological Sciences, The University of Texas MD Anderson Cancer Center,
Houston, Texas, USA
3 Department of Cancer Biology, The University of Texas MD Anderson Cancer Center, Houston,
Texas, USA
*Corresponding author: [email protected]
.CC-BY 4.0 International license(which was not certified by peer review) is the author/funder. It is made available under aThe copyright holder for this preprintthis version posted January 17, 2020. . https://doi.org/10.1101/2020.01.16.909606doi: bioRxiv preprint

1
Abstract
It is widely accepted that pooled library CRISPR knockout screens offer greater sensitivity and
specificity than prior technologies in detecting genes whose disruption leads to fitness defects, a
critical step in identifying candidate cancer targets. However, the assumption that CRISPR 5
screens are saturating has been largely untested. Through integrated analysis of screen data in
cancer cell lines generated by the Cancer Dependency Map, we show that a typical CRISPR
screen has a ~20% false negative rate, beyond library-specific false negatives previously
described. Replicability falls sharply as gene expression decreases, while cancer subtype-specific
genes within a tissue show distinct profiles compared to false negatives. Cumulative analyses 10
across tissues suggest only a small number of lineage-specific essential genes and that these
genes are highly enriched for transcription factors that define pathways of tissue differentiation.
In addition, we show that half of all constitutively-expressed genes are never hits in any CRISPR
screen, and that these never-essentials are highly enriched for paralogs. Together these
observations strongly suggest that functional buffering masks single knockout phenotypes for a 15
substantial number of genes, describing a major blind spot in CRISPR-based mammalian
functional genomics approaches.
Introduction
20
The search for essential genes - genes whose loss of function results in a severe fitness defect -
has been of outstanding interest to the scientific community. Prior to advanced genomic
technologies, the assumption was that the majority of genes were essential for life (Horowitz and
Leupold, 1951). This idea was dismissed by several studies that utilized saturating random
mutagenesis to show that in C. elegans and S. cerevisiae, 12-15% of the genome was estimated 25
.CC-BY 4.0 International license(which was not certified by peer review) is the author/funder. It is made available under aThe copyright holder for this preprintthis version posted January 17, 2020. . https://doi.org/10.1101/2020.01.16.909606doi: bioRxiv preprint

2
to be essential (Brenner, 1974; Goebl and Petes, 1986). These studies were limited by the
methods at the time and the lack of the availability of complete genome sequences.
After improvements in shotgun sequencing, initial studies to define essential genes in bacteria
were driven by the desire to identify antimicrobial targets with the first minimal genome screen 30
performed in Mycoplasma genitalium (Hutchison et al., 1999). Later studies revealed the essential
genes in other bacteria including M. tuberculosis, P. aeruginosa and H. influenza (Sassetti et al.,
2001) (Jacobs et al., 2003)(Akerley et al., 2002).
With the advances in genome technologies that enabled sequencing of eukaryotic organisms, 35
systematic gene knockout studies were performed in S. cerevisiae, identifying essential genes by
deletion of open reading frames in the yeast genome (Giaever et al., 2002; Winzeler et al., 1999).
This method identified that 17% of yeast genes were essential for growth in rich medium (Winzeler
et al., 1999). However, a later study showed that a binary classification of genes into essential
and non-essential was misleading due to the context dependent nature of gene essentiality and 40
that 97% of yeast genes showed some growth phenotype under different environmental
conditions (Hillenmeyer et al., 2008).
Developments in RNA interference (RNAi) technology provided valuable insight into detection of
fitness genes. Generation of genome scale RNAi libraries to conduct genome-wide RNAi screens 45
facilitated the study of essential genes in multiple organisms (Dietzl et al., 2007; Kamath et al.,
2003; Meister and Tuschl, 2004; Moffat and Sabatini, 2006). In these RNAi screens, 30% of the
genome was shown to be essential in D.melanogaster cell lines, (Dietzl et al., 2007), compared
to only 8.5% of the C.elegans genome in whole worms (Kamath et al., 2003).
50
.CC-BY 4.0 International license(which was not certified by peer review) is the author/funder. It is made available under aThe copyright holder for this preprintthis version posted January 17, 2020. . https://doi.org/10.1101/2020.01.16.909606doi: bioRxiv preprint

3
Identifying essential genes in human cancer cells is of special interest in oncology since the
cancer-specific essential genes represent genomic vulnerabilities that can potentially be targeted
with novel therapeutic agents. An initial study showed that some colorectal cell lines were
dependent on a specific KRAS mutation for growth and survival (Shirasawa et al., 1993). Later
this idea was explored under the term “oncogene addiction” that describes the dependency of 55
cancer cells on specific oncogenes for sustained growth and proliferation (Weinstein and Joe,
2008). To identify these oncogenes, RNAi screens were performed on small arrays of cancer cells
to search for essential genes (Moffat et al., 2006; Schlabach et al., 2008; Silva et al., 2008).
Subsequent larger-scale efforts such as the Project Achilles of the Broad Institute focused on
context specific gene essentiality across 216 human cancer cell lines screened with an shRNA 60
library (Cowley et al., 2014). Similarly, another relatively big scale study in 72 cell lines (Marcotte
et al., 2012) produced consistent results with the previous studies, indicating confidence in the
methodology. Even though significant efforts have been made to optimize reagent design and
analytical methods, RNAi technology was shown to have significant limitations such as incomplete
loss of function due to RNAi, decreased sensitivity for genes with low expression levels (false 65
negatives) and confounding off-target effects (false positives) (Boutros and Ahringer, 2008;
Echeverri et al., 2006; Hart et al., 2014).
More recently, adaptation of the bacterial CRISPR-Cas9 system to mammalian cells enabled
genome-scale approaches to define human essential genes. Studies using this technology 70
revealed that mammalian cells have more essential genes than RNAi screens were able to detect
and that, at the same false discovery rate, CRISPR screens generated 3-4 times more essential
genes (Hart et al., 2014). Moreover, multiple groups revealed lists of ~2000 highly concordant
human essential genes, and comparison of CRISPR technology to orthogonal techniques such
as random insertion of gene traps also showed consistent results (Blomen et al., 2015; Hart et 75
al., 2015; Wang et al., 2015). These findings were initially thought to indicate that the CRISPR-
.CC-BY 4.0 International license(which was not certified by peer review) is the author/funder. It is made available under aThe copyright holder for this preprintthis version posted January 17, 2020. . https://doi.org/10.1101/2020.01.16.909606doi: bioRxiv preprint

4
Cas9 screens are saturating and that a well-designed screen can detect a cell's full complement
of essential genes. However, it is still poorly understood how the possible systematic biases and
blind spots in CRISPR screens affect our understanding of human gene essentiality. In the
absence of a ground truth, the actual true positive, false positive and false negative rates are in 80
an average genome-wide CRISPR-Cas9 knockout screen are still unknown.
Moreover, even with the CRISPR technology, the number of essential genes detected through
these screens is still far less than the number of genes expressed in a given cell line. Large-scale
experiments exploring genetic and environmental buffering in both yeast (Costanzo et al., 2010, 85
2016; Hillenmeyer et al., 2008; VanderSluis et al., 2014) and C. elegans (Ramani et al., 2012)
suggest that virtually every gene is required for optimal growth in some condition. A major open
question remains whether these findings hold true for human cells generally and cancer cells
specifically.
90
In this study, we examine some of the biases and blind spots characteristic of genome-wide
CRISPR-Cas9 knockout screening. Using publicly available genome wide screen data from 517
genetically heterogeneous cell lines from the Cancer Dependency Map initiative (Meyers et al.,
2017; Tsherniak et al., 2017), we demonstrate the systematic biases in these screens, investigate
and model the actual number of essential genes identifiable with CRISPR technology, estimate 95
the false discovery rate (FDR) and false negative rate (FNR) in a "typical" CRISPR screen, and
reveal blind spots that can offer fruitful areas for further research.
Results
To systematically evaluate the biases and blind spots in genome-wide CRISPR-Cas9 knockout 100
screening, we processed the raw read counts of loss of function screens performed in 517
.CC-BY 4.0 International license(which was not certified by peer review) is the author/funder. It is made available under aThe copyright holder for this preprintthis version posted January 17, 2020. . https://doi.org/10.1101/2020.01.16.909606doi: bioRxiv preprint
5
genetically heterogeneous cell lines from the 2018Q4 release of the publicly available Avana data
(Meyers et al., 2017). We applied our computational pipeline as described in the methods section
to correct for copy number effects using the previously described CRISPRcleanR algorithm (Iorio
et al., 2018) and assign an essentiality score (Bayes Factor, BF) to each gene in every screen 105
using an updated version of our BAGEL algorithm (Hart and Moffat, 2016). After applying quality
control metrics (see Methods), our final dataset included 446 screens meeting the F-measure
criteria of 0.80 and above (Supplementary Figure 1A-B, Supplementary Table1). These 446 cell
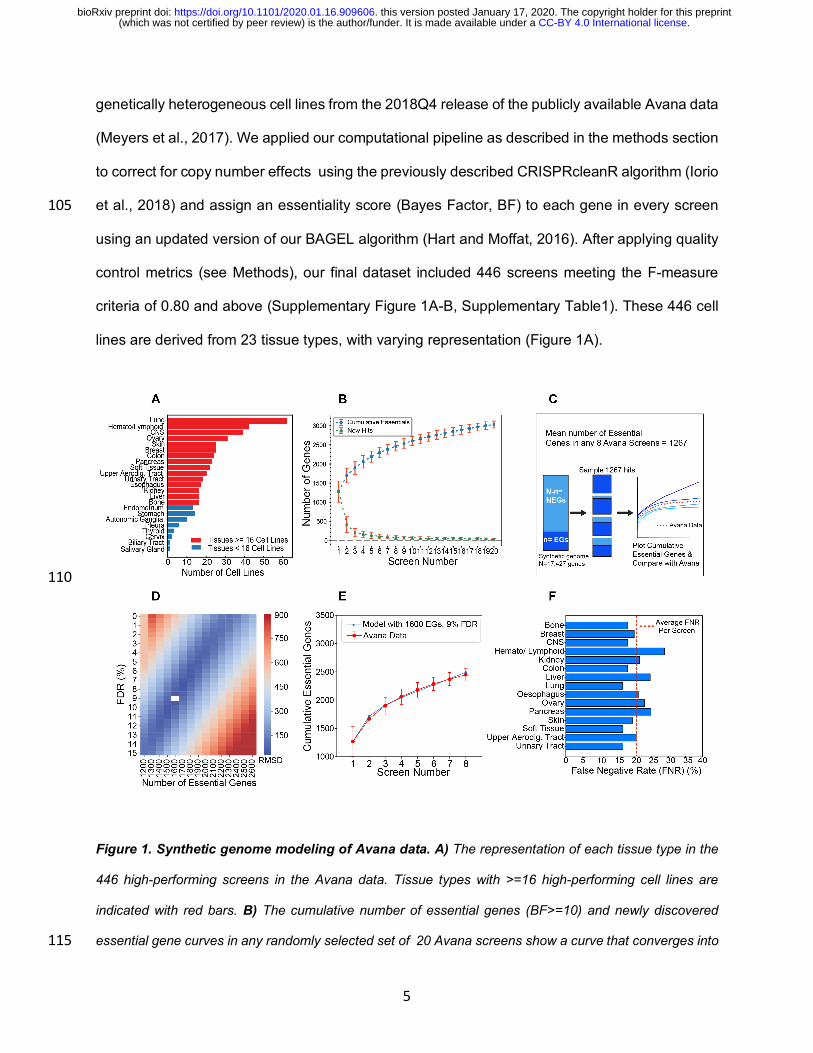
lines are derived from 23 tissue types, with varying representation (Figure 1A).
110
Figure 1. Synthetic genome modeling of Avana data. A) The representation of each tissue type in the
446 high-performing screens in the Avana data. Tissue types with >=16 high-performing cell lines are
indicated with red bars. B) The cumulative number of essential genes (BF>=10) and newly discovered
essential gene curves in any randomly selected set of 20 Avana screens show a curve that converges into 115
.CC-BY 4.0 International license(which was not certified by peer review) is the author/funder. It is made available under aThe copyright holder for this preprintthis version posted January 17, 2020. . https://doi.org/10.1101/2020.01.16.909606doi: bioRxiv preprint

6
a positive slope. C) Diagram overview of the synthetic genome modeling of essential genes. From a
synthetic genome of 17,427 genes, 1267 hits were randomly sampled from the essential (n) and non-
essential gene (NEG) populations based on the defined false discovery rate (FDR) in the simulation. The
resulting cumulative essential hits across 8 iterations were plotted and compared to the mean cumulative
essentials curve from the Avana data. D) The synthetic genome modeling revealed that the best fitting 120
model was the one with n=1600 genes and 9% FDR. E) Plot showing the model with the best fit (in blue)
to the Avana data (red). F) An average screen false negative rate (FNR) was determined by comparing the
number of essential genes from the best fit model in each tissue type to the mean number of observed
essentials in each tissue type. The red dashed line indicates a mean FNR of 20.6% across all tissue types
tested. 125
Synthetic genome modeling of essential genes in 446 screens
To estimate the total number of essential genes in a cell, we first considered an approach based
on the cumulative observations across all screens. The expectation is that, for a sufficient number
of identical screens with no false positives, a plot of the cumulative number of essential genes
would flatten to zero slope as the total population of cell-essential genes was identified. In 130
contrast, in screens with either cellular heterogeneity or some low false discovery rate (or both),
the slope of the cumulative essential plot would remain positive, reflecting the ongoing
accumulation of false positives (or, alternatively, cell-specific essential genes) in otherwise
saturated screens. We previously applied this principle to estimate the total population of essential
genes assayable by shRNA screens (Hart et al., 2014). 135
We plotted the cumulative essential genes across sets of 20 cell lines randomly selected without
replacement from all screens (100 iterations). Filtering for genes with BF>10 in each screen, a
strict threshold representing a posterior probability of gene essentiality of ~99% (Supplementary
Figure 1C; see Methods), yielded a curve that converged to a positive slope (Figure 1B), similar
to that shown previously in shRNA screens. We reasoned that this curve represents three factors: 140
.CC-BY 4.0 International license(which was not certified by peer review) is the author/funder. It is made available under aThe copyright holder for this preprintthis version posted January 17, 2020. . https://doi.org/10.1101/2020.01.16.909606doi: bioRxiv preprint

7
first, there exists a fixed population of essential genes across all screens. Second, the screening
platform does not reliably capture all of these genes in a single experiment. Each screen therefore
carries some unknown false negative rate, and multiple screens are required before saturation.
Third, after saturation, additional screens continue to detect some combination of false positives
and context-specific essential genes that were either not detectable or not present in the prior set 145
of screens, and that the rate at which these genes are observed offers some estimate of the false
discovery rate of each screen.
To model these factors, we carried out repeated screens in silico and compared synthetic
cumulative essential curves to those derived from the data. Starting with a genome of N=17,427
genes – the number of genes tested in the Avana library – we arbitrarily defined n essential genes, 150
leaving N-n nonessential. We further defined an arbitrary screen false discovery rate between 1-
15%. Then we repeatedly sampled this genome with a screen that randomly drew 1,267 hits –
the mean number of hits at BF>10 across all Avana screens -- from the essential and nonessential
populations based on the defined FDR (e.g. at 10% FDR, 127 nonessentials and 1,140 essentials
were randomly selected; see Figure 1C). Finally, we determined the cumulative hits across eight 155
iterations, estimating that eight samples was a good estimate of screen saturation in the data
(Figure 1B) and judging that it was more important to fit the model to our observations in this
region than in the saturated region. We calculated the root-mean-squared deviation from the
mean cumulative essentials curve determined from the Avana data and plotted RMSD vs. the two
parameters of the model (Figure 1D), observing that the best fit occurred with n=1,600 essential 160
genes and FDR=9% (Figure 1E). Notably, a region of good fits, with RMSD < 2xRMSDmin, occurs
between n=1,400-1,900 essential genes and a corresponding decrease in per-screen FDR from
9% to ~5% (Supplementary Figure 1D).
Given the broad range of lineages from whence the screened cell line models were derived, it
seems clear that context-specific essential genes will be included in these putative false positives. 165
.CC-BY 4.0 International license(which was not certified by peer review) is the author/funder. It is made available under aThe copyright holder for this preprintthis version posted January 17, 2020. . https://doi.org/10.1101/2020.01.16.909606doi: bioRxiv preprint

8
To minimize the contribution of these tissue-specific essentials, we repeated the analysis using
screens derived only from a single tissue or lineage, filtering for lineages represented by at least
16 high-quality screens (Figure 1A, red; n=15 lineages). Every tissue yielded a similar cumulative
essential curve (Supplementary Figure 2). We repeated the synthetic genome modeling approach
in each tissue, with remarkably similar results (Supplementary Figures 3 and 4). By comparing 170
the best-fit number of essential genes to the mean number of hits observed each screen, we
calculated an average false negative rate across each tissue (Figure 1F). Across all tissues, we
determined the mean FNR to be ~20% in each screen.
Saturation modeling to differentiate essential genes and false positives
175
While the synthetic genome modeling approach described above can estimate the total number
of essential genes in a tissue, it does not provide any way to differentiate true hits from false
positives. To address this issue, we took an alternative view of the saturating behavior of CRISPR
screens. Based on our judgment that screening in virtually all lineages achieved saturation after
roughly eight cell lines had been effectively screened, we again selected the lineages with at least 180
twice this number of cell lines (Figure 1A). From each lineage, we randomly selected eight screens
(“initial screens”) without replacement and determined the number of cell lines in which each gene
was classified as essential (BF>10; Figure 2A). We then randomly selected an additional eight
screens (“subsequent screens”), again without replacement, and determined the number of cell
lines in which each gene was classified as new hits – that is, BF>10 but not a hit in any of the 185
initial eight screens. We assumed that all of these new hits were false positives, and that the
histogram of observations of these false positives estimates the frequency of false positives in
the initial screens. It is almost certainly not the case that all of these are actually false positives,
given the known presence of tumor subtypes within each tissue/lineage, the high likelihood of
subtype-specific essential genes, and the probability that any given subtype escaped being 190
.CC-BY 4.0 International license(which was not certified by peer review) is the author/funder. It is made available under aThe copyright holder for this preprintthis version posted January 17, 2020. . https://doi.org/10.1101/2020.01.16.909606doi: bioRxiv preprint

9
selected in the initial eight screens. However, this assumption is useful for modeling purposes, as
it provides an estimate of the upper bound of the false discovery rate using this saturation
modeling approach. We repeated this process 100 times and plot the resulting histogram in Figure
2A.
195
Figure 2. Saturating modeling approach, differentiating essential genes, false positives, false
negatives and subtype-specific essential genes. A) Histogram showing the distribution of the number
of essential genes and the number of cell lines in which each gene was classified as essential in colorectal
cancer cell lines. Blue bars represent the distribution of true positives (TPs) and the orange bars represent
the frequency of false positives (FPs). The error bars represent the standard deviation of observed 200
essentials in 100 iterations. B) For the TPs in colorectal cancer cell lines depicted in A, the mean mRNA
expression (log2(TPM)) of the gens in each bin shows higher expression where more frequently observed
essential genes show higher levels of expression. C) Violin plot showing the distribution of the essentiality
scores (Bayes Factor, BFs) of the TP genes in A and B, in the screens where they were not observed as
essential. D) Functional enrichment of genes in colorectal cancer cell lines based on their mean number of 205
hits observations out of 8 screens in 100 iterations. Grey dashed line indicates significance at p=0.01 E)
.CC-BY 4.0 International license(which was not certified by peer review) is the author/funder. It is made available under aThe copyright holder for this preprintthis version posted January 17, 2020. . https://doi.org/10.1101/2020.01.16.909606doi: bioRxiv preprint

10
mRNA expression (log2(TPM)) in colorectal cancer cell lines of the genes involved in the enriched pathways
shown in D. Marginal histogram on the right shows the distribution of expression levels of all genes assayed
in the Avana library. F) Hierarchical clustering of the colorectal cancer cell lines based on the essentiality
scores of the genes involved in pathways showed in D and E. 210
Notably, the putative false positives follow the expected distribution: most are detected in only a
single screen (Figure 2A). We can estimate both binwise and cumulative false discovery rates
(Supplementary Table 2) by comparing the ratio of putative false positives per bin to the total
number of hits. We assess that genes observed in 3 or more of 8 randomly selected screens 215
represent the high-confidence set of essential genes in a given lineage, including both genes that
are frequently false negatives as well as those that are subtype-specific within a lineage.
False negatives vs. subtype-specific genes
The familiar U-shaped histogram in Figure 2A carries strong implications for the underlying 220
experiment. Genes observed in an intermediate number of screens (3 to 6, out of 8) are either
false positives that are repeatedly observed, false negatives that are repeatedly missed, or
subtype-specific genes that are only hits in some cells, violating the modeling assumption that the
cells are identical (in reality, some combination of the three is likely). We show from the hit
frequency in subsequent screens that these genes are unlikely to be false positives. Here we 225
attempt to differentiate between false negatives and context-dependent genes.
First, we find the mean mRNA expression of genes in each bin (Figure 2B). A clear trend emerges,
whereby more frequently observed hits show higher gene expression. Genes observed in only
one of eight screens, highly enriched for false positives, show markedly lower expression. In 230
addition, putative false positives from subsequent screens show a similarly lower average gene
expression than more frequently observed hits (Supplementary Figure 5). Second, we examine
.CC-BY 4.0 International license(which was not certified by peer review) is the author/funder. It is made available under aThe copyright holder for this preprintthis version posted January 17, 2020. . https://doi.org/10.1101/2020.01.16.909606doi: bioRxiv preprint

11
the BF scores of genes in screens where the gene is not a hit. This measures whether a gene
that is essential (BF>10) in, for example, 5 screens is truly nonessential in the remaining 3 screens
(BF<-10) or falls in the indeterminate range near BF=0. Figure 2C shows that, the more frequently 235
a gene is classified as a hit in the initial screens, the higher its average BF in screens where it is
not a hit. This is strongly consistent with false negatives rather than context-specific hits.
Finally, we measured functional enrichment of gene annotations as a function of stringency
thresholds. We plotted the P-value of annotation enrichment for several terms that demonstrate 240
the major trends in the data. Genes associated with the cytoplasmic ribosome, which should be
essential in every cell, show peak enrichment at high hit frequency (hits in n>=7 of 8 screens in
100 random samples; Figure 2D). Consistent with the expression bias shown in Figure 2B, these
genes are very highly expressed in the cell (Figure 2E). Similarly, genes encoding proteasome
subunits are critical for proliferation of all cells, show near-maximal enrichment at high frequency 245
of observation (n>6.5, Figure 2D), and are relatively highly expressed (Figure 2E). In contrast,
genes involved in tRNA aminoacylation and RNA degradation—which should also, in principle,
be universally essential—show consistent increase in enrichment as frequency of observation is
relaxed (Figure 2D), and these genes are expressed at intermediate levels (Figure 2E). Taken
together, these trends are consistent with a significant false negative rate among moderately 250
expressed genes that should otherwise exhibit consistent fitness defects across cell lines.
Moreover, this trend is easily differentiated from context-specific modular functions: genes related
to mitochondrial translation and oxidative phosphorylation only show enrichment at low frequency
of observation (Figure 2D), despite their robust gene expression (Figure 2E). A summary of gene
essentiality scores and trends in the cell lines displayed here is shown in Figure 2F, with context-255
dependent oxphos genes driving the hierarchical clustering of cell lines. A complete table of gene
frequency of observation by tissue type is presented in Supplementary Table 3.
.CC-BY 4.0 International license(which was not certified by peer review) is the author/funder. It is made available under aThe copyright holder for this preprintthis version posted January 17, 2020. . https://doi.org/10.1101/2020.01.16.909606doi: bioRxiv preprint

12
Context-specific essential genes define lineage relationships
After judging that genes observed in 3 or more (of 8) screens represent the high-confidence set 260
of essential genes in a given lineage, we identified 954 genes that are hits at that frequency in all
15 lineages we evaluated (Figure 3A). In addition, each lineage carries an additional 300-600
context-specific essential genes (Figure 3A, inset). These additional genes are also widely, but
not universally, shared across backgrounds: each lineage has only three (CNS) to 49
(hematopoietic) genes uniquely essential to that lineage (Figure 3A). Many known gene-tissue 265
relationships are described in this set of unique context essentials. For example, the SOX10
transcription factor was found to be essential in only skin cells where it plays a major role in the
production and function of melanocytes (Harris et al., 2010; Nonaka et al., 2008). CTNNB1 and
TCF7L2 are essential only in colorectal cancer cell lines, where activation of the Wnt pathway
results in accumulation of B-catenin that interacts with and acts as a coactivator for TCF7L2 that 270
in turn activates downstream genes responsible for colorectal cancer cell survival as well as
resistance to chemo-radiotherapy (Albuquerque and Pebre Pereira, 2018; Emons et al., 2017;
Murphy et al., 2016). ER+ breast cancer cell lines specifically depend on transcription factors
FOXA1 and GATA3, which are overexpressed in ER+ breast carcinomas (Albergaria et al., 2009;
Davis et al., 2016). E2F1, which was uniquely essential in only pancreatic cancer cells, is known 275
to regulate both pancreatic B cell development and cancer growth by increasing the expression
of PDK1 and PDK3 which results in increased aerobic glycolysis and growth in pancreatic cancers
(Denechaud et al., 2017; Kim and Rane, 2011; Wang et al., 2016). Nevertheless, genes unique
to a particular context are very rare, while hundreds of genes are shared across some but not all
lineages. We tested whether clustering of these integrative tissue profiles of gene essentiality 280
would recapitulate known lineage relationships. Hierarchical clustering of all context essential
genes (Figure 3B) clearly separates epithelial-derived carcinomas from cancers of hematopoietic
and bone/soft tissue origins. A complete table of common and context essential genes are listed
in Supplementary Table 4.
.CC-BY 4.0 International license(which was not certified by peer review) is the author/funder. It is made available under aThe copyright holder for this preprintthis version posted January 17, 2020. . https://doi.org/10.1101/2020.01.16.909606doi: bioRxiv preprint

13
285
Figure 3. High-confidence essential genes, their characteristics and comparison to previously
defined gold standard sets of core essential genes. A) Upset plot showing the number of intersection
between high-confidence essential genes in each tissue type. Inset: Daisy plot showing the relationship
.CC-BY 4.0 International license(which was not certified by peer review) is the author/funder. It is made available under aThe copyright holder for this preprintthis version posted January 17, 2020. . https://doi.org/10.1101/2020.01.16.909606doi: bioRxiv preprint

14
between high-confidence context-essential genes and common essential genes. Genes essential in a given
tissue type is represented by the petals of the daisy indicating their numbers for each tissue type. The petals 290
overlap to varying degrees, but all tissues share the common set of essential genes (N=954). B)
Hierarchical clustering of the high-confidence context-essential genes in different tissues based on their
mean number of hits observations out of 8 screens in 100 iterations. C) Venn diagram comparing common
essential genes to previously defined gold standard set of core essential genes. D) Box plots showing the
mean mRNA (TPM) expression of common core essentials (n=300), genes unique to new common 295
essentials identified here (n=323), Core V2 specific essentials (n=136) and core essential genes specific
to the Sanger dataset. E) Biological process enrichment for core essential genes unique to a specific
approach. F) Comparison of the distribution of essentiality scores of Sanger specific core essentials in
common cell lines between the Avana and Sanger data.
300
Comparing common essentials to previous gold standards
The common essentials defined here include genes that are identified as hits in every tissue at a
frequency of at least 3/8 screens. They should, in principle, define a superset of previously defined
gold standard sets of essential genes. We compared our set of 954 common essentials to the Core
Essential Genes v2 that we previously defined as a gold standard training set for our BAGEL algorithm 305
(Hart et al., 2017), as well as the core essentials recently published Sanger dataset derived from
342 CRISPR screens performed at the Wellcome Trust Sanger Centre. (Behan et al., 2019).
Since the initially reported Avana data does not contain guides targeting genes on the X
chromosome, we removed these genes from both other datasets to perform direct comparisons.
Common essentials comprise 494 of 665 (74%) CEGv2 genes and 437 of 535 (82%) of Sanger 310
core essentials (Figure 3C). The 300 genes common to all three approaches have median gene
expression roughly twice that of the genes unique to each approach (median log2(TPM) 6.4 vs
5.3 for new common specific genes, 5.5 for CEGV2 and 5.1 for Sanger specific genes; Figure
3D), consistent with an increased false negative rate among essential genes with moderate levels
of mRNA expression. This is also consistent with the increased overlap of common essentials 315
.CC-BY 4.0 International license(which was not certified by peer review) is the author/funder. It is made available under aThe copyright holder for this preprintthis version posted January 17, 2020. . https://doi.org/10.1101/2020.01.16.909606doi: bioRxiv preprint

15
with CEGv2 as stringency is increased (Supplementary Figure 6). Genes specific to each
approach are listed in Supplementary Table 5.
Interestingly, the genes unique to each dataset show a strong bias reflecting the approach used.
Genes unique to the common essentials defined here are highly enriched for ribosome genesis and 320
mRNA processing genes (Figure 3E). Genes unique to CEGv2 are strongly biased toward nuclear
genes encoding subunits of the mitochondrial ribosome and the electron transport chain. Cellular
dependence on these biological processes is subtype-specific in the approach described here (Figure
2D,E,F) and these genes are likely excluded from the Sanger core essentials for the same reason.
Sanger-specific core essentials do not show strong functional enrichment, compared to the other 325
groups (Figure 3E). In fact, among the 63 Sanger-specific essentials, 14 were not targeted in the
Avana library and the remainder tend to show intermediate BF scores in 117 high-performing Avana
screens of the same cell lines (Figure 3F). This is consistent with there being a set of CRISPR library-
specific false negatives, as previously reported by Kosuke Yusa and colleagues (Ong et al., 2017),
which may be independent of the expression-associated false negatives reported here. 330
Genetic buffering is systematically excluded from monogenic CRISPR screens
Beyond the false negatives detected by the saturation analyses described above, we sought to
determine whether other systematic sources of bias exist in the CRISPR knockout screen data. We
first attempted to correct for lineage-specific effects by defining a set of 7,378 constitutively expressed 335
genes (logTPM > 2 and stdev < 1 across the cell lines for which Avana screening data was available;
Supplementary Figure 7A). Common essentials are almost all constitutively expressed (Figure 4A),
while roughly two-thirds of context-dependent essentials are also constitutively expressed (Figure
4A). Conversely, nearly half of all constitutively expressed genes (N=3,361; 46%) show no strong
knockout phenotype in any Avana CRISPR screen (“never essentials”). 340
.CC-BY 4.0 International license(which was not certified by peer review) is the author/funder. It is made available under aThe copyright holder for this preprintthis version posted January 17, 2020. . https://doi.org/10.1101/2020.01.16.909606doi: bioRxiv preprint

16
Figure 4. Paralogs are
under-represented in
CRISPR-Cas9 screens. B) 345
Stacked bar graph showing
the numbers of common,
context and never essential
genes among all genes,
constitutively expressed and 350
not constitutively expressed
genes.Nearly half (46%) of all
constitutively expressed
genes are not observed as
essential in any of the Avana 355
screens. B) Scatter plot of the
percentage of constitutively
expressed never essentials
with paralogs to that of
constitutively expressed 360
common essentials with
paralogs based on shared
percentage of sequence
similarity thresholds. C) The
number and D) significance of 365
synthetic essentiality of
paralog pairs identified in
Broad and Sanger screens. Only pairs with p-value less than 0.05 were considered in these plots. E-H)
Scatter plots of the synthetic lethality caused by mutational disruption of one paralog partner between E)
.CC-BY 4.0 International license(which was not certified by peer review) is the author/funder. It is made available under aThe copyright holder for this preprintthis version posted January 17, 2020. . https://doi.org/10.1101/2020.01.16.909606doi: bioRxiv preprint

17
SMARCA2-SMARCA4 F) ARID1A_ARID1B and by depletion of one paralog partner between G) RPP25-370
RPP25L and H) FAM50A-FAM50B.
These observations regarding the constitutively expressed genes raised the question about why
we observe so few essential genes in these genetically heterogenous screens. Based on work in
yeast (Hillenmeyer et al., 2008) and nematodes (Ramani et al., 2012), we naively assumed that 375
all constitutively expressed genes should be essential in some context, and hypothesized that
some combination of environmental or genetic buffering masks the fitness consequences of
individual gene knockouts.
To examine the possible role of genetic buffering, we tested whether paralogs are 380
overrepresented among the never-essentials. We obtained the list of the paralogs of human
protein coding genes from Ensembl Biomart along with percent protein sequence similarity
information (see Methods). After filtering for constitutively expressed genes, we observed
paralogs show a wide range of amino acid sequence similarity, but that the majority of the paralog
pairs as defined in Ensembl exhibit low similarity (Supplementary Figure 7B). To evaluate whether 385
paralogs are enriched in never-essentials, we adopted a sliding scale of sequence identity and
measured, at each threshold, the fraction of never-essentials and the fraction of common
essentials captured. As shown in Figure 4B, as sequence similarity stringency is relaxed, never-
essentials are much more likely to have a paralog than common essentials. At 45% or greater
sequence similarity, nearly a third (30.2%) of constitutively expressed never-essentials have a 390
paralog, compared with only 12.2% of common essentials, a ratio of ~2.5:1. This is highly
consistent with previous observations by De Kegel and Ryan (De Kegel and Ryan, 2019) and by
Dandage and Landry (Dandage and Landry, 2019), who used similar approaches.
.CC-BY 4.0 International license(which was not certified by peer review) is the author/funder. It is made available under aThe copyright holder for this preprintthis version posted January 17, 2020. . https://doi.org/10.1101/2020.01.16.909606doi: bioRxiv preprint

18
To further validate this observation, we explored the Avana data to find cases where loss of 395
function of one member of a paralog pair resulted in increased dependency on the other.
Unfortunately, the cell lines screened by CRISPR knockout libraries only contain LOF alleles of a
fraction of the candidate paralogs, limiting this discovery avenue to a few dozen pairs (Figure 4C-
D). Unlike previous approaches, limiting the search for functional redundancy to constitutively
expressed genes excludes false positives arising from tissue-specific expression of paralog family 400
members. Two well-described cases in the BAF (SWI/SNF) complex were immediately apparent:
mutations in SMARCA4 are strongly associated with dependency on paralog SMARCA2 (P<10-
10; Figure 4E), and mutations in ARID1A are associated with ARID1B dependency (P<10-9; Figure
4F). Expanding loss-of-function to include significantly depleted gene expression also reveals an
emergent dependency on RPP25L when RPP25 is depleted (P<10-52; Figure 4G). The two genes 405
encode redundant subunits of RNAse P, a ribonuclease critical for maturation of tRNA, whose
functional buffering was previously observed (Wang et al., 2015). A fourth example is
FAM50A/FAM50B putative functional redundancy (Figure 4H). Interestingly, virtually nothing is
known about the biological role of these genes.
410
Discussion
CRISPR technology has revolutionized mammalian functional genomics and cancer targeting by
leveraging endogenous DNA repair machinery to generate gene knockouts on a genomic scale.
Extensive screening of cancer cell lines under the DepMap project—and, critically, the open
availability of this data--affords an opportunity for re-evaluating the assumptions under which 415
these assays have been carried out. Notably, assumptions about replication and library- and
batch-specific effects have been addressed in some detail (Wang et al., 2019; Dempster et al.,
2019; Rauscher et al., 2018), but questions about what might be systematically missing from
these data have, to our knowledge, not been rigorously explored.
420
.CC-BY 4.0 International license(which was not certified by peer review) is the author/funder. It is made available under aThe copyright holder for this preprintthis version posted January 17, 2020. . https://doi.org/10.1101/2020.01.16.909606doi: bioRxiv preprint

19
We developed a model that estimates the true positive rate, false positive rate, and false negative
rate from a typical genome-scale CRISPR screen. The model which most closely matches data
from a large panel of CRISPR screens suggests that a typical cell expresses 1,600-1,900
essential genes, but a single knockout screen only detects ~80% of these, and multiple screens
are required to saturate the essential genes of any tissue or tumor subtype. Hits among highly 425
expressed genes are often replicated but false negatives are more prevalent among genes
expressed at moderate levels. This carries severe implications for the identification of differentially
essential genes, in particular using isogenic cell lines to identify synthetic lethals, as it suggests
numerous replicates need to be screened in order to confidently discriminate cell-line-specific hits
from false negatives/false positives. 430
A further implication of the false negative rate is that most cells/tissue types carry a larger number
of overlapping essential genes that had been previously recognized. After allowing for false
negatives, we identify nearly a thousand genes that are observed across all lineages that are
deeply sampled in the Avana screens. In contrast, we find only 300-600 tissue-specific genes per 435
lineage, with most showing overlap between related tissues. In fact, each tissue only carries at
most a few dozen tissue-unique genes, and these are highly enriched for lineage-specific
transcription factors.
Finally, we note that there are about 7,000 genes that are constitutively expressed in each cell, 440
but only about half of these are ever detected as essential. Studies in model organisms suggest
that virtually every gene shows a growth phenotype under some environmental condition
(Hillenmeyer et al., 2008; Ramani et al., 2012). It is unknown whether this holds true for individual
mammalian cells, though tumors are often modeled as though they are colonies of single-celled
organisms. It is also the case that most genetic screens of tumor cells are carried out under 445
permissive growth conditions, minimizing nutrient and oxidative stress to maximize growth rate
.CC-BY 4.0 International license(which was not certified by peer review) is the author/funder. It is made available under aThe copyright holder for this preprintthis version posted January 17, 2020. . https://doi.org/10.1101/2020.01.16.909606doi: bioRxiv preprint

20
and improve detection of dropouts. Thus, the degree of environmental buffering is largely
unknown for these constitutively expressed never-essentials.
However, these never-essentials are highly enriched for paralogs. They are as much as 2.5 times 450
more likely to have a paralog than always-essentials, suggesting that functional redundancy by
related genes masks detection of a substantial population of genes in monogenic CRISPR
knockout screens. This has profound implications for efforts to match targeted drugs with tumor
genotypes, and to discover new candidate drug targets. Targeted small molecules often don’t
discriminate, or discriminate poorly, between closely related paralogs, and it may be their 455
promiscuity rather than their specificity that renders them effective. For example, MEK inhibitor
trametinib effectively targets the protein products of both MAP2K1 and MAP2K2, redundant
kinases downstream of RAS/RAF oncogenes, but the functional redundancy of these genes
renders them both invisible to monogenic CRISPR screens, even in RAS/RAF backgrounds (Kim
et al., 2019). A systematic survey of paralogs families, in particular those with only two family 460
members that are constitutively expressed, for synthetic lethality could unmask this genetic
buffering and yield greater insight into the constellation of targetable genes in a tumor. All in all,
systematic CRISPR screens represent an impressive first step toward characterizing tumor-
specific genetic vulnerabilities, but genetic and environmental buffering may mask a substantial
number of new targets. 465
Methods:
Essentiality data generation:
A raw read count file of CRISPR pooled library screens for 517 cell lines using Avana library 470
(Broad DepMap project 18Q4) was downloaded from the data depository
(https://figshare.com/articles/DepMap_Achilles_18Q4_public/7270880). Also, we downloaded
.CC-BY 4.0 International license(which was not certified by peer review) is the author/funder. It is made available under aThe copyright holder for this preprintthis version posted January 17, 2020. . https://doi.org/10.1101/2020.01.16.909606doi: bioRxiv preprint

21
Project Score (Sanger) screen (Behan et al., 2019) raw read counts for 323 cancer cells from the
data depository (https://score.depmap.sanger.ac.uk/). We filtered the dataset to keep only the
protein-coding genes for further analysis and updated their names using HGNC (Yates et al., 475
2017) and CCDS (Farrell et al., 2014) database. We discarded sgRNAs targeting multiple genes
in Avana library to avoid genetic interaction effects. The raw read counts were processed with the
CRISPRcleanR (Iorio et al., 2018) algorithm to correct for gene-independent fitness effects and
calculate fold change. After that, the CRISPRcleanR processed fold changes of each cell line
were analyzed through updated BAGEL v2 build 110 (https://github.com/hart-lab/bagel). In 480
comparison with published BAGEL version v0.92 (Hart and Moffat, 2016), the updated version
employed a linear regression model to interpolate outliers and 10-fold cross validation for data
sampling. Essentiality of genes was measured as Bayes Factor (BF) based on gold standard
reference sets of 681 core essential genes and 927 nonessential genes (Hart et al., 2014; Hart et
al., 2017). Positive BF indicates essential genes and negative BF indicates non-essential genes. 485
Lists of core essential genes and nonessential genes used in this study have been uploaded on
the same repository with BAGEL v2 software. The screen quality was evaluated by using
“precision-recall” function in BAGEL software, and F-measure (BF = 5), which is the harmonic
mean of precision and recall at BF 5, was calculated for each screen. Finally, 446 cell lines for
Broad screen and 320 cells for Sanger screen were selected for further study by F-measure 490
threshold 0.8 to prevent noise from marginal quality of screens.
Cumulative Essentials Analysis:
A cumulative analysis approach was used to evaluate the cumulative distribution of essential
genes and calculate the total number of true essentials (true positives), as well as the error rate 495
(false discovery rate, FDR) in a screen. This is based on the principle described previously (Hart
et al., 2014) that for screens with zero FDR, you would expect a cumulative essential gene
observations plot that flattens out with a slope of zero at the total number of hits. For the actual
.CC-BY 4.0 International license(which was not certified by peer review) is the author/funder. It is made available under aThe copyright holder for this preprintthis version posted January 17, 2020. . https://doi.org/10.1101/2020.01.16.909606doi: bioRxiv preprint

22
screens, when the screens are repeated, the true hits are saturated but because false positives and
cell-line specific essential genes might also be captured, you get a cumulative essentials curve with a 500
positive slope as more false positives and context essentials are added. The BFs for all cell lines in
the Avana18Q4 data were constructed in a matrix. We modeled the cumulative essentials plot in
any sets of 20 screens from the Avana data. First, the initial set of 20 cell lines were sampled
without replacement and the essential genes in the first screen out of 20 were identified with a BF
of greater than or equal to 10. Then, the next screen was analyzed to obtain the essential genes 505
in that screen and the newly discovered essential genes that were not present in the previous
screen were added to the list of essential gene hits to obtain a cumulative essential gene list. The
process was repeated for all subsequent cell lines to capture the cumulative essential genes in
the 20 screens. The random sampling process was repeated for 100 times to sample different
cell lines in different orders and prevent bias in the analysis. The resulting mean cumulative 510
essentials curves were plotted with standard deviations of cumulative essential gene observations
observed in each of 100 iterations. For each iteration, the newly discovered essential genes in
each set of 20 screens were also identified and these new hits were also plotted on the same
plot.
Synthetic Genome Model- Estimating the number of essential genes per screen and screen 515
average FDR:
To estimate the number of essential genes per screen and the average error rate, we conducted in
silico simulations of synthetic screens. A synthetic genome was constructed with the number of
genes assayed in the Avana library (N=17427). For a given genome with N number of genes in
it, there is a number of true essential genes; represented by n, and number of non-essential genes 520
(N-n). Then, the precision (1 - False Discovery Rate) of the assay is represented by the ratio of
true positives to that of the total number of hits. We defined a range of thresholds for false
discovery rate to test in our model from 1-15%. We then randomly sampled this synthetic genome
with a screen with randomly drawn 1267 hits (the mean number of essential gene hits at BF>10
.CC-BY 4.0 International license(which was not certified by peer review) is the author/funder. It is made available under aThe copyright holder for this preprintthis version posted January 17, 2020. . https://doi.org/10.1101/2020.01.16.909606doi: bioRxiv preprint

23
across all Avana screens) from the essential (n) and non-essential (N-n) populations based on 525
the defined FDR in the simulation (e.g. for 10% FDR, 127 nonessentials and 1,140 essentials
were randomly selected). We observed the cumulative essential genes across 8 iterations since
we estimated that sampling 8 screens was a good estimate of observing the trend in screen
saturation in the Avana data. At the same time, we constructed a mean cumulative essentials curve
determined from the Avana data for any 8 screens using bootstrapping for 100 iterations. After 530
running the simulations for a range of different number of essential genes (n) and FDR values,
cumulative observation curves were plotted for each simulation. The root mean squared deviation
for every synthetic screen was calculated by evaluating the difference between the observed
values and the cumulative essentials curve determined from the Avana data using the
sklearn.metrics module in SciKits package for Python version 3.6. 535
Since the Avana data is composed of multiple different tissue types, it is possible that some of
the tissue specific essential genes would be wrongly included in the false positives. To minimize
this effect, we repeated the synthetic genome model in individual tissue types in the Avana data
that were represented by at least 16 high-quality cell lines using the same parameters described
above. 540
Saturation Modeling- Modeling the number of high confidence essential genes and false
positives:
While the in-silico simulations enabled an estimation of the average number of essential genes per
screen, they didn’t give information about which genes were truly essential. To distinguish essential 545
genes from false positives, we identified the tissue types in the Avana data that were well represented
(n>=16 screens). We concluded that 15 tissue types fit our criteria and for these tissues, we evaluated
the frequency of essential gene observations in any 8 screens. For each tissue type, we randomly
selected a set of 8 initial screens and identified the cumulative essential genes in this set and also
plotted the frequency of essentiality observations. For our model, we assumed that if these first 8 550
.CC-BY 4.0 International license(which was not certified by peer review) is the author/funder. It is made available under aThe copyright holder for this preprintthis version posted January 17, 2020. . https://doi.org/10.1101/2020.01.16.909606doi: bioRxiv preprint

24
screens have reached saturation (to approximate for our model), then the subsequent hits in the next
set of screens would give us false positives. Therefore, we randomly selected a subsequent set of 8
screens from the same tissue type without replacement and looked at the newly discovered
cumulative essential genes that were not present in the initial screens to model the frequency
distribution of the false positives. This process was repeated 100 times for each tissue type and the 555
resulting distribution of essential gene counts in these screens were plotted, which were used to
calculate the bin-wise FDR. For the 100 iterations that were performed per tissue type, genes
observed as essential in at least 3 screens on an average out of 8 were considered as high confidence
essential in that tissue. Finally, we assessed how many genes were captured as essential in common
in all tissues to find the set of “common” essential genes (n=954) and context essentials in each tissue 560
type. We used the UpsetR package in R to visualize the set of intersections of essential genes in 15
tissue types.
Expression data:
We utilized the log2 transformed RNA-seq TPM expression data from Depmap Data Portal 565
(https://depmap.org/portal/download/ CCLE_depMap_18Q4_TPM_v2.csv). We filtered the TMP
expression data for the tissues and cell lines used in our analysis. 393 out of 396 cell lines used
in downstream analysis had corresponding expression data.
Expression analysis: 570
Mean TPM expression was calculated for all the genes in each of the bins from the histogram of
the frequency of essentiality observations of the initial set of 8 screens representing the true
positives. The expression values were plotted on a secondary y-axis with the error bars
representing the standard deviation of TPM expression of the genes in each bin.
575
.CC-BY 4.0 International license(which was not certified by peer review) is the author/funder. It is made available under aThe copyright holder for this preprintthis version posted January 17, 2020. . https://doi.org/10.1101/2020.01.16.909606doi: bioRxiv preprint

25
Essentiality score distribution of genes in non-essential screens:To evaluate the mean
essentiality score of genes representing true positives in the screens they were not observed as
essential in, for each iteration, we determined the screens that the genes in each bin had a BF
<10 and calculated a mean essentiality score for each gene in those screens.
We visualized the distribution of mean essentiality score observations of genes in each bin in the 580
non-essential screens as a violin plot.
Process enrichment analysis:
From our modeling of the number of essential genes and false positives per tissue type, we had
evaluated the frequency of essential gene observations in the 100 iterations we performed. We 585
constructed a table of mean number of screen essentiality observations out of 8 screens, in 100
iterations for every gene in each tissue type. To investigate the trends of enrichment of essential
pathways, we measured the functional enrichment of gene annotations depending on the
thresholds for the mean number of screens that a gene was observed as essential in in 0.5
increments. For each threshold, we used the python gseapy package version 0.9.13 for python 590
3.6 to perform process enrichment in several databses including KEGG, CORUM and GO
Biological Process using all 17,427 genes assayed in the Avana library as the set of background
genes. Going in 0.5 increments in the frequency of screen essentiality observations out of 8
screens, we plotted the P-value of annotation enrichment for several terms to show the different
trends in the data. For every gene in the processes that were enriched, we calculated their mean 595
TPM expression in the corresponding cell lines that the process enrichment analysis was
conducted. Finally, we evaluated the essentiality scores of the genes in the enriched pathways in
the corresponding cell lines where the mean number of screen essentiality observation was
greater than 0 out of 8 screens. We used the seaborn.clustermap function of the seaborn package
to plot the hierarchically-clustered heatmap of the essentialty scores of the genes in each pathway 600
.CC-BY 4.0 International license(which was not certified by peer review) is the author/funder. It is made available under aThe copyright holder for this preprintthis version posted January 17, 2020. . https://doi.org/10.1101/2020.01.16.909606doi: bioRxiv preprint
26
in the corresponding tissue type using the average linkage method and the Euclidean distance
metric.
Defining constitutively expressed genes:
The standard deviation of expression versus the mean expression values for all genes assayed
in the Avana library (N=17,427) across all 393 cell lines, for which the expression data was 605
available, were plotted. Constitutively expressed genes were defined as genes with mean
expression > 2 log2(TPM) and standard deviation of expression expression <1 log2(TPM). With
these thresholds we identified 7,378 constitutively expressed genes in the Avana dataset. Among
these, 910 were commonly essential across all cell lines, 3107 context essentials showed
essentiality profile in some of the Avana screens, whereas 3361 genes were not observed as 610
essential in any screen.
Paralogs:
The human paralogous gene pairs for the protein coding genes were utilized from Ensemble
Release 95 Biomart with GRCh38.p12 genome assembly (Zerbino et al., 2018). This release of 615
Ensemble estimates paralogues from gene trees that are constructed with HMM as described in
more detail at http://www.ensembl.org/info/genome/compara/homology_method.html. Other
information such as chromosome location, paralogue percent sequence identity to human target
gene and percent sequence identity of target gene to the paralogous gene were also downloaded.
After removing duplicate gene pairs and filtering for constitutively expressed genes, the percent 620
sequence identities of all human target genes to their paralogs were plotted against the percent
sequence identities of the paralogs to the target human gene to reveal that the majority of the
human paralogous gene pairs had low percentage sequence similarity. Next, the paralog pairs
were binned according to different thresholds for percent sequence identity from a range of 10-
95% and for each bin the percentage of constitutively expressed never essentials with paralogs 625
.CC-BY 4.0 International license(which was not certified by peer review) is the author/funder. It is made available under aThe copyright holder for this preprintthis version posted January 17, 2020. . https://doi.org/10.1101/2020.01.16.909606doi: bioRxiv preprint

27
and the percentage of common essentials with paralogs were calculated and their distributions
were plotted.
Investigation of evidences of functional redundancy between paralog genes in CRISPR
screens 630
To investigate the functional redundancy between paralog genes in Broad and Sanger screens,
we conducted statistical test of synthetic essentiality which is defined that a gene is essential
when the other paralog partner is disrupted by damaging mutations (frameshift or nonsense) and
depletion of expression (mean log TPM < 1.0). Statistical significance was calculated for all one-
one paralog pairs with at least 30% sequence similarity by Fisher’s exact test with a contingency 635
table of presence of disruption in gene A and binary essentiality of gene B (BF threshold = 10).
We found total 9 and 33 synthetic essentiality paralog pairs from Broad screens by mutation
evidences and expression depletion evidences, respectively. Also, we found total 8 and 36
synthetic essentiality paralog pairs from Sanger screens by mutation evidences and expression
depletion evidences, respectively. 640
Essential gene comparisons in different datasets:
Previously defined core essentials from (Hart et al., 2017) and (Behan et al., 2019) were
downloaded from their corresponding supplementary data sections. Raw read count data from
Sanger Institution’s Project Score (Behan et al., 2019) was downloaded and processed with the 645
same pipeline using CrisprCleanR and BagelV2 algorithms to generate Bayes factors for each
gene in every screen. Genes located on the X-chromosome were removed from the core essential
gene set V2 (CoreV2, from (Hart et al., 2017)) and Sanger data (Behan et al., 2019) prior to
comparisons. The common cell lines between Avana and Sanger screens that have F-measures
of greater than or equal to 0.8 were identified (N=117 cell lines). After filtering for genes assayed 650
in both libraries, common essential genes and unique hits specific to each dataset were
.CC-BY 4.0 International license(which was not certified by peer review) is the author/funder. It is made available under aThe copyright holder for this preprintthis version posted January 17, 2020. . https://doi.org/10.1101/2020.01.16.909606doi: bioRxiv preprint

28
investigated. For Sanger specific core essential genes, their Bayes Factors in the common cell
lines between Sanger data and Avana data were compared and gseapy module of Python3.6 was
used to perform biological process enrichment using 'GO_Biological_Process_2018' gene set.
655
.CC-BY 4.0 International license(which was not certified by peer review) is the author/funder. It is made available under aThe copyright holder for this preprintthis version posted January 17, 2020. . https://doi.org/10.1101/2020.01.16.909606doi: bioRxiv preprint
29
Supplementary Figures
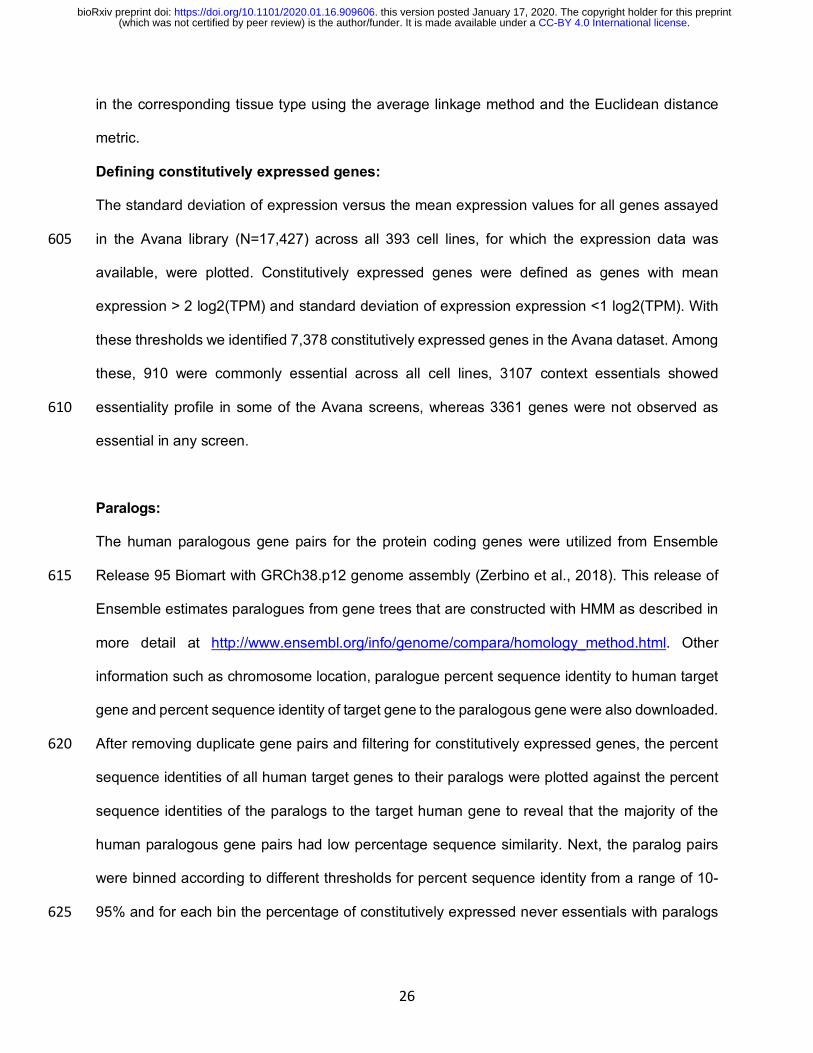
Supplemental Figure 1. A) the distribution of the F-measures of 517 Avana Screens. The red dashed line
indicates F-measure of 0.8 and screens with F-measure >0.8 were considered as high-performing and were
retained for downstream analyses. B) Precision-recall curve specifying an example of a good performing 660
screen (MIAPACA2, in blue) and a bad performing screen (WM115, in green). For all Avana screens,
precision-recall curves were calculated using the reference gold standard sets of essential and non-
essential genes and the point on the precision-recall curve for each screen where the BF crossed 5 (red
points) were identified and the F-measure of each screen was calculated at that point. C) Bayes factor of
10 represents a strict threshold corresponding to a posterior probability of gene essentiality of ~99% D) The 665
distribution of the root mean squared deviation (RMSD) values for each simulation reveals a range of
models with RMSD < 2xRMSDmin indicated by the red dashed line.
.CC-BY 4.0 International license(which was not certified by peer review) is the author/funder. It is made available under aThe copyright holder for this preprintthis version posted January 17, 2020. . https://doi.org/10.1101/2020.01.16.909606doi: bioRxiv preprint

30
Supplemental Figure 2. The cumulative essentials curves for lineages represented by more than or equal
to 16 high-quality screens. Sets of 16 cell lines were randomly selected without replacement from all 670
screens and the number of cumulative essential genes with BF>=10 in each consecutive screen were
plotted in blue with the error bars indicating the standard deviation of cumulative essential gene
observations across 100 iterations. The number of newly discovered essential genes in each consecutive
screen was also plotted in green.
.CC-BY 4.0 International license(which was not certified by peer review) is the author/funder. It is made available under aThe copyright holder for this preprintthis version posted January 17, 2020. . https://doi.org/10.1101/2020.01.16.909606doi: bioRxiv preprint

31
675
.CC-BY 4.0 International license(which was not certified by peer review) is the author/funder. It is made available under aThe copyright holder for this preprintthis version posted January 17, 2020. . https://doi.org/10.1101/2020.01.16.909606doi: bioRxiv preprint

32
Supplemental Figure 3. Synthetic genome modeling, applied to each tissue type, estimates the number
of essential genes and false discovery rate (FDR) per tissue. Heatmaps showing the root mean squared
deviation (RMSD) for the models versus the FDR and the number of essential genes in each simulation.
The white boxes indicate models with RMSD <2 x RMSDmin.
680
685
690
695
700
.CC-BY 4.0 International license(which was not certified by peer review) is the author/funder. It is made available under aThe copyright holder for this preprintthis version posted January 17, 2020. . https://doi.org/10.1101/2020.01.16.909606doi: bioRxiv preprint

33
.CC-BY 4.0 International license(which was not certified by peer review) is the author/funder. It is made available under aThe copyright holder for this preprintthis version posted January 17, 2020. . https://doi.org/10.1101/2020.01.16.909606doi: bioRxiv preprint
34
Supplemental Figure 4. The best fitting models from the synthetic genome modeling approach for
individual tissue types. The cumulative essentials curves were plotted for the best fitting model indicated
by the blue lines and their fit to the Avana data in their corresponding tissue types (cumulative essential 705
genes across sets of 8 call lines randomly selected without replacement from all available screens in that
tissue type for 100 iterations) is shown in red.
710
715
720
725
.CC-BY 4.0 International license(which was not certified by peer review) is the author/funder. It is made available under aThe copyright holder for this preprintthis version posted January 17, 2020. . https://doi.org/10.1101/2020.01.16.909606doi: bioRxiv preprint

35
.CC-BY 4.0 International license(which was not certified by peer review) is the author/funder. It is made available under aThe copyright holder for this preprintthis version posted January 17, 2020. . https://doi.org/10.1101/2020.01.16.909606doi: bioRxiv preprint

36
Supplemental Figure 5. The number of genes in each bin and the mean mRNA expression (TPM) of the 730
genes (indicated by the secondary Y-axis in orange) in corresponding bins for each tissue type for putative
true positives (TPs) and false positives (FPs). Error bars indicate the standard deviation of expression of
genes in each bin.
735
740
745
750
.CC-BY 4.0 International license(which was not certified by peer review) is the author/funder. It is made available under aThe copyright holder for this preprintthis version posted January 17, 2020. . https://doi.org/10.1101/2020.01.16.909606doi: bioRxiv preprint

37
Supplemental Figure 6. Bar plots in each tissue type showing, for genes binned according to the mean 755
number of screens they are observed as essential in 100 iterations, the distribution of their percentage in
the previously defined gold standard set of core essential genes (Core V2).
.CC-BY 4.0 International license(which was not certified by peer review) is the author/funder. It is made available under aThe copyright holder for this preprintthis version posted January 17, 2020. . https://doi.org/10.1101/2020.01.16.909606doi: bioRxiv preprint

38
Supplemental Figure 7. A) Scatter plot of the standard deviation versus mean mRNA expression (TPM) 760
of all genes assayed in the Avana data across all cell lines for which the expression data was available.
The red dashed lines indicate the thresholds to define constitutitvely expressed genes with mean logTPM>2
and stdev <1 (n=7,378 genes). B) Scatter plot and marginal histograms of the constitutively expressed
paralogs in Ensemble have low amino-acid sequence similarity.
765
770
775
.CC-BY 4.0 International license(which was not certified by peer review) is the author/funder. It is made available under aThe copyright holder for this preprintthis version posted January 17, 2020. . https://doi.org/10.1101/2020.01.16.909606doi: bioRxiv preprint

39
Supplementary Table Legends Supplementary Table 1. Bayes Factors for the 446 cell lines used in this study with F-measure 780
above 0.80 post CrisprCleanR processing. Supplementary Table 2. Table of binwise false discovery rates across 100 iterations for the
tissue types investigated in this study. Supplementary Table 3. Gene frequency observations out of 8 screens across 100 iterations by
tissue type. 785 Supplementary Table 4. Table of 954 common essential genes and high confidence context
essential genes in each tissue type. Supplementary Table 5. Common essential and core essential genes unique to each approach
among previously defined core essential genes. 790 Acknowledgments
MD and EK were supported by the Cancer Prevention Research Institute of Texas (CPRIT) grant
RR160032. TH is a CPRIT Scholar in Cancer Research, and is supported by NIGMS grant
R35GM130119 and MD Anderson Cancer Center Support Grant P30 CA016672. 795
References:
800
Akerley, B.J., Rubin, E.J., Novick, V.L., Amaya, K., Judson, N., and Mekalanos, J.J. (2002). A genome-scale analysis for identification of genes required for growth or survival of Haemophilus influenzae. Proc. Natl. Acad. Sci. U.S.A. 99, 966–971.
Albergaria, A., Paredes, J., Sousa, B., Milanezi, F., Carneiro, V., Bastos, J., Costa, S., Vieira, D., Lopes, N., Lam, E.W., et al. (2009). Expression of FOXA1 and GATA-3 in breast cancer: the 805 prognostic significance in hormone receptor-negative tumours. Breast Cancer Research 11, R40.
Albuquerque, C., and Pebre Pereira, L. (2018). Wnt Signalling-Targeted Therapy in the CMS2 Tumour Subtype: A New Paradigm in CRC Treatment? In Targeted Therapy of Colorectal Cancer Subtypes, P. Jordan, ed. (Cham: Springer International Publishing), pp. 75–100. 810
.CC-BY 4.0 International license(which was not certified by peer review) is the author/funder. It is made available under aThe copyright holder for this preprintthis version posted January 17, 2020. . https://doi.org/10.1101/2020.01.16.909606doi: bioRxiv preprint

40
Behan, F.M., Iorio, F., Picco, G., Gonçalves, E., Beaver, C.M., Migliardi, G., Santos, R., Rao, Y., Sassi, F., Pinnelli, M., et al. (2019). Prioritization of cancer therapeutic targets using CRISPR–Cas9 screens. Nature 568, 511–516.
Blomen, V.A., Májek, P., Jae, L.T., Bigenzahn, J.W., Nieuwenhuis, J., Staring, J., Sacco, R., Diemen, F.R. van, Olk, N., Stukalov, A., et al. (2015). Gene essentiality and synthetic lethality in 815 haploid human cells. Science 350, 1092–1096.
Boutros, M., and Ahringer, J. (2008). The art and design of genetic screens: RNA interference. Nature Reviews Genetics 9, 554–566.
Brenner, S. (1974). The genetics of Caenorhabditis elegans. Genetics 77, 71–94.
Costanzo, M., Baryshnikova, A., Bellay, J., Kim, Y., Spear, E.D., Sevier, C.S., Ding, H., Koh, 820 J.L.Y., Toufighi, K., Mostafavi, S., et al. (2010). The genetic landscape of a cell. Science 327, 425–431.
Costanzo, M., VanderSluis, B., Koch, E.N., Baryshnikova, A., Pons, C., Tan, G., Wang, W., Usaj, M., Hanchard, J., Lee, S.D., et al. (2016). A global genetic interaction network maps a wiring diagram of cellular function. Science 353. 825
Cowley, G.S., Weir, B.A., Vazquez, F., Tamayo, P., Scott, J.A., Rusin, S., East-Seletsky, A., Ali, L.D., Gerath, W.F., Pantel, S.E., et al. (2014). Parallel genome-scale loss of function screens in 216 cancer cell lines for the identification of context-specific genetic dependencies. Scientific Data 1, 140035.
Dandage, R., and Landry, C.R. (2019). Paralog dependency indirectly affects the robustness of 830 human cells. Mol Syst Biol 15.
Davis, D.G., Siddiqui, M.T., Oprea-Ilies, G., Stevens, K., Osunkoya, A.O., Cohen, C., and Li, X.B. (2016). GATA-3 and FOXA1 expression is useful to differentiate breast carcinoma from other carcinomas. Hum. Pathol. 47, 26–31.
De Kegel, B., and Ryan, C.J. (2019). Paralog buffering contributes to the variable essentiality of 835 genes in cancer cell lines. PLoS Genet. 15, e1008466.
Dempster, J.M., Pacini, C., Pantel, S., Behan, F.M., Green, T., Krill-Burger, J., Beaver, C.M., Younger, S.T., Zhivich, V., Najgebauer, H., et al. (2019). Agreement between two large pan-cancer CRISPR-Cas9 gene dependency data sets. Nat Commun 10, 5817.
Denechaud, P.-D., Fajas, L., and Giralt, A. (2017). E2F1, a Novel Regulator of Metabolism. 840 Front. Endocrinol. 8.
Dietzl, G., Chen, D., Schnorrer, F., Su, K.-C., Barinova, Y., Fellner, M., Gasser, B., Kinsey, K., Oppel, S., Scheiblauer, S., et al. (2007). A genome-wide transgenic RNAi library for conditional gene inactivation in Drosophila. Nature 448, 151–156.
Echeverri, C.J., Beachy, P.A., Baum, B., Boutros, M., Buchholz, F., Chanda, S.K., Downward, 845 J., Ellenberg, J., Fraser, A.G., Hacohen, N., et al. (2006). Minimizing the risk of reporting false positives in large-scale RNAi screens. Nat Methods 3, 777–779.
.CC-BY 4.0 International license(which was not certified by peer review) is the author/funder. It is made available under aThe copyright holder for this preprintthis version posted January 17, 2020. . https://doi.org/10.1101/2020.01.16.909606doi: bioRxiv preprint

41
Emons, G., Spitzner, M., Reineke, S., Möller, J., Auslander, N., Kramer, F., Hu, Y., Beissbarth, T., Wolff, H.A., Rave-Fränk, M., et al. (2017). Chemoradiotherapy Resistance in Colorectal Cancer Cells is Mediated by Wnt/β-catenin Signaling. Mol Cancer Res 15, 1481–1490. 850
Giaever, G., Chu, A.M., Ni, L., Connelly, C., Riles, L., Véronneau, S., Dow, S., Lucau-Danila, A., Anderson, K., André, B., et al. (2002). Functional profiling of the Saccharomyces cerevisiae genome. Nature 418, 387–391.
Farrell, C.M., O'Leary, N.A., Harte, R.A., Loveland, J.E., Wilming, L.G., Wallin, C., Diekhans, M., Barrell, D., Searle, S.M., Aken, B., et al. (2014). Current status and new features of the 855 Consensus Coding Sequence database. Nucleic Acids Res 42, D865-872.
Goebl, M.G., and Petes, T.D. (1986). Most of the yeast genomic sequences are not essential for cell growth and division. Cell 46, 983–992.
Harris, M.L., Baxter, L.L., Loftus, S.K., and Pavan, W.J. (2010). Sox proteins in melanocyte development and melanoma. Pigment Cell Melanoma Res 23, 496–513. 860
Hart, T., and Moffat, J. (2016). BAGEL: a computational framework for identifying essential genes from pooled library screens. BMC Bioinformatics 17, 164.
Hart, T., Brown, K.R., Sircoulomb, F., Rottapel, R., and Moffat, J. (2014). Measuring error rates in genomic perturbation screens: gold standards for human functional genomics. Molecular Systems Biology 10, 733. 865
Hart, T., Chandrashekhar, M., Aregger, M., Steinhart, Z., Brown, K.R., MacLeod, G., Mis, M., Zimmermann, M., Fradet-Turcotte, A., Sun, S., et al. (2015). High-Resolution CRISPR Screens Reveal Fitness Genes and Genotype-Specific Cancer Liabilities. Cell 163, 1515–1526.
Hart, T., Tong, A.H.Y., Chan, K., Van Leeuwen, J., Seetharaman, A., Aregger, M., Chandrashekhar, M., Hustedt, N., Seth, S., Noonan, A., et al. (2017). Evaluation and Design of 870 Genome-Wide CRISPR/SpCas9 Knockout Screens. G3 7, 2719–2727.
Hillenmeyer, M.E., Fung, E., Wildenhain, J., Pierce, S.E., Hoon, S., Lee, W., Proctor, M., St.Onge, R.P., Tyers, M., Koller, D., et al. (2008). The Chemical Genomic Portrait of Yeast: Uncovering a Phenotype for All Genes. Science 320, 362–365.
Horowitz, N.H., and Leupold, U. (1951). Some Recent Studies Bearing on the One Gene-One 875 Enzyme Hypothesis. Cold Spring Harb Symp Quant Biol 16, 65–74.
Hutchison, C.A., Peterson, S.N., Gill, S.R., Cline, R.T., White, O., Fraser, C.M., Smith, H.O., and Venter, J.C. (1999). Global Transposon Mutagenesis and a Minimal Mycoplasma Genome. Science 286, 2165–2169.
Iorio, F., Behan, F.M., Gonçalves, E., Bhosle, S.G., Chen, E., Shepherd, R., Beaver, C., Ansari, 880 R., Pooley, R., Wilkinson, P., et al. (2018). Unsupervised correction of gene-independent cell responses to CRISPR-Cas9 targeting. BMC Genomics 19, 604.
Jacobs, M.A., Alwood, A., Thaipisuttikul, I., Spencer, D., Haugen, E., Ernst, S., Will, O., Kaul, R., Raymond, C., Levy, R., et al. (2003). Comprehensive transposon mutant library of Pseudomonas aeruginosa. PNAS 100, 14339–14344. 885
.CC-BY 4.0 International license(which was not certified by peer review) is the author/funder. It is made available under aThe copyright holder for this preprintthis version posted January 17, 2020. . https://doi.org/10.1101/2020.01.16.909606doi: bioRxiv preprint
42
Kamath, R.S., Fraser, A.G., Dong, Y., Poulin, G., Durbin, R., Gotta, M., Kanapin, A., Bot, N.L., Moreno, S., Sohrmann, M., et al. (2003). Systematic functional analysis of the Caenorhabditis elegans genome using RNAi. Nature 421, 231–237.
Kim, S.Y., and Rane, S.G. (2011). The Cdk4-E2f1 pathway regulates early pancreas development by targeting Pdx1+ progenitors and Ngn3+ endocrine precursors. Development 890 138, 1903–1912.
Kim, E., Dede, M., Lenoir, W.F., Wang, G., Srinivasan, S., Colic, M., and Hart, T. (2019). A network of human functional gene interactions from knockout fitness screens in cancer cells. Life Sci. Alliance 2, e201800278.
Marcotte, R., Brown, K.R., Suarez, F., Sayad, A., Karamboulas, K., Krzyzanowski, P.M., 895 Sircoulomb, F., Medrano, M., Fedyshyn, Y., Koh, J.L.Y., et al. (2012). Essential gene profiles in breast, pancreatic, and ovarian cancer cells. Cancer Discov 2, 172–189.
Meister, G., and Tuschl, T. (2004). Mechanisms of gene silencing by double-stranded RNA. Nature 431, 343–349.
Meyers, R.M., Bryan, J.G., McFarland, J.M., Weir, B.A., Sizemore, A.E., Xu, H., Dharia, N.V., 900 Montgomery, P.G., Cowley, G.S., Pantel, S., et al. (2017). Computational correction of copy number effect improves specificity of CRISPR-Cas9 essentiality screens in cancer cells. Nat. Genet. 49, 1779–1784.
Moffat, J., and Sabatini, D.M. (2006). Building mammalian signalling pathways with RNAi screens. Nat Rev Mol Cell Biol 7, 177–187. 905
Moffat, J., Grueneberg, D.A., Yang, X., Kim, S.Y., Kloepfer, A.M., Hinkle, G., Piqani, B., Eisenhaure, T.M., Luo, B., Grenier, J.K., et al. (2006). A Lentiviral RNAi Library for Human and Mouse Genes Applied to an Arrayed Viral High-Content Screen. Cell 124, 1283–1298.
Murphy, M., Chatterjee, S.S., Jain, S., Katari, M., and DasGupta, R. (2016). TCF7L1 Modulates Colorectal Cancer Growth by Inhibiting Expression of the Tumor-Suppressor Gene EPHB3. 910 Scientific Reports 6, 28299.
Nonaka, D., Chiriboga, L., and Rubin, B.P. (2008). Sox10: a pan-schwannian and melanocytic marker. Am. J. Surg. Pathol. 32, 1291–1298.
Ong, S.H., Li, Y., Koike-Yusa, H., and Yusa, K. (2017). Optimised metrics for CRISPR-KO screens with second-generation gRNA libraries. Sci Rep 7, 1–10. 915
Ramani, A.K., Chuluunbaatar, T., Verster, A.J., Na, H., Vu, V., Pelte, N., Wannissorn, N., Jiao, A., and Fraser, A.G. (2012). The majority of animal genes are required for wild-type fitness. Cell 148, 792–802.
Rauscher, B., Heigwer, F., Henkel, L., Hielscher, T., Voloshanenko, O., and Boutros, M. (2018). Toward an integrated map of genetic interactions in cancer cells. Mol Syst Biol 14. 920
Sassetti, C.M., Boyd, D.H., and Rubin, E.J. (2001). Comprehensive identification of conditionally essential genes in mycobacteria. Proc Natl Acad Sci U S A 98, 12712–12717.
.CC-BY 4.0 International license(which was not certified by peer review) is the author/funder. It is made available under aThe copyright holder for this preprintthis version posted January 17, 2020. . https://doi.org/10.1101/2020.01.16.909606doi: bioRxiv preprint

43
Schlabach, M.R., Luo, J., Solimini, N.L., Hu, G., Xu, Q., Li, M.Z., Zhao, Z., Smogorzewska, A., Sowa, M.E., Ang, X.L., et al. (2008). Cancer Proliferation Gene Discovery Through Functional Genomics. Science 319, 620–624. 925
Shirasawa, S., Furuse, M., Yokoyama, N., and Sasazuki, T. (1993). Altered growth of human colon cancer cell lines disrupted at activated Ki-ras. Science 260, 85–88.
Silva, J.M., Marran, K., Parker, J.S., Silva, J., Golding, M., Schlabach, M.R., Elledge, S.J., Hannon, G.J., and Chang, K. (2008). Profiling Essential Genes in Human Mammary Cells by Multiplex RNAi Screening. Science 319, 617–620. 930
Tsherniak, A., Vazquez, F., Montgomery, P.G., Weir, B.A., Kryukov, G., Cowley, G.S., Gill, S., Harrington, W.F., Pantel, S., Krill-Burger, J.M., et al. (2017). Defining a Cancer Dependency Map. Cell 170, 564-576.e16.
VanderSluis, B., Hess, D.C., Pesyna, C., Krumholz, E.W., Syed, T., Szappanos, B., Nislow, C., Papp, B., Troyanskaya, O.G., Myers, C.L., et al. (2014). Broad metabolic sensitivity profiling of a 935 prototrophic yeast deletion collection. Genome Biol. 15, R64.
Wang, B., Wang, M., Zhang, W., Xiao, T., Chen, C.-H., Wu, A., Wu, F., Traugh, N., Wang, X., Li, Z., et al. (2019). Integrative analysis of pooled CRISPR genetic screens using MAGeCKFlute. Nat Protoc 14, 756–780.
Wang, L.-Y., Hung, C.-L., Chen, Y.-R., Yang, J.C., Wang, J., Campbell, M., Izumiya, Y., Chen, 940 H.-W., Wang, W.-C., Ann, D.K., et al. (2016). KDM4A Coactivates E2F1 to Regulate the PDK-Dependent Metabolic Switch between Mitochondrial Oxidation and Glycolysis. Cell Rep 16, 3016–3027.
Wang, T., Birsoy, K., Hughes, N.W., Krupczak, K.M., Post, Y., Wei, J.J., Lander, E.S., and Sabatini, D.M. (2015). Identification and characterization of essential genes in the human 945 genome. Science 350, 1096–1101.
Weinstein, I.B., and Joe, A. (2008). Oncogene Addiction. Cancer Res 68, 3077–3080.
Winzeler, E.A., Shoemaker, D.D., Astromoff, A., Liang, H., Anderson, K., Andre, B., Bangham, R., Benito, R., Boeke, J.D., Bussey, H., et al. (1999). Functional Characterization of the S. cerevisiae Genome by Gene Deletion and Parallel Analysis. Science 285, 901–906. 950
Yates, B., Braschi, B., Gray, K.A., Seal, R.L., Tweedie, S., and Bruford, E.A. (2017). Genenames.org: the HGNC and VGNC resources in 2017. Nucleic Acids Res 45, D619-D625. Zerbino, D.R., Achuthan, P., Akanni, W., Amode, M.R., Barrell, D., Bhai, J., Billis, K., Cummins, C., Gall, A., Giron, C.G., et al. (2018). Ensembl 2018. Nucleic Acids Res 46, D754-D761. 955
.CC-BY 4.0 International license(which was not certified by peer review) is the author/funder. It is made available under aThe copyright holder for this preprintthis version posted January 17, 2020. . https://doi.org/10.1101/2020.01.16.909606doi: bioRxiv preprint