BIASED POLICING UPDATE - assets.lapdonline.orgassets.lapdonline.org/assets/pdf/Biased Policing Rpt...
35
Biased Policing and Mediation Update – 3rd Quarter 2017 November 27, 2017 The purpose of this report is to provide the Board of Police Commissioners (BOPC) with an update on the Los Angeles Police Department’s (Department) activities related to the investigation of Biased Policing allegations. 1 It includes data on complaints of Biased Policing and adjudications. This report summarizes the types of contact resulting in Biased Policing complaints as well as the alleged discriminatory conduct and biases, and provides demographic data on the accused employees. It covers Biased Policing complaints initiated in the first three quarters of 2017 and provides comparison data for 2015 and 2016. To provide timely, meaningful information, most of this data is based on information obtained during complaint intake rather than on information from complaint investigations closed a year or more after initiation. This report also provides information on the adjudication of Biased Policing complaints that have closed, including those referred to the Office of Operations (OO) or the Office of Special Operations (OSO) to determine the final disposition when Internal Affairs Group (IAG) disagreed with the adjudication made by the employee’s chain-of-command. An update on the Department’s complaint mediation program is also included. Data Biased Policing Complaints Initiated Biased Policing complaints initiated from 2012 through the first three quarters of 2017 are shown in the table below. The number of Biased Policing complaints for 2012 is based on complaints identified at closing as having Biased Policing allegations; the number for 2013 is based on complaints identified at intake or at closing; and the numbers for 2014 through 2017 are based primarily on complaints identified at intake using information obtained from the preliminary investigations. 2 During the third quarter of 2017, data for 2015 and 2016 was updated to include 18 recently closed complaints in which Biased Policing was not alleged at intake but alleged or identified during investigation. 3 2012 2013 2014 2015 2016 2017 (YTD) 225 281 284 283 256 160 1 On August 19, 2008, the Board of Police Commissioners requested quarterly update reports. 2 Generally, complaints are not classified by specific allegation types until the investigations are completed. During 2013, for Biased Policing cases, IAG began trying to identify Biased Policing allegations at intake rather than at closing. As a result, the number of Biased Policing complaints in 2012 is based on allegations identified at closing, while the number of Biased Policing complaints for 2013 is based on allegations identified intake and at closing. From 2014 onward, Biased Policing complaints were generally identified at intake rather than at closing. 3 A review of recently closed complaints resulted in the addition of one complaint for 2015 and 17 complaints for 2016. Tables 1-8 were also updated to reflect the additional complaints, but the additional complaints did not have a significant impact on the data.
Transcript of BIASED POLICING UPDATE - assets.lapdonline.orgassets.lapdonline.org/assets/pdf/Biased Policing Rpt...
Biased Policing and Mediation Update – 3rd Quarter 2017
November 27, 2017
The purpose of this report is to provide the Board of Police Commissioners (BOPC) with an
update on the Los Angeles Police Department’s (Department) activities related to the
investigation of Biased Policing allegations.1 It includes data on complaints of Biased Policing
and adjudications.
This report summarizes the types of contact resulting in Biased Policing complaints as well as
the alleged discriminatory conduct and biases, and provides demographic data on the accused
employees. It covers Biased Policing complaints initiated in the first three quarters of 2017 and
provides comparison data for 2015 and 2016. To provide timely, meaningful information, most
of this data is based on information obtained during complaint intake rather than on information
from complaint investigations closed a year or more after initiation.
This report also provides information on the adjudication of Biased Policing complaints that
have closed, including those referred to the Office of Operations (OO) or the Office of Special
Operations (OSO) to determine the final disposition when Internal Affairs Group (IAG)
disagreed with the adjudication made by the employee’s chain-of-command.
An update on the Department’s complaint mediation program is also included.
Data
Biased Policing Complaints Initiated
Biased Policing complaints initiated from 2012 through the first three quarters of 2017 are shown
in the table below. The number of Biased Policing complaints for 2012 is based on complaints
identified at closing as having Biased Policing allegations; the number for 2013 is based on
complaints identified at intake or at closing; and the numbers for 2014 through 2017 are based
primarily on complaints identified at intake using information obtained from the preliminary
investigations.2 During the third quarter of 2017, data for 2015 and 2016 was updated to include
18 recently closed complaints in which Biased Policing was not alleged at intake but alleged or
identified during investigation.3
2012 2013 2014 2015 2016 2017 (YTD)
225 281 284 283 256 160
1 On August 19, 2008, the Board of Police Commissioners requested quarterly update reports.
2 Generally, complaints are not classified by specific allegation types until the investigations are completed. During
2013, for Biased Policing cases, IAG began trying to identify Biased Policing allegations at intake rather than at
closing. As a result, the number of Biased Policing complaints in 2012 is based on allegations identified at closing,
while the number of Biased Policing complaints for 2013 is based on allegations identified intake and at closing.
From 2014 onward, Biased Policing complaints were generally identified at intake rather than at closing.
3 A review of recently closed complaints resulted in the addition of one complaint for 2015 and 17 complaints for
2016. Tables 1-8 were also updated to reflect the additional complaints, but the additional complaints did not have a
significant impact on the data.
Biased Policing and Mediation Update – 3rd Quarter 2017
Page 2
Tables 1 through 8 discussed below are attached as separate pages. They provide information
about Biased Policing complaints initiated from 2015 through 2017 year-to-date. For tables in
which a three-year average column is shown, data from 2014 has been included in order to
calculate the average. Some complaints involved multiple complainants and/or accused
employees, and some complainants alleged multiple discriminatory actions and/or types of bias.
Consequently, many of the total counts discussed below exceed the number of complainants and
complaints initiated.4
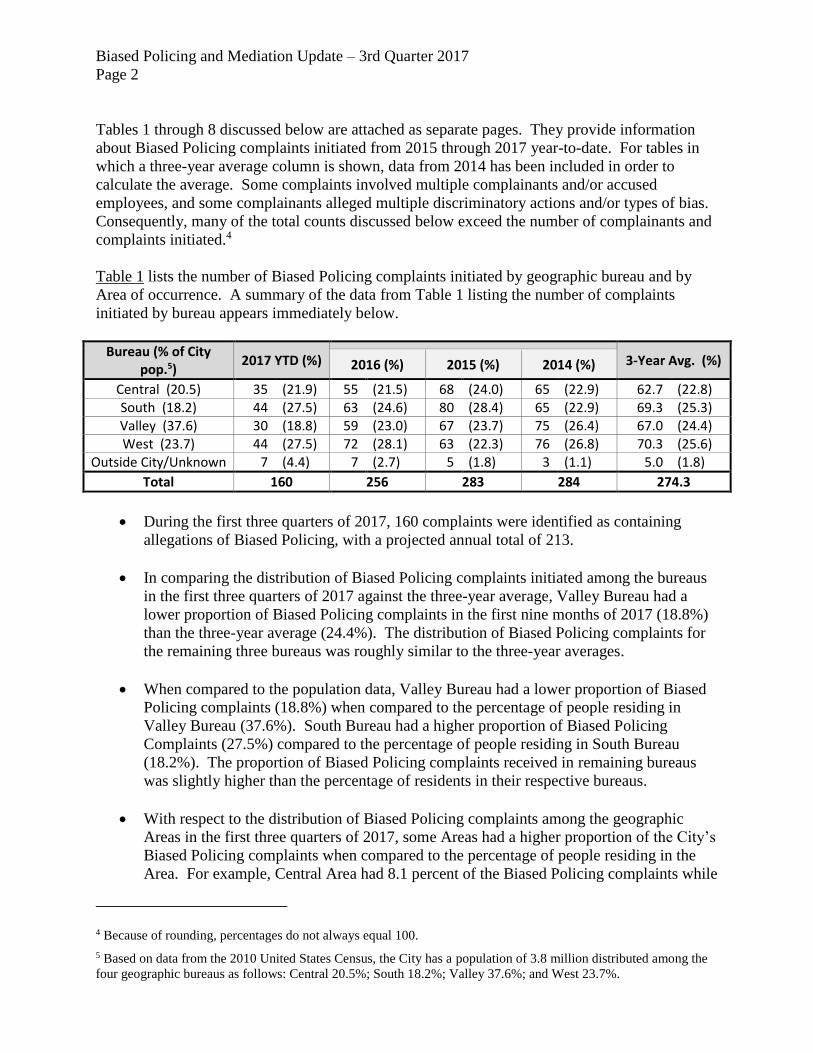
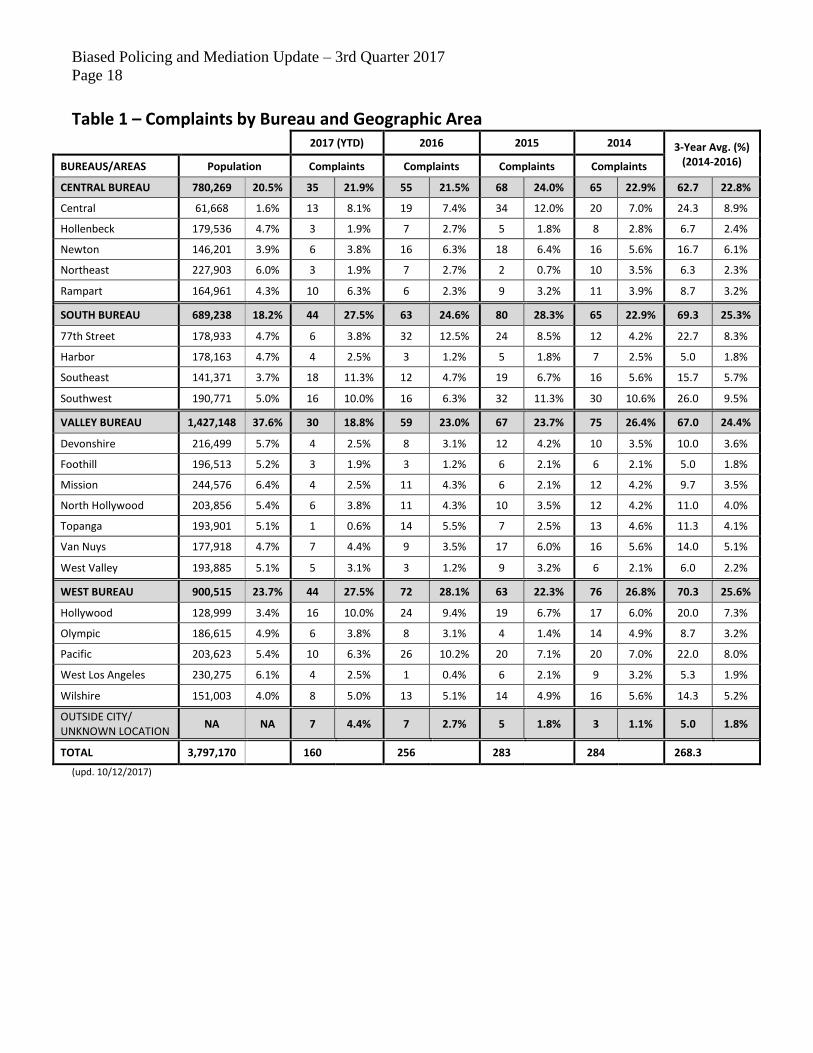
Table 1 lists the number of Biased Policing complaints initiated by geographic bureau and by
Area of occurrence. A summary of the data from Table 1 listing the number of complaints
initiated by bureau appears immediately below.
Bureau (% of City pop.5)
2017 YTD (%)
3-Year Avg. (%) 2016 (%) 2015 (%) 2014 (%)
Central (20.5) 35 (21.9) 55 (21.5) 68 (24.0) 65 (22.9) 62.7 (22.8) South (18.2) 44 (27.5) 63 (24.6) 80 (28.4) 65 (22.9) 69.3 (25.3) Valley (37.6) 30 (18.8) 59 (23.0) 67 (23.7) 75 (26.4) 67.0 (24.4) West (23.7) 44 (27.5) 72 (28.1) 63 (22.3) 76 (26.8) 70.3 (25.6)
Outside City/Unknown 7 (4.4) 7 (2.7) 5 (1.8) 3 (1.1) 5.0 (1.8)
Total 160 256 283 284 274.3
• During the first three quarters of 2017, 160 complaints were identified as containing
allegations of Biased Policing, with a projected annual total of 213.
• In comparing the distribution of Biased Policing complaints initiated among the bureaus
in the first three quarters of 2017 against the three-year average, Valley Bureau had a
lower proportion of Biased Policing complaints in the first nine months of 2017 (18.8%)
than the three-year average (24.4%). The distribution of Biased Policing complaints for
the remaining three bureaus was roughly similar to the three-year averages.
• When compared to the population data, Valley Bureau had a lower proportion of Biased
Policing complaints (18.8%) when compared to the percentage of people residing in
Valley Bureau (37.6%). South Bureau had a higher proportion of Biased Policing
Complaints (27.5%) compared to the percentage of people residing in South Bureau
(18.2%). The proportion of Biased Policing complaints received in remaining bureaus
was slightly higher than the percentage of residents in their respective bureaus.
• With respect to the distribution of Biased Policing complaints among the geographic
Areas in the first three quarters of 2017, some Areas had a higher proportion of the City’s
Biased Policing complaints when compared to the percentage of people residing in the
Area. For example, Central Area had 8.1 percent of the Biased Policing complaints while
4 Because of rounding, percentages do not always equal 100.
5 Based on data from the 2010 United States Census, the City has a population of 3.8 million distributed among the
four geographic bureaus as follows: Central 20.5%; South 18.2%; Valley 37.6%; and West 23.7%.
Biased Policing and Mediation Update – 3rd Quarter 2017
Page 3
Central Area residents accounted for 1.6 percent of the City population. Similarly,
Southeast Area had 11.3 percent of the Biased Policing complaints while Southeast Area
residents accounted for 3.7 percent of the City, and Hollywood Area had 10.0 percent of
the Biased Policing complaints while its residents made up 3.4 percent of the City.
Note: A complainant may not always be a resident of the Area in which he/she
initiates a complaint. Central Area for instance, covers the downtown area and has a
large daytime population because of people commuting to work downtown, but a
smaller residential population. Similarly, Hollywood Area includes the Hollywood
Entertainment District which attracts a large number of visitors.
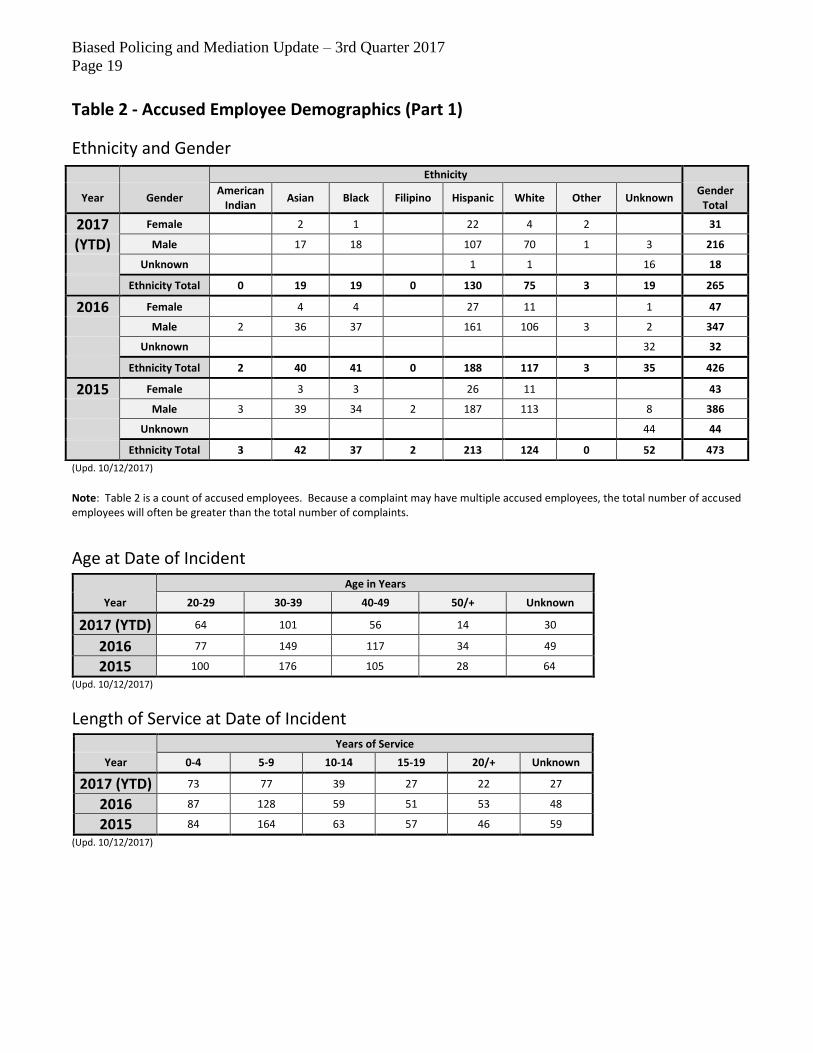
Table 2 shows the breakdown of accused employees by gender, ethnicity, age, and length of
service to the Department, though the gender and ethnicity of accused employees could not
always be determined based on information provided by complainants at intake.
• Gender representation: In the first three quarters of 2017, of the 247 accused employees
for whom gender was known, female employees accounted for 12.6 percent of those
accused in Biased Policing complaints, lower than their representation among sworn
employees in the Department Deployment Roster (18.5%).6 This is a slight decrease
from the prior quarterly report (when female officers were 14.6% of the accused) and is
more in line with prior years. In 2016, female employees were 11.9 percent of the
accused but made up 18.4 percent of all sworn employees, and in 2015, female
employees were 10.0 percent of the accused but made up 18.8 percent of all sworn
employees.
• Ethnic representation: Data from the first three quarters of 2017 show the ethnic
composition of accused employees was generally consistent with that of all sworn
personnel.
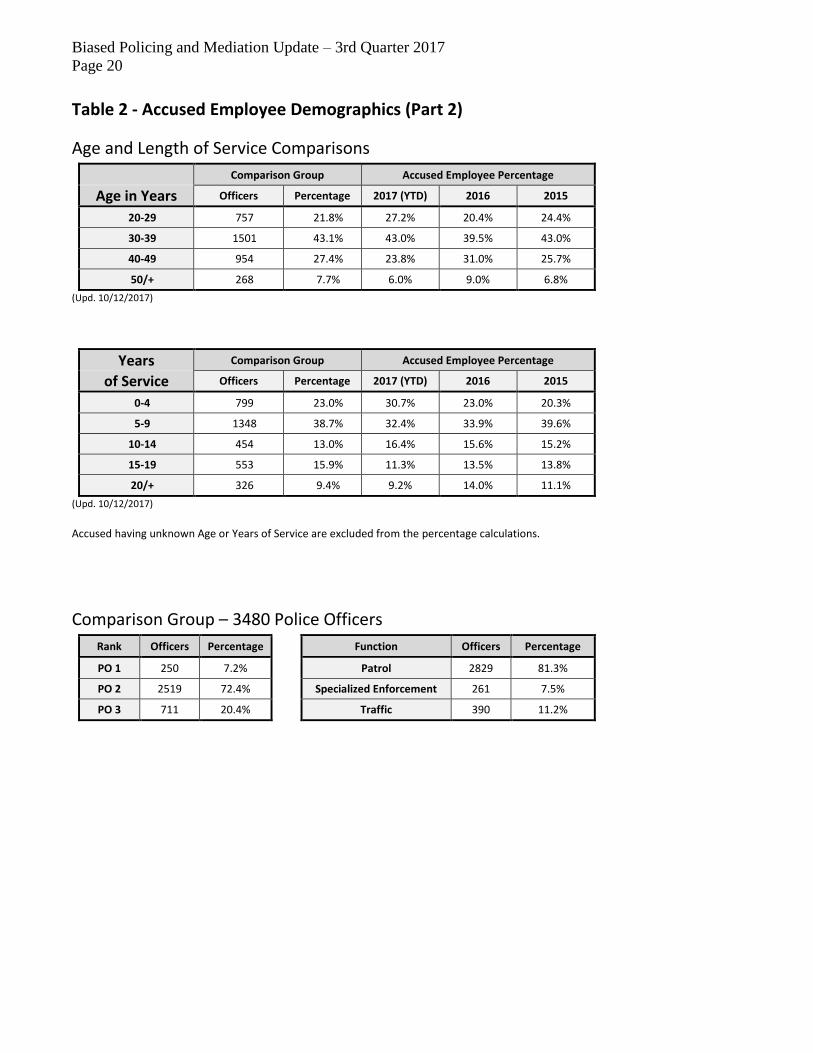
• Age and length of service: Since summarized information on employee age and length of
service is not available in the Department rosters, 3,480 police officers in positions likely
to have public contact were chosen as a comparison group (See Table 2, Part 2). The
distribution of accused employees among the age and tenure categories reported remains
similar to the comparison group. Data from the first three quarters of 2017 show that
accused employees were most frequently in their thirties with less than ten years of
service, as was the case in prior years.
6 Sworn Department employee makeup as of October 1, 2017: Gender: Male 81.5% and Female 18.5%; Ethnicity:
American Indian 0.3%; Asian 7.6%; Black 10.1%; Filipino 2.4%; Hispanic 47.2%; White 32.2%; and Other 0.3%
(Source: Sworn and Civilian Personnel by Sex and Descent, October 1, 2017).
Biased Policing and Mediation Update – 3rd Quarter 2017
Page 4
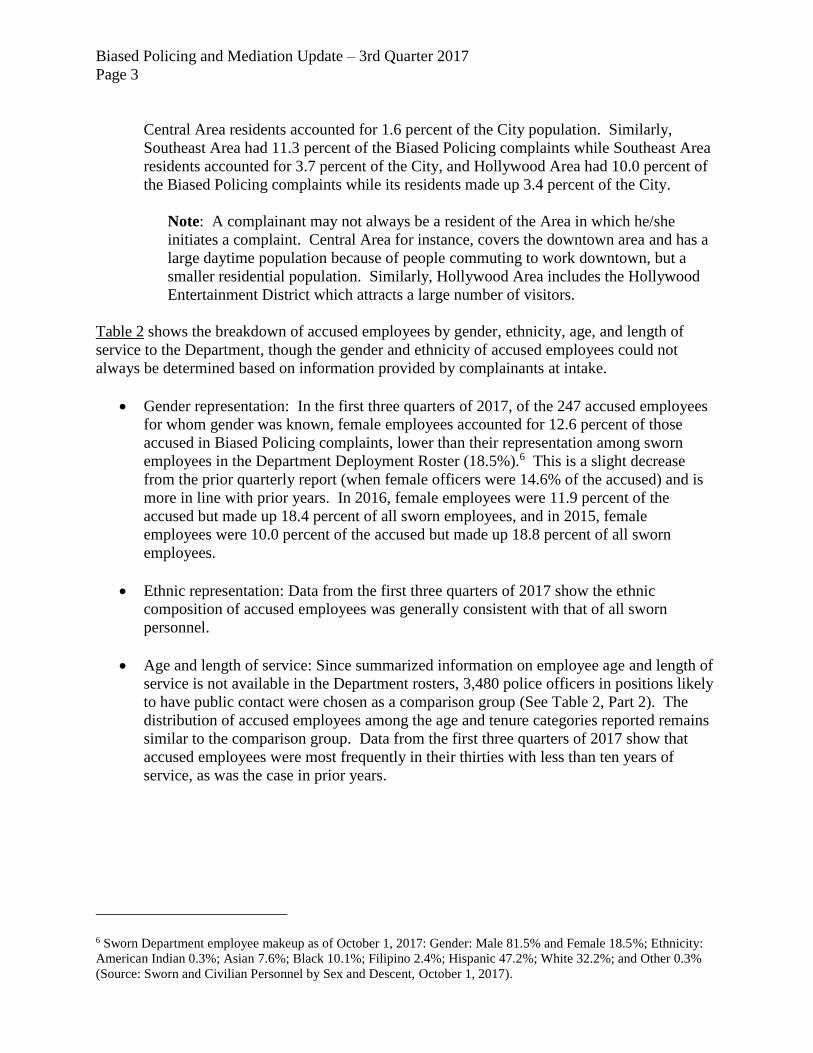
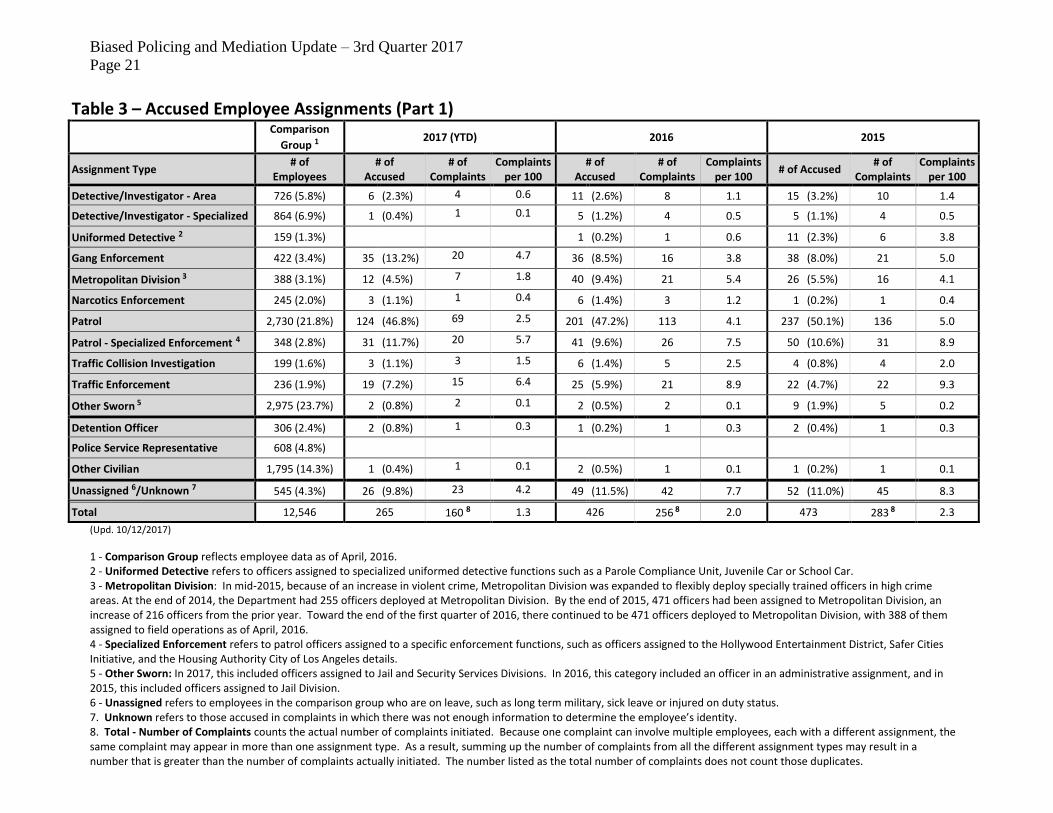
Table 3 shows accused employee assignment types at the time Biased Policing complaints were
initiated, compared to data on the number of Department employees in each assignment type.7
Part 1 of Table 3 focuses on the assignment types in which Biased Policing complaints were
initiated while Part 2 focuses on the gender of accused employees within those assignment types.
Part 1 – Accused Employee and Assignment Types:
• During the first three quarters of 2017, of the 265 employees accused of Biased Policing,
officers assigned to the general Patrol function were the subject of the most Biased
Policing complaints, making up 46.8 percent of the accused while in comparison,
21.8 percent of sworn Department employees are assigned to the general Patrol function.
Employees assigned to Gang Enforcement were the second most numerous, making up
13.2 percent of the accused in the first three quarters of 2017 while 3.4 percent of officers
are assigned to Gang Enforcement. This was followed by employees assigned to Patrol -
Specialized Enforcement8 (11.7 percent of the accused compared to 2.8 percent of the
Department), Traffic Enforcement (7.2 percent of the accused compared to 1.9 percent of
the Department), and Metropolitan Division (4.5 percent of the accused compared to 3.1
percent of the Department).
The current representation of accused employees in the various assignment types is
generally similar to prior years, though their ranking order changes slightly. The table
below summarizes the five assignment types with the most Biased Policing complaints,
based on number of accused employees, from 2015 to the present.
Five assignment types with the most BP complaints, based on number of accused employees
# 2017 (YTD) 2016 2015
1 Patrol 46.8% Patrol 47.2% Patrol 50.1% 2 Gang Enforcement 13.2% Patrol - Spec. Enf. 9.6% Patrol - Spec. Enf. 10.6% 3 Patrol - Spec. Enf. 11.7% Metropolitan Div. 9.4% Gang Enforcement 8.0% 4 Traffic Enforcement 7.2% Gang Enforcement 8.5% Metropolitan Div. 9 5.5% 5 Metropolitan Div. 4.5% Traffic Enforcement 5.9% Traffic Enforcement 4.7%
• A comparison of the number of Biased Policing complaints initiated for each assignment
type against the number of employees in each assignment type in the comparison group
shows that officers assigned to Traffic Enforcement were the subject of the most Biased
Policing complaints during the first three quarters of 2017. Based on the number of
complaints per 100 officers in each assignment type, officers assigned to Traffic
7 The comparison data for the number of employees in each assignment type is based on data from April, 2016.
8 Officers assigned to Patrol - Specialized Enforcement are assigned to patrol duties with a special enforcement
purpose, such as those assigned to the Hollywood Entertainment District or the Safer Cities Initiative.
9 In mid-2015, because of an increase in violent crime, Metropolitan Division was expanded to flexibly deploy
specially trained officers in high crime areas. At the end of 2014, the Department had 255 officers deployed at
Metropolitan Division. By the end of 2015, 471 officers had been assigned to Metropolitan Division. As of April
2016, there were 471 officers deployed to Metropolitan Division, with 388 of them assigned to field operations.
Biased Policing and Mediation Update – 3rd Quarter 2017
Page 5
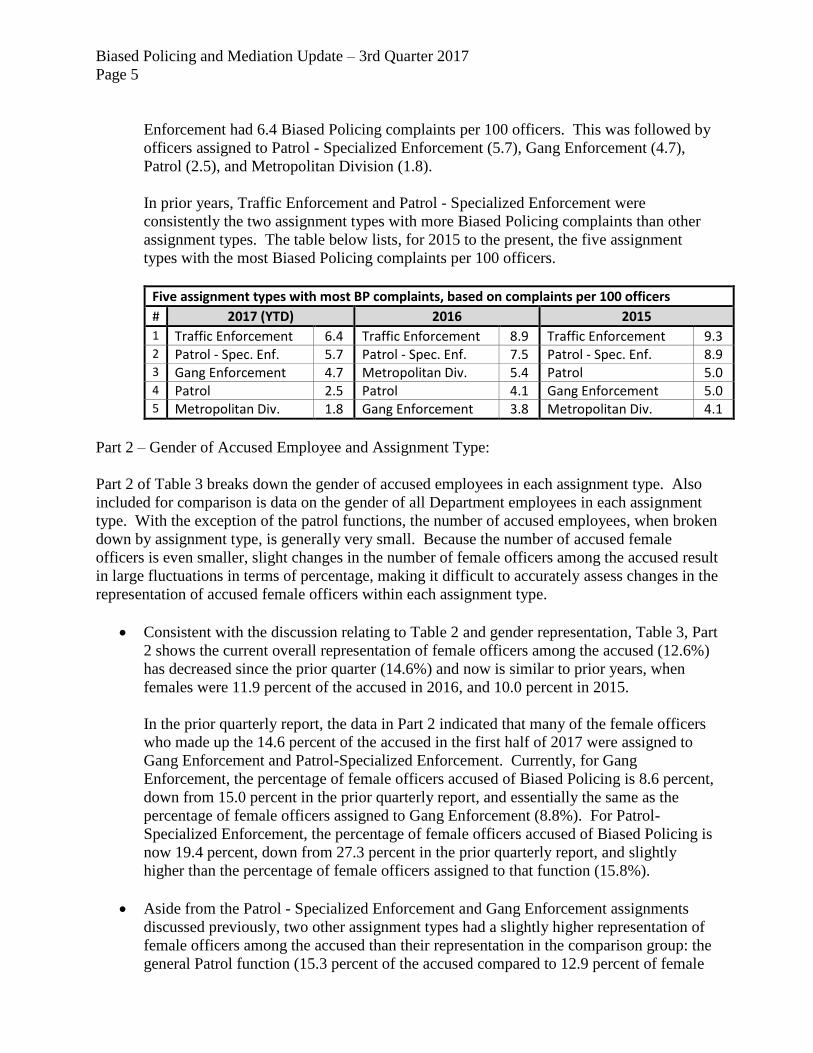
Enforcement had 6.4 Biased Policing complaints per 100 officers. This was followed by
officers assigned to Patrol - Specialized Enforcement (5.7), Gang Enforcement (4.7),
Patrol (2.5), and Metropolitan Division (1.8).
In prior years, Traffic Enforcement and Patrol - Specialized Enforcement were
consistently the two assignment types with more Biased Policing complaints than other
assignment types. The table below lists, for 2015 to the present, the five assignment
types with the most Biased Policing complaints per 100 officers.
Five assignment types with most BP complaints, based on complaints per 100 officers
# 2017 (YTD) 2016 2015
1 Traffic Enforcement 6.4 Traffic Enforcement 8.9 Traffic Enforcement 9.3 2 Patrol - Spec. Enf. 5.7 Patrol - Spec. Enf. 7.5 Patrol - Spec. Enf. 8.9 3 Gang Enforcement 4.7 Metropolitan Div. 5.4 Patrol 5.0 4 Patrol 2.5 Patrol 4.1 Gang Enforcement 5.0 5 Metropolitan Div. 1.8 Gang Enforcement 3.8 Metropolitan Div. 4.1
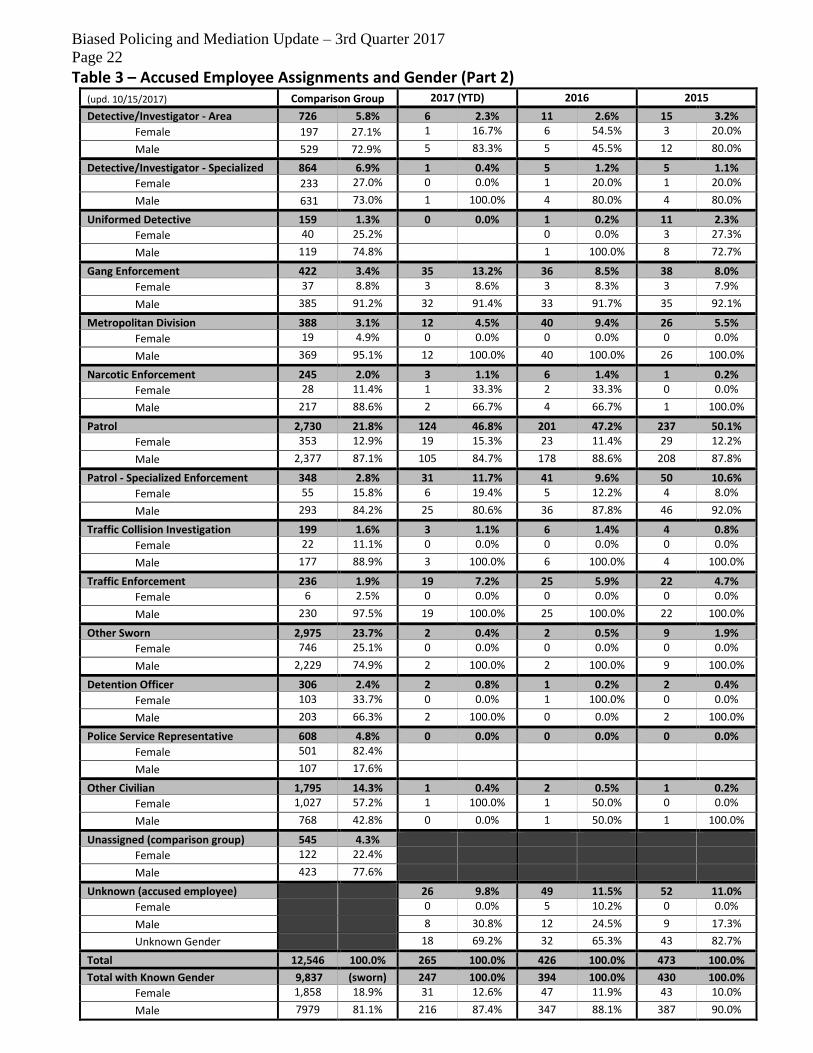
Part 2 – Gender of Accused Employee and Assignment Type:
Part 2 of Table 3 breaks down the gender of accused employees in each assignment type. Also
included for comparison is data on the gender of all Department employees in each assignment
type. With the exception of the patrol functions, the number of accused employees, when broken
down by assignment type, is generally very small. Because the number of accused female
officers is even smaller, slight changes in the number of female officers among the accused result
in large fluctuations in terms of percentage, making it difficult to accurately assess changes in the
representation of accused female officers within each assignment type.
• Consistent with the discussion relating to Table 2 and gender representation, Table 3, Part
2 shows the current overall representation of female officers among the accused (12.6%)
has decreased since the prior quarter (14.6%) and now is similar to prior years, when
females were 11.9 percent of the accused in 2016, and 10.0 percent in 2015.
In the prior quarterly report, the data in Part 2 indicated that many of the female officers
who made up the 14.6 percent of the accused in the first half of 2017 were assigned to
Gang Enforcement and Patrol-Specialized Enforcement. Currently, for Gang
Enforcement, the percentage of female officers accused of Biased Policing is 8.6 percent,
down from 15.0 percent in the prior quarterly report, and essentially the same as the
percentage of female officers assigned to Gang Enforcement (8.8%). For Patrol-
Specialized Enforcement, the percentage of female officers accused of Biased Policing is
now 19.4 percent, down from 27.3 percent in the prior quarterly report, and slightly
higher than the percentage of female officers assigned to that function (15.8%).
• Aside from the Patrol - Specialized Enforcement and Gang Enforcement assignments
discussed previously, two other assignment types had a slightly higher representation of
female officers among the accused than their representation in the comparison group: the
general Patrol function (15.3 percent of the accused compared to 12.9 percent of female
Biased Policing and Mediation Update – 3rd Quarter 2017
Page 6
officers assigned to Patrol), and Narcotic Enforcement (33.3 percent of the accused
compared to 11.4 percent of the Department). It should be noted that for Narcotic
Enforcement, there were only a total of three officers accused of Biased Policing, one of
whom was female.
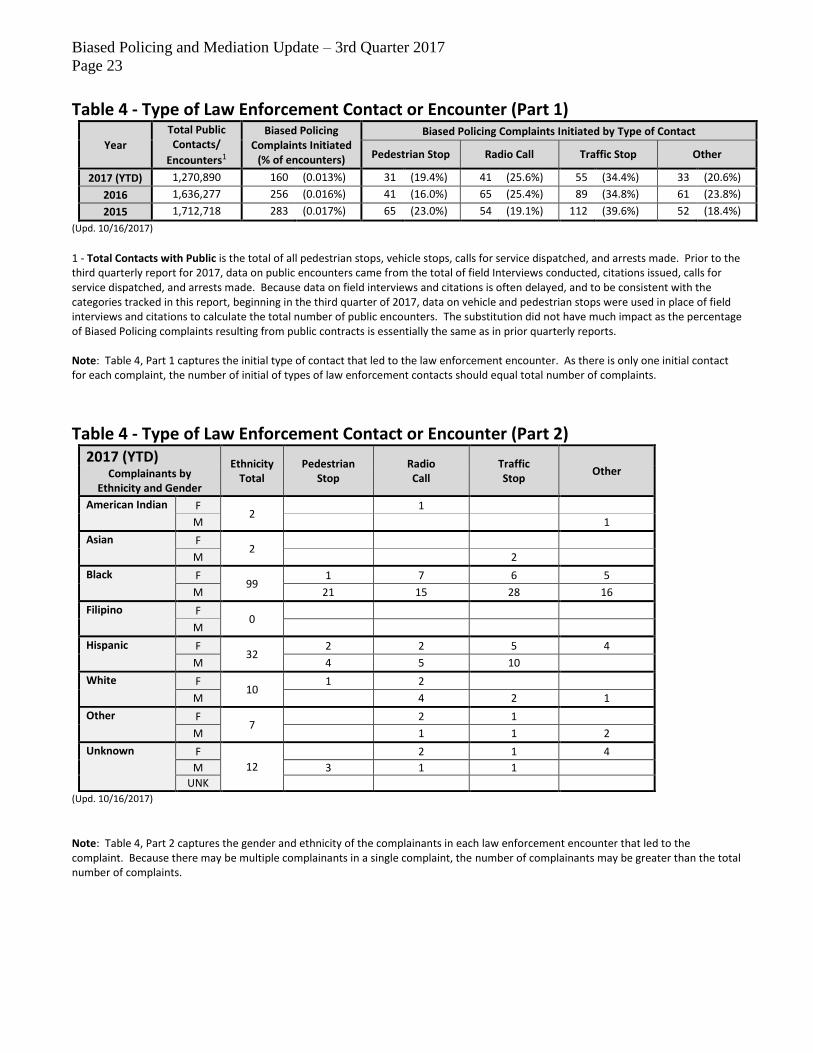
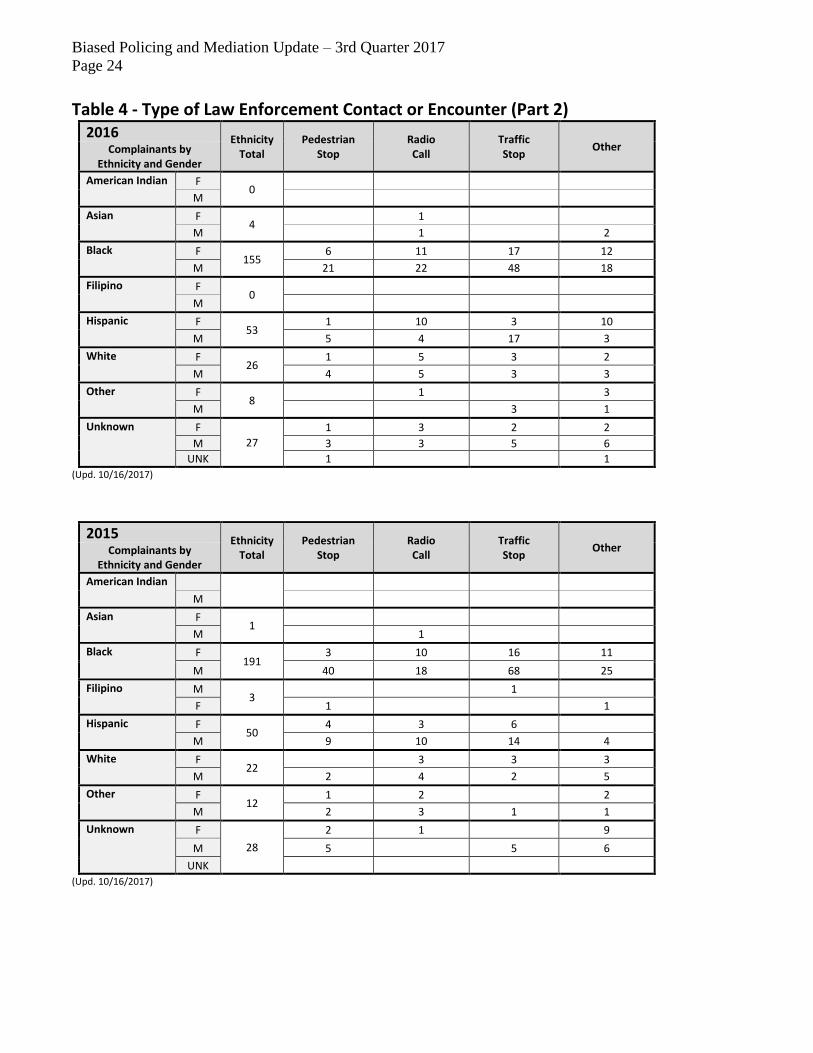
Table 4 shows the types of contact or police encounter that resulted in Biased Policing
complaints along with a breakdown of the complainants by gender and ethnicity. For
comparison, also included is data on the total number of officer contacts with the public and the
percentage of those contacts that resulted in Biased Policing complaints.
• Based on the number of public contacts during the first three quarters of 2017, Biased
Policing complaints were initiated 0.013 percent of the time. This is similar to 2016
(0.016%) and 2015 (0.017%).
• Consistent with prior years, the type of contact that most frequently resulted in Biased
Policing complaints during the first three quarters of 2017 continues to be the traffic stop,
accounting for 55 of the 160 complaints (34.4%) initiated. In 2016, traffic stops
accounted for 34.8 percent of Biased Policing complaints, and in 2015, they accounted
for 39.6 percent of the Biased Policing complaints.
• After traffic stops, radio calls (41) were the next most common, accounting for 25.6
percent of the 160 complaints initiated during the first three quarters of 2017. This was
followed by pedestrian stops (31), accounting for 19.4 percent of the complaints.
• The remaining Biased Policing complaints fall into the generic “Other” category, used for
all other types of contacts. During the first three quarters of 2017, “Other” contacts
accounted for 33 of the 160 complaints (20.6%).10
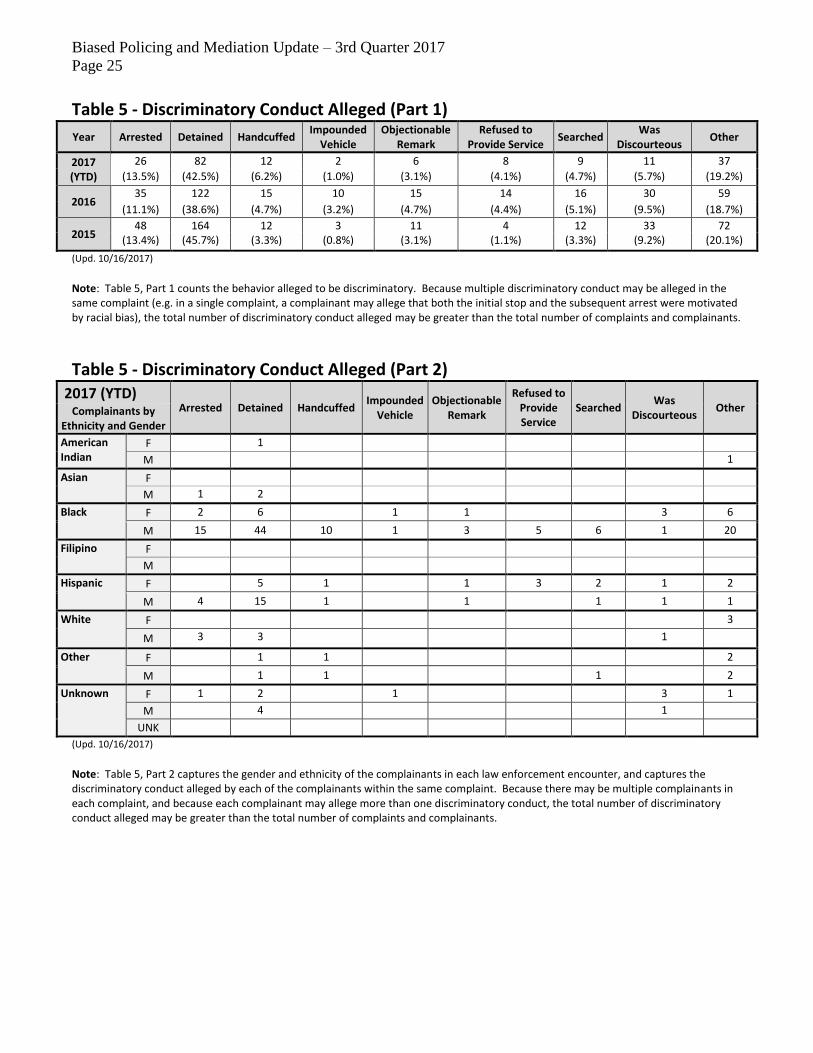
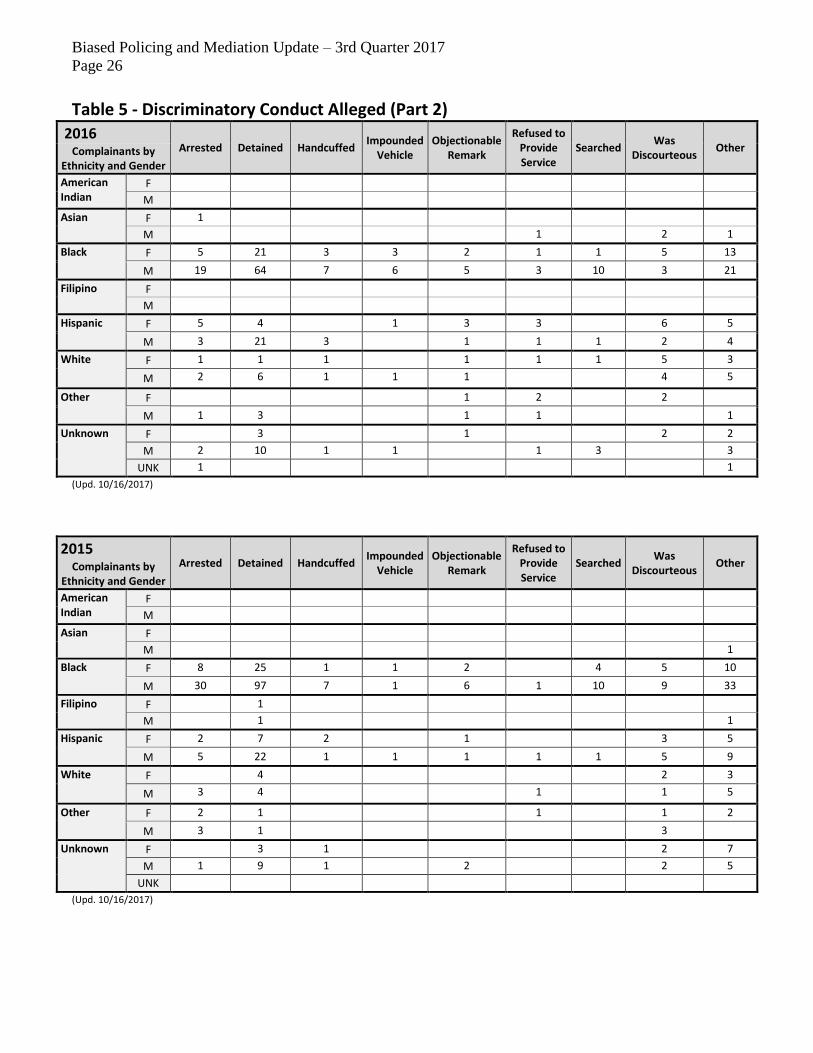
Table 5 shows the distribution of discriminatory conduct reported. This refers to the
law enforcement actions or conduct alleged to have been based on bias. Also included is a
breakdown of complainants by gender and ethnicity.
• In the first three quarters of 2017, the most commonly complained of discriminatory
actions or types of conduct were detentions and arrests. With the exception of the generic
“Other” category,11 this is consistent with the past two years. The remaining types of
allegedly biased conduct appeared less frequently.
10 “Other” types of initial contact in the first nine months of 2017 included the following situations: officers
accompanying other officials on a housing unit check, an officer investigating a crime in which the complainant was
a victim, complainants approaching or flagging down officers, complainants being stopped by officers at security
checkpoints, complainants calling or walking into a police station, a complainant who believed an officer engaged in
Biased Policing after finding a parking ticket on her car, complaints initiated by a third party after witnessing an
incident or hearing an officer testify in court, and situations in which complainants would not specify how they came
into contact with officers.
11 “Other” alleged discriminatory conduct reported in the first nine months of 2017 included: conducting a housing
check, improper investigations, questioning only one person in a group, refusing to release property without proof of
ownership; driving behind the complainant, asking questions about gang membership, not returning a call, issuing
Biased Policing and Mediation Update – 3rd Quarter 2017
Page 7
• Stop/Detention: The most commonly complained of conduct continues to be the stop or
detention itself. During the first three quarters of 2017, it appeared in 82 of the 160
Biased Policing complaints (51.3%) initiated and accounted for 42.5 percent of all
discriminatory conduct alleged. In 2016, it appeared in 122 of the 256 Biased Policing
complaints (47.7%) and in 2015, it appeared in 164 of the 283 complaints (58.0%).
• Arrest: Arrest was the second most complained of conduct during the first three quarters
of 2017. It appeared in 26 of 160 complaints (16.3%) and accounted for 13.5 percent of
all discriminatory conduct alleged. In 2016, arrest appeared in 35 of 256 complaints
(13.7%), and 48 of the 283 complaints (17.0%) in 2015.
• Handcuffed/Discourtesy: Complaints about being handcuffed were the third most
common during the first three quarters of 2017, appearing in 12 of 160 complaints
(7.5%), and accounting for 6.2 percent of discriminatory conduct alleged. This is a
change from prior years, when complaints about handcuffing usually ranked fourth or
fifth in terms of the type of discriminatory conduct alleged.
Discourtesy based on bias, which was usually ranked third in prior years, dropped to
being the fourth most complained of conduct in the first three quarters of 2017, with 11
of the 160 complaints (6.9%) and accounting for 5.7 percent of all discriminatory conduct
alleged. In prior years, when discourtesy was ranked third, it appeared in 30 of 256
complaints (11.7%) in 2016, and in 33 of 283 complaints (11.7%) in 2015.
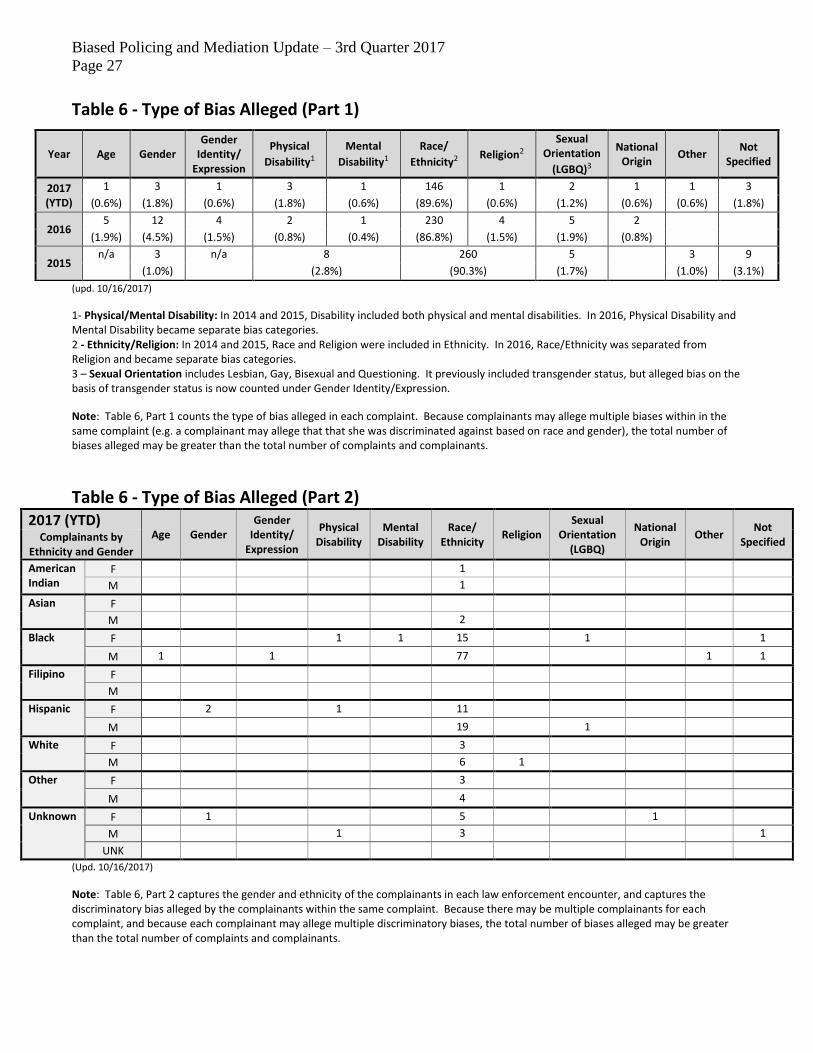
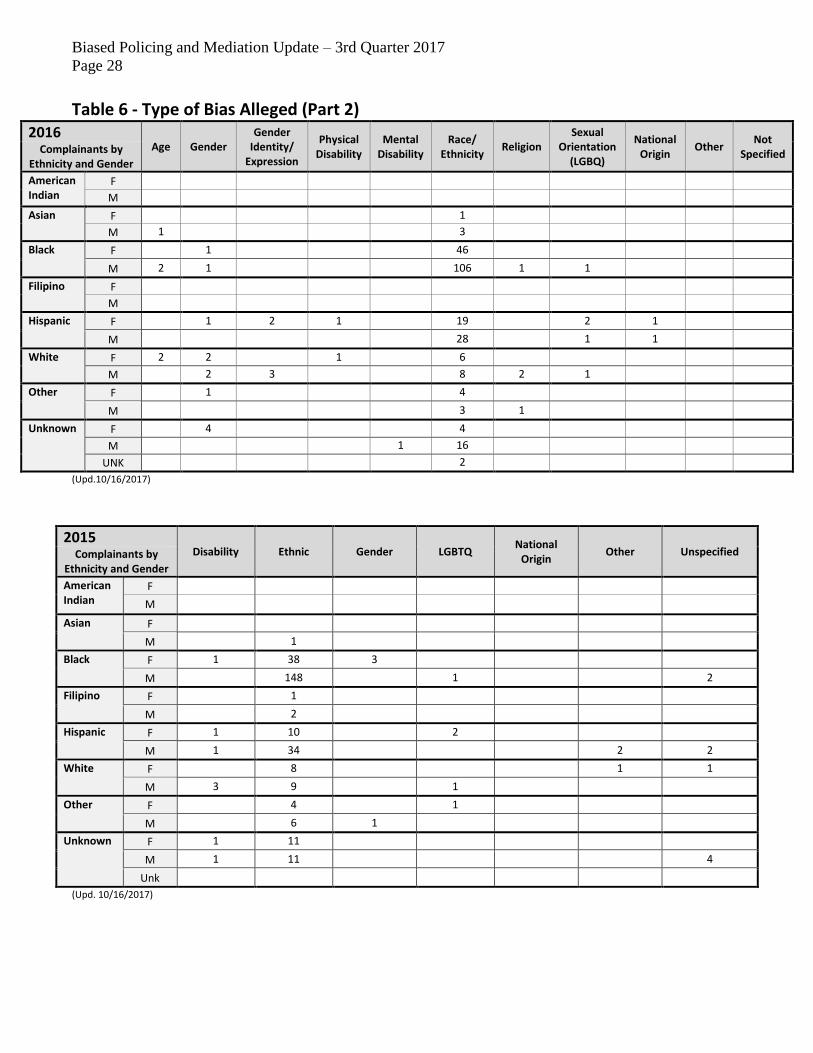
Table 6 shows the types of bias alleged along with a breakdown of complainants by gender and
ethnicity. Effective January 1, 2016, California Penal Code Section 13012 was amended to
require that complaints against peace officers be tracked by specific bias categories. While the
Department already tracked Biased Policing complaints by bias categories, new categories were
added to be consistent with the new law, including: age, gender identity, religion (previously
tracked as part of ethnic bias), physical disability, and mental disability (physical and mental
disabilities were previously tracked under the general category of disability).12
• Racial/Ethnic bias: Complaints of discriminatory conduct based on race/ethnicity are
overwhelmingly the most frequent. During the first three quarters of 2017, 146 of the
160 Biased Policing complaints (91.3%) involved at least one allegation of
discriminatory conduct based on race or ethnicity, accounting for 89.6 percent of all
citations, impounding property, favoring the other party in a dispute, asking the purpose for wanting to see the
Mayor in person, being denied entry into City Hall, being asked about loitering, being told to stop spray painting at a
protest, walking into the complainant’s yard during an investigation, not allowing a lawyer to speak to a suspect
taking a sobriety test, telling the complainant to stay back while conducting a traffic stop with another party, and
complaints in which the behavior was not specified.
12 A category for “Other” bias is included. “Other” biases are included in Biased Policing complaints only if alleged
in combination with ethnic or another categorized bias. During the first three quarters of 2017, one complainant
alleged officers were biased because of the complainant’s age and appearing to be a gang member. This was
classified as “Other.” In the past, “Other” biases included such categories as homelessness, political affiliation,
prior arrests, size, stature, or location of residence.
Biased Policing and Mediation Update – 3rd Quarter 2017
Page 8
biases alleged. In 2016, 230 of the 256 complaints involved an allegation of ethnic bias
(89.8%), accounting for 86.8 percent of all biases alleged. In 2015, when ethnic bias
included religious bias, 260 of the 283 complaints (91.9%) involved at least one
allegation of ethnic or religious bias, accounting for 90.3 percent of all biases alleged.
• Gender bias: In the first three quarters of 2017, three of the 160 Biased Policing
complaints (1.9%) involved an allegation of gender bias, accounting for 1.8 percent of all
biases alleged. This has fluctuated in prior years: in 2016, 12 of 256 complaints (4.7%)
alleged gender bias, while in 2015, three of the 283 complaints (1.1%) involved at least
one allegation of discriminatory conduct based on gender.
• Other biases: Of the 160 Biased Policing complaints received in the first three quarters of
2017, three complaints (1.9%) contained allegations of bias based on physical disability
while mental disability was alleged in one complaint (0.6%). Biases based on sexual
orientation (1.3%), age (0.6%), gender identity/expression (0.6%), and national origin
(0.6%) were also alleged in the first three quarters of 2017.
Ethnic Representation of Complainants: Tables 4, 5 and 6 all show that Black males were the
most numerous demographic group among the complainants, making up 80 of the 164
complainants (48.8%) in the first three quarters of 2017; 109 of the 273 complainants (39.9%) in
2016; and 151 of the 307 (49.2%) in 2015. Their complaints usually resulted from traffic and
pedestrian stops and usually involved allegations that the stop was based on ethnic bias. Also of
note is that while discriminatory searches are not as frequently reported as other conduct,
allegations relating to discriminatory search were often reported by Black male complainants.
Of the complainants who alleged discriminatory searches in the first three quarters of 2017, six
of the ten complainants (60.0%) were Black males. This is similar to 2016 (62.5%) and 2015
(66.7%).
Table 7 compares the ethnicity of complainants, broken down by geographic bureau of
occurrence, against the City’s ethnic composition based on census data from 2010. During the
first three quarters of 2017, Black complainants were the most numerous demographic group.
For complaints in which the Area of occurrence could be determined, 97 (61.8%) of the 157
complainants were Black.13 This number is similar to prior years, when Black complainants
made up 57.1 percent of the complainants in 2016 and 62.6 percent in 2015. In comparison, the
2010 census data shows that only 9.4 percent of the City population is Black.
Table 8 provides a comparison of the ethnicities of accused employees and complainants only for
cases involving alleged ethnic bias. As noted in prior reports, in the majority of cases, Black
complainants accused Hispanic or White employees. This has remained constant since 2015.
13 There were 99 Black complainants in the first three quarters of 2017, but because two of those complainants were
from an Unknown/Outside location, only 97 could be attributed to a specific Area and bureau.
Biased Policing and Mediation Update – 3rd Quarter 2017
Page 9
Adjudication
The Department’s adjudication process begins with the accused employee’s commanding officer
and goes through multiple levels of review. Upon completion of a complaint investigation, the
employee’s commanding officer is responsible for reviewing the investigation, determining
whether misconduct occurred, and recommending the disposition and penalty, if applicable. The
commanding officer submits the investigation and recommendation up the chain-of-command to
the bureau chief.
The bureau chief can concur with the recommendation, or if the bureau chief disagrees with the
recommended adjudication, the bureau chief will prepare correspondence to IAG explaining the
disagreement, the bureau’s recommended adjudication, and the rationale for the bureau
recommendation. This is referred to as a Military Endorsement. With Biased Policing
complaints, if IAG disagrees with the chain-of-command’s recommended adjudication, IAG
forwards the complaint to the office director in the employee’s chain-of-command for a final
disposition. While this is generally the Director of the Office of Operations, when an employee
is assigned to Metropolitan Division, for example, the complaint would be forwarded to the
Director, Office of Special Operations.
For complaints in which the recommended adjudication is to sustain any allegation with a
penalty of an official reprimand or greater, there is an additional level of review. With such
complaints, IAG submits the completed investigation and recommendation to the Chief of Police
for final adjudication.
Consistent with the standards set in place by the Consent Decree in adjudicating complaints,
Department managers must determine by a preponderance of evidence whether misconduct
occurred. Preponderance of evidence means the weight of evidence on one side is more
convincing than the evidence presented for the other side. The Department manager’s
determination must be based on factual, reasonable consideration of the evidence and statements
presented in the investigation.
Under the Department’s long-standing practice, and also consistent with the Consent Decree,
Department managers take into consideration the credibility of a witness or involved party when
deciding if misconduct has been proven by a preponderance of the evidence. In determining
credibility, no automatic preference is given to an officer’s statement over the statement of any
other witness or complainant. An evaluation of credibility must be based on evidence. If
evidence shows that a witness or involved party lacks credibility, such as evidence of false
statements or misrepresentation of facts, a determination may be made that the evidence weighs
in favor of the other side. When a complaint involves conflicting statements from either side, if
credibility cannot be determined, then the Department manager must rely on other evidence to
adjudicate and recommend a disposition for the complaint. The adjudication disposition terms
used in the following discussion are defined below.
An allegation is “Sustained” when the investigation discloses that the act complained of occurred
and constitutes misconduct. When the investigation indicates the act complained of did not
occur, the allegation is “Unfounded.” “Demonstrably False” is used when it is clearly proven an
allegation did not occur because the complainant demonstrates an irrational thought process
Biased Policing and Mediation Update – 3rd Quarter 2017
Page 10
and/or has an established a pattern of making crank complaints; or audio/video evidence
captured the entire incident and conclusively shows the alleged misconduct did not occur.
“Not Resolved” is used when the evidence disclosed by the investigation does not clearly prove
or disprove the allegations made. “Not Resolved” allegations were fully investigated, but
without resolution. An allegation is designated “Insufficient Evidence to Adjudicate” when it
could not be thoroughly or properly investigated. This may be caused by a lack of cooperation
by the complainant or witnesses, or the absence of a critical interview that was necessary to
proceed with the investigation, or the available physical evidence or witnesses’ statements being
insufficient to adjudicate the complaint.
“Guilty” and “Not Guilty” are used following a Board of Rights tribunal. “Not Guilty” may also
be used to denote the final disposition of a complaint in which a Department adjudication of
“Sustained” or a Board of Rights finding of “Guilty” is subsequently overturned, such as by a
court of law. The full range of adjudication dispositions for disciplinary complaints is outlined
in Department Manual Section 3/820.25.
While the Department’s Training Evaluation and Management System tracks all dispositions,
only allegations adjudicated as “Insufficient Evidence to Adjudicate,” “Not Resolved,”
“Sustained,” and “Guilty” can be considered when evaluating an employee’s history for purposes
of disciplinary review.14
Biased Policing Complaints Closed
In contrast to the section on Biased Policing complaints initiated, which was based on
preliminary complaint information, this section, which includes Tables 9 and 10, presents
information on closed complaints drawn from the Complaint Management System.
Table 9, is comprised of two parts. Part 1 provides data on complaints in which officers are
accused of taking law enforcement action based on a prohibited bias category and compares the
adjudication of those Biased Policing allegations in the first three quarters of 2017 to those of the
last three years. Part 2 provides data on sustained complaints that did not allege Biased Policing
per se, but some of the misconduct alleged and sustained by the Department relates to bias.
Part 1 - Closed complaints with allegations of Biased Policing
During the first three quarters of 2017, 206 complaints with 379 Biased Policing allegations were
adjudicated.
• Of 379 Biased Policing allegations adjudicated, 328 allegations (86.5%) were adjudicated
as Unfounded, similar to the three-year average of 82.1 percent.
14 Under California Penal Code Section 832.5(c), complaints and allegations determined to be unfounded may not be
considered for punitive or promotional purposes.
Biased Policing and Mediation Update – 3rd Quarter 2017
Page 11
• Twenty-two allegations (5.8%) closed with the Mediated disposition during the first three
quarters of 2017. The three-year average is 7.9 percent, though the rate has fluctuated.
• Twenty allegations (5.3%) closed with the disposition Insufficient Evidence to
Adjudicate. This is lower than the three-year average (7.6%), but again, the rate has
fluctuated over the years.
• Six allegations (1.6%) closed as Demonstrably False during the first three quarters of
2017.
• Two allegations (0.5%) from one complaint closed in the second quarter as No
Misconduct, but should have been adjudicated as Unfounded instead. Since video of the
incident confirmed a legitimate basis for the police action and there was no evidence
indicating bias, the more appropriate adjudication would have been Unfounded rather
than No Misconduct. However, because of statute deadlines, the dispositions could not
be altered. A memorandum was sent to the commanding officer explaining the rationale.
• One Biased Policing allegation (0.3%) was adjudicated as Not Resolved during the first
three quarters of 2017. The current rate of Not Resolved dispositions is lower than the
three-year average of 2.1 percent.
Part 2 - Closed complaints with sustained allegations related to bias
While the complaints in Part 2 do not contain allegations that officers took law enforcement
action on the basis of a prohibited bias category, the sustained complaints reported in Part 2
reflect conduct that may be indicative of bias.15 Through the third quarter of 2017, there have
been five complaints in which the Department sustained allegations against officers for conduct
that may indicate bias.
Of those five complaints, two closed in the third quarter of 2017. The first complaint included a
sustained allegation of Discourtesy - Ethnic and involved an off-duty officer who used an ethnic
slur during an argument with a girlfriend. Because of other related allegations, the accused
officer was directed to a Board of Rights, which resulted in his termination. The second
complaint involved a sustained allegation for an Improper Remark made by an officer while in
the Area office relating to another officer’s gender. While the subject of the officer’s joke said
she was not offended by the remark, another officer reported it, resulting in an Official
Reprimand for the accused officer.
15 Unlike Part 1, which is a count of allegations, the information in Part 2 is a count of complaints and the discipline
imposed as a result of the complaint. Because complaints often contain multiple allegations, the discipline listed in
Part 2 reflects the discipline for all sustained allegations, not necessarily the discipline imposed for the allegations
indicating possible bias.
Biased Policing and Mediation Update – 3rd Quarter 2017
Page 12
Video in Adjudication of Biased Policing Complaints
Table 10 summarizes whether video/audio recordings were used in adjudicating the Biased
Policing complaints that closed in the first three quarters of 2017 and breaks down the types of
media available to the adjudicator. Of the 206 complaints with Biased Policing allegations that
closed in that time period, about half occurred in geographic Areas in which officers were not
equipped with Body Worn Video (BWV) and/or Digital In-Car Video (DICV). However, for
107 (51.9%) complaints, the adjudicator had access to some type of video and/or audio recording
during adjudication.
Of the 107 Biased Policing complaints with video and/or audio recordings, one complaint did not
go through the adjudication process because it was referred to mediation and closed as Mediated.
The remaining 106 complaints went through the adjudication process during the first three
quarters of 2017. Of those 106 complaints, video and/or audio recordings assisted in the
adjudication of 81 (76.4%) complaints and disproved all allegations in three complaints (2.8%).
One of the three Biased Policing complaints disproved by video this quarter was based on DICV.
Officers stopped to investigate the complainant, who they knew to be on probation, for loitering
in front of a convenience store where the owner had previously complained about loiterers. The
complainant alleged the officers detained him because of his race, poked him in the chest, used
racial slurs, and threatened to kill him. The DICV, which did not substantiate any of his
allegations, showed the complainant yelling racial slurs and threatening to file complaints of
misconduct. The investigation also revealed the complainant had previously filed more than 30
complaints against officers using pre-filled complaint forms containing the same or similar
allegations. The complainant said he uses the pre-filled forms whenever he encounters officers.
None of his prior complaints have been sustained. Because of the video and the complainant’s
history, the complaint was closed as Demonstrably False.
Biased Policing Complaints Referred to the Chain-of-Command Office Director
As previously described, when IAG disagrees with a chain-of-command adjudication for a
Biased Policing complaint, IAG forwards the complaint to the office director in the employee’s
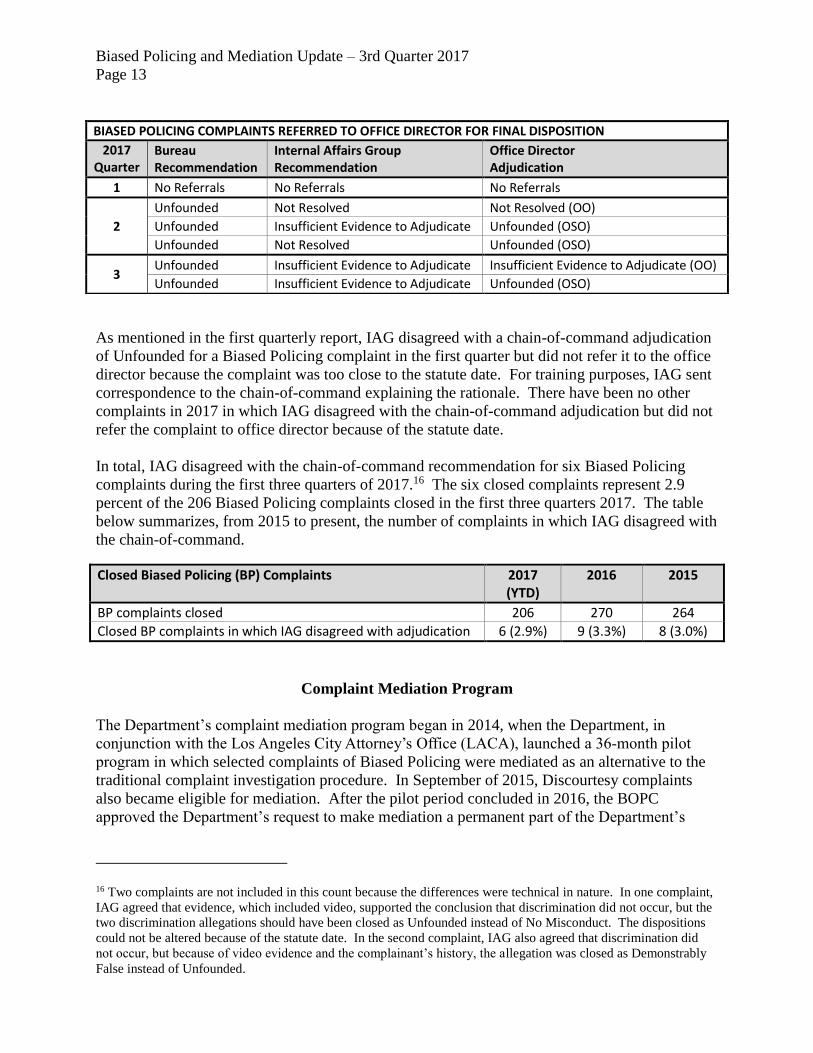
chain-of-command. In the third quarter of 2017, IAG disagreed with the chain-of-command
adjudication for two Biased Policing complaints. One complaint was referred to the Director,
Office of Operations (OO), who agreed with IAG’s recommendation that the Biased Policing
allegations be adjudicated as Insufficient Evidence to Adjudicate. The second complaint was
referred to the Director, Office of Special Operations (OSO), who disagreed with IAG’s
recommendation that the allegations be adjudicated as Insufficient Evidence to Adjudicate. The
allegations were closed as Unfounded. A summary of the dispositions for the complaints
referred to the office directors during the first three quarters of 2017 appears in the table below.
Biased Policing and Mediation Update – 3rd Quarter 2017
Page 13
As mentioned in the first quarterly report, IAG disagreed with a chain-of-command adjudication
of Unfounded for a Biased Policing complaint in the first quarter but did not refer it to the office
director because the complaint was too close to the statute date. For training purposes, IAG sent
correspondence to the chain-of-command explaining the rationale. There have been no other
complaints in 2017 in which IAG disagreed with the chain-of-command adjudication but did not
refer the complaint to office director because of the statute date.
In total, IAG disagreed with the chain-of-command recommendation for six Biased Policing
complaints during the first three quarters of 2017.16 The six closed complaints represent 2.9
percent of the 206 Biased Policing complaints closed in the first three quarters 2017. The table
below summarizes, from 2015 to present, the number of complaints in which IAG disagreed with
the chain-of-command.
Closed Biased Policing (BP) Complaints 2017 (YTD)
2016 2015
BP complaints closed 206 270 264
Closed BP complaints in which IAG disagreed with adjudication 6 (2.9%) 9 (3.3%) 8 (3.0%)
Complaint Mediation Program
The Department’s complaint mediation program began in 2014, when the Department, in
conjunction with the Los Angeles City Attorney’s Office (LACA), launched a 36-month pilot
program in which selected complaints of Biased Policing were mediated as an alternative to the
traditional complaint investigation procedure. In September of 2015, Discourtesy complaints
also became eligible for mediation. After the pilot period concluded in 2016, the BOPC
approved the Department’s request to make mediation a permanent part of the Department’s
16 Two complaints are not included in this count because the differences were technical in nature. In one complaint,
IAG agreed that evidence, which included video, supported the conclusion that discrimination did not occur, but the
two discrimination allegations should have been closed as Unfounded instead of No Misconduct. The dispositions
could not be altered because of the statute date. In the second complaint, IAG also agreed that discrimination did
not occur, but because of video evidence and the complainant’s history, the allegation was closed as Demonstrably
False instead of Unfounded.
BIASED POLICING COMPLAINTS REFERRED TO OFFICE DIRECTOR FOR FINAL DISPOSITION
2017 Quarter
Bureau Recommendation
Internal Affairs Group Recommendation
Office Director Adjudication
1 No Referrals No Referrals No Referrals
2
Unfounded Not Resolved Not Resolved (OO)
Unfounded Insufficient Evidence to Adjudicate Unfounded (OSO)
Unfounded Not Resolved Unfounded (OSO)
3 Unfounded Insufficient Evidence to Adjudicate Insufficient Evidence to Adjudicate (OO)
Unfounded Insufficient Evidence to Adjudicate Unfounded (OSO)
Biased Policing and Mediation Update – 3rd Quarter 2017
Page 14
complaint resolution process, and the name changed to the Community Police Unification
Program (Program) to reflect its expanded scope and goals.
Generally, Biased Policing and Discourtesy complaints with no additional allegations of
misconduct, or only minor additional allegations, may be mediated. The Program guidelines
provide that complaints involving the following situations should not be mediated, though the
Commanding Officer, IAG, makes the final determination of case eligibility:
• Force was used;
• Ethnic remark or other specific discourtesy directed at a class of persons;
• A complainant was arrested;
• An employee was assaulted;
• A lawsuit was filed;
• A person was injured;
• Property was damaged;
• Excessive delay in reporting allegations; and,
• Allegations of criminal misconduct.
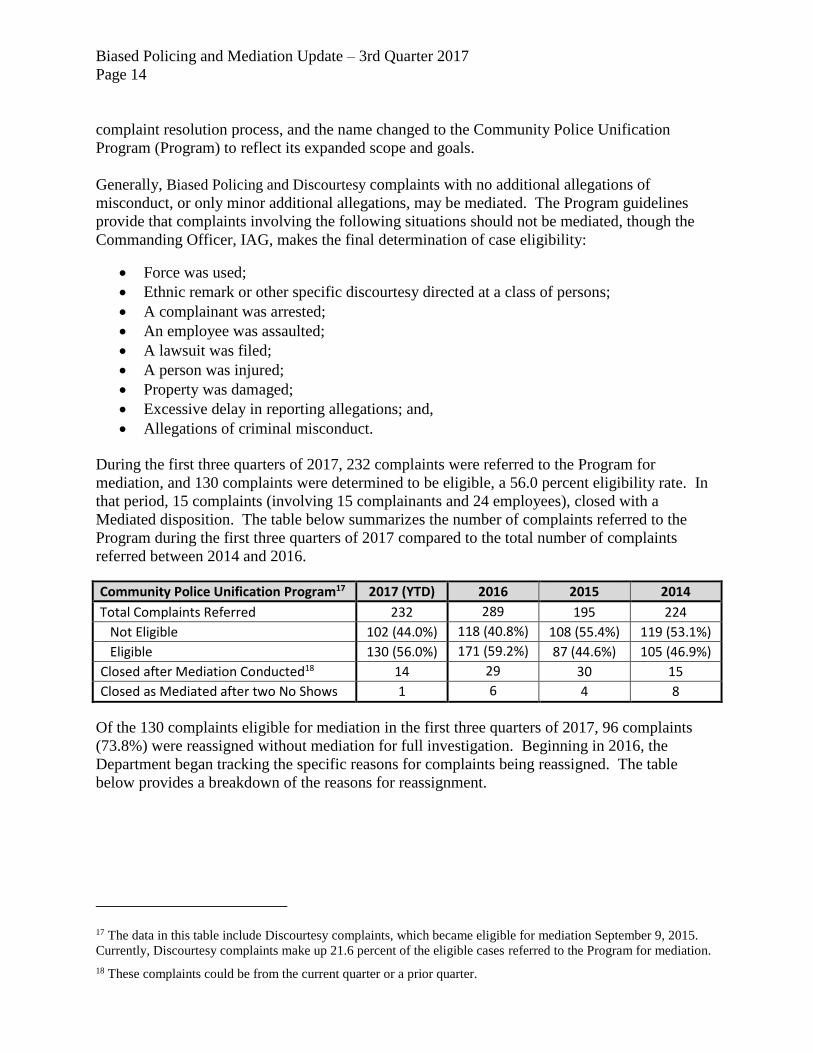
During the first three quarters of 2017, 232 complaints were referred to the Program for
mediation, and 130 complaints were determined to be eligible, a 56.0 percent eligibility rate. In
that period, 15 complaints (involving 15 complainants and 24 employees), closed with a
Mediated disposition. The table below summarizes the number of complaints referred to the
Program during the first three quarters of 2017 compared to the total number of complaints
referred between 2014 and 2016.
Community Police Unification Program17 2017 (YTD) 2016 2015 2014
Total Complaints Referred 232 289 195 224
Not Eligible 102 (44.0%) 118 (40.8%) 108 (55.4%) 119 (53.1%)
Eligible 130 (56.0%) 171 (59.2%) 87 (44.6%) 105 (46.9%)
Closed after Mediation Conducted18 14 29 30 15
Closed as Mediated after two No Shows 1 6 4 8
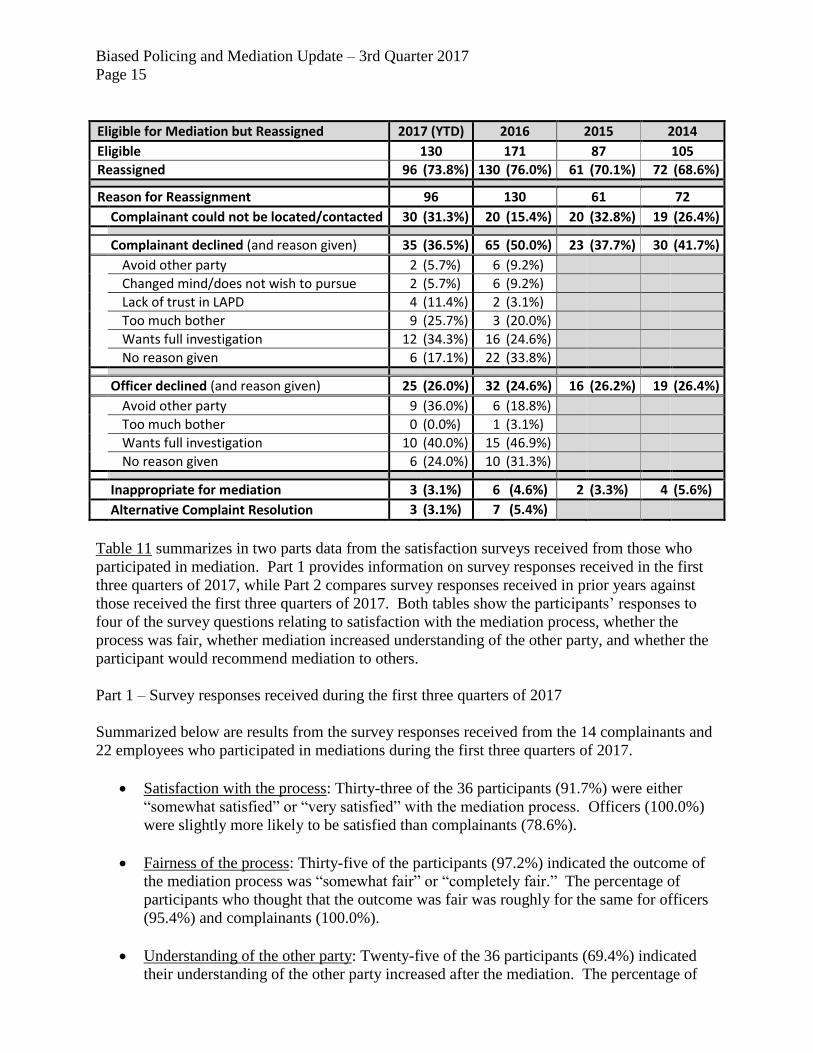
Of the 130 complaints eligible for mediation in the first three quarters of 2017, 96 complaints
(73.8%) were reassigned without mediation for full investigation. Beginning in 2016, the
Department began tracking the specific reasons for complaints being reassigned. The table
below provides a breakdown of the reasons for reassignment.
17 The data in this table include Discourtesy complaints, which became eligible for mediation September 9, 2015.
Currently, Discourtesy complaints make up 21.6 percent of the eligible cases referred to the Program for mediation.
18 These complaints could be from the current quarter or a prior quarter.
Biased Policing and Mediation Update – 3rd Quarter 2017
Page 15
Eligible for Mediation but Reassigned 2017 (YTD) 2016 2015 2014
Eligible 130 171 87 105
Reassigned 96 (73.8%) 130 (76.0%) 61 (70.1%) 72 (68.6%)
Reason for Reassignment 96 130 61 72
Complainant could not be located/contacted 30 (31.3%) 20 (15.4%) 20 (32.8%) 19 (26.4%)
Complainant declined (and reason given) 35 (36.5%) 65 (50.0%) 23 (37.7%) 30 (41.7%)
Avoid other party 2 (5.7%) 6 (9.2%)
Changed mind/does not wish to pursue 2 (5.7%) 6 (9.2%)
Lack of trust in LAPD 4 (11.4%) 2 (3.1%)
Too much bother 9 (25.7%) 3 (20.0%)
Wants full investigation 12 (34.3%) 16 (24.6%)
No reason given 6 (17.1%) 22 (33.8%)
Officer declined (and reason given) 25 (26.0%) 32 (24.6%) 16 (26.2%) 19 (26.4%)
Avoid other party 9 (36.0%) 6 (18.8%)
Too much bother 0 (0.0%) 1 (3.1%)
Wants full investigation 10 (40.0%) 15 (46.9%)
No reason given 6 (24.0%) 10 (31.3%)
Inappropriate for mediation 3 (3.1%) 6 (4.6%) 2 (3.3%) 4 (5.6%)
Alternative Complaint Resolution 3 (3.1%) 7 (5.4%)
Table 11 summarizes in two parts data from the satisfaction surveys received from those who
participated in mediation. Part 1 provides information on survey responses received in the first
three quarters of 2017, while Part 2 compares survey responses received in prior years against
those received the first three quarters of 2017. Both tables show the participants’ responses to
four of the survey questions relating to satisfaction with the mediation process, whether the
process was fair, whether mediation increased understanding of the other party, and whether the
participant would recommend mediation to others.
Part 1 – Survey responses received during the first three quarters of 2017
Summarized below are results from the survey responses received from the 14 complainants and
22 employees who participated in mediations during the first three quarters of 2017.
• Satisfaction with the process: Thirty-three of the 36 participants (91.7%) were either
“somewhat satisfied” or “very satisfied” with the mediation process. Officers (100.0%)
were slightly more likely to be satisfied than complainants (78.6%).
• Fairness of the process: Thirty-five of the participants (97.2%) indicated the outcome of
the mediation process was “somewhat fair” or “completely fair.” The percentage of
participants who thought that the outcome was fair was roughly for the same for officers
(95.4%) and complainants (100.0%).
• Understanding of the other party: Twenty-five of the 36 participants (69.4%) indicated
their understanding of the other party increased after the mediation. The percentage of
Biased Policing and Mediation Update – 3rd Quarter 2017
Page 16
participants who reported an increase in understanding was slightly higher for officers
(72.7%) than for complainants (64.3%).
• Likelihood of recommending to others: Thirty-one of the participants (86.1%) indicated
they were either “somewhat likely” or “very likely” to recommend the mediation process
to others. The percentage of participants who would recommend mediation to others was
higher for officers (95.5%) than it was for complainants (71.4%).
Part 2 – Survey responses received from 2014 through the third quarter of 2017.
Though ratings for the various satisfaction categories have fluctuated since 2014, overall
satisfaction levels remain high for both complainants and officers. The data in Part 2 show the
Program has been well-received and is helping community members and Department employees
develop a better understanding of each other. On average, 86.3 percent of participants since
2014 were satisfied with the process, 93.1 percent believed the outcome to be fair, 69.4 percent
reported an increase in understanding of the other party, and 87.1 percent would recommend
mediation.
Two recently resolved complaints demonstrate how mediation helped participants gain a better
understanding of the other party’s perspective. One complaint involved the victim of a drive-by
shooting who was frustrated that the shooter had not been identified a year later. The
complainant called the assigned detective’s supervisor and said the detective had not put effort
into solving the case because the detective was biased against the complainant, who had changed
gender identity since the shooting. The complainant refused to further discuss the issue unless
the assigned detective was removed from the case. Through mediation, the complainant learned
that gender identity had not been an issue after the detective explained that the crime remained
unsolved because very little evidence had been found at the scene, and no witnesses who could
assist in the investigation had come forward.
The second mediation involved a complainant who believed he was stopped because of his race.
He said he had been stopped three times since he purchased a new car and believed it was
because he is a black man with dreadlocks and was in the Watts area. He said he had been
through the mediation before and expressed an interest in mediating his recent encounter as well.
After mediation, one officer, who was thankful for the opportunity to participate in the Program,
said it was eye-opening and informative to learn the community member’s perspective.
In response to the BOPC’s request to consider expanding the Program to more types of public
complaints, the Mediation Coordinator is working with IAG’s Complaint Classification Unit to
evaluate other types of allegations for mediation. Efforts to make mediation as convenient as
possible for complainants continue. In addition to scheduling mediations in the evenings, on
weekends, and in local libraries, mediation using internet video-conferencing is another option
being considered. Finally, to increase employee awareness, the Mediation Coordinator continues
to conduct training for Department employees at roll calls and other training sites, and is
developing a newsletter to inform employees.
Biased Policing and Mediation Update – 3rd Quarter 2017
Page 17
Sworn Employee Training on Implicit Bias
At the end of March, 2017, the Department began training all sworn employees below the rank
of captain on the subject of implicit bias.19 The mandatory four-hour course, titled “Implicit Bias
and Community Policing,” consists of live instruction designed to expose officers to the concept
of implicit bias, its causes and impact on community policing, and possible solutions. Training
Division reports that as of November 27, 2017, 93.1 percent of officers assigned to the
operational bureaus have completed the course, and overall, 91.9 percent of all officers (which
includes those in administrative assignments) have completed the training.20
19 Training on the subject of implicit bias is already part of the Police Academy curriculum, and command staff
receive training on the subject as part of the Leadership Enhancement and Development Sessions (LEADS).
20 As noted in Table 3, approximately 4.5 percent of Department employees are on leave (e.g. family leave, medical
leave, military leave). Because of this, a 100 percent completion rate is not possible.
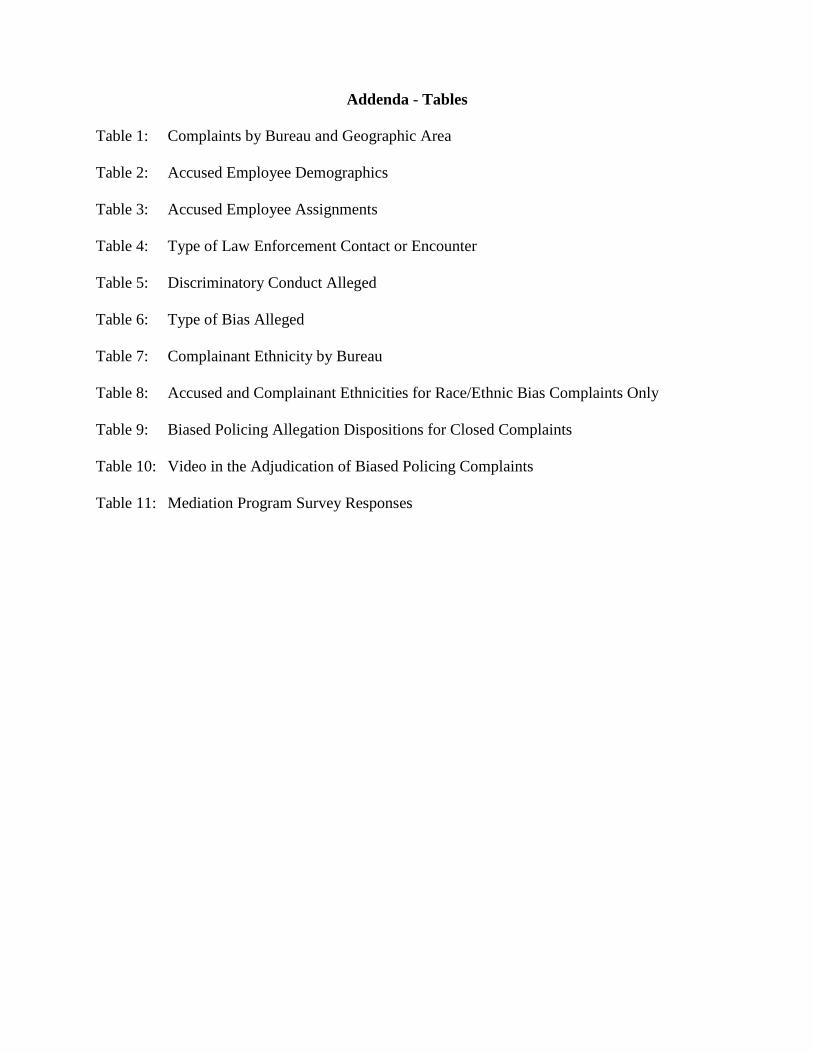
Addenda - Tables
Table 1: Complaints by Bureau and Geographic Area
Table 2: Accused Employee Demographics
Table 3: Accused Employee Assignments
Table 4: Type of Law Enforcement Contact or Encounter
Table 5: Discriminatory Conduct Alleged
Table 6: Type of Bias Alleged
Table 7: Complainant Ethnicity by Bureau
Table 8: Accused and Complainant Ethnicities for Race/Ethnic Bias Complaints Only
Table 9: Biased Policing Allegation Dispositions for Closed Complaints
Table 10: Video in the Adjudication of Biased Policing Complaints
Table 11: Mediation Program Survey Responses
Biased Policing and Mediation Update – 3rd Quarter 2017
Page 18
Table 1 – Complaints by Bureau and Geographic Area
2017 (YTD) 2016 2015 2014 3-Year Avg. (%) (2014-2016) BUREAUS/AREAS Population Complaints Complaints Complaints Complaints
CENTRAL BUREAU 780,269 20.5% 35 21.9% 55 21.5% 68 24.0% 65 22.9% 62.7 22.8%
Central 61,668 1.6% 13 8.1% 19 7.4% 34 12.0% 20 7.0% 24.3 8.9%
Hollenbeck 179,536 4.7% 3 1.9% 7 2.7% 5 1.8% 8 2.8% 6.7 2.4%
Newton 146,201 3.9% 6 3.8% 16 6.3% 18 6.4% 16 5.6% 16.7 6.1%
Northeast 227,903 6.0% 3 1.9% 7 2.7% 2 0.7% 10 3.5% 6.3 2.3%
Rampart 164,961 4.3% 10 6.3% 6 2.3% 9 3.2% 11 3.9% 8.7 3.2%
SOUTH BUREAU 689,238 18.2% 44 27.5% 63 24.6% 80 28.3% 65 22.9% 69.3 25.3%
77th Street 178,933 4.7% 6 3.8% 32 12.5% 24 8.5% 12 4.2% 22.7 8.3%
Harbor 178,163 4.7% 4 2.5% 3 1.2% 5 1.8% 7 2.5% 5.0 1.8%
Southeast 141,371 3.7% 18 11.3% 12 4.7% 19 6.7% 16 5.6% 15.7 5.7%
Southwest 190,771 5.0% 16 10.0% 16 6.3% 32 11.3% 30 10.6% 26.0 9.5%
VALLEY BUREAU 1,427,148 37.6% 30 18.8% 59 23.0% 67 23.7% 75 26.4% 67.0 24.4%
Devonshire 216,499 5.7% 4 2.5% 8 3.1% 12 4.2% 10 3.5% 10.0 3.6%
Foothill 196,513 5.2% 3 1.9% 3 1.2% 6 2.1% 6 2.1% 5.0 1.8%
Mission 244,576 6.4% 4 2.5% 11 4.3% 6 2.1% 12 4.2% 9.7 3.5%
North Hollywood 203,856 5.4% 6 3.8% 11 4.3% 10 3.5% 12 4.2% 11.0 4.0%
Topanga 193,901 5.1% 1 0.6% 14 5.5% 7 2.5% 13 4.6% 11.3 4.1%
Van Nuys 177,918 4.7% 7 4.4% 9 3.5% 17 6.0% 16 5.6% 14.0 5.1%
West Valley 193,885 5.1% 5 3.1% 3 1.2% 9 3.2% 6 2.1% 6.0 2.2%
WEST BUREAU 900,515 23.7% 44 27.5% 72 28.1% 63 22.3% 76 26.8% 70.3 25.6%
Hollywood 128,999 3.4% 16 10.0% 24 9.4% 19 6.7% 17 6.0% 20.0 7.3%
Olympic 186,615 4.9% 6 3.8% 8 3.1% 4 1.4% 14 4.9% 8.7 3.2%
Pacific 203,623 5.4% 10 6.3% 26 10.2% 20 7.1% 20 7.0% 22.0 8.0%
West Los Angeles 230,275 6.1% 4 2.5% 1 0.4% 6 2.1% 9 3.2% 5.3 1.9%
Wilshire 151,003 4.0% 8 5.0% 13 5.1% 14 4.9% 16 5.6% 14.3 5.2%
OUTSIDE CITY/ UNKNOWN LOCATION
NA NA 7 4.4% 7 2.7% 5 1.8% 3 1.1% 5.0 1.8%
TOTAL 3,797,170 160 256 283 284 268.3
(upd. 10/12/2017)
Biased Policing and Mediation Update – 3rd Quarter 2017
Page 19
Table 2 - Accused Employee Demographics (Part 1)
Ethnicity and Gender
(Upd. 10/12/2017)
Note: Table 2 is a count of accused employees. Because a complaint may have multiple accused employees, the total number of accused employees will often be greater than the total number of complaints.
Age at Date of Incident
Age in Years
Year 20-29 30-39 40-49 50/+ Unknown
2017 (YTD) 64 101 56 14 30
2016 77 149 117 34 49
2015 100 176 105 28 64
(Upd. 10/12/2017)
Length of Service at Date of Incident Years of Service
Year 0-4 5-9 10-14 15-19 20/+ Unknown
2017 (YTD) 73 77 39 27 22 27
2016 87 128 59 51 53 48
2015 84 164 63 57 46 59
(Upd. 10/12/2017)
Ethnicity
Year Gender American
Indian Asian Black Filipino Hispanic White Other Unknown
Gender Total
2017 Female 2 1 22 4 2 31
(YTD) Male 17 18 107 70 1 3 216
Unknown 1 1 16 18
Ethnicity Total 0 19 19 0 130 75 3 19 265
2016 Female 4 4 27 11 1 47
Male 2 36 37 161 106 3 2 347
Unknown 32 32
Ethnicity Total 2 40 41 0 188 117 3 35 426
2015 Female 3 3 26 11 43
Male 3 39 34 2 187 113 8 386
Unknown 44 44
Ethnicity Total 3 42 37 2 213 124 0 52 473
Biased Policing and Mediation Update – 3rd Quarter 2017
Page 20
Table 2 - Accused Employee Demographics (Part 2)
Age and Length of Service Comparisons
Comparison Group Accused Employee Percentage
Age in Years Officers Percentage 2017 (YTD) 2016 2015
20-29 757 21.8% 27.2% 20.4% 24.4%
30-39 1501 43.1% 43.0% 39.5% 43.0%
40-49 954 27.4% 23.8% 31.0% 25.7%
50/+ 268 7.7% 6.0% 9.0% 6.8%
(Upd. 10/12/2017)
Years Comparison Group Accused Employee Percentage
of Service Officers Percentage 2017 (YTD) 2016 2015
0-4 799 23.0% 30.7% 23.0% 20.3%
5-9 1348 38.7% 32.4% 33.9% 39.6%
10-14 454 13.0% 16.4% 15.6% 15.2%
15-19 553 15.9% 11.3% 13.5% 13.8%
20/+ 326 9.4% 9.2% 14.0% 11.1%
(Upd. 10/12/2017)
Accused having unknown Age or Years of Service are excluded from the percentage calculations.
Comparison Group – 3480 Police Officers
Rank Officers Percentage Function Officers Percentage
PO 1 250 7.2% Patrol 2829 81.3%
PO 2 2519 72.4% Specialized Enforcement 261 7.5%
PO 3 711 20.4% Traffic 390 11.2%
Biased Policing and Mediation Update – 3rd Quarter 2017
Page 21
Table 3 – Accused Employee Assignments (Part 1)
Comparison
Group 1 2017 (YTD) 2016 2015
Assignment Type # of
Employees # of
Accused # of
Complaints Complaints
per 100 # of
Accused # of
Complaints Complaints
per 100 # of Accused
# of Complaints
Complaints per 100
Detective/Investigator - Area 726 (5.8%) 6 (2.3%) 4 0.6 11 (2.6%) 8 1.1 15 (3.2%) 10 1.4
Detective/Investigator - Specialized 864 (6.9%) 1 (0.4%) 1 0.1 5 (1.2%) 4 0.5 5 (1.1%) 4 0.5
Uniformed Detective 2 159 (1.3%) 1 (0.2%) 1 0.6 11 (2.3%) 6 3.8
Gang Enforcement 422 (3.4%) 35 (13.2%) 20 4.7 36 (8.5%) 16 3.8 38 (8.0%) 21 5.0
Metropolitan Division 3 388 (3.1%) 12 (4.5%) 7 1.8 40 (9.4%) 21 5.4 26 (5.5%) 16 4.1
Narcotics Enforcement 245 (2.0%) 3 (1.1%) 1 0.4 6 (1.4%) 3 1.2 1 (0.2%) 1 0.4
Patrol 2,730 (21.8%) 124 (46.8%) 69 2.5 201 (47.2%) 113 4.1 237 (50.1%) 136 5.0
Patrol - Specialized Enforcement 4 348 (2.8%) 31 (11.7%) 20 5.7 41 (9.6%) 26 7.5 50 (10.6%) 31 8.9
Traffic Collision Investigation 199 (1.6%) 3 (1.1%) 3 1.5 6 (1.4%) 5 2.5 4 (0.8%) 4 2.0
Traffic Enforcement 236 (1.9%) 19 (7.2%) 15 6.4 25 (5.9%) 21 8.9 22 (4.7%) 22 9.3
Other Sworn 5 2,975 (23.7%) 2 (0.8%) 2 0.1 2 (0.5%) 2 0.1 9 (1.9%) 5 0.2
Detention Officer 306 (2.4%) 2 (0.8%) 1 0.3 1 (0.2%) 1 0.3 2 (0.4%) 1 0.3
Police Service Representative 608 (4.8%)
Other Civilian 1,795 (14.3%) 1 (0.4%) 1 0.1 2 (0.5%) 1 0.1 1 (0.2%) 1 0.1
Unassigned 6/Unknown 7 545 (4.3%) 26 (9.8%) 23 4.2 49 (11.5%) 42 7.7 52 (11.0%) 45 8.3
Total 12,546 265 160 8 1.3 426 256 8 2.0 473 283 8 2.3
(Upd. 10/12/2017)
1 - Comparison Group reflects employee data as of April, 2016. 2 - Uniformed Detective refers to officers assigned to specialized uniformed detective functions such as a Parole Compliance Unit, Juvenile Car or School Car. 3 - Metropolitan Division: In mid-2015, because of an increase in violent crime, Metropolitan Division was expanded to flexibly deploy specially trained officers in high crime areas. At the end of 2014, the Department had 255 officers deployed at Metropolitan Division. By the end of 2015, 471 officers had been assigned to Metropolitan Division, an increase of 216 officers from the prior year. Toward the end of the first quarter of 2016, there continued to be 471 officers deployed to Metropolitan Division, with 388 of them assigned to field operations as of April, 2016. 4 - Specialized Enforcement refers to patrol officers assigned to a specific enforcement functions, such as officers assigned to the Hollywood Entertainment District, Safer Cities Initiative, and the Housing Authority City of Los Angeles details. 5 - Other Sworn: In 2017, this included officers assigned to Jail and Security Services Divisions. In 2016, this category included an officer in an administrative assignment, and in 2015, this included officers assigned to Jail Division. 6 - Unassigned refers to employees in the comparison group who are on leave, such as long term military, sick leave or injured on duty status. 7. Unknown refers to those accused in complaints in which there was not enough information to determine the employee’s identity. 8. Total - Number of Complaints counts the actual number of complaints initiated. Because one complaint can involve multiple employees, each with a different assignment, the same complaint may appear in more than one assignment type. As a result, summing up the number of complaints from all the different assignment types may result in a number that is greater than the number of complaints actually initiated. The number listed as the total number of complaints does not count those duplicates.
Biased Policing and Mediation Update – 3rd Quarter 2017
Page 22
Table 3 – Accused Employee Assignments and Gender (Part 2) (upd. 10/15/2017) Comparison Group 2017 (YTD) 2016 2015
Detective/Investigator - Area Area
726 5.8% 6 2.3% 11 2.6% 15 3.2%
Female 197 27.1% 1 16.7% 6 54.5% 3 20.0%
Male 529 72.9% 5 83.3% 5 45.5% 12 80.0%
Detective/Investigator - Specialized
864 6.9% 1 0.4% 5 1.2% 5 1.1%
Female 233 27.0% 0 0.0% 1 20.0% 1 20.0%
Male 631 73.0% 1 100.0% 4 80.0% 4 80.0%
Uniformed Detective 159 1.3% 0 0.0% 1 0.2% 11 2.3%
Female 40 25.2% 0 0.0% 3 27.3%
Male 119 74.8%
1 100.0% 8 72.7%
Gang Enforcement 422 3.4% 35 13.2% 36 8.5% 38 8.0%
Female 37 8.8% 3 8.6% 3 8.3% 3 7.9%
Male 385 91.2% 32 91.4% 33 91.7% 35 92.1%
Metropolitan Division 388 3.1% 12 4.5% 40 9.4% 26 5.5%
Female 19 4.9% 0 0.0% 0 0.0% 0 0.0%
Male 369 95.1% 12 100.0% 40 100.0% 26 100.0%
Narcotic Enforcement 245 2.0% 3 1.1% 6 1.4% 1 0.2%
Female 28 11.4% 1 33.3% 2 33.3% 0 0.0%
Male 217 88.6% 2 66.7% 4 66.7% 1 100.0%
Patrol 2,730 21.8% 124 46.8% 201 47.2% 237 50.1%
Female 353 12.9% 19 15.3% 23 11.4% 29 12.2%
Male 2,377 87.1% 105 84.7% 178 88.6% 208 87.8%
Patrol - Specialized Enforcement 348 2.8% 31 11.7% 41 9.6% 50 10.6%
Female 55 15.8% 6 19.4% 5 12.2% 4 8.0%
Male 293 84.2% 25 80.6% 36 87.8% 46 92.0%
Traffic Collision Investigation 199 1.6% 3 1.1% 6 1.4% 4 0.8%
Female 22 11.1% 0 0.0% 0 0.0% 0 0.0%
Male 177 88.9% 3 100.0% 6 100.0% 4 100.0%
Traffic Enforcement 236 1.9% 19 7.2% 25 5.9% 22 4.7%
Female 6 2.5% 0 0.0% 0 0.0% 0 0.0%
Male 230 97.5% 19 100.0% 25 100.0% 22 100.0%
Other Sworn 2,975 23.7% 2 0.4% 2 0.5% 9 1.9%
Female 746 25.1% 0 0.0% 0 0.0% 0 0.0%
Male 2,229 74.9% 2 100.0% 2 100.0% 9 100.0%
Detention Officer 306 2.4% 2 0.8% 1 0.2% 2 0.4%
Female 103 33.7% 0 0.0% 1 100.0% 0 0.0%
Male 203 66.3% 2 100.0% 0 0.0% 2 100.0%
Police Service Representative 608 4.8% 0 0.0% 0 0.0% 0 0.0%
Female 501 82.4%
Male 107 17.6%
Other Civilian 1,795 14.3% 1 0.4% 2 0.5% 1 0.2%
Female 1,027 57.2% 1 100.0% 1 50.0% 0 0.0%
Male 768 42.8% 0 0.0% 1 50.0% 1 100.0%
Unassigned (comparison group) 545 4.3%
Female 122 22.4%
Male 423 77.6%
Unknown (accused employee) 26 9.8% 49 11.5% 52 11.0%
Female 0 0.0% 5 10.2% 0 0.0%
Male 8 30.8% 12 24.5% 9 17.3%
Unknown Gender 18 69.2% 32 65.3% 43 82.7%
Total 12,546 100.0% 265 100.0% 426 100.0% 473 100.0%
Total with Known Gender 9,837 (sworn) 247 100.0% 394 100.0% 430 100.0%
Female 1,858 18.9% 31 12.6% 47 11.9% 43 10.0%
Male 7979 81.1% 216 87.4% 347 88.1% 387 90.0%
Biased Policing and Mediation Update – 3rd Quarter 2017
Page 23
Table 4 - Type of Law Enforcement Contact or Encounter (Part 1)
Year
Total Public Contacts/
Encounters1
Biased Policing Complaints Initiated
(% of encounters)
Biased Policing Complaints Initiated by Type of Contact
Pedestrian Stop Radio Call Traffic Stop Other
2017 (YTD) 1,270,890 160 (0.013%) 31 (19.4%) 41 (25.6%) 55 (34.4%) 33 (20.6%)
2016 1,636,277 256 (0.016%) 41 (16.0%) 65 (25.4%) 89 (34.8%) 61 (23.8%)
2015 1,712,718 283 (0.017%) 65 (23.0%) 54 (19.1%) 112 (39.6%) 52 (18.4%)
(Upd. 10/16/2017)
1 - Total Contacts with Public is the total of all pedestrian stops, vehicle stops, calls for service dispatched, and arrests made. Prior to the third quarterly report for 2017, data on public encounters came from the total of field Interviews conducted, citations issued, calls for service dispatched, and arrests made. Because data on field interviews and citations is often delayed, and to be consistent with the categories tracked in this report, beginning in the third quarter of 2017, data on vehicle and pedestrian stops were used in place of field interviews and citations to calculate the total number of public encounters. The substitution did not have much impact as the percentage of Biased Policing complaints resulting from public contracts is essentially the same as in prior quarterly reports. Note: Table 4, Part 1 captures the initial type of contact that led to the law enforcement encounter. As there is only one initial contact for each complaint, the number of initial of types of law enforcement contacts should equal total number of complaints.
Table 4 - Type of Law Enforcement Contact or Encounter (Part 2) 2017 (YTD) Ethnicity
Total Pedestrian
Stop Radio Call
Traffic Stop
Other Complainants by Ethnicity and Gender
American Indian F 2
1
M 1
Asian F 2
M 2
Black F 99
1 7 6 5
M 21 15 28 16
Filipino F 0
M
Hispanic F 32
2 2 5 4
M 4 5 10
White F 10
1 2
M 4 2 1
Other F 7
2 1
M 1 1 2
Unknown F
12
2 1 4
M 3 1 1
UNK
(Upd. 10/16/2017)
Note: Table 4, Part 2 captures the gender and ethnicity of the complainants in each law enforcement encounter that led to the complaint. Because there may be multiple complainants in a single complaint, the number of complainants may be greater than the total number of complaints.
Biased Policing and Mediation Update – 3rd Quarter 2017
Page 24
Table 4 - Type of Law Enforcement Contact or Encounter (Part 2)
2016 Ethnicity Total
Pedestrian Stop
Radio Call
Traffic Stop
Other Complainants by Ethnicity and Gender
American Indian F 0
M
Asian F 4
1
M 1 2
Black F 155
6 11 17 12
M 21 22 48 18
Filipino F 0
M
Hispanic F 53
1 10 3 10
M 5 4 17 3
White F 26
1 5 3 2
M 4 5 3 3
Other F 8
1 3
M 3 1
Unknown F
27
1 3 2 2
M 3 3 5 6
UNK 1 1
(Upd. 10/16/2017)
2015 Ethnicity
Total Pedestrian
Stop Radio Call
Traffic Stop
Other Complainants by Ethnicity and Gender
American Indian
M
Asian F 1
M 1
Black F 191
3 10 16 11
M 40 18 68 25
Filipino M 3
1
F 1 1
Hispanic F 50
4 3 6
M 9 10 14 4
White F 22
3 3 3
M 2 4 2 5
Other F 12
1 2 2
M 2 3 1 1
Unknown F
28
2 1 9
M 5 5 6
UNK
(Upd. 10/16/2017)
Biased Policing and Mediation Update – 3rd Quarter 2017
Page 25
Table 5 - Discriminatory Conduct Alleged (Part 1)
Year Arrested Detained Handcuffed Impounded
Vehicle Objectionable
Remark Refused to
Provide Service Searched
Was Discourteous
Other
2017 (YTD)
26 82 12 2 6 8 9 11 37
(13.5%) (42.5%) (6.2%) (1.0%) (3.1%) (4.1%) (4.7%) (5.7%) (19.2%)
2016 35 122 15 10 15 14 16 30 59
(11.1%) (38.6%) (4.7%) (3.2%) (4.7%) (4.4%) (5.1%) (9.5%) (18.7%)
2015 48 164 12 3 11 4 12 33 72
(13.4%) (45.7%) (3.3%) (0.8%) (3.1%) (1.1%) (3.3%) (9.2%) (20.1%)
(Upd. 10/16/2017)
Note: Table 5, Part 1 counts the behavior alleged to be discriminatory. Because multiple discriminatory conduct may be alleged in the same complaint (e.g. in a single complaint, a complainant may allege that both the initial stop and the subsequent arrest were motivated by racial bias), the total number of discriminatory conduct alleged may be greater than the total number of complaints and complainants.
Table 5 - Discriminatory Conduct Alleged (Part 2)
2017 (YTD) Arrested Detained Handcuffed
Impounded Vehicle
Objectionable Remark
Refused to Provide Service
Searched Was
Discourteous Other Complainants by
Ethnicity and Gender
American Indian
F 1
M 1
Asian F
M 1 2
Black F 2 6 1 1 3 6
M 15 44 10 1 3 5 6 1 20
Filipino F
M
Hispanic F 5 1 1 3 2 1 2
M 4 15 1 1 1 1 1
White F 3
M 3 3 1
Other F 1 1 2
M 1 1 1 2
Unknown F 1 2 1 3 1
M 4 1
UNK
(Upd. 10/16/2017)
Note: Table 5, Part 2 captures the gender and ethnicity of the complainants in each law enforcement encounter, and captures the discriminatory conduct alleged by each of the complainants within the same complaint. Because there may be multiple complainants in each complaint, and because each complainant may allege more than one discriminatory conduct, the total number of discriminatory conduct alleged may be greater than the total number of complaints and complainants.
Biased Policing and Mediation Update – 3rd Quarter 2017
Page 26
Table 5 - Discriminatory Conduct Alleged (Part 2)
2016 Arrested Detained Handcuffed
Impounded Vehicle
Objectionable Remark
Refused to Provide Service
Searched Was
Discourteous Other Complainants by
Ethnicity and Gender
American Indian
F
M
Asian F 1
M 1 2 1
Black F 5 21 3 3 2 1 1 5 13
M 19 64 7 6 5 3 10 3 21
Filipino F
M
Hispanic F 5 4 1 3 3 6 5
M 3 21 3 1 1 1 2 4
White F 1 1 1 1 1 1 5 3
M 2 6 1 1 1 4 5
Other F 1 2 2
M 1 3 1 1 1
Unknown F 3 1 2 2
M 2 10 1 1 1 3 3
UNK 1 1
(Upd. 10/16/2017)
2015 Arrested Detained Handcuffed
Impounded Vehicle
Objectionable Remark
Refused to Provide Service
Searched Was
Discourteous Other Complainants by
Ethnicity and Gender
American Indian
F
M
Asian F
M 1
Black F 8 25 1 1 2 4 5 10
M 30 97 7 1 6 1 10 9 33
Filipino F 1
M 1 1
Hispanic F 2 7 2 1 3 5
M 5 22 1 1 1 1 1 5 9
White F 4 2 3
M 3 4 1 1 5
Other F 2 1 1 1 2
M 3 1 3
Unknown F 3 1 2 7
M 1 9 1 2 2 5
UNK
(Upd. 10/16/2017)
Biased Policing and Mediation Update – 3rd Quarter 2017
Page 27
Table 6 - Type of Bias Alleged (Part 1)
(upd. 10/16/2017)
1- Physical/Mental Disability: In 2014 and 2015, Disability included both physical and mental disabilities. In 2016, Physical Disability and Mental Disability became separate bias categories. 2 - Ethnicity/Religion: In 2014 and 2015, Race and Religion were included in Ethnicity. In 2016, Race/Ethnicity was separated from Religion and became separate bias categories. 3 – Sexual Orientation includes Lesbian, Gay, Bisexual and Questioning. It previously included transgender status, but alleged bias on the basis of transgender status is now counted under Gender Identity/Expression.
Note: Table 6, Part 1 counts the type of bias alleged in each complaint. Because complainants may allege multiple biases within in the same complaint (e.g. a complainant may allege that that she was discriminated against based on race and gender), the total number of biases alleged may be greater than the total number of complaints and complainants.
Table 6 - Type of Bias Alleged (Part 2) 2017 (YTD)
Age Gender Gender
Identity/ Expression
Physical Disability
Mental Disability
Race/ Ethnicity
Religion Sexual
Orientation (LGBQ)
National Origin
Other Not
Specified Complainants by Ethnicity and Gender
American Indian
F 1
M 1
Asian F
M 2
Black F 1 1 15 1 1
M 1 1 77 1 1
Filipino F
M
Hispanic F 2 1 11
M 19 1
White F 3
M 6 1
Other F 3
M 4
Unknown F 1 5 1
M 1 3 1
UNK
(Upd. 10/16/2017)
Note: Table 6, Part 2 captures the gender and ethnicity of the complainants in each law enforcement encounter, and captures the discriminatory bias alleged by the complainants within the same complaint. Because there may be multiple complainants for each complaint, and because each complainant may allege multiple discriminatory biases, the total number of biases alleged may be greater than the total number of complaints and complainants.
Year Age Gender Gender
Identity/ Expression
Physical
Disability1
Mental
Disability1
Race/
Ethnicity2 Religion2
Sexual Orientation
(LGBQ)3
National Origin
Other Not
Specified
2017 (YTD)
1 3 1 3 1 146 1 2 1 1 3
(0.6%) (1.8%) (0.6%) (1.8%) (0.6%) (89.6%) (0.6%) (1.2%) (0.6%) (0.6%) (1.8%)
2016 5 12 4 2 1 230 4 5 2
(1.9%) (4.5%) (1.5%) (0.8%) (0.4%) (86.8%) (1.5%) (1.9%) (0.8%)
2015 n/a 3 n/a 8 260 5 3 9
(1.0%) (2.8%) (90.3%) (1.7%) (1.0%) (3.1%)
Biased Policing and Mediation Update – 3rd Quarter 2017
Page 28
Table 6 - Type of Bias Alleged (Part 2)
2016 Age Gender
Gender Identity/
Expression
Physical Disability
Mental Disability
Race/ Ethnicity
Religion Sexual
Orientation (LGBQ)
National Origin
Other Not
Specified Complainants by Ethnicity and Gender
American Indian
F
M
Asian F 1
M 1 3
Black F 1 46
M 2 1 106 1 1
Filipino F
M
Hispanic F 1 2 1 19 2 1
M 28 1 1
White F 2 2 1 6
M 2 3 8 2 1
Other F 1 4
M 3 1
Unknown F 4 4
M 1 16
UNK 2
(Upd.10/16/2017)
2015 Disability Ethnic Gender LGBTQ
National Origin
Other Unspecified Complainants by Ethnicity and Gender
American Indian
F
M
Asian F
M 1
Black F 1 38 3
M 148 1 2
Filipino F 1
M 2
Hispanic F 1 10 2
M 1 34 2 2
White F 8 1 1
M 3 9 1
Other F 4 1
M 6 1
Unknown F 1 11
M 1 11 4
Unk
(Upd. 10/16/2017)
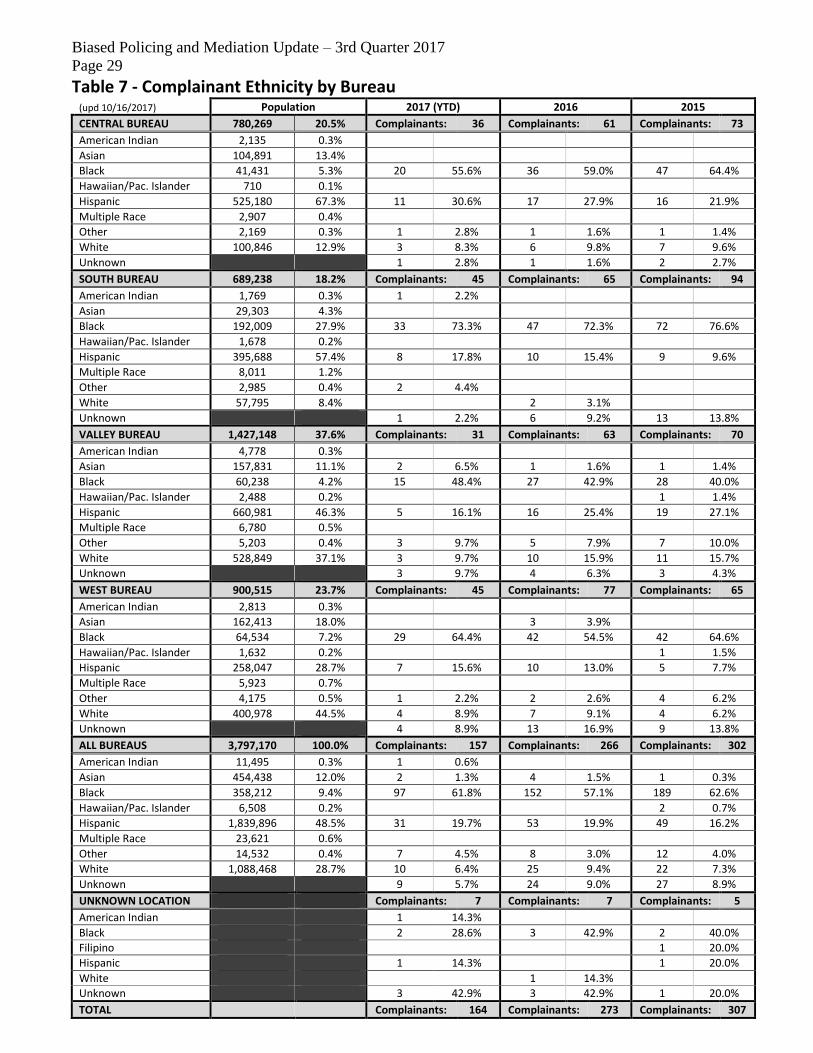
Biased Policing and Mediation Update – 3rd Quarter 2017
Page 29
Table 7 - Complainant Ethnicity by Bureau (upd 10/16/2017) Population 2017 (YTD) 2016 2015
CENTRAL BUREAU 780,269 20.5% Complainants: 36 Complainants: 61 Complainants: 73
American Indian 2,135 0.3%
Asian 104,891 13.4%
Black 41,431 5.3% 20 55.6% 36 59.0% 47 64.4%
Hawaiian/Pac. Islander 710 0.1%
Hispanic 525,180 67.3% 11 30.6% 17 27.9% 16 21.9%
Multiple Race 2,907 0.4%
Other 2,169 0.3% 1 2.8% 1 1.6% 1 1.4%
White 100,846 12.9% 3 8.3% 6 9.8% 7 9.6%
Unknown 1 2.8% 1 1.6% 2 2.7%
SOUTH BUREAU 689,238 18.2% Complainants: 45 Complainants: 65 Complainants: 94
American Indian 1,769 0.3% 1 2.2%
Asian 29,303 4.3%
Black 192,009 27.9% 33 73.3% 47 72.3% 72 76.6%
Hawaiian/Pac. Islander 1,678 0.2%
Hispanic 395,688 57.4% 8 17.8% 10 15.4% 9 9.6%
Multiple Race 8,011 1.2%
Other 2,985 0.4% 2 4.4%
White 57,795 8.4% 2 3.1%
Unknown 1 2.2% 6 9.2% 13 13.8%
VALLEY BUREAU 1,427,148 37.6% Complainants: 31 Complainants: 63 Complainants: 70
American Indian 4,778 0.3%
Asian 157,831 11.1% 2 6.5% 1 1.6% 1 1.4%
Black 60,238 4.2% 15 48.4% 27 42.9% 28 40.0%
Hawaiian/Pac. Islander 2,488 0.2% 1 1.4%
Hispanic 660,981 46.3% 5 16.1% 16 25.4% 19 27.1%
Multiple Race 6,780 0.5%
Other 5,203 0.4% 3 9.7% 5 7.9% 7 10.0%
White 528,849 37.1% 3 9.7% 10 15.9% 11 15.7%
Unknown 3 9.7% 4 6.3% 3 4.3%
WEST BUREAU 900,515 23.7% Complainants: 45 Complainants: 77 Complainants: 65
American Indian 2,813 0.3%
Asian 162,413 18.0% 3 3.9%
Black 64,534 7.2% 29 64.4% 42 54.5% 42 64.6%
Hawaiian/Pac. Islander 1,632 0.2% 1 1.5%
Hispanic 258,047 28.7% 7 15.6% 10 13.0% 5 7.7%
Multiple Race 5,923 0.7%
Other 4,175 0.5% 1 2.2% 2 2.6% 4 6.2%
White 400,978 44.5% 4 8.9% 7 9.1% 4 6.2%
Unknown 4 8.9% 13 16.9% 9 13.8%
ALL BUREAUS 3,797,170 100.0% Complainants: 157 Complainants: 266 Complainants: 302
American Indian 11,495 0.3% 1 0.6%
Asian 454,438 12.0% 2 1.3% 4 1.5% 1 0.3%
Black 358,212 9.4% 97 61.8% 152 57.1% 189 62.6%
Hawaiian/Pac. Islander 6,508 0.2% 2 0.7%
Hispanic 1,839,896 48.5% 31 19.7% 53 19.9% 49 16.2%
Multiple Race 23,621 0.6%
Other 14,532 0.4% 7 4.5% 8 3.0% 12 4.0%
White 1,088,468 28.7% 10 6.4% 25 9.4% 22 7.3%
Unknown 9 5.7% 24 9.0% 27 8.9%
UNKNOWN LOCATION Complainants: 7 Complainants: 7 Complainants: 5
American Indian 1 14.3%
Black 2 28.6% 3 42.9% 2 40.0%
Filipino 1 20.0%
Hispanic 1 14.3% 1 20.0%
White 1 14.3%
Unknown 3 42.9% 3 42.9% 1 20.0%
TOTAL Complainants: 164 Complainants: 273 Complainants: 307
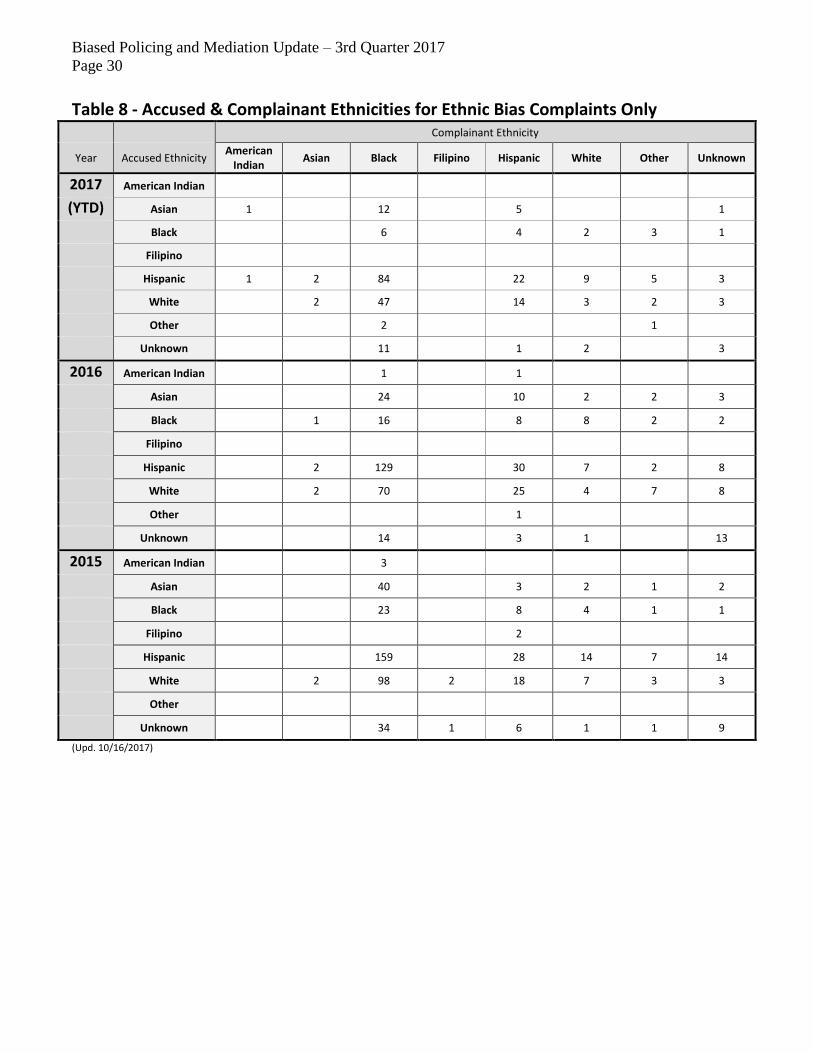
Biased Policing and Mediation Update – 3rd Quarter 2017
Page 30
Table 8 - Accused & Complainant Ethnicities for Ethnic Bias Complaints Only
Complainant Ethnicity
Year Accused Ethnicity American
Indian Asian Black Filipino Hispanic White Other Unknown
2017 American Indian
(YTD) Asian 1 12 5 1
Black 6 4 2 3 1
Filipino
Hispanic 1 2 84 22 9 5 3
White 2 47 14 3 2 3
Other 2 1
Unknown 11 1 2 3
2016 American Indian 1 1
Asian 24 10 2 2 3
Black 1 16 8 8 2 2
Filipino
Hispanic 2 129 30 7 2 8
White 2 70 25 4 7 8
Other 1
Unknown 14 3 1 13
2015 American Indian 3
Asian 40 3 2 1 2
Black 23 8 4 1 1
Filipino 2
Hispanic 159 28 14 7 14
White 2 98 2 18 7 3 3
Other
Unknown 34 1 6 1 1 9
(Upd. 10/16/2017)
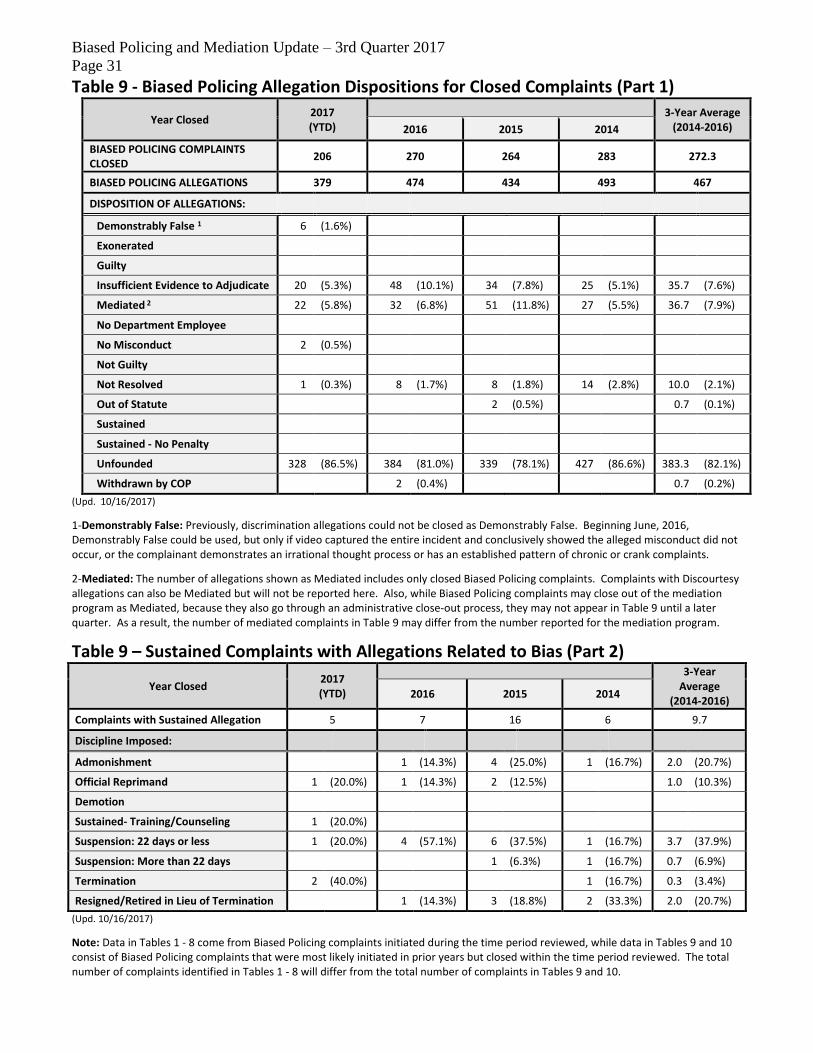
Biased Policing and Mediation Update – 3rd Quarter 2017
Page 31
Table 9 - Biased Policing Allegation Dispositions for Closed Complaints (Part 1)
Year Closed 2017 (YTD)
3-Year Average (2014-2016) 2016 2015 2014
BIASED POLICING COMPLAINTS CLOSED
206 270 264 283 272.3
BIASED POLICING ALLEGATIONS 379 474 434 493 467
DISPOSITION OF ALLEGATIONS:
Demonstrably False 1 6 (1.6%)
Exonerated
Guilty
Insufficient Evidence to Adjudicate 20 (5.3%) 48 (10.1%) 34 (7.8%) 25 (5.1%) 35.7 (7.6%)
Mediated 2 22 (5.8%) 32 (6.8%) 51 (11.8%) 27 (5.5%) 36.7 (7.9%)
No Department Employee
No Misconduct 2 (0.5%)
Not Guilty
Not Resolved 1 (0.3%) 8 (1.7%) 8 (1.8%) 14 (2.8%) 10.0 (2.1%)
Out of Statute 2 (0.5%) 0.7 (0.1%)
Sustained
Sustained - No Penalty
Unfounded 328 (86.5%) 384 (81.0%) 339 (78.1%) 427 (86.6%) 383.3 (82.1%)
Withdrawn by COP 2 (0.4%) 0.7 (0.2%)
(Upd. 10/16/2017)
1-Demonstrably False: Previously, discrimination allegations could not be closed as Demonstrably False. Beginning June, 2016, Demonstrably False could be used, but only if video captured the entire incident and conclusively showed the alleged misconduct did not occur, or the complainant demonstrates an irrational thought process or has an established pattern of chronic or crank complaints.
2-Mediated: The number of allegations shown as Mediated includes only closed Biased Policing complaints. Complaints with Discourtesy allegations can also be Mediated but will not be reported here. Also, while Biased Policing complaints may close out of the mediation program as Mediated, because they also go through an administrative close-out process, they may not appear in Table 9 until a later quarter. As a result, the number of mediated complaints in Table 9 may differ from the number reported for the mediation program.
Table 9 – Sustained Complaints with Allegations Related to Bias (Part 2)
Year Closed 2017 (YTD)
3-Year Average
(2014-2016) 2016 2015 2014
Complaints with Sustained Allegation 5 7 16 6 9.7
Discipline Imposed:
Admonishment 1 (14.3%) 4 (25.0%) 1 (16.7%) 2.0 (20.7%)
Official Reprimand 1 (20.0%) 1 (14.3%) 2 (12.5%) 1.0 (10.3%)
Demotion
Sustained- Training/Counseling 1 (20.0%)
Suspension: 22 days or less 1 (20.0%) 4 (57.1%) 6 (37.5%) 1 (16.7%) 3.7 (37.9%)
Suspension: More than 22 days 1 (6.3%) 1 (16.7%) 0.7 (6.9%)
Termination 2 (40.0%) 1 (16.7%) 0.3 (3.4%)
Resigned/Retired in Lieu of Termination 1 (14.3%) 3 (18.8%) 2 (33.3%) 2.0 (20.7%)
(Upd. 10/16/2017)
Note: Data in Tables 1 - 8 come from Biased Policing complaints initiated during the time period reviewed, while data in Tables 9 and 10 consist of Biased Policing complaints that were most likely initiated in prior years but closed within the time period reviewed. The total number of complaints identified in Tables 1 - 8 will differ from the total number of complaints in Tables 9 and 10.
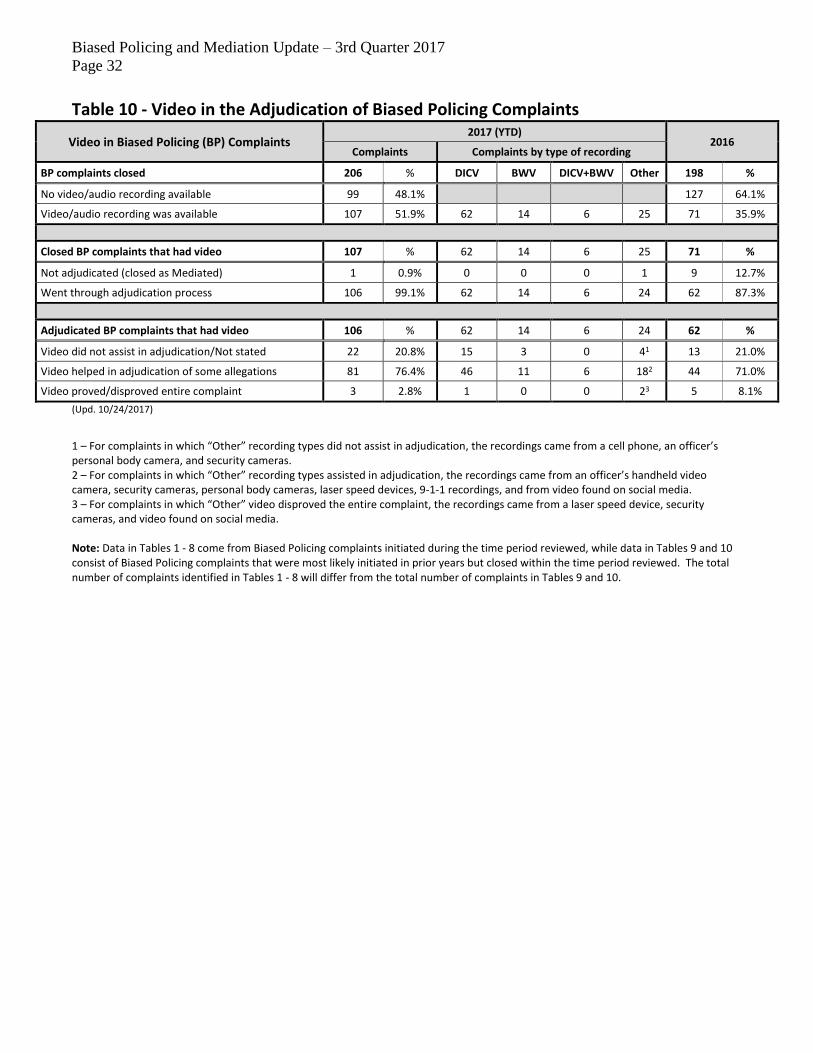
Biased Policing and Mediation Update – 3rd Quarter 2017
Page 32
Table 10 - Video in the Adjudication of Biased Policing Complaints
Video in Biased Policing (BP) Complaints 2017 (YTD)
2016 Complaints Complaints by type of recording
BP complaints closed 206 % DICV BWV DICV+BWV Other 198 %
No video/audio recording available 99 48.1% 127 64.1%
Video/audio recording was available 107 51.9% 62 14 6 25 71 35.9%
Closed BP complaints that had video 107 % 62 14 6 25 71 %
Not adjudicated (closed as Mediated) 1 0.9% 0 0 0 1 9 12.7%
Went through adjudication process 106 99.1% 62 14 6 24 62 87.3%
Adjudicated BP complaints that had video 106 % 62 14 6 24 62 %
Video did not assist in adjudication/Not stated 22 20.8% 15 3 0 41 13 21.0%
Video helped in adjudication of some allegations 81 76.4% 46 11 6 182 44 71.0%
Video proved/disproved entire complaint 3 2.8% 1 0 0 23 5 8.1%
(Upd. 10/24/2017)
1 – For complaints in which “Other” recording types did not assist in adjudication, the recordings came from a cell phone, an officer’s personal body camera, and security cameras. 2 – For complaints in which “Other” recording types assisted in adjudication, the recordings came from an officer’s handheld video camera, security cameras, personal body cameras, laser speed devices, 9-1-1 recordings, and from video found on social media. 3 – For complaints in which “Other” video disproved the entire complaint, the recordings came from a laser speed device, security cameras, and video found on social media. Note: Data in Tables 1 - 8 come from Biased Policing complaints initiated during the time period reviewed, while data in Tables 9 and 10 consist of Biased Policing complaints that were most likely initiated in prior years but closed within the time period reviewed. The total number of complaints identified in Tables 1 - 8 will differ from the total number of complaints in Tables 9 and 10.
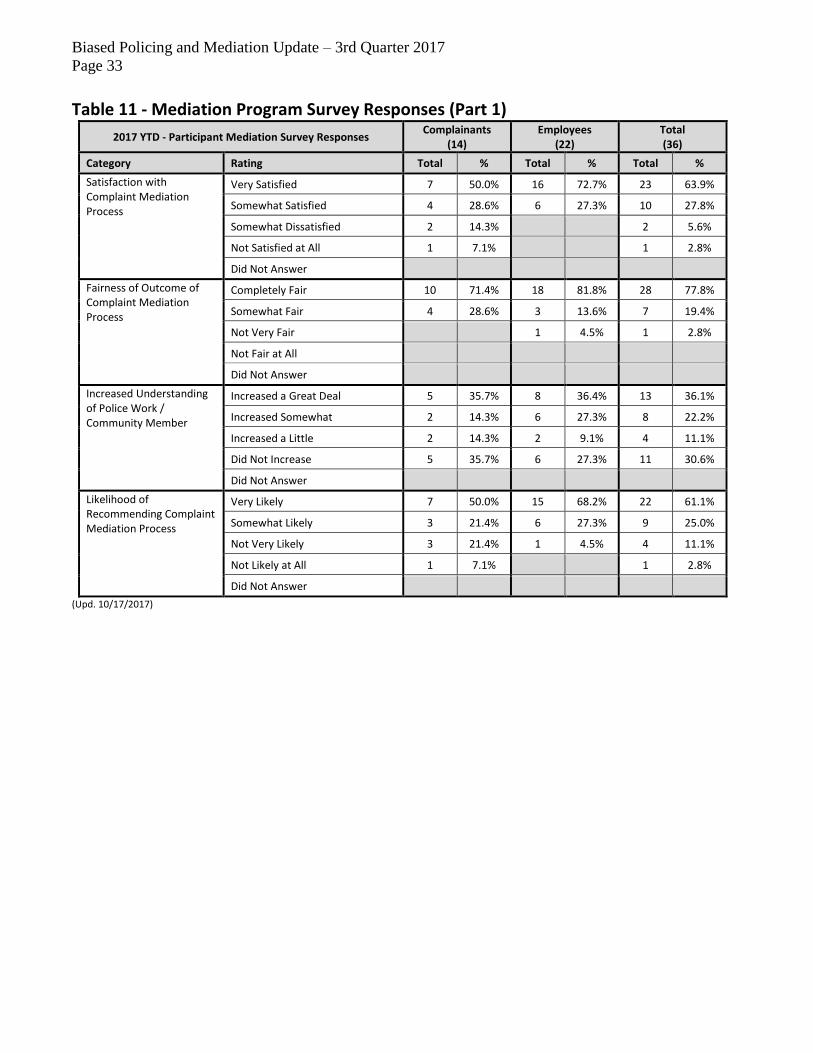
Biased Policing and Mediation Update – 3rd Quarter 2017
Page 33
Table 11 - Mediation Program Survey Responses (Part 1)
2017 YTD - Participant Mediation Survey Responses Complainants
(14) Employees
(22) Total (36)
Category Rating Total % Total % Total %
Satisfaction with Complaint Mediation Process
Very Satisfied 7 50.0% 16 72.7% 23 63.9%
Somewhat Satisfied 4 28.6% 6 27.3% 10 27.8%
Somewhat Dissatisfied 2 14.3% 2 5.6%
Not Satisfied at All 1 7.1% 1 2.8%
Did Not Answer
Fairness of Outcome of Complaint Mediation Process
Completely Fair 10 71.4% 18 81.8% 28 77.8%
Somewhat Fair 4 28.6% 3 13.6% 7 19.4%
Not Very Fair 1 4.5% 1 2.8%
Not Fair at All
Did Not Answer
Increased Understanding of Police Work / Community Member
Increased a Great Deal 5 35.7% 8 36.4% 13 36.1%
Increased Somewhat 2 14.3% 6 27.3% 8 22.2%
Increased a Little 2 14.3% 2 9.1% 4 11.1%
Did Not Increase 5 35.7% 6 27.3% 11 30.6%
Did Not Answer
Likelihood of Recommending Complaint Mediation Process
Very Likely 7 50.0% 15 68.2% 22 61.1%
Somewhat Likely 3 21.4% 6 27.3% 9 25.0%
Not Very Likely 3 21.4% 1 4.5% 4 11.1%
Not Likely at All 1 7.1% 1 2.8%
Did Not Answer
(Upd. 10/17/2017)
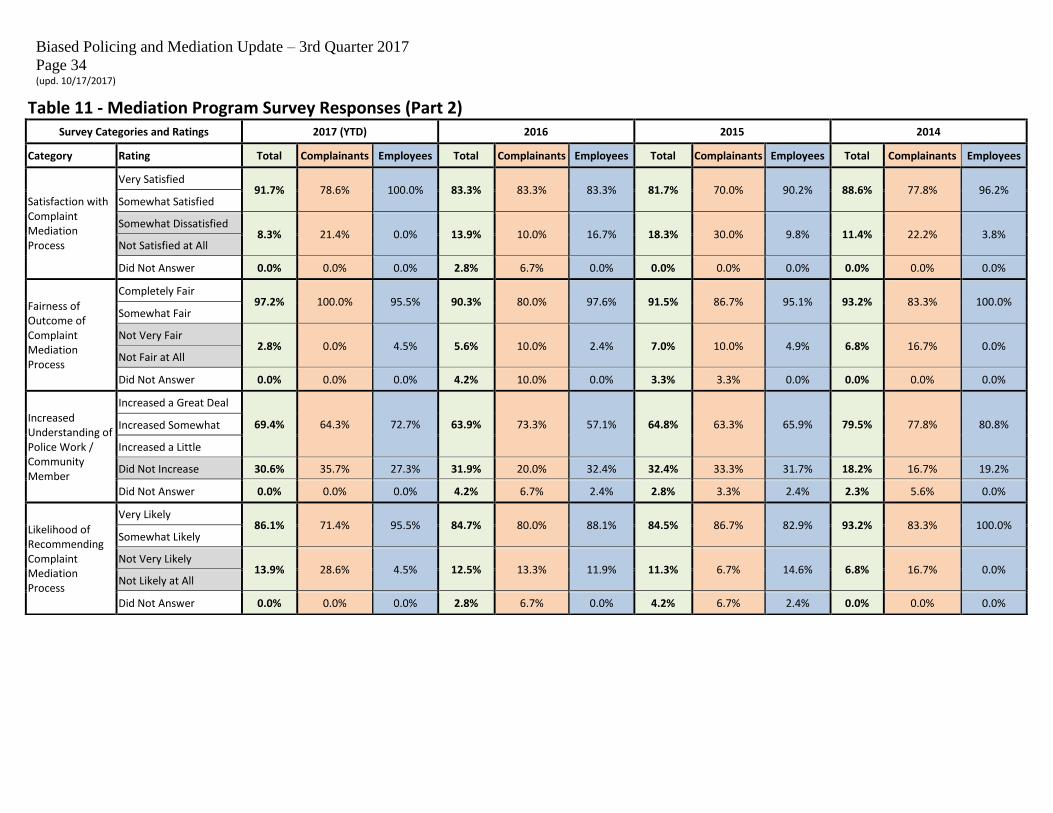
Biased Policing and Mediation Update – 3rd Quarter 2017
Page 34 (upd. 10/17/2017)
Table 11 - Mediation Program Survey Responses (Part 2) Survey Categories and Ratings 2017 (YTD) 2016 2015 2014
Category Rating Total Complainants Employees Total Complainants Employees Total Complainants Employees Total Complainants Employees
Satisfaction with Complaint Mediation Process
Very Satisfied 91.7% 78.6% 100.0% 83.3% 83.3% 83.3% 81.7% 70.0% 90.2% 88.6% 77.8% 96.2%
Somewhat Satisfied
Somewhat Dissatisfied 8.3% 21.4% 0.0% 13.9% 10.0% 16.7% 18.3% 30.0% 9.8% 11.4% 22.2% 3.8%
Not Satisfied at All
Did Not Answer 0.0% 0.0% 0.0% 2.8% 6.7% 0.0% 0.0% 0.0% 0.0% 0.0% 0.0% 0.0%
Fairness of Outcome of Complaint Mediation Process
Completely Fair 97.2% 100.0% 95.5% 90.3% 80.0% 97.6% 91.5% 86.7% 95.1% 93.2% 83.3% 100.0%
Somewhat Fair
Not Very Fair 2.8% 0.0% 4.5% 5.6% 10.0% 2.4% 7.0% 10.0% 4.9% 6.8% 16.7% 0.0%
Not Fair at All
Did Not Answer 0.0% 0.0% 0.0% 4.2% 10.0% 0.0% 3.3% 3.3% 0.0% 0.0% 0.0% 0.0%
Increased Understanding of Police Work / Community Member
Increased a Great Deal
69.4% 64.3% 72.7% 63.9% 73.3% 57.1% 64.8% 63.3% 65.9% 79.5% 77.8% 80.8% Increased Somewhat
Increased a Little
Did Not Increase 30.6% 35.7% 27.3% 31.9% 20.0% 32.4% 32.4% 33.3% 31.7% 18.2% 16.7% 19.2%
Did Not Answer 0.0% 0.0% 0.0% 4.2% 6.7% 2.4% 2.8% 3.3% 2.4% 2.3% 5.6% 0.0%
Likelihood of Recommending Complaint Mediation Process
Very Likely 86.1% 71.4% 95.5% 84.7% 80.0% 88.1% 84.5% 86.7% 82.9% 93.2% 83.3% 100.0%
Somewhat Likely
Not Very Likely 13.9% 28.6% 4.5% 12.5% 13.3% 11.9% 11.3% 6.7% 14.6% 6.8% 16.7% 0.0%
Not Likely at All
Did Not Answer 0.0% 0.0% 0.0% 2.8% 6.7% 0.0% 4.2% 6.7% 2.4% 0.0% 0.0% 0.0%