bhutan national human development REPORT 2000 · bhutan national human development ... Access to...
66
bhutan national human development Report 2000 Royal Government of Bhutan bhutan national human development gross national happiness and human development - searching for common ground REPORT 2000
Transcript of bhutan national human development REPORT 2000 · bhutan national human development ... Access to...

bhutannational hum
andevelopm
entReport
2000Royal Governm
entof Bhutan
bhutan national human development
gross national happiness and human development - searching for common groundREPORT 2000

bhutan national human development
gross national happiness and human development - searching for common groundREPORT 2000
Planning CommissionRoyal Government of Bhutan

Gross national happiness and human development
REPORT 2000bhutan national human development
2
© 2000The Planning Commission SecretariatRoyal Government of Bhutan
Design and Production Jacqui ShearmanPhotograpic contributions from H.E. Lyonpo Sangay Ngedup,Stefan Priesner, Yasushi Yuge, Frank Jensen.Printed by Keen Publishing, Thailand.

Searching for common ground
bhutan national human developmentREPORT 2000
3
“Gross National
Happiness is more
important than
Gross National
Product”
His Majesty the King

Gross national happiness and human development
REPORT 2000bhutan national human development
4
TABLE OF CONTENTS1. THE STATE OF HUMAN DEVELOPMENT 10
Early History 10Human Development and Human Progress 11Indicators of Human Development 13
Life Expectancy 14Infant Mortality 14Adult Literacy 15Income 16
Bhutan’s Human Development Index 18Expanding Gross National Happiness 18The Constituents of Happiness 20
2. HUMAN DEVELOPMENT SINCE 1960 24Expanding Opportunities 25Access to Jobs and Sources of Livelihood 25Access to Basic Health 27Access to Safe Drinking Water 29Access to Basic Education 29Setback to Human Development 31Gender Equality 32Governance and Decentralization 34
3. ECONOMIC GROWTH AND HUMAN DEVELOPMENT 38Growth-Mediated Security 38Financing of Development 41Preventing Rather Than Correcting Market Failures 42
4. CHALLENGES AND OPPORTUNITIES 46Population Growth 46Education and Employment of Women 47Rising Aspirations of the Educated Youth 47Encouraging the Growth of the Private Sector 47Redefining the Role of the Government 48Rapid Urbanization and Migration from Rural Areas 48Rural Development 49Environmental Conservation 49Cultural Identity and Traditional Values 50
Searching for common ground
bhutan national human developmentREPORT 2000
5
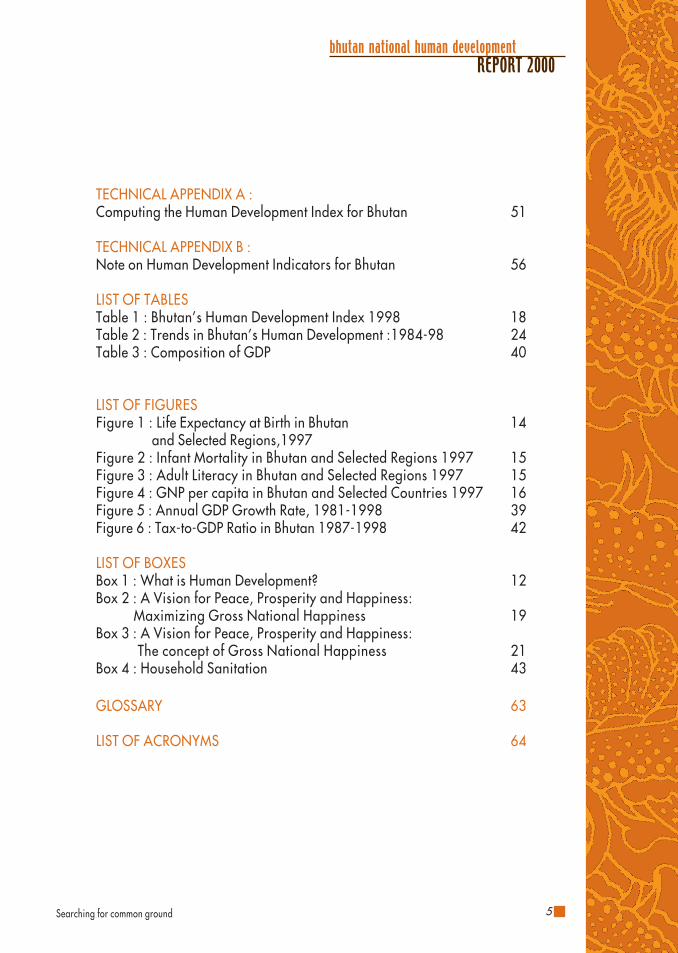
TECHNICAL APPENDIX A :Computing the Human Development Index for Bhutan 51
TECHNICAL APPENDIX B :Note on Human Development Indicators for Bhutan 56
LIST OF TABLESTable 1 : Bhutan’s Human Development Index 1998 18Table 2 : Trends in Bhutan’s Human Development :1984-98 24Table 3 : Composition of GDP 40
LIST OF FIGURESFigure 1 : Life Expectancy at Birth in Bhutan 14
and Selected Regions,1997Figure 2 : Infant Mortality in Bhutan and Selected Regions 1997 15Figure 3 : Adult Literacy in Bhutan and Selected Regions 1997 15Figure 4 : GNP per capita in Bhutan and Selected Countries 1997 16Figure 5 : Annual GDP Growth Rate, 1981-1998 39Figure 6 : Tax-to-GDP Ratio in Bhutan 1987-1998 42
LIST OF BOXESBox 1 : What is Human Development? 12Box 2 : A Vision for Peace, Prosperity and Happiness: Maximizing Gross National Happiness 19Box 3 : A Vision for Peace, Prosperity and Happiness: The concept of Gross National Happiness 21Box 4 : Household Sanitation 43
GLOSSARY 63
LIST OF ACRONYMS 64
Gross national happiness and human development
REPORT 2000bhutan national human development
6
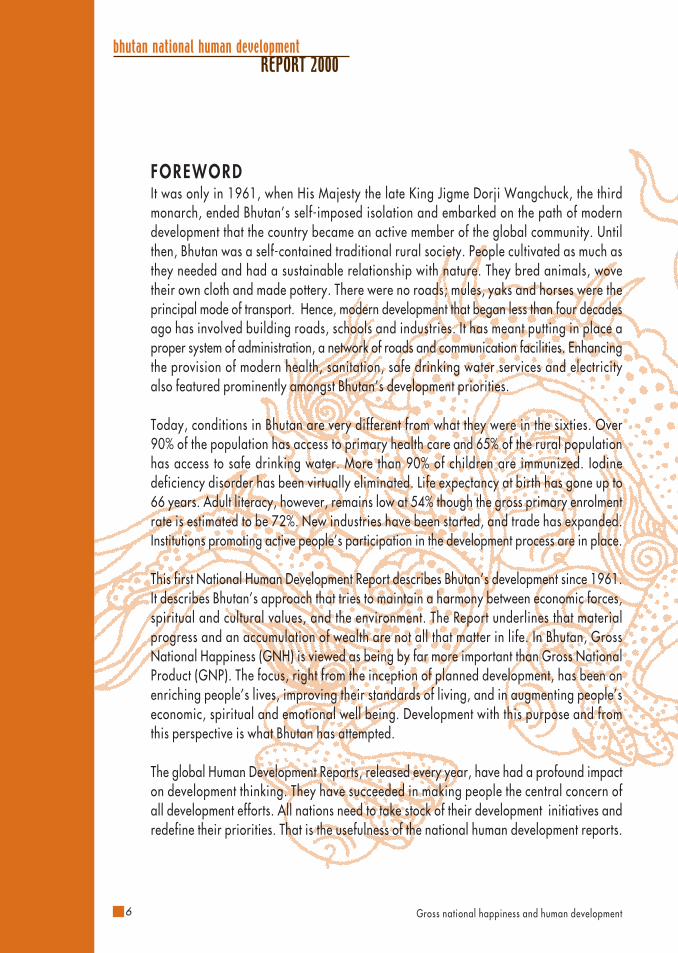
FOREWORDIt was only in 1961, when His Majesty the late King Jigme Dorji Wangchuck, the thirdmonarch, ended Bhutan’s self-imposed isolation and embarked on the path of moderndevelopment that the country became an active member of the global community. Untilthen, Bhutan was a self-contained traditional rural society. People cultivated as much asthey needed and had a sustainable relationship with nature. They bred animals, wovetheir own cloth and made pottery. There were no roads; mules, yaks and horses were theprincipal mode of transport. Hence, modern development that began less than four decadesago has involved building roads, schools and industries. It has meant putting in place aproper system of administration, a network of roads and communication facilities. Enhancingthe provision of modern health, sanitation, safe drinking water services and electricityalso featured prominently amongst Bhutan’s development priorities.
Today, conditions in Bhutan are very different from what they were in the sixties. Over90% of the population has access to primary health care and 65% of the rural populationhas access to safe drinking water. More than 90% of children are immunized. Iodinedeficiency disorder has been virtually eliminated. Life expectancy at birth has gone up to66 years. Adult literacy, however, remains low at 54% though the gross primary enrolmentrate is estimated to be 72%. New industries have been started, and trade has expanded.Institutions promoting active people’s participation in the development process are in place.
This first National Human Development Report describes Bhutan’s development since 1961.It describes Bhutan’s approach that tries to maintain a harmony between economic forces,spiritual and cultural values, and the environment. The Report underlines that materialprogress and an accumulation of wealth are not all that matter in life. In Bhutan, GrossNational Happiness (GNH) is viewed as being by far more important than Gross NationalProduct (GNP). The focus, right from the inception of planned development, has been onenriching people’s lives, improving their standards of living, and in augmenting people’seconomic, spiritual and emotional well being. Development with this purpose and fromthis perspective is what Bhutan has attempted.
The global Human Development Reports, released every year, have had a profound impacton development thinking. They have succeeded in making people the central concern ofall development efforts. All nations need to take stock of their development initiatives andredefine their priorities. That is the usefulness of the national human development reports.
Searching for common ground
bhutan national human developmentREPORT 2000
7
And we hope that there is greater congruence between our national efforts and the globalhuman development initiatives.
We recognize that our gains are modest, and we have a long way to go. But our effortshave been sincere. We have had to contend with several constraints. Some are naturallike the ruggedly mountainous terrain that makes provisioning of basic social services achallenge. Others are human, like the shortage of trained and skilled manpower. Someof it is reflected in the Report itself. We have only recently begun the process of gatheringdata on human development indicators at the sub-national level. And we hope that ourfuture reports will make use of the new information and address different themes.
Bhutan is entering a new phase of development and the challenges we face are many. Inparticular, we have to fulfill the many aspirations of the younger generation. We have toavoid the pitfalls of reckless modernization and unplanned urbanization. We have, in thepast, worked in close partnership with other countries, the United Nations and otherinternational organizations and institutions. We hope that these partnerships are furtherstrengthened in the coming years.
The Royal Government recognizes that a strong and reliable database on demographicand socioeconomic conditions is essential for developing policies that further promotehuman development in Bhutan. Several measures to strengthen the country’s national datacollection processes have already been initiated, but more still needs to be done. TheRoyal Government intends to make this a national priority over the coming years.
Finally, we would like to thank the United Nations Development Programme and their FieldOffice in Bhutan for the assistance and cooperation provided in the preparation and publicationof this Report.
Tashi Delek!
Sangay NgedupChairman
Planning Commission


Chapter 1The state of human development
Report 2000bhutan national human development
gross national happiness and human development - searching for common ground
Gross national happiness and human development
REPORT 2000bhutan national human development
10
THE STATE OF HUMAN DEVELOPMENT
The process of modern development in Bhutan started only in 1961, less than four decadesago, when His Majesty King Jigme Dorji Wangchuck, the third Druk Gyalpo, opened upthe country to the rest of the world by ending its era of self-imposed isolation. Until then,Bhutan had been geographically isolated. Spread over 46,500 square kilometers, thecountry is landlocked, surrounded by India to the south and the Tibetan Autonomous Regionof China to the north and the north-west. Bhutan is almost entirely mountainous, with landrising from about 200 metres above sea level in the south to the high Himalayas in thenorth, towering over 7500 metres. The country was never colonized and has alwaysremained independent.
The traditional society, meanwhile, was a self-contained rural economy. People cultivatedas much as they needed and had a sustainable relationship with nature. Mountain slopeswere terraced for agriculture and land was irrigated. People bred animals, wove theirown cloth and made pottery. Surplus rice was exported to Tibet, and salt, tea and woolwere imported in exchange. The ending of isolation paved the way for human development:It meant building infrastructure, both physical and social, promoting economic growthand simultaneously improving the quality of life of the people.
Early HistoryVery little is known about Bhutan’s early history. Stone tools that have been found indicatethat the country was inhabited as early as 2000 -1500 BC. However, historical recordsavailable today begin only from the visit of Guru Padmasambhava, popularly known asGuru Rinpoche, or the Precious Master, in the 7th Century. Guru Rinpoche brought inBuddhism, of which several forms are practiced in Bhutan today. Before that, an animisticreligion known as Bon prevailed in most parts of the country. Bon traditions and ritualsare still practiced in parts of Bhutan during the celebrations of local festivals. Between the7th and 17th Centuries, many important Buddhist lamas visited Bhutan; one, ZhabdrungNgawang Namgyal (1594-1652), a lama of the Drukpa Kagyue sect, came from Tibet in1616 and unified the country. He set up a theocracy, an administrative system and a codeof law. However, 1907 marked the beginning of a new era when Gongsar UgyenWangchuck was unanimously elected and crowned the first hereditary monarch of Bhutanby representatives of the general public, the Dratshang (Central Monastic Body) and thePenlops (district governors). The country was then brought under a central authority that

Searching for common ground
bhutan national human developmentREPORT 2000
11
prov ided s tab i l i t y and an oppor tun i t y fo rdevelopment. Religion remains part of every aspectof Bhutanese life. Buddhism is still practiced by amajor i ty ; of o ther re l ig ions, Hinduism is mostprevalent. A respect for peace, the need to do rightand a spiritual sense are strongly reflected in painting,drama and dance. For instance, art forms focus onthe individual only to place him or her in a particularrole in the larger scheme of life. Indeed, an art formin Bhutan is first a religious work; its aesthetic valuecomes second. In the old days, it was also customaryfor one son from each family to join a monastery, again establishing a close link betweenfamily, religion and public life. Bhutan has made every effort to ensure harmony betweeneconomic policies and its long spiritual and religious traditions. Its development strategythus has been extremely conscious of the need to enrich cultural values, nurture its richenvironment and fulfill the aspirations of people.
Human Development and Human ProgressDespite their self-imposed isolation until the 1960s and their late start, the people of Bhutanhave recorded many achievements. With a population of 600,000 in 1996, Bhutan is one ofthe least populated countries in the world.1 According to most recent estimates, the annualrate of population growth is around 3.1%, significantly higher than the 2.6% recorded duringthe early 1980s. Between 1980 and 1994, the crude birth rate rose from 39.1 to 39.9 per1,000 population, whereas the crude death rate fell sharply from 19.3 to 9 per 1,000. Asa result, the country’s population increased by almost 33% in just 12 years.
The human development perspective regards an expansion of human capabilities as the goalof development. People and their central concerns are placed at the centre of all developmentefforts, and primacy is given to improving the richness of people’s lives. From this perspective,commodity production and income matter only as means to improving the quality of life. Theultimate goal is to enhance people’s capabilities or freedom to pursue what they value most.Consequently, development success or failure not only is assessed in terms of an expansionin incomes or real GDP per capita, but also on the basis of improvements in the standards ofliving that those policy interventions bring about (See Box 1). 1 See Technical Appendix B for a discussion on population totals and related issues.

Gross national happiness and human development
REPORT 2000bhutan national human development
12
Box 1-Source: Human Development Reports 1996 and 1997
What is human development?
Human development is a process of enlarging people’s choices.Obtaining income is certainly one of the main means of expandingchoices and well-being. But too often, the expansion of income isconfused with the enhancement of human capabilities. Humandevelopment goes well beyond income and growth to cover the fullflourishing of all human capabilities. It emphasizes the importance ofputting people – their needs, their rights, their aspirations, theirchoices – at the center of the development effort.
Investigations of the priorities of poor people have often discoveredthat they put a high value on many things besides high income –including adequate nutrition, access to safe water, better medicalservices, more and better schooling for their children, affordabletransport, adequate shelter, secure livelihoods, and productive andsatisfying jobs. Beyond these needs, people also value benefits thatare non-material. These include, for example, freedom of movementand speech and freedom from oppression, violence and exploitation.People also want a purpose in life, along with a sense of empowerment.And as members of families and communities, people value socialcohesion and the right to assert their own traditions and values. Moneyalone cannot buy these choices.
But regardless of the level of development, the three essentials forpeople are to lead a long and healthy life, to acquire knowledge,and to have access to resources needed for a decent standard of living.Human development does not end there, however. Other choicesrange from political, economic and social freedom to opportunitiesfor being creative and productive and enjoying self-respect andguaranteed human rights.
Searching for common ground
bhutan national human developmentREPORT 2000
13
According to the Human Development Reports, development gives people the freedom tomake choices. However, the Reports point out:
“No one can guarantee human happiness, and the choices people make are theirown concern. But the process of development should at least create a conduciveenvironment for people, individually and collectively, to develop their fullpotential and to have a reasonable chance of leading productive and creativelives in accord with their needs and interests.”
The widespread acceptance in recent years of the human development framework is areflection of the growing disenchantment with the use of income (or per capita GDP) andincome growth as indicators of well-being and progress. Clearly, there is more to lifethan an expansion of income or an accumulation of wealth. Goods and services arevaluable, but not in themselves. Even income has only an instrumental significance; it isuseful to the extent that it can be translated into well- being. Several factors mediatebetween the conversion of income into well-being; it is not automatic. For instance, muchdepends upon the levels of public provisioning of basic social services. A rich farmer’swealth may be of little use if there are no health facilities in the village. Similarly, incomelevels may not matter much if sociocultural norms prevent girls from freely accessing botheducation and health care. Many of the dimensions of life that people value may not becorrelated to income levels in any predictable manner. For instance, levels of pollution,crime, violence, discrimination and abuse occur in both rich and poor societies. Thepreoccupation with economic growth and creation of wealth also displaces people fromthe centre of development. The human development approach brings people and theirconcerns back to centre stage for development. It concentrates on what people aspire formost — and very often, especially among the poor, self-respect, freedom, peace, dignity,security and happiness matter much more than income. It is from this perspective that thehuman development framework defines the enhancement of human capabilities as the goalof development.
Indicators of Human DevelopmentThe following section reviews Bhutan’s situation in three essential capabilities. These arelongevity (measured by life expectancy at birth), the capability to be educated (measuredby literacy and access to basic education) and command over resources needed to establisha decent standard of living (measured by per capita income).

Gross national happiness and human development
REPORT 2000bhutan national human development
14
9
Life ExpectancyLife is valuable in itself and in the fact that it is necessary for people to achieve othercapabilities. Living long indicates the capability to avoid both fatal illnesses and escapablemortality. Historically, much of the gains in life expectancy have come from significantimprovements in health and public health systems, sanitation, levels of environmentalpollution, and better nutrition and access to safe drinking water. The association betweenlongevity and these dimensions of a decent quality of life makes life expectancy an importantindicator of human development. Given the lack of specialized and comprehensive dataon morbidity, life expectancy also serves as a surrogate measure of people’s health andnutritional status. To that extent, life expectancy is an indicator not merely of the quantitybut also the quality of life. Bhutan by 1994 had achieved a life expectancy of 66 years.2
This was seven years lower than Sri Lanka’s achievement, for example, but it was alsothree years more than the average for South Asia. (See Figure 1.)
Infant Mortal i tyLife expectancy figures are strongly influenced by the prevailing levels of infant mortality.As an indicator of child survival, infant mortality conveys more than merely the number ofchildren who die before age one. Many aspects of life are reflected in this statistic, includingthe capability of parents, the prevalence of malnutrition and disease, the availability ofclean water, the efficacy of health services, and above all, the health and status of women.Bhutan in 1994 reported an infant mortality rate of 71 per 1,000 live births.
2 The National Demographic Health Survey of 1994 is the main source of demographic data. See Technical Appendix B for a discussion on data availability.
Fig. 1Source:Human Development Report 1999National Health Survey (NHS1994)
55 60 65 70 75
Sri Lanka
East Asia
Bhutan
South East Asia
South Asia 63
66
66
70
73
Life expectancy at birth inand selected regions, 199
Years
Searching for common ground
bhutan national human developmentREPORT 2000
15
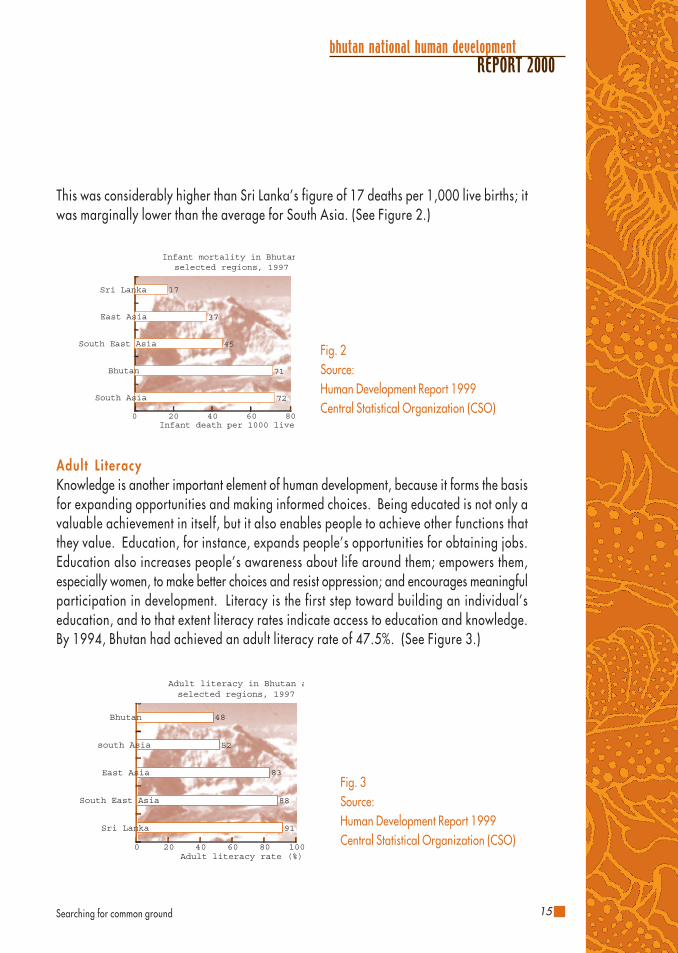
This was considerably higher than Sri Lanka’s figure of 17 deaths per 1,000 live births; itwas marginally lower than the average for South Asia. (See Figure 2.)
Adult L i teracyKnowledge is another important element of human development, because it forms the basisfor expanding opportunities and making informed choices. Being educated is not only avaluable achievement in itself, but it also enables people to achieve other functions thatthey value. Education, for instance, expands people’s opportunities for obtaining jobs.Education also increases people’s awareness about life around them; empowers them,especially women, to make better choices and resist oppression; and encourages meaningfulparticipation in development. Literacy is the first step toward building an individual’seducation, and to that extent literacy rates indicate access to education and knowledge.By 1994, Bhutan had achieved an adult literacy rate of 47.5%. (See Figure 3.)
Fig. 2Source:Human Development Report 1999Central Statistical Organization (CSO)
Fig. 3Source:Human Development Report 1999Central Statistical Organization (CSO)
0 20 40 60 80
South Asia
Bhutan
South East Asia
East Asia
Sri Lanka 17
37
45
71
72
Infant mortality in Bhutanselected regions, 1997
Infant death per 1000 live
0 20 40 60 80 100
Sri Lanka
South East Asia
East Asia
south Asia
Bhutan 48
52
83
88
91
Adult literacy in Bhutan aselected regions, 1997
Adult literacy rate (%)

Gross national happiness and human development
REPORT 2000bhutan national human development
16
I n comeIncome is treated as a component of human development, not for its importance as an endin itself, but as a means of establishing command over resources needed for decent living.Bhutan recorded a GNP per capita of US$594 in 1997. Income levels vary significantlyamong South Asian countries. According to 1997 figures, Maldives had the highest GNPper capita, with US$1,180, while Nepal had the lowest, with US$220. (See Figure 4.)
Measuring progress by using GNP per capita often gives a partial and distorted picture ofhuman development. This is perhaps more true of Bhutan than many other countries. Alarge part of Bhutan’s rural economy remains non-monetised, with barter systems stillprevalent. Entering into the computation of GNP are only monetary transactions; this oftenleaves out a significant proportion of work done within the family, especially by women,and voluntarily within the community.
Figures of GNP also fail to capture the environmental wealth of a nation. In the case ofBhutan, the environment plays a major role. The country’s natural biodiversity has made itone of the world’s 10 most important biodiversity (hot spots.) Indeed, Bhutan has some ofthe best examples of the last of the Himalayan ecosystems. More than 60% of the speciesunique to the eastern Himalayas are found here, including at least 770 bird species, 165species of rare mammals and more than 5,000 vascular plants. More than 26% of the landarea has been designated as national parks, reserves and protected areas. Forests cover72.5% of Bhutan’s land (64.5% tree cover and 8% scrub forests). In contrast, pasture landscover only 4% and cropland an estimated 8%. Bhutan’s forests are among the most diversein the world: Tropical and subtropical forests are found in the south. Oak forests begin to mixwith broad-leafed ones at 2000 metres. And the most extensive and valuable spruce and firforests are found in the inner Himalayas at altitudes ranging from 2700 to 3000 metres.
Fig. 4Source:Human Development Report 1999Central Statistical Organization (CSO)
0 200 400 600 800 100012001400
Maldives
Sri Lanka
Pakistan
Bhutan
India
Bangladesh
Nepal 220
360
370
594
500
GNP per capita in Bhutan anselected countries, 1997
In US $
800
1180

Searching for common ground
bhutan national human developmentREPORT 2000
17
In large parts of the country, forests provide an abundant source of fuelwood, fodder forlivestock, leaf litter and mould for the replenishment of soil fertility, food supplements,plants for herbal medicines and construction materials. They are a source of cash incomes,derived, for example, from the collection and sale of mushrooms, medicinal plants andplants for the extraction of essential oils, as well as the production of traditional paperand natural dyes. Many cottage and handicrafts industries also rely on forests for theirraw materials. The significant contribution of the environment and natural resources toBhutan’s economy is best brought out in a recent World Bank study that attempts to computethe “wealth of a nation” by incorporating four kinds of capital: man-made (typically enteredin financial and economic accounts), natural capital (typically ignored by national incomeaccounting procedures), human capital (investments in health, education and nutrition ofindividuals), and social capital (the institutional and cultural basis for a society to function).Natural capital is a country’s basic resource endowment and is defined as the stock ofenvironmentally provided assets, such as soil, atmosphere, forests, water and wetlands.According to this study, Bhutan’s estimated wealth per capita (as opposed to income) isUS$6,500. Almost 85% of this is attributed to natural capital, whereas only 7% is attributedto produced assets and 8% to human capital.
But neither does this modified monetary measure capture vital elements of the quality oflife in Bhutan. Most striking, for example, to any visitor is the extraordinarily clean qualityof the environment. Almost the entire country is relatively free of traffic congestion, airand noise pollution compared to other locations. Moreover, the widespread extremepoverty and abject suffering that the relatively low level of income may suggest are nottypically found in Bhutan. This is not to deny the existence of some forms of deprivationfaced by certain communities, in specific regions, and during different seasons in terms ofaccess to food, educational opportunities and basic health care. Systematic householdsurveys have not yet been conducted to capture and reflect the extent to which people’saspirations and needs remain unfulfilled. But observations made on field visits and indiscussions with communities suggest that the extent and depth of such deprivations arenot as widespread as the low levels of per capita income may seem to convey. Almosteveryone is reasonably well clothed and has enough food to eat, there are no starvationdeaths, and virtually every family enjoys access to land and shelter. However, there is anurgent need to improve the levels of income. Many of the factors that have inhibitedgrowth—including low agricultural productivity, slow expansion of non-farm employmentopportunities and limited provision of higher education facilities—continue to receivepriority.
Gross national happiness and human development
REPORT 2000bhutan national human development
18
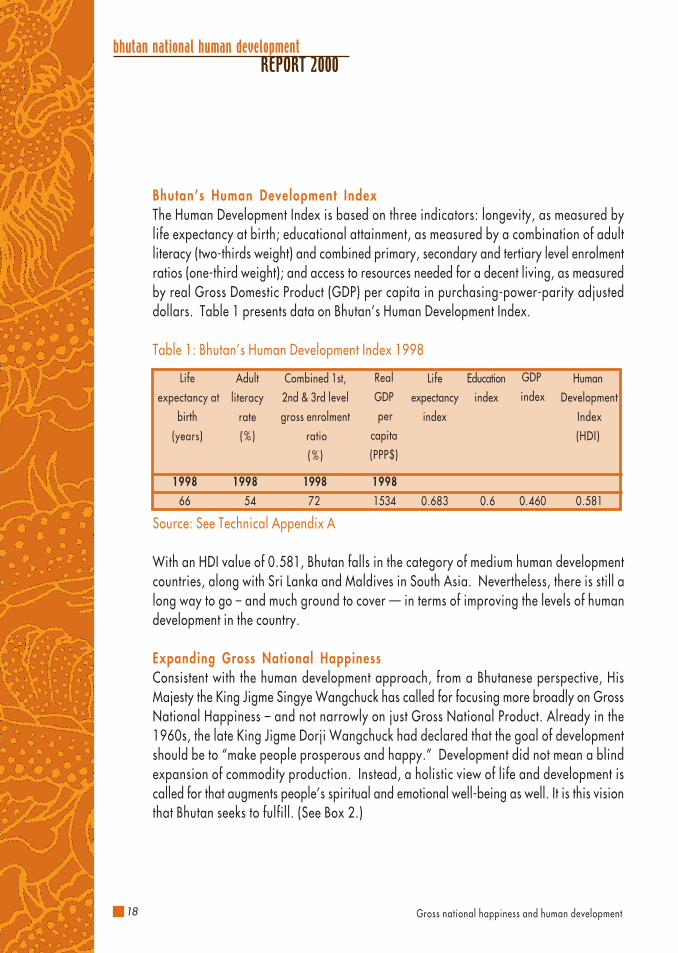
Bhutan’s Human Development IndexThe Human Development Index is based on three indicators: longevity, as measured bylife expectancy at birth; educational attainment, as measured by a combination of adultliteracy (two-thirds weight) and combined primary, secondary and tertiary level enrolmentratios (one-third weight); and access to resources needed for a decent living, as measuredby real Gross Domestic Product (GDP) per capita in purchasing-power-parity adjusteddollars. Table 1 presents data on Bhutan’s Human Development Index.
Table 1: Bhutan’s Human Development Index 1998
Source: See Technical Appendix A
With an HDI value of 0.581, Bhutan falls in the category of medium human developmentcountries, along with Sri Lanka and Maldives in South Asia. Nevertheless, there is still along way to go – and much ground to cover — in terms of improving the levels of humandevelopment in the country.
Expanding Gross National HappinessConsistent with the human development approach, from a Bhutanese perspective, HisMajesty the King Jigme Singye Wangchuck has called for focusing more broadly on GrossNational Happiness – and not narrowly on just Gross National Product. Already in the1960s, the late King Jigme Dorji Wangchuck had declared that the goal of developmentshould be to “make people prosperous and happy.” Development did not mean a blindexpansion of commodity production. Instead, a holistic view of life and development iscalled for that augments people’s spiritual and emotional well-being as well. It is this visionthat Bhutan seeks to fulfill. (See Box 2.)
Life
expectancy at
birth
(years)
Adult
literacy
rate
( % )
Combined 1st,
2nd & 3rd level
gross enrolment
ratio
( % )
Real
GDP
per
capita
(PPP$)
Life
expectancy
index
Education
index
GDP
indexHuman
Development
Index
(HDI)
1998 1998 1998 1998
66 54 72 1534 0.683 0.6 0.460 0.581
Searching for common ground
bhutan national human developmentREPORT 2000
19
Box 2
From Bhutan 2020:A Vis ion for Peace, Prosperi ty and Happiness
Cent ra l Deve lopment Concept :Maximis ing Gross Nat ional Happiness
The guiding principles for the future development of our nation andfor safeguarding our sovereignty and security as a nation-state mustbe complemented by a single unifying concept of development thatenables us to identify future directions that are preferred above allothers. This unifying concept for the nation’s longer-term developmentis already in our possession. It is the distinctively Bhutanese conceptof maximizing Gross National Happiness, propounded in the late1980s by His Majesty King Jigme Singye Wangchuck......
The concept of Gross National Happiness was articulated by HisMajesty to indicate that development has many more dimensions thanthose associated with Gross Domestic Product, and that developmentshould be understood as a process that seeks to maximize happinessrather than economic growth. The concept places the individual atthe centre of all development efforts, and it recognizes that theindividual has material, spiritual and emotional needs. It asserts thatspiritual development cannot and should not be defined exclusivelyin material terms of the increased consumption of goods and services.

Gross national happiness and human development
REPORT 2000bhutan national human development
20
The Constituents of HappinessA great deal of consistency exists between the Bhutanese concept of Gross NationalHappiness (GNH) and human development. Commodity ownership may contribute tostandard of living, but it is not a constituent part of that standard. Amartya Sen points out,for instance, that a grumbling rich man may well be less happy than a contented farmer,but he does have a higher standard of living than the farmer. It is the sense ofdiscontentment or emptiness that the rich farmer experiences that constitutes unhappiness.Happiness may be subjective, but this subjectiveness is shared by all, regardless of levelsof income, class, gender or race.
The pursuit of GNH calls for a multi-dimensional approach to development that seeks tomaintain harmony and balance between economic forces, environmental preservation,cultural and spiritual values and good governance. The articulation of happiness as thegoal of development has strong roots in Bhutan’s Buddhist traditions. Rather than talk ofhappiness per se Buddhism talks about avoiding dissatisfaction through adequateprovisioning of four necessities – food, shelter, clothing and medicine. Significantly,however, it holds that meeting this hierarchy of wants is only the first step in avoidinghuman suffering, which ultimately depends upon cultivating a sense of detachment andspiritual fulfillment.
Apart from the religious influences, the concept of GNH as it has evolved over the yearshas also been a reaction to the experiences of other developing nations. Bhutan’s latestart in development has had one major advantage: It allowed the country to learn fromthe experience of others. The pursuit of growth in GNH rather than in GNP reflects Bhutan’sanxiety to avoid some of the more glaring failures of the blind pursuit of economic growth.By seeking to promote human happiness, the focus is on what matters most to people: theirsecurity, peace and comfort. Consequently, Bhutan has identified four essential constituentsof happiness: economic development, environmental preservation, cultural preservationand promotion, and good governance.
Searching for common ground
bhutan national human developmentREPORT 2000
21
Box 3
From Bhutan 2020:A Vis ion for Peace, Prosperi ty and Happiness
The key to the concept of Gross National Happiness cannot be found in theconventional theories of development economists and in the application ofsuch measures as utility functions, consumption preferences and propensityand desire-fulfillment. It resides in the belief that the key to happiness is tobe found, once basic material needs have been met in the satisfaction ofnon-material needs and in emotional and spiritual growth. The concept ofGross National Happiness accordingly rejects the notion that there is adirect and unambiguous relationship between wealth and happiness. If sucha relationship existed, it would follow that those in the richest countriesshould be happiest in the world. We know that this is not the case. Thismarginal increase has also been accompanied by the growth of many socialproblems as well as such phenomena as stress-related diseases and suicides,surely the very antithesisof happiness.
( In Bhutan) the most important priorities can be classified under five thematicheadings that provide us with powerful objectives for steering the processof change. These five objectives are human development, culture andheritage, balanced and equitable development, governance andenvironmental conservation. These five main objectives not only give verytangible expression to the central tenets of Gross National Happiness, theyalso embody the guiding principals that have been identifed as being ofdecisive importance in ensuring our future independence, sovereignty andsecurity. As such, they acquire a special significance in elaborating preferreddirections for the Kingdom’s future development.

Gross national happiness and human development
REPORT 2000bhutan national human development
22
If happiness is among the cherished goals of development, then it does matter how thishappiness is generated, what causes it, what goes with it, and how it is distributed – whetherit is enjoyed by a few or shared by all. Human happiness may not automatically flow fromeconomic growth. Conscious policies are needed to establish a link between economicprogress and human happiness. Part of this will require improvements in socioeconomicconditions and the satisfaction of basic needs. But a growing income and better provisioningof basic social services are not sufficient by themselves; these have to be supplemented byappropriate employment opportunities, social security and adequate leisure time.
Bhutan seeks to establish a happy society, where people are safe,where everyone isguaranteed a decent livelihood, and where people enjoy universal access to good educationand health care. It is a society where there is no pollution or violation of the environment,where there is no aggression and war, where inequalities do not exist, and where culturalvalues get strengthened every day. A happy society is not a fatalistic society but is builton hope and aspirations. It is also a more equal and compassionate society, where sharingand contentment come out of a positive sense of community feeling. A happy society isone where people enjoy freedoms, where there is no oppression, where art, music, dance,drama and culture flourish.
Ultimately, a happy society is a caring society, caring for the past and future, caring forthe environment and caring for those who need protection. Establishing such a society willrequire a long-term rather than a short-term perspective of development. Much will dependupon how well the country’s environmental resources are harnessed and managed.Happiness in the future also will depend upon mitigating the foreseeable conflict betweentraditional cultural values and the modern lifestyles that inevitably follow in the wake ofdevelopment.

Searching for common ground
bhutan national human developmentREPORT 2000
23
Chapter 2Human development since 1960
Report 2000bhutan national human development
gross national happiness and human development - searching for common ground

Gross national happiness and human development
REPORT 2000bhutan national human development
24
HUMAN DEVELOPMENT SINCE 1960.
In the early 1960s, His Majesty King Jigme Dorji Wangchuck ended Bhutan’s self-imposedisolation and made it an active member of the global community. It was clear that for thecountry to develop, its people had to develop. It may be true that nobody starved in Bhutanand everyone lived off the land, but people had to acquire better education, and they hadto have access to modern health services, sanitation, safe water and electricity. It alsomeant that human development would be impossible without a proper administrative system,a network of roads and communication facilities.
Practically no data on human development exist for the period before the 1960 and verylittle quantitative information is available between 1960 and 1980. The Royal Governmentbegan putting systems of data collection into place only in the 1980s. Available data onhuman development indicators permit construction of the Human Development Index forthe time periods between 1984 and 1998.
Table 2: Trends in Bhutan’s Human Development Index 1984 - 1998
Source: See Technical Appendices A and B
Thus, Bhutan has moved from being a low human development country to a medium humandevelopment country over a short period of 10 years.
1984 47.4 23.0 24.5 901 0.373 0.235 0.367 0.975 0.3251991 56.0 35.2 33.2 1,235 0.517 0.345 0.420 1.282 0.4271994 66.0 47.5 39.0 1,338 0.683 0.447 0.433 1.563 0.5211998 66.0 54.0 72.0 1,534 0.683 0.600 0.460 1.743 0.581
Lifeexpectancy
at birth(years)
Adultliteracyrate (%)
Combined1st,2nd,3rdlevel grossenrolmentratio (%)
Real GDPper
capitaEducation
indexGDPindex
Sum ofthe
indices
HumanDevelopment
Index(HDI)
Lifeexpectancy
index
Searching for common ground
bhutan national human developmentREPORT 2000
25
Expanding Opportuni t iesAs noted, Bhutan’s first five-year development plan was launched in 1961, and until thenthe economy had been characterized by extreme isolation. Infrastructural facilities weregrossly inadequate. Mules and horses were the dominant mode of transportation; thecountry had no metalled roads, no motor vehicles and no electricity. There were no modernmeans of communications connecting it to the rest of the world, nor did it have a postal ortelecommunications system. Planned development ended the Kingdom’s physical isolationand ensured investment in creating basic physical and social infrastructure. Social servicesalso were almost entirely lacking. It was during the first plan that Bhutan’s initial roads,schools and hospitals were built. The next three five-year plans retained this focus. Laterplans began to deal with agriculture and industry.
By the 1980s, Bhutan had made major strides in many areas of development: infrastructure,energy, telecommunications, agriculture and industry. Although it has attempted to promoteopportunities in all spheres of life, there is still a long way to go. Every effort has beenmade not to lose sight of the primary goal: the betterment of human life without having toinordinately compromise tradition and culture, or the country’s magnificent naturalresources.
Access to Jobs and Sources of LivelihoodAlmost 85% of Bhutan’s population still lives in rural areas. Agriculture continues to bethe chief source of livelihood. Most people earn their living through farming, animalhusbandry and forest products. An estimated 65,000 farming families own, on average,agricultural landholdings of 1.5 hectares per household. Farming activity is typicallydiversified, with most households growing a range of cereals and horticultural products,keeping several types of livestock and utilizing the forests for fuels, grazing and compost.The five-year plans have tried to boost farm incomes through agriculture and livestockdevelopment.
Only 16% of Bhutan’s land is suitable for agriculture. Of this, 8% is under cultivation. Themountainous terrain and fragile ecology do not allow for any expansion, limitingdevelopment in this sector to introducing high-yielding varieties, improving farmingtechniques and applying enhanced inputs. Agricultural production has increased despitethe limitations of land. In 1984, 185,100 tonnes of cereal were produced. In 1992 thisfigure had increased to 207,000 tonnes. Agricultural infrastructure also grew significantly:

Gross national happiness and human development
REPORT 2000bhutan national human development
26
By 1998, a network of 159 extension centres coveredmost of Bhutan, and 5 research centres, 14 seed andplant production farms, 3 farm mechanization centres,1 farm machinery training centre and 1 nationalmushroom centre were established. Even so, theproblem of low land productivity persists in many partsof the country.
Horticulture has emerged as an important area forgenerating income. Diverse agro-climatic conditionshave allowed for the commercial production of a varietyof fruits. These include apples in the temperate northand mandarin in the subtropical south. Potato,
cardamom, ginger and oil seeds also are being produced. Livestock has been developedby introducing improved breeds and improving pasture and veterinary services. Cattleare owned by an estimated 95% of households. Meat and other livestock products aremostly retained for self-consumption; marketed surpluses are small. In some regions,increased production of dairy food has enhanced cash incomes for farm households andimproved diets. Between 1985 and 1998, the number of veterinary hospitals increasedfrom 18 to 21 and livestock extension centres from 87 to 110.
Even though only 15% of Bhutan’s population resides in urban areas, migration from ruralto urban areas has been occurring steadily, especially with the rapid increase in populationand improvements in educational levels. Disenchanted with limited opportunities in ruralareas, the young in particular are moving to towns in search of better jobs. The RoyalCivil Service is the largest employer in Bhutan, particularly of the educated. Initially,because of a shortage of skilled people, a large part of Bhutan’s workforce was broughtin from other countries. Even senior bureaucratic positions were manned by expatriates.But with rising levels of literacy and education, things have changed, and Bhutanesenationals now fill the cadres of the civil service. But the growth of the civil service sectorcan no longer keep pace with the increasing numbers of qualified people who seekemployment every year. In 1984 only 43 university graduates were available foremployment, and the civil service absorbed all. In 1994, 94 graduates needed employmentand the civil service was able to absorb only 15. Others have had to find employment inpublic corporations and private sector enterprises. Such opportunities in the private sectorneed to expand in order to absorb the growing number of educated persons in the country.

Searching for common ground
bhutan national human developmentREPORT 2000
27
Access to Basic HealthLife in the early days was short and hard. Life expectancy in Bhutan has risen from 37years in 1960 to 66 years in 1994. Very few nations in the world, even those wealthierthan Bhutan, have seen such a dramatic rise in longevity over this period. When Bhutanbegan its development process in 1961, it had just 4 hospitals and 11 dispensaries operatedby 2 qualified doctors and untrained compounders. To create a basic health infrastructurewas an urgent priority. By 1998, the Bhutanese health system consisted of 28 hospitalsand 145 basic health units (BHUs), including 1 indigenous hospital and 11 indigenousunits. There are 98 doctors, 28 Drungtshos (indigenous physicians) and 928 paramedicalworkers.
Basic health care is free, and Bhutan has invested large resources into ensuring universalprimary health care. The effort has been to provide preventive health care rather thanfocus on tertiary care. Planning and monitoring of health programmes take place at thedistrict level through medical officers who also supervise the BHUs. Health awareness atthe day-to-day level also is imparted by the BHUs, which form the health support line ofthe country. The BHUs were set up in the 1970s to cater to the health needs of Bhutan’sscattered population. Before this, formal health care was only available in the urban centres.Now there are 1,058 village-level heath workers, who provide basic medical help andshare their health knowledge, skills and understanding. The village health worker referscases to the BHU. In addition, mobile outreach clinics reach those who live far from BHUs.By 1998 there were 454 outreach clinics that provided preventive health care, includingimmunization of children and pregnant women. They provide antenatal care, promotenutrition, provide iron and deworming tablets, and monitor the growth of children.
So-Wa-Rigpa, an indigenous medicinal system introduced in the 17th Century from Tibet,co-exists along with the modern health care system even today and is actively promotedby the Royal Government of Bhutan. Services are offered by traditional institutes andhealers. The system uses Himalayan flora, which has numerous species with healingproperties. Traditional medical services are offered through the indigenous hospital inThimphu and 11 indigenous dispensaries spread across the country.
Infant mortality rates in Bhutan have dropped to less than half of what they were 30 yearsago. In 1960, Bhutan’s infant mortality rate (IMR) was 203, one of the highest in SouthAsia and in the world. In 1984, the country’s IMR had come down to 142. By 1994,Bhutan had reduced its IMR to 70.7, half the level prevailing in 1984. By 1998 Bhutan

Gross national happiness and human development
REPORT 2000bhutan national human development
28
had achieved an overall child immunization coverage rate of 90%, which is partly due tothe setting up of an effective extension service and also because of the public campaigningand awareness efforts launched by the Government. A National Diarrhoeal DiseasesControl Programme has been set up. Efforts are also ongoing to help prevent disease bydisseminating information about water, sanitation and hygiene. At the same time, as citiesgrow the need for an effective urban public health system is being felt. A sewerage systemhas been put in place in Thimphu, the capital, and Phuentsholing, the second-biggest town.Further investment is planned for developing other urban centres to improve the quality ofurban life.
Before the mid-1980s, iodine deficiency disorder was a serious problem in Bhutan. Goitreprevalence rates were high. Even in 1983, a survey conducted in 11 out of Bhutan’s 18districts showed an average goitre prevalence rate of nearly 65%. Cretinism was reportedin all districts, reaching 10% or higher in those districts most severely affected. The findingsof the survey prompted the country to launch a national iodine deficiency disorder (IDD)control programme. Realizing the urgent need for salt iodization, in 1985, a salt iodizationplant was commissioned near Bhutan’s southern border to process all salt entering thecountry. Today more than 90% of edible salt is fortified with iodine. By 1991, the goitreprevalence rate had come down to an average of 26% among children.Today iodinedeficiency has virtually been eliminated.
The country has given high priority to maternal and child health. Levels of Grade Imalnutrition among children fell from 32% in 1993 to 18% in 1997. Bhutan has fewerchildren under 5 that are underweight and malnourished than some of the other countriesin the region. Maternal mortality rates have been halved, from 773 deaths for every100,000 babies born in 1984 to 380 in 1994. Close to 85% of births take place at home,where often two or more people help with the delivery. The 1994 National Health Surveyshowed that 35% of the births were attended by husbands, another 30% by mothers, andsome 10% by relatives and friends. Another 15% were attended by doctors, trained birthattendants, midwives, nurses and health workers. An ongoing pilot project in some districtsis providing a “Safe Home Delivery Kit” that contains a piece of soap, gauze, disinfectant,a clean string, a razor blade and a sheet of plastic. Antenatal care is provided by hospitals,BHUs, dispensaries and outreach clinics. Women who go for checkups are immunizedagainst tetanus twice, supplied with iron tablets to prevent or treat anaemia, screened forhigh blood pressure and their urine tested wherever laboratory facilities are available.

Searching for common ground
bhutan national human developmentREPORT 2000
29
The health centres also help women prepare for a safede l i ve ry and fo r per ina ta l care . Women areencouraged to call for help at the time of delivery. Yetthere is more to be done in order to improve people’saccess to basic health services. A 1992 study showsthat 64% of women live less than 2 hours’ walk awayfrom an outreach clinic, while 10% live 10 or morehours away from any health facility. The full benefitsof the rapid decline in infant mortality, meanwhile, areyet to be realized. For instance, it is well establishedthat improvements in child survival precede declines infertility. The desire to have more children is to an extent a reflection of the need to ensurethat at least some survive; it also reflects the need for security in old age. Despite the fallin IMR, the total fertility rate (TFR) in Bhutan is high at 5.6. But fertility reduction alone isnot sufficient to control population. Today, the contraceptive prevalence rate is only around19% and the Government recognizes that this must be stepped up. Along with an expansionin the provision of family planning services, women’s education also needs to be promotedrapidly. Only then will families be able to make informed choices and, in their own bestinterest, have smaller families.
Access to Safe Drinking WaterAccess to an adequate safe water supply is a vital part of primary health care. It contributesto cleanliness, checks the frequency and severity of diseases and improves nutritional status.Piped water schemes in Bhutan are designed to supply 120 litres per person per day (pppd)in the urban areas and 45 litres pppd in rural areas. An impact study concluded that, onaverage, users of piped water schemes need about 12 litres pppd inside the house whileusing another 41 litres pppd at the tap-stand for various other purposes. An extra 69 litrespppd was available, which flowed away unused. Around 65% of Bhutan’s rural populationhave access to safe drinking water.
Access to Basic EducationBhutan also has a long way to go before achieving universal literacy. Its achievements inthe past few decades need to be strengthened and expanded. The adult literacy rate hasnevertheless quadrupled in the past 20 years; from an estimated 10% in 1970, it rose to21.1% in 1984 and 47.5% in 1994. In the absence of gender-disaggregated data, it is

Gross national happiness and human development
REPORT 2000bhutan national human development
30
difficult to assess the precise extent of gender disparities.However, literacy levels among men are reported to besignificantly higher than among women, although womenhave been catching up with men in recent years in termsof education.
Before modernization began in Bhutan, education withinthe country was only available in the monasteries.Training was imparted here in religious rituals and alsoin numeracy, philosophy, astrology, literature andtraditional medicine. This tradition continues today, with
about 15,000 monks, nuns and Sanskrit pandits scattered across the country. Some religiousinstitutions receive state support. Overall, planned modern education was introduced inthe late 1950s. In 1959 just 440 students were studying in 11 primary schools. In 1998there were 322 educational institutions, consisting of 128 primary, 115 community schools,44 junior high schools, 18 high schools, 1 degree college, 9 specialized training institutes(including 2 Sanskrit patshalas), and 7 private schools. There are also 54 non-formaleducation centres. In 1998 there were 1,00,198 students, including those in non-formaleducation, and 2,785 teachers. While enrolment has risen to levels where the existinginfrastructure may have trouble in meeting the needs, the dropout rate has fallen from10% in the early 1980s to 4% now. The non-formal education programme caters to thosewho earlier had no opportunity to attend school.
Primary school enrolment of girls is increasing faster than boys’ enrolment. In 1990, theboy- to-girl ratio was 61 to 39. In 1995 it became 57 to 43. Community schools inparticular seem to be providing greater access to education for girls, but gender disparitiesare clearly higher in secondary school and even more in college. In 1998 girls accountedfor 45% of the student population. The percentage of girls in Sherubtse College, meanwhile,is 26.7% and about 35% in all other educational institutions. Gender disparities are slowlybeing reduced in the primary school dropout rates.
Free education is provided from the primary to the tertiary level. Besides free tuition, thisincludes free textbooks and, in some places, meals and boarding facilities. The educationalstructure consists of one-year Pre-Primary, 6 years Primary, 4 years Secondary, 2 yearsJunior College and 3 years of a degree programme.

Searching for common ground
bhutan national human developmentREPORT 2000
31
During the Seventh Five-Year Plan, annual enrolment exceeded the planned 6% expansiontarget by 2%. People have begun to value education and look at it as a means to a betterlife. Pressure for expanding the education system is building. A 1995 assessment of primaryschool classroom space indicated that space exists for more than 60,000 children, butadditional space for an estimated 23,000 students is needed just between now and theyear 2002. Demand will soon outstrip supply. Supply needs strengthening not simply interms of buildings and teaching materials, but also trained teachers. Bhutan already hastaken recourse to commercial borrowing for investment in education. It also plans to chargea reasonable fee to those who can afford to pay as a way of cost-sharing. Other plansinclude improving the educational coverage equitably across the Kingdom, upgradingteachers’ training, involving communities in construction, maintenance and managementof schools, and improving the cost effectiveness in the delivery of educational services.
Bhutan has always faced a shortage of teachers, and the gap has been met by a largenumber of expatriate teachers: 10% at the primary level, 25% at high secondary leveland 40% at the secondary level in 1999. The availability of teacher resources has,however, been improving. The two teacher training institutes turned out 487 teachers in1998 and 713 in 1999 and their capacity is being expanded during the Eighth Five-YearPlan. Even so, the shortage is likely to persist, especially as the country gears up to expandvocational and higher education.
Setback to Human DevelopmentThe adoption of planned socio-economic development in the early 1960s brought aboutvery visible improvements in the quality of life of the Bhutanese people. The initiation ofplanned development also tremendously increased the scope and number of development-oriented activities in the country. Thousands of laborers of mostly Nepalese origin werebrought in to construct roads and implement other development programs because therewas an acute shortage of manpower. In addition, there had been an influx of illegaleconomic migrants through Bhutan’s open and porous border in the south. Governmentefforts to stem illegal immigration through Bhutan’s first detailed census in 1988 wereopposed by a nexus of illegal immigrants and vested interest groups whose declaredobjective has been the taking over of political power in the Kingdom. In the aftermath ofnumerous acts of violence and disturbances that followed, many from southern Bhutan leftthe country. Many emigrated voluntarily despite Government requests to remain, whileothers were induced, coerced or threatened to leave the country by dissident elements.

Gross national happiness and human development
REPORT 2000bhutan national human development
32
An estimated 90,000 people are reported to be in camps in eastern Nepal. TheGovernments of Bhutan and Nepal established a Joint Ministerial Committee in 1993 towork toward a resolution of the refugee problem. The 8th round of the Joint MinisterialCommittee was held in September 1999 in Kathmandu, and steady progress is being madein search of a durable and comprehensive solution.
The disturbances and problems in the southern Dzongkhags led to the closure of 76 out of114 schools for security reasons. As many as 30 schools, 12 Basic Health Units and otherinfrastructure facilities were destroyed by dissident elements. However, despite the risksinvolved the Government kept open more than 76 schools, 89 health centres and otherinfrastructure facilities. Development activities have now been fully resumed on theinsistence of His Majesty the King.
Gender Equali tyGender-disaggregated data on human development indicators are not readily available.Female foeticide, female infanticide and deliberate neglect of a girl child are commonoccurrences in most South Asian countries, but not in Bhutan. Here, infant mortality forfemales (67 deaths per 1,000 live births) is lower than that for males (75 deaths per1,000 live births). Parents do not have strong gender preferences and treat girls andboys equally. Most surveys report a higher proportion of women than men in Bhutan.According to the 1984 Demographic Sample Survey that covered rural households, therewere 102.6 women for every 100 men in the country. The 1994 National Health Surveyreported a female-to-male ratio of 108.8 girls for every 100 boys in the age group of 5 to14 years, and a ratio of 102.2 women for every 100 men in the age group of 65 yearsand older.
In many South Asian countries, usage of the health care system is dominated by boys,suggesting a strong anti-female bias. Again, this is not the case in Bhutan. Gender relationsin Bhutan tend to be more egalitarian and less inhibited than in many other societies. Oftengender roles overlap and the head of the family can depend simply on who is most capable.A household short of women may have a man taking care of household chores and children.Bhutanese women enjoy considerable freedom and are treated equal to men under thelaw. There is no overt discrimination on the basis of gender. Women’s role is as vital asmen’s in the rural and urban economy, and they are actively involved in all areas ofeconomic, political and social life. Much of the retail trade is controlled and managed bythem. In the political forum, women attend most public meetings and important district

Searching for common ground
bhutan national human developmentREPORT 2000
33
meetings. Their participation in the decision-makingfora such as Zomdus (community meetings) at thegrassroots level is as high as 70%, and they participateactivly in other decision-making fora like district andblock development committees is greatly promoted.The placement of women in the higher strata ofGovernment is being encouraged, with 9 womenpeople’s representatives in the National Assembly, thehighest legislative body of the country, being a clearindication of this.
In the past, however, women did not occupy many high Government posts. This partlyreflects the low recruitment in earlier years because of the availability of fewer educatedwomem. This was a result of physical constraints that made educational institutions, mostlyoutside the country, almost inaccessible to Bhutanese students, especially girls. The futurewill probably be different. Women form 19% of the civil service sector and are opting tobecome doctors, mechanics, engineers, entrepreneurs and decision-makers. Femalerepresentation is particularly notable in institutes such as the Teacher Training College,National Institute of Education and Royal Institute of Health Sciences.
The law in Bhutan treats men and women equally. The law of inheritance, for example,reserves equal rights for all children, irrespective of sex and age. In fact, the predominantinheritance laws are particularly favourable to women. Daughters are known to inherit allthe family property, and sons move in with their wife’s family. However, in practice,traditional systems operate and these practices are informal, flexible and circumstantial.For instance, if a man marries into a family that has large land holdings but is short ofmanpower, he will live with the bride’s family and not ask, or receive, a share of land fromhis family. This is so with women as well. The bride or bridegroom who moves into thehome of the spouse enhances the productivity of the household and seeks no othercompensation. When family property is divided, the share given each child may varybecause the parents’ decisions are often guided by the relative need of the child. In mostparts of Bhutan, the social custom favours women’s interests.
In matters of marriage, both men and women enjoy equal freedom to choose their partners.The practice of dowry, characteristic of many Asian societies, is unknown in Bhutan. Thereis no social stigma attached to divorce, and women having children outside of marriage

Gross national happiness and human development
REPORT 2000bhutan national human development
34
are not looked down upon. All couples are encouraged to obtain a legal “marriagecertificate” from the Court. Both partners can initiate divorce proceedings. If wrong doingby either partner is cited as a reason for divorce and guilt is established, the guilty partnerreceives only one-third of all properties and assets held individually or jointly. Mothersare awarded custody of children under the age of 9, regardless of who bears guilt ofseparation. During this period, child support is provided by the father, which is 20% ofhis monthly income until the child attains 18 years of age. After age 9, the children arefree to choose which parent to live with. Legislation for ensuring equal treatment for menand women continues to evolve and develop as people encounter new situations.
Governance and Decentral izationIn addition to promoting social and economic opportunities for its people, Bhutan also hasstriven to improve its system of public administration and local governance. The RoyalGovernment embarked on the process of decentralization under the Royal initiative of HisMajesty the King. The establishment of Dzongkhag Yargye Tshogchung (DYT) in 1981 andGeog Yargye Tshogchung (GYT) in 1991 has helped tremendously in the decentralizationprocess in Bhutan.
The Tshogdu consists of 150 members; 105 are elected representatives of the people, 10are from the Dratshang and 35 are nominated representatives of the Royal Government.The people’s representatives are directly elected by the people of their respectiveconstituencies through secret ballot. Representatives of the clergy are elected by the ZhungDratshang (Central Monastic Body) and the concerned Rabdeys (District Monastic Bodies).The representatives of the government are nominated by His Majesty the King from amongsenior civil servants. All members except the representatives of the clergy, who serve forone year, serve a term of three years. The Speaker and the Deputy Speaker are electedby the National Assembly from among the members. The National Assembly meets up totwice a year to enact legislation and advise the government on all matters of nationalimportance.
The Lodey Tshogdey (Royal Advisory Council), formally established in 1965, advises HisMajesty the King and the Ministers, and monitors the implementation of policies andprogrammes approved by the National Assembly. The Council consists of nine members.Six are representatives of the public (Meeser Thuepoens) and are elected in the NationalAssembly among representatives of the 20 Dzongkhags (districts). Two members representthe Central Monastic Body, and the chairman is nominated by His Majesty the King.

Searching for common ground
bhutan national human developmentREPORT 2000
35
Planning and all development activities in Bhutan, asin most other countries, were initially centralized. TheRoyal Government se t development pr ior i t ies ,designed programmes and monitored performance. Inthe early 1980s, this began to change. Recognizingthe impor tance o f peop le ’ s par t i c ipa t ion indevelopment process, His Majesty the King initiated adecen t ra l i za t ion po l i cy to p romo te peop le ’ spar t i c ipa t ion in deve lopmen t p lann ing andimplementation. Administration and planning beganto be decentralized, meaning that development in each district could be planned based onthe needs and resources of the local people. The 560 elected members of the DzongkhagYargye Tshogchung.are responsible for proposing their own development plans, andsubmitting them to the Royal Government. To finalize these plans, His Majesty the Kingpersonally leads planning teams to the Dzongkhags, holds detailed discussions to reachconclusive decisions in consultation with the people.
In 1991 His Majesty the King reconstituted the national Planning Commission and handedover the chairmanship to the Planning Minister to ensure greater decentralization in thedecision-making process. A Technical Committee of 21 heads of departments and othersenior officers was set up to lend professional support to the Planning Commission and topromote greater participation of Government agencies. In the same year, as noted above,His Majesty established the Geog Yargye Tshogchung (GYT) in all 196 geogs, with2,589 elected members. These Committees are headed by gups (village leaders) andare responsible for assessing local needs, determining priorities, deciding on programmesand monitoring progress of all development activities in their geogs. The gups alsoare responsible for collection of taxes in rural areas, mobilization of resources forcommunity services, settlement of local disputes, maintenance of water supply andsupervision of social services. With the dissolution of the Lhengyel Zhuntshog by RoyalDecree in 1998 to bring changes to the governance system in the Kingdom, the PlanningCommission was reconstituted with 17 members appointed based on their professionaland individual capacity.
Under the current governance, consolidation of the judicial, legislative and executivearms of the state has been emphasized. His Majesty the King further initiated major

Gross national happiness and human development
REPORT 2000bhutan national human development
36
reforms and issued a Kasho (Royal Edict) during the 76th National Assembly in1998, culminating in devolution of all executive authority to the elected Council of Ministers.The Ministers were mandated to take the nation forward into a new era of governanceand enhance efficiency, improve transparency and ensure accountability in the Bhutanesesystem.
This process of steady decentralization has enabled Bhutan to ensure a system ofgovernment that enjoys the mandate of the people, providing clean and efficientgovernance. The momentous changes in the structure of the Government in 1998 kepthuman development and happiness focused and the Royal Government playing an activerole in mobilizing and managing resources, extending technical support and creating anenabling environment for local governance. The result has been to expand humancapabilities and increase opportunities for people in many different spheres of life.

Searching for common ground
bhutan national human developmentREPORT 2000
37
Chapter 3Economic growth and human development
Report 2000bhutan national human development
gross national happiness and human development - searching for common ground

Gross national happiness and human development
REPORT 2000bhutan national human development
38
ECONOMIC GROWTH AND HUMAN DEVELOPMENT.
Over the years, Bhutan has developed a unique approach to development. Deeply ingrainedin policy-making is the idea that development is not simply about material progress andaccumulation of wealth. The country is very conscious about the negative consequencesof unchecked commercial expansion. People, their needs, well-being and happiness arecentral to all development efforts. In addition, there is strong recognition that humanprogress should advance not merely people’s physical standards of living, but also theiremotional and spiritual well-being. Ensuring compatibility of development efforts with thepeople’s socio-cultural traditions is regarded as essential for ensuring sustainabledevelopment. Every effort is made to weave human conservation into the process ofeconomic growth. Conservation is not narrowly confined to issues of the environment, butis typically interpreted to include Bhutan’s cultural traditions and human values.
As has been seen, policy makers in Bhutan are concerned more with the quality ofdevelopment than with its pace. A conscious effort is made to take a long-term view ratherthan to adopt policies that may result in just short-term gains. The quest is to strike a balancebetween forces of development, such that they enrich the lives of people. These principlesare reflected in number of measures that the country has taken to promote economic growthand human development.
Growth-Mediated Securi tyThe process of planned development was strengthened with the inauguration of the PlanningCommission in 1971. Planning received a further impetus in 1974 when, during theCoronation Ceremony that June, His Majesty the King identified the achievement ofeconomic self-reliance as the most important task before the country. He defined nationalself-reliance to mean, in the Bhutanese context, the ability “to stand on one’s own feet,have the power of decision in one’s own hands, and not be dependent on others.”
Detailed time series data with respect to major macroeconomic variables are not availablefor the period before 1980. Between 1980 and 1998, however, Gross Domestic Productgrew steadily, averaging 6.7%. In the 1980s alone, GDP grew at an even higher averageof 7.3% per annum, with income almost doubling between 1980 and 1989. The economicgrowth slowed between 1990 and 1998 but remained high nonetheless, averaging 5.9%per annum.

Searching for common ground
bhutan national human developmentREPORT 2000
39
A marked change also has occurred in the composition of GDP. In the early 1980s,agriculture, livestock, forestry and fishing, along with trade, were the main sectors,accounting for more than two-thirds of the country’s GDP. By 1990, their share had declinedto 42.7%, and now they account for only 36.7% of the country’s GDP. During the 1980s,the country began to develop the enormous hydropower potential arising out of the steepsouthern watershed of the Himalayas. A surge occurred in hydropower development andestablishment of associated industries in the second half of the decade. In 1987, thecountry’s first major hydropower project in Chukha went into production, enabling theexport of power to India and the setting up of energy-intensive industries in the country.
As a result, the share of mining, manufacturing and electricity soared from 4% of GDP in1980 to 24.5% of GDP by 1998. The slowing down of growth in the 1990s is partlyattributable to the fact that no new hydropower or industrial projects have come onstreamsince 1990.
Between 1990 and 1998, mining and quarrying recorded the maximum growth, 12.3%per annum. This was followed by the manufacturing sector, which grew annually by 11.1%during the same period. Agriculture and allied activities recorded the slowest annualgrowth, 3.2%. The generation of economic growth by itself does not guarantee anexpansion in human development. Neither has the conversion of economic growth intoimproved human development taken place automatically in Bhutan. A set of consciouspolicies has made investment in people the top priority.
Every effort has been made to channel economic growth for ensuring universal access tobasic health, education and essential social services. Today, almost every Bhutanese family
Figure 5:Source:Royal Government of Bhutan
Annual GDP growth rate:1981-1998201816141210
86420
1980 1982 1984 1986 1988 1990 1992 1994 1996 1998 2000
Year
% g
row
th in
GDP

Gross national happiness and human development
REPORT 2000bhutan national human development
40
has shelter and access to land holdings, as well as free education and medical services.An effective primary health care system is in place that provides access to 90% of thepopulation. An extensive outreach system has been designed that ensures, often throughthe use of satellite communication, that help is made available as soon as possible toresidents even in remote villages. Provision of safe water, immunization of children,iodization of salt, promotion of public hygiene and ensurance of effective sanitation haveall been priorities. (See Box 4.)
The priorities given to improvements in the living conditions of people is reflected in theexpenditure patterns of the country. During the First Five-Year Plan, 59% of expenditures
Source: Central Statistical Organization (CSO)
(% of real GDP)1980 1990 1998
Agriculture, livestock,forestry & fishing 55.7 42.7 36.7Mining and quarrying 0.6 0.9 2.4Manufacturing 3.2 8.1 11.1Electricity, water and gas 0.2 7.8 11.0
Construction 7.9 8.1 10.6Wholesale & retail trade,restaurant & hotels 10.9 6.6 7.0Transport, storage &communications 4.3 7.1 7.5Financing, insurance &real estate 6.3 7.7 5.1Community, social &personal services (Govt) 10.8 11.0 8.6
Table 3: Composition of GDP
Searching for common ground
bhutan national human developmentREPORT 2000
41
were incurred on public works for the creation of necessary infrastructure. Since then asteady decline in the allocations for public works has occurred, and during the SeventhPlan only about 8% of the development outlay was earmarked for the purpose. Allocationsto health and education went up from about 12% during the First Plan to 27% during theSecond and Third Plans; they were around 17% during the Fourth Plan but declined to13% during the Fifth and 12.4% during the Sixth. In the Seventh Plan, once again,allocations to health and education went up, to nearly 18%. The Eighth Plan (1997-2002)reflects a 58% increase in allocations to social sector development.
Financing of DevelopmentOpening up to the forces of modern development automatically meant breaking barriers,accepting foreign aid and expanding trade. In 1961, Bhutan’s first big step towarddevelopment was its roads, which were built with India’s assistance. Bhutan’s first twoFive-Year Plans were wholly financed by the Government of India through grants. Bhutanalso developed its hydropower potential and its industrial base in collaboration with theGovernment of India. Gradually, other donor countries began to extend support and theshare of aid from India started declining. After Bhutan joined the United Nations in 1971,UNDP and other UN agencies, the World Bank and the Asian Development Bank began toassist the country. Aid also came from major bilateral donors such as Japan, Switzerland,Denmark, Germany, Austria and the Netherlands. By 1984, 71% of the country’s revenuesconsisted of grants and India’s share had come down to roughly 50% of total grants.
In 1998, exports accounted for 30.3% of GDP and imports for 38.6%. India continues tobe Bhutan’s most important trading partner, buying 94% of all exports and accounting for71% of all imports in 1998/99. Trade between the two countries is without tariffs.
While Bhutan relied primarily on foreign aid for its development until 1987, domesticresource mobilization prospects drastically improved with the commissioning of the Chukhahydropower project that year. Bhutan and India entered into an agreement for developingChukha on a grant-cum-loan basis, under an energy buy-back arrangement, for 99 years;electricity generated by Chukha but not consumed within Bhutan is thus exported to India.In 1993, about 90% of the electricity generated by Chukha was exported to India; Bhutan’srevenues doubled between 1985/86 and 1987/88. By 1999, Chukha was accounting foralmost 11% of total revenues generated.

Gross national happiness and human development
REPORT 2000bhutan national human development
42
In the early 1980s Bhutan’s external debt was negligible, but because of loans fordeveloping the power sector, the total outstanding debt had risen to $133 million by 1994.Since then, debt has been gradually declining, with debt service payments falling to 6.8%of exports of goods and services in 1997-98.
Options for domestic resource mobilization through taxation have been limited in thecountry; its tax-to-GDP ratio has been increasing steadily since 1990, to about 8% in 1998.Consequently, Bhutan has relied on grants and, more recently, on export of electricity. In1996, grants amounted to 24.7% of the country’s GDP and 46.7% of total revenues.
With little scope to increase domestic taxes, the recurrent budget requirements, especiallyfor the social sectors, are under considerable strain. Bhutan is conscious of its reliance onforeign aid. At the UN’s Sixth Round Table Meeting (1997), the Royal Government assertedthat it would continue to strive for self-reliance and reduced dependence on external aid.In keeping with Buddhist values, need rather than greed has been the guiding principle inthis regard. Bhutan has used a mix of local revenue mobilization, foreign aid andinternational loans to finance its development. The reliance on foreign grants does seemlarge, but it is also consistent with an environmentally conscious global philosophy thatrecognizes the international significance of Bhutan’s environmental wealth and the needto conserve it. There is, however, additional potential for revenue mobilization from thefurther expansion of hydropower projects, which the Government has not yet tapped.
Preventing Rather than Correcting Market FailuresOne of the most salient features of development in Bhutan has been prevention of market
0
2
4
6
8
10
1987
1988
1989
1990
1991
1992
1993
1994
1995
1996
1998
4.96.1
5.44.8
5.35.36.46.2
6.87.5
8
Tax-to-GDP ratio in Bhutan: 1
Year
Tax revenues as % of
GDP
Figure 6Source:Royal Government of Bhutan
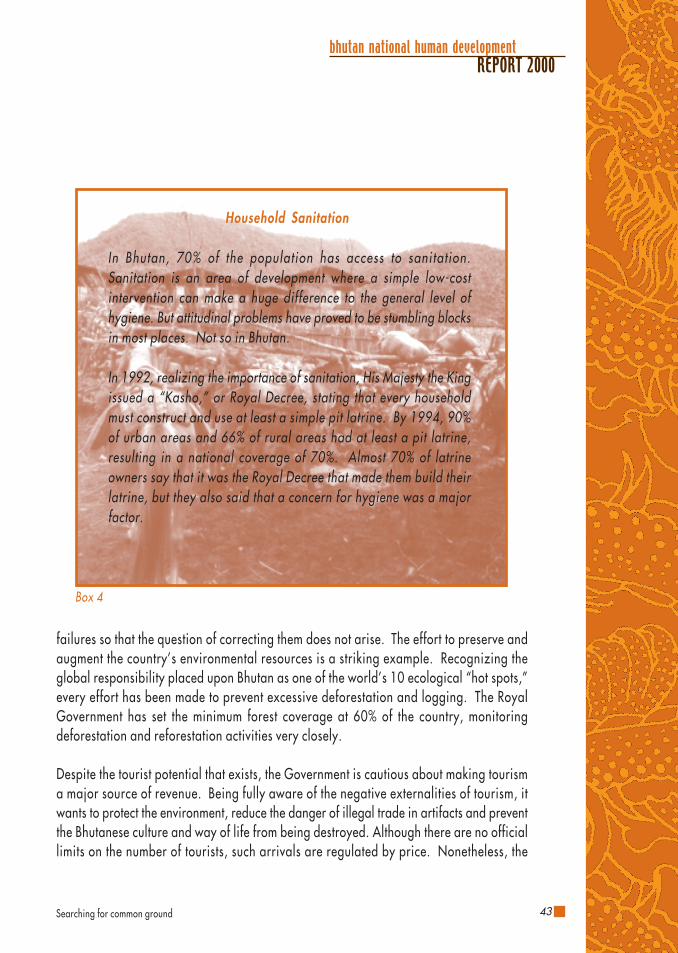
Searching for common ground
bhutan national human developmentREPORT 2000
43
failures so that the question of correcting them does not arise. The effort to preserve andaugment the country’s environmental resources is a striking example. Recognizing theglobal responsibility placed upon Bhutan as one of the world’s 10 ecological “hot spots,”every effort has been made to prevent excessive deforestation and logging. The RoyalGovernment has set the minimum forest coverage at 60% of the country, monitoringdeforestation and reforestation activities very closely.
Despite the tourist potential that exists, the Government is cautious about making tourisma major source of revenue. Being fully aware of the negative externalities of tourism, itwants to protect the environment, reduce the danger of illegal trade in artifacts and preventthe Bhutanese culture and way of life from being destroyed. Although there are no officiallimits on the number of tourists, such arrivals are regulated by price. Nonetheless, the
Box 4
Household Sanitation
In Bhutan, 70% of the populat ion has access to sani tat ion.Sanitation is an area of development where a simple low-costintervention can make a huge difference to the general level ofhygiene. But attitudinal problems have proved to be stumbling blocksin most places. Not so in Bhutan.
In 1992, realizing the importance of sanitation, His Majesty the Kingissued a “Kasho,” or Royal Decree, stating that every householdmust construct and use at least a simple pit latrine. By 1994, 90%of urban areas and 66% of rural areas had at least a pit latrine,resulting in a national coverage of 70%. Almost 70% of latrineowners say that it was the Royal Decree that made them build theirlatrine, but they also said that a concern for hygiene was a majorfactor.
Gross national happiness and human development
REPORT 2000bhutan national human development
44
number of tourists visiting Bhutan has increased from 1,538 in 1990 to 5,365 in 1997and 7,174 in 1999, with steady improvement in facilities and infrastructure. However, thecontribution of tourism to the economy remains modest and total tourism receipts amountedto US$6.5 million in 1997 and US$8.7 million in 1999, of which one-third was collectedas Government royalties.
Similarly, the Royal Government plans to build and develop growth centres in rural areasas a strategy to check rural-urban migration. It is a way of preventing problems ofcongestion, pollution, crime, homelessness and so forth that typically result from rapidurbanization and excessive migration. To sum up, in many ways, Bhutan’s approach todevelopment is judicious and conservative. It is guided by a long-term vision of humansecurity in which benefits of economic growth are consciously channeled to meet the mostbasic requirements of the people.
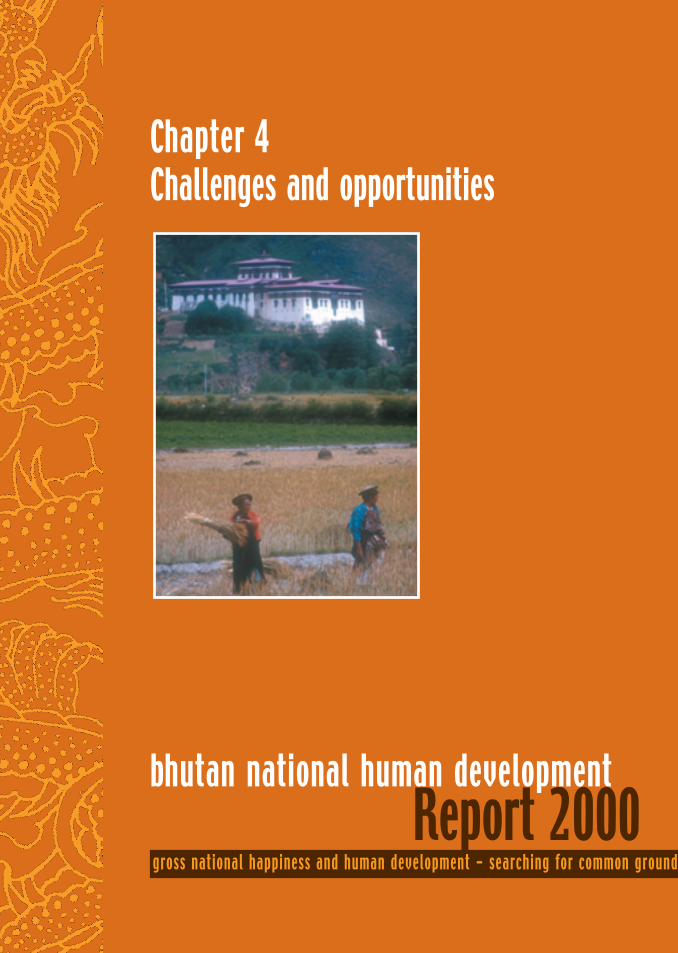
Searching for common ground
bhutan national human developmentREPORT 2000
45
Chapter 4Challenges and opportunities
Report 2000bhutan national human development
gross national happiness and human development - searching for common ground

Gross national happiness and human development
REPORT 2000bhutan national human development
46
CHALLENGES AND EMERGING OPPORTUNITIES
Bhutan has so far successfully managed the process ofdevelopment and ensured a harmonious balancebetween modern economic forces, traditional socialvalues and the natural environment. But as the countryenters the next phase of development, it faces a set ofnew challenges. Till now, the development effort was,to a large extent, limited to basic tasks like buildinginfrastructure, constructing roads and opening healthcare centres and schools. Today, this physical foundation
is largely in place. Now, the focus has to be on ensuring that the public provisioning ofbasic social services is of good quality, and at the same time is equitable and efficient.Already, the public outlay on health, education, water supply and sanitation accounts formore than 20% of the Government’s expenditure. But as the population increases, andmore and more people expect to have improved access to these basic social services, theburden on the exchequer can only increase.
Populat ion GrowthIf the rate of population growth of 3.1% per annum is maintained, then the country’spopulation is likely to double by the year 2020. Apart from the implications this holds forthe availability and quality of basic social services, this also is likely to pose a seriousthreat to Bhutan’s environmental resources. Many forest areas already are under heavypressure for exploitation for fuel, timber and other wood products. The need for moregrazing lands also could come into conflict with the goal of protecting forest lands.
As in all developing societies, the surge in Bhutan’s population growth is the result of asteep fall in the death rate, itself a testimony to the success of health care policies adoptedin the last four decades. However, the fall in the death rate has not been accompanied bya lower birth rate. To control the population growth rate, therefore, family planningactivities have been stepped up, including the supply of contraceptives, the disseminationof information on family planning and the expansion of maternal and child health carefacilities.

Searching for common ground
bhutan national human developmentREPORT 2000
47
Education and Empowerment of WomenSimultaneously, although gender disparity is less marked in Bhutan than in the rest of SouthAsia, every effort has been made to encourage educational attainment among women.Around the world, a fall in fertility rates has been linked to the education and empowermentof women, in addition to, of course, improved reproductive health care and economicsecurity.
Rising Aspirations of the Educated YouthSocial transformation goes hand in hand with economic change. The spread of moderneducation already is creating a class of young people who no longer fit in with thetraditional rural lifestyle. In the next five years alone, around 50,000 young people willleave school and enter the labour market. Also five years from now, more than 100,000children will be enrolled in primary school. With 42% of the country’s population beingyounger than age 15, creating appropriate employment opportunities that meet the risingaspirations of the younger generation will be a major challenge. To meet this challenge, aNational Employment Board has been created, which will be the predecessor to a Ministryof Labor. This board is mandated to coordinate and facilitate employment, recruitmentand job market research for employment as well as regulate policies related to theconditions of employment.
Encouraging the Growth of the Private SectorAt present, the Government is the major employer in the country, and civil service jobs arecoveted badges of honour. But the civil service already is showing signs of saturation,while the nascent private sector is in no position to absorb the thousands of job aspirants.The Government therefore needs to encourage the private sector to play a more meaningfulrole in the country’s development; this would create more jobs in business and industryand ease the employment pressure on the Government. However, the Government first ofall must expand opportunities for market development, followed by higher investments ininfrastructure, banking, communications and transportation. Bhutan today has 3,636kilometres of road network, 7,445 telephone connections and 105 post offices coveringalmost all 20 Dzongkhags.
Private-sector employment also would require an appropriate match of technical andvocational skills with job needs and opportunities. The issue of quality and content of

Gross national happiness and human development
REPORT 2000bhutan national human development
48
education therefore must be urgently addressed so that the country is equipped to takemajor strides in fields like energy, forestry, agriculture and chemicals. Greater focus mustbe given to develop strategies for promoting private- sector development and enhancedthrough adequate provision of financial support, legal protection and licensing.
Redefining the Role of the GovernmentIf the private sector is to become an engine of economic growth, the Government will needto redefine its role from that of “provider” to “enabler” of development. Social protectionand security will, of course, remain the state’s primary responsibility, but civil servantsmust be less of regulators and more of development administrators. The mission must beto further the process of decentralization already set in motion. This should strengthen themechanisms of local governance and generate more community participation in decision-making. The objective should be to develop a system of governance that enlargesopportunities for people at all levels to participate more fully and effectively in decisionsthat have a bearing on their lives, livelihoods and future of their families, communities andnation. It is with this aim that the Bhutanese system was restructured in 1998 under theRoyal Decree and reform was initiated to review, rationalize and find solutions that willhelp to redefine role of the state. In addition, the Government has initiated the developmentand design of the National Standardized and Computerized Monitoring and EvaluationSystems. Steps also have been taken to develop a Computerized National PlanningInformation System to support efficient decision-making in development planning and incomplementing the M&E System at the same time.
Rapid Urbanization and Migration from Rural AreasLargely because of the increasing migration from rural to urban areas, cities are expanding
at an extraordinary pace. Thimphu’s population isgrowing annually by an unprecedented 10%. Poorlyequipped to deal with this influx of migrants, the urbanareas are witnessing severe constraints of housing, waterand sanitation. Vehicular pollution is increasing rapidly.Systematic urban planning is urgently needed. Ratherthan seeking to reduce the overall urbanization rate,the cha l lenge i s to red is t r ibu te urban growth,recognizing, however, that rural-urban migration haspositive effects too. Most important, it can ease thepressure on available agricultural land, most of which

Searching for common ground
bhutan national human developmentREPORT 2000
49
has already been brought under cultivation. Migrationmay slow the trend toward fragmentation of landholdings, thereby facilitating increasing mechanizationthat would, in turn, increase productivity. On the otherhand, increased productivity also could result in labourdisplacement, fueling rural-urban migration. Realizingthe adverse effects of the migration, the Governmenthas taken initiatives to step up measures to meet thechallenges comfortably. The Division of UrbanDevelopment and Housing has been created, and newurban centres have been identified.
Rural DevelopmentManaging rural development, then, is as important as managing urbanization, because itcan help curb the drift to the cities, especially of the educated. Apart from initiating growthcentres and a decentralized system, which allows rural communities to plan their owngrowth, efforts must be made to further improve basic living standards in rural areas. Thisincludes ensuring effective and accessible health services, income-generating agriculturaland cottage sector programmes, better transport and communications and wider access toelectricity and safe water.
Environmental Conservat ionBhutan has successfully managed to conserve its natural resources till now, but the forcesunleashed by development — be it urbanization, industrialization or even the provision ofinfrastructure like roads and sewage pipes — will inevitably strain the fragile environmentalbalance of this mountainous Kingdom. Still, during the pursuit of economic growth, everyeffort has been made to ensure that the process of modernization does not undulycompromise the country’s rich natural resources. As much as 72% of the land is underforest cover, and it is the Government’s policy to maintain a minimum of 60% as suchforever. To prevent over-exploitation of Bhutan’s natural resources, the Government hasdeliberately chosen to forgo immediate economic gains from the indiscriminate developmentof sectors like tourism and mineral quarrying. This judicious approach is bound to paydividends in the long run, because it will ensure the sustained growth of these industries.Bhutan’s abundant water resources also are a potential source of revenue. It has beenestimated that the country’s four major rivers can generate 20,000 MW of electricity.Indeed, the hydropower sector has the highest potential for revenue generation.

Gross national happiness and human development
REPORT 2000bhutan national human development
50
Cultural Identity and Traditional ValuesAs economic and social transformation gathers momentum and Bhutanbecomes increasingly integrated with the outside world, people’slifestyles are changing along with family structures. Assimilating thesechanges without losing the country’s unique cultural identity is one ofthe main challenges facing Bhutan today.
Recognizing that there is no automatic link between economic growthand human development, the Government has initiated several policiesthat have led to the enhancement of human capabilities in Bhutan bypromoting opportunities in all spheres of life. But now the time has comefor the nation to consolidate these gains: Choices need to be made invaried fields involving a careful assessment of tradeoff and opportunitycosts. What is important, as always, is not to lose sight of a nationalsense of peace, happiness and security.
In the 11th Century, the great Buddhist master Milarepa wrote:“There are in the heart of the vast Himalayas some strange marketplaces where one canbarter the whirlwind of life for infinite wisdom.”Bhutan is acquainted with these marketplaces—but how well the kingdom manages themwill determine its future.

Searching for common ground
bhutan national human developmentREPORT 2000
51
Technical Appendix A1
Computing the Human Development Index for Bhutan
The Human Development Index (HDI) is based on three indicators: longevity, as measuredby life expectancy at birth; educational attainment, as measured by a combination of adultliteracy (two-thirds weight) and combined primary, secondary and tertiary enrolment ratios(one-third weight); and standard of living, as measured by real GDP per capita (PPP$).
Fixed minimum and maximum valuesTo construct the index, fixed minimum and maximum values have been established foreach indicator:
Life expectancy at birth: 25 years and 85 yearsAdult literacy: 0% and 100%Combined enrolment ratio: 0% and 100%Real GDP per capita (PPP$): PPP$100 and PPP$40,000
For any component of the HDI, individual indices are computed according to the generalformula:
Actual xi value - minimum xi valueIndex =
Maximum xi value - minimum xi value
If, for example, the life expectancy at birth in a country is 65 years, the index of lifeexpectancy for this country would be:
65 - 25 40Life Expectancy Index = = = 0.667
85 - 25 60
1 See also Technical Note in 1999 Human Development Report. The Human DevelopmentIndex for Bhutan has been constructed on the basis of data available with the RoyalGovernment. Technical Appendix 2 discusses the database and sources for humandevelopment indicators in Bhutan.
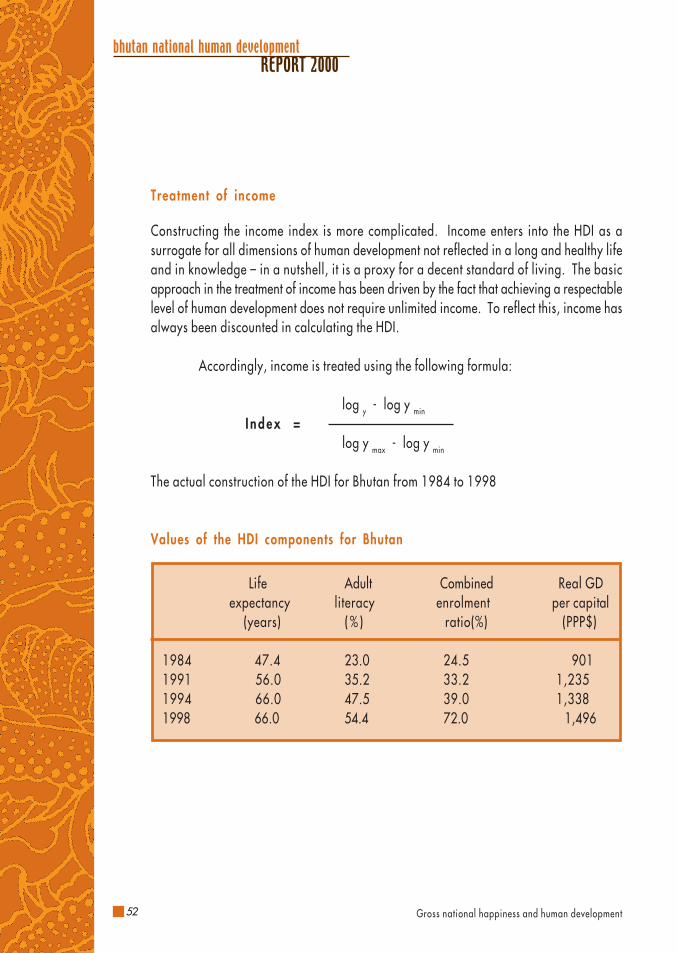
Gross national happiness and human development
REPORT 2000bhutan national human development
52
Treatment of income
Constructing the income index is more complicated. Income enters into the HDI as asurrogate for all dimensions of human development not reflected in a long and healthy lifeand in knowledge – in a nutshell, it is a proxy for a decent standard of living. The basicapproach in the treatment of income has been driven by the fact that achieving a respectablelevel of human development does not require unlimited income. To reflect this, income hasalways been discounted in calculating the HDI.
Accordingly, income is treated using the following formula:
log y - log y min
I ndex =log y max - log y min
The actual construction of the HDI for Bhutan from 1984 to 1998
Values of the HDI components for Bhutan
Life Adult Combined Real GD expectancy literacy enrolment per capital (years) (% ) ratio(%) (PPP$)
1984 47.4 23.0 24.5 901 1991 56.0 35.2 33.2 1,235 1994 66.0 47.5 39.0 1,338 1998 66.0 54.4 72.0 1,496
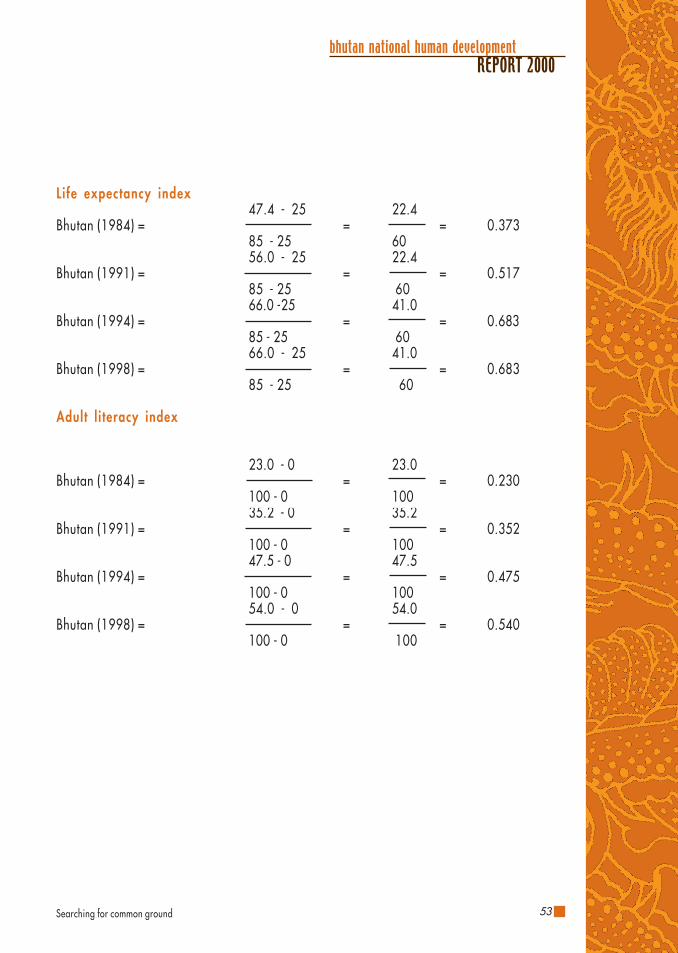
Searching for common ground
bhutan national human developmentREPORT 2000
53
Life expectancy index47.4 - 25 22.4
Bhutan (1984) = = = 0.37385 - 25 6056.0 - 25 22.4
Bhutan (1991) = = = 0.51785 - 25 6066.0 -25 41.0
Bhutan (1994) = = = 0.68385 - 25 6066.0 - 25 41.0
Bhutan (1998) = = = 0.68385 - 25 60
Adult l i teracy index
23.0 - 0 23.0Bhutan (1984) = = = 0.230
100 - 0 10035.2 - 0 35.2
Bhutan (1991) = = = 0.352100 - 0 10047.5 - 0 47.5
Bhutan (1994) = = = 0.475100 - 0 10054.0 - 0 54.0
Bhutan (1998) = = = 0.540100 - 0 100

Gross national happiness and human development
REPORT 2000bhutan national human development
54
Combined primary, secondary and tertiary enrolment ratio index
24.5 - 0 24.5Bhutan (1984) = = = 0.245
100 - 0 100 33.2 - 0 33.2
Bhutan (1991) = = = 0.332100 - 0 10039.0 - 0 39.0
Bhutan (1994) = = = 0.390100 - 0 10072.0 - 0 72.0
Bhutan (1998) = = = 0.720100 - 0 100
Educational attainment indexBhutan (1984) = 2(0.230)/3 + (0.245) / 3= 0.235Bhutan (1991) = 2(0.352)/3 + (0.332) / 3= 0.345Bhutan (1994) = 2(0.475)/3 + (0.390)/ 3 = 0.447Bhutan (1998) = 2(0.540)/3 + (0.720) / 3= 0.600
Adjusted real GDP per capita (PPP$) indexThe adjusted real GDP per capita for Bhutan would be:
log(901) – log(100)Bhutan (1984) = = 0.367
log(40,000) – log(100)log(1,235) – log(100)
Bhutan (1991) = = 0.420log(40,000) – log(100)log(1,338)-log(100)
Bhutan (1994) = = 0.433log(40,000) - Log(100)log(1,534) – log(100)
Bhutan (1998) = = 0.460log(40,000) – log(100)

Searching for common ground
bhutan national human developmentREPORT 2000
55
Human Development IndexThe HDI is the simple average of the life expectancy index, educational attainment indexand the adjusted real GDP per capita (PPP$) index. It is calculated by dividing the sum ofthe three indices by 3. The HDI for Bhutan for 1984, 1991, 1994 and 1998 were calculatedas follows:
Discrepancies exist in the values of the indicators used by the global Human DevelopmentReport and those used by the RGoB. The main differences are the following:
Values of the HDI indicators for 1997:
Global 1999 Human Royal GovernmentDeve lopmen t Report of Bhutan
Life expectancy at birth (years) 60.7 66.1Adult literacy (%) 44.2 54.0Combined enrolment ratio 12.0 72.0Real GDP per capita (PPP$) 1,467 1,534Human Development Index 0.459 0.581
The difference in life expectancy is due to different sources being used for estimation. TheRGoB estimate is based on the most recent demographic survey carried out in Bhutan,whereas the UN’s estimate is based on demographic projections. A big difference alsooccurs in the combined enrolment rate. The UN figure of 12% is unrealistically low; this isdue to the population total of 1.9 million used for the calculation.
Life Education GDP Sum of the Humanexpectancy Index Index indices DevelopmentIndex Index
1984 0.373 0.235 0.367 0.975 0.3251991 0.517 0.345 0.420 1.282 0.4271994 0.683 0.447 0.433 1.563 0.5211998 0.683 0.600 0.460 1.743 0.581

Gross national happiness and human development
REPORT 2000bhutan national human development
56
Technical Appendix BNote on Human Development Indicators for Bhutan
The preparation of Bhutan’s first Human Development Report has served several usefulpurposes. The Report presents to the reader a picture of the state of human developmentin the country and the progress made since 1961. Discussions held during preparation ofthe Report were helpful not only in reviewing achievements and shortcomings, but also inidentifying several areas for more careful analysis. But most significantly, the exercisedrew attention to the limited availability of good-quality data on human developmentindicators, and to the severe constraints that this imposes on planning, programmedevelopment and policy formulation. This has prompted the Royal Government to initiateaction to review and strengthen the country’s national statistical base.
Like many developing countries, Bhutan’s database for assessing levels of humandevelopment is weak. Practically no quantitative data on socio-economic conditions areavailable for the period before 1960. Several efforts have been made to collect data onliving conditions after the country began modern development in 1961. However, thesestudies could not be carried out systematically and periodically because of variousconstraints, most notably the absence of sufficiently trained manpower. As a result, thesurveys vary in coverage, quality and usefulness. Results of different surveys are notcomparable because the sampling design and methodologies also tend to differ from oneto another. This greatly limits the ability to monitor trends and progress.
Carrying out socio-economic surveys in Bhutan poses several challenges. The country’ssmall population (estimated at 636,499 in 1998) means there is a limit to the availabilityof resources necessary to field the large-scale surveys needed to estimate many indicators,disaggregated by gender, class, ethnicity, income and expenditure groups, andgeographical locations. In addition, the country’s mountainous topography and the widelydispersed pattern of human settlements make the task of the field investigator extremelydifficult. An otherwise simple household-level cluster survey becomes very arduous andcomplicated when there are often only four or five households per village, where a villagecould be several days’ walk from the nearest motorable point, and when walking from onehousehold to another could mean climbing steep slopes. Nonetheless, these physicalconstraints do not justify the non-availability of systematic disaggregated data on human

Searching for common ground
bhutan national human developmentREPORT 2000
57
development. On the contrary, they point to the need to devote additional resources,technical expertise, time and effort for data collection.
This brief note discusses some of the data sources and problems concerning Bhutan’s humandevelopment indicators.
Populat ion:A significant discrepancy exists between the population totals reported by the UnitedNations and those provided by the Royal Government of Bhutan. The estimates of theUnited Nations place Bhutan’s population at 1.9 million in 1997. The UN’s estimate is aprojection based on RGoB’s estimate of 1.035 million in 1969.
The Royal Government had estimated Bhutan’s population for 1998 to be 636,499.Estimates for previous years are as follows:
Estimated population1984 452,0001985 460,2781986 468,7081987 477,2921988 486,0341989 494,9351990 504,0001991 518,0001992 533,0001993 548,0001994 564,0001995 582,0001996 600,0001997 618,5571998 636,499
Efforts have been initiated by both the Royal Government and the United Nations toreconcile these figures and validate new population totals for Bhutan. The World Bank, inits computation of per capita GNP for Bhutan, takes into account the lower population
Gross national happiness and human development
REPORT 2000bhutan national human development
58
total provided by RGoB, whereas for other calculations (such as enrolment rates), the UNcontinues to use the UN estimate of 1.9 million for 1997. No official figures are availablefor some vital aspects of Bhutan’s population, including rural and urban totals and district-level totals.
Demographic and health surveysBhutan has yet to institute a comprehensive system of vital registration that can providecomplete and accurate data on births and deaths. The RGoB recognizes the importanceand the need for a system of sample registration that periodically gathers data on birthand death rates, causes of death, fertility and infant mortality for the country.
The first systematic survey to obtain demographic data was conducted by the CentralStatistical Organisation of the Planning Ministry and the National Institute of Family Healthbetween June and August 1984. This was an ad hoc demographic sample survey basedon a two-stage sampling procedure, with the sample size fixed at 5% of total population ineach Dzongkhag (district). Forty percent of the 56,205 individuals enumerated duringthe survey were 14 years and younger, 56% aged 15 to 65 and the remaining 5% olderthan 65. This survey updated earlier data on age composition, mortality, fertility andother demographic indicators. (See Table.)
Other sample surveys covering some indicators have been conducted since 1984, but thesehave not been nationally representative. In 1991, a demographic mortality survey wasundertaken in rural areas of 13 Dzongkhags. A total of 1,868 households with 12,375persons, including 3,163 women in the reproductive age group (15 to 49), wereenumerated.
The National Health Survey conducted in 1994 by the Health Division and the CentralStatistical Organisation, with technical support from SEARO and funding support from WHO,is the other recent source of demographic data. The objectives of the Survey were to (a)estimate with reasonable confidence national rates of infant mortality, under-5 mortality,total fertility and contraceptive prevalence; (b) determine the age and sex distribution of thestudy population; (c) determine the maternal mortality rate for the study population; and (d)assess the accessibility and utilization of health care services. A stratified two-stage samplingdesign was adopted for the survey, and a total of 11,716 households with 63,890 householdmembers were enumerated. The results provide estimates of population growth rates, infantand maternal mortality rates, crude birth and death rates, and fertility rates.
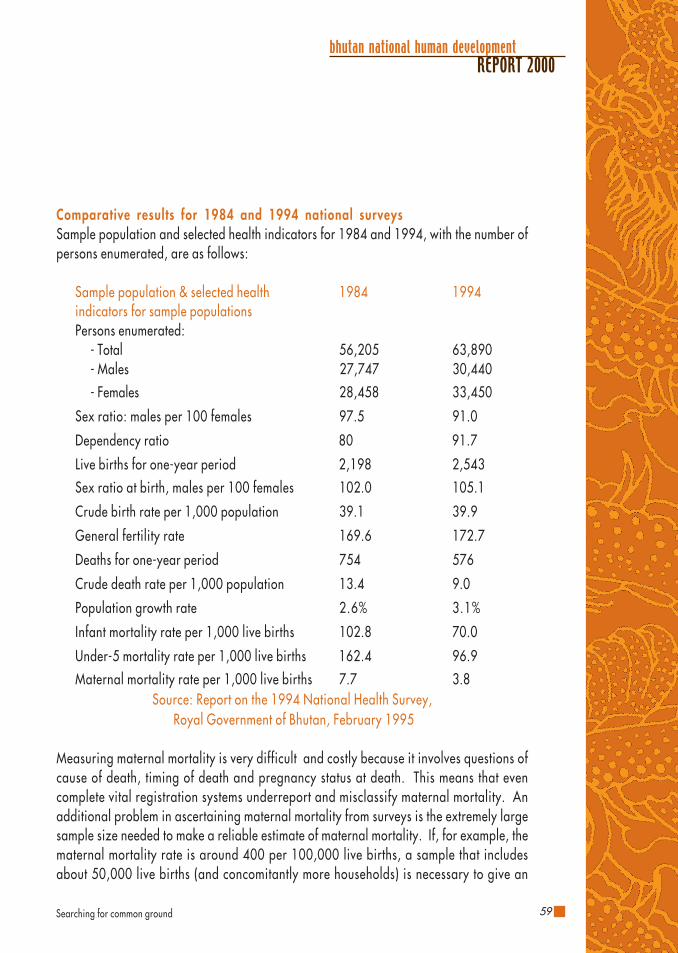
Searching for common ground
bhutan national human developmentREPORT 2000
59
Comparative results for 1984 and 1994 national surveysSample population and selected health indicators for 1984 and 1994, with the number ofpersons enumerated, are as follows:
Sample population & selected health 1984 1994indicators for sample populationsPersons enumerated:
- Total 56,205 63,890- Males 27,747 30,440
- Females 28,458 33,450
Sex ratio: males per 100 females 97.5 91.0
Dependency ratio 80 91.7
Live births for one-year period 2,198 2,543
Sex ratio at birth, males per 100 females 102.0 105.1
Crude birth rate per 1,000 population 39.1 39.9
General fertility rate 169.6 172.7
Deaths for one-year period 754 576
Crude death rate per 1,000 population 13.4 9.0
Population growth rate 2.6% 3.1%
Infant mortality rate per 1,000 live births 102.8 70.0
Under-5 mortality rate per 1,000 live births 162.4 96.9
Maternal mortality rate per 1,000 live births 7.7 3.8Source: Report on the 1994 National Health Survey,
Royal Government of Bhutan, February 1995
Measuring maternal mortality is very difficult and costly because it involves questions ofcause of death, timing of death and pregnancy status at death. This means that evencomplete vital registration systems underreport and misclassify maternal mortality. Anadditional problem in ascertaining maternal mortality from surveys is the extremely largesample size needed to make a reliable estimate of maternal mortality. If, for example, thematernal mortality rate is around 400 per 100,000 live births, a sample that includesabout 50,000 live births (and concomitantly more households) is necessary to give an

Gross national happiness and human development
REPORT 2000bhutan national human development
60
estimate with a confidence interval of plus or minus 20 percent. Such a large survey isclearly not a responsible use of scarce resources, and in Bhutan it is difficult to implement.Notwithstanding the constraints, a Maternal Health Survey with technical assistance fromWHO and UNICEF was conducted in 1994 and MMR was estimated at 380 maternal deathsper 100,000 live births.
It is important to note that with a birth rate of around 40 per 1,000 population, there aresome 26,000 babies born every year in Bhutan. An MMR of 380 per 100,000 live birthsimplies that there are about 100 maternal deaths in the country, out of the roughly 26,000deliveries that take place.
Periodic data are published by the Health Division on the functioning of the health system.This typically includes data on the number of health units and hospitals, health personnel,patterns of disease, utilisation of health services and immunisation coverage. There are,however, reportedly no comprehensive and periodic epidemiological studies, health,nutrition and morbidity surveys carried out in the country.
Educational statist icsThe Education Division, under the Ministry of Health and Education, regularly publishes“General Statistics” on schooling in Bhutan. Data are reported on (a) the number of schoolsand institutions, (b) number of students and (c) number of teachers. Detailed breakdownsare available on the enrolment and staff in different levels of schools and in institutions.Dzongkhag-wide distribution of school enrolment by gender and classes is also published.Comprehensive data on educational achievements and more reliable levels of learning atdifferent stages of schooling have to be enhanced through systematic literacy surveys.
Literacy rates: Based on the small surveys conducted in 1980 the literacy rate wasplaced (above 6 years) in 1980 at 23% and at 54% in 1994. Interpolating from thistrend yields a literacy rate of 29.4% for 1984.
Adult literacy rates: The construction of the HDI requires estimates of adult literacy rate(literacy rates among populations aged 15 and older). Estimates and recently worked outfigures based on the 1994
National Health Survey suggest that in Bhutan the population below 6 years of age is 18.7%,between 6 and 14 years is 23.3%, and above 15 years is 58%.

Searching for common ground
bhutan national human developmentREPORT 2000
61
It is estimated that the literacy rate (above 6 years of age) in 1994 was 54%. It is alsoreported that currently more than 90% of children enroll in primary schools and that thedropout rate in primary schools is around 4%. Assuming that some 70% of children in theage group of 6 to 14 years are literate, the adult literacy rate works out to around 47.5%.
It is estimated that the literacy rate (above 6 years of age) in 1984 was 29.4%. Assumingthat the age composition of the population in 1984 was the same as in 1994, and that theliteracy rate among the age group of 6 to 14 years was only 50% in 1984, the adultliteracy rate for 1984 works out to 23%. Similar extrapolations place the adult literacyrate for 1991 at 35.2% and for 1998 at 54%.
Combined first, second and third-level gross enrolment ratioThe construction of the HDI also requires data on gross enrolment ratios. According to theGeneral Statistics published by the Education Division, total enrolment at all levels ofeducation in 1994 was 70,886. This statistic on enrolment leaves out students inmonasteries, estimated at 15,000 in 1994. Therefore, the total enrolment in 1994 becomes85,886 (70,886 + 15,000).
The denominator for the combined gross enrolment ratio is population in the age group6-23 years. According to recent estimates, 39% of Bhutan’s population was in this agegroup. This yields a combined first-, second and third-level gross enrolment ratio of 39%for 1994.
According to the Royal Government of Bhutan, there were 1,500 students enrolled in alleducational institutions in 1959, which grew to 70,000 by 1990. This expansionary trendhas been used to estimate the number of children enrolled in 1984. Assuming that thechildren in monasteries were the same proportion then as they were in 1994 (some 17%of total enrolment), the total number of children enrolled at all levels of education in 1984works out to 40,325. Again, assuming that the population in the age group of 6 to 23years was the same in 1984 as it was in 1994 (39%), the combined gross enrolment ratioworks out to around 24.5% in 1984. Similar extrapolations place the estimate for 1991at 33.2%. The combined enrolment rate for 1998 has been estimated at 72%.
Income, wealth and expenditure surveysThe late starts in planned development and subsequent lack of trained and qualifiedmanpower constrains systematic surveys on the income and expenditure patterns of

Gross national happiness and human development
REPORT 2000bhutan national human development
62
households in Bhutan. There are a few small surveys of landholdings and asset ownership,but these are not nationally representative. Bhutan has yet to institute a comprehensivenational sample survey system that can collect, analyse and report data periodically ondifferent socio-economic aspects.
Real GDP per capita (PPP$)Bhutan has in place a system of national income accounts that provides regular data onkey macroeconomic indicators.
The 1999 Human Development Report estimates Bhutan’s real GDP per capita for 1997 tobe PPP$1,467. The PPP value of Bhutan’s GDP has been arrived at by multiplying the percapita figure of PPP$1,467 by the estimated population. Using this as the base, real GDPin PPP terms for every year between 1984 and 1998 has been worked out by applying thereal annual growth rates in GDP published by the RGoB. These figures have then beendivided by population to arrive at real GDP per capita in PPP dollars.
Estimated GDP Real GDP Real GDPPopulation at 1980 prices Per cap per cap
(mn.Nu) (Nu.) PPP$
452,000460,278468,708477,292486,034494,935504,000518,000533,000548,000564,000582,000600,000618,557636,499
1,4661,5201,6751,9731,9942,0872,2252,3032,4072,5532,7162,9183,0953,3213,514
3,2433,3023,5734,1344,1024,2174,4144,4474,5154,6594,8165,0145,1585,3685,521
9019179921,1481,1391,1711,2261,2351,2541,2941,3381,3931,4331,4911,534
198419851986198719881989199019911992199319941995199619971998

Searching for common ground
bhutan national human developmentREPORT 2000
63
LIST OF ACRONYMS
BHU Basic Health UnitGNH Gross National HappinessGNP Gross National ProductGDP Gross Domestic ProductIMR Infant Mortality RateIDD Iodine Deficiency DisorderTFR Total Fertility RateRIHS Royal Institute of Health SciencesDYT Dzongkhag Yargye TshogchungGYT Geog Yargye TshogchungHDI Human Development IndexNu. Bhutanese currency, or ngultrumNHDR National Human Development ReportRGoB Royal Government of BhutanUN United NationsUNDP United Nations Development ProgrammeWHO World Health Organization

Gross national happiness and human development
REPORT 2000bhutan national human development
64
GLOSSARY
Bon Pre-Buddhist religionDruk Gyalpo His Majesty the King of BhutanDrukpa Kagyu A branch of tantric lamaism originating from NaropanchenDrungstho Indigenous physicianGomchen Lay priestGuru Rinpoche Precious Teacher or MasterGongsar Knighted commanderGeog Administrative unit, or Block, under a DistrictGup Elected leader of the geogDratshang An established monk bodyDzong Fort or monasteryDzongkhag DistrictKasho Royal DecreeLama PriestLhengyel Zhungtshog CabinetLodey Tshogdey Royal Advisory CouncilLyonpo MinisterMeeser Thuepoens Elected village representative on the Royal Advisory
CouncilMonks Ordained priestNuns Ordained womenPenlops Regional GovernorsSo-Wa-Rigpa An indigenous medicine systemSanskrit pandit Hindu priestPatshala Centre for Hindu studyRabdeys District monastic bodiesTshogdu National AssemblyZhung Dratshang Central Monastic BodyZomdu Community or local meeting

bhutan nati onal human devel opm
ent Report 2000Royal Governm
ent of Bhutan
Today, conditions in Bhutan are very
different from what they were in the
sixties. Over 90% of the population
has access to primary health care.
Gross pr imary enrolment date has
r e a c h e d 7 2 % . L i f e e x p e c t a n c y a t
birth has gone up to 66 years.