Bharat Petroleum Corporation Ltd. · India’s Leading Oil and Gas Company with presence across the...
26
Bharat Petroleum Corporation Ltd. November 2016 Investor Presentation
Transcript of Bharat Petroleum Corporation Ltd. · India’s Leading Oil and Gas Company with presence across the...
Bharat Petroleum Corporation Ltd.
November 2016
Investor Presentation
No information contained herein has been verified for truthfulness completeness, accuracy, reliability or otherwise whatsoever by anyone. While the
Company will use reasonable efforts to provide reliable information through this presentation, no representation or warranty (express or implied) of any
nature is made nor is any responsibility or liability of any kind accepted by the Company or its directors or employees, with respect to the truthfulness,
completeness, accuracy or reliability or otherwise whatsoever of any information, projection, representation or warranty (expressed or implied) or
omissions in this presentation. Neither the Company nor anyone else accepts any liability whatsoever for any loss, howsoever, arising from use or
reliance on this presentation or its contents or otherwise arising in connection therewith.
This presentation may not be used, reproduced, copied, published, distributed, shared, transmitted or disseminated in any manner. This presentation is
for information purposes only and does not constitute an offer, invitation, solicitation or advertisement in any jurisdiction with respect to the purchase or
sale of any security of BPCL and no part or all of it shall form the basis of or be relied upon in connection with any contract, investment decision or
commitment whatsoever.
The information in this presentation is subject to change without notice, its accuracy is not guaranteed, it may be incomplete or condensed and it may
not contain all material information concerning the Company. We do not have any obligation to, and do not intend to, update or otherwise revise any
statements reflecting circumstances arising after the date of this presentation or to reflect the occurrence of underlying events, even if the underlying
assumptions do not come to fruition.
Disclaimer
2
Table of Contents
3
1. Corporate Overview 4
2 Business Overview 9
3. Industry Overview 23
4
Credit Highlights
1. Corporate Overview
5
Introduction
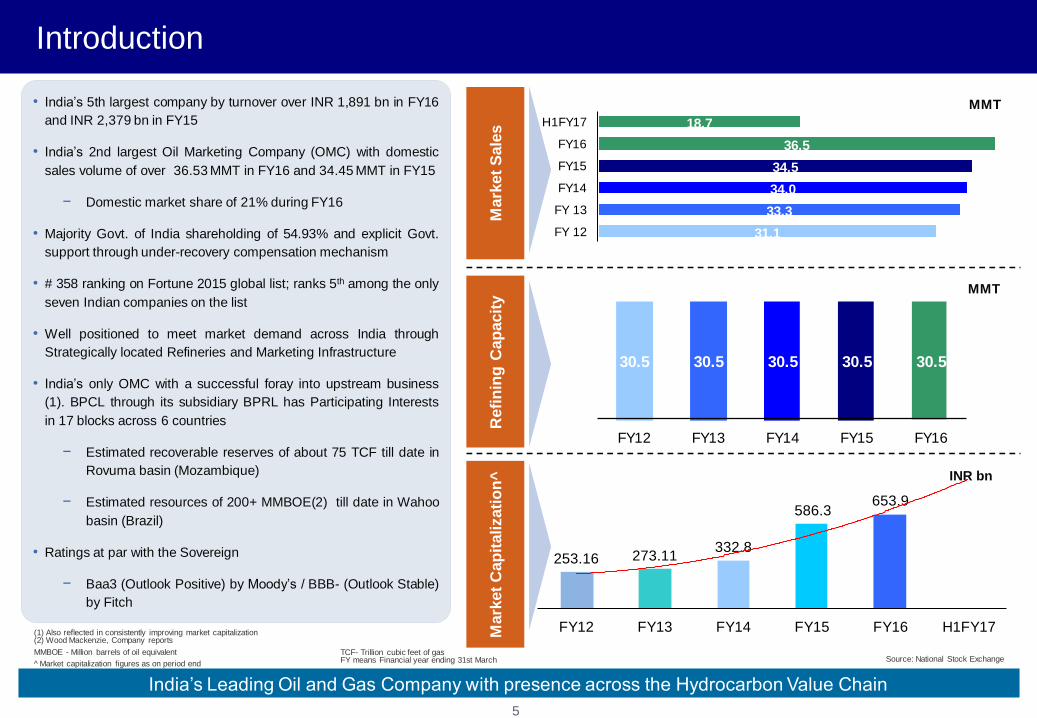
• India’s 5th largest company by turnover over INR 1,891 bn in FY16
and INR 2,379 bn in FY15
• India’s 2nd largest Oil Marketing Company (OMC) with domestic
sales volume of over 36.53 MMT in FY16 and 34.45 MMT in FY15
− Domestic market share of 21% during FY16
• Majority Govt. of India shareholding of 54.93% and explicit Govt.
support through under-recovery compensation mechanism
• # 358 ranking on Fortune 2015 global list; ranks 5th among the only
seven Indian companies on the list
• Well positioned to meet market demand across India through
Strategically located Refineries and Marketing Infrastructure
• India’s only OMC with a successful foray into upstream business
(1). BPCL through its subsidiary BPRL has Participating Interests
in 17 blocks across 6 countries
− Estimated recoverable reserves of about 75 TCF till date in
Rovuma basin (Mozambique)
− Estimated resources of 200+ MMBOE(2) till date in Wahoo
basin (Brazil)
• Ratings at par with the Sovereign
− Baa3 (Outlook Positive) by Moody’s / BBB- (Outlook Stable)
by Fitch
31.1
33.3
34.0
34.5
36.5
18.7
FY 12
FY 13
FY14
FY15
FY16
H1FY17
Mark
et
Cap
italizati
on
^M
ark
et
Sale
s
30.5 30.5 30.5 30.5 30.5
FY12 FY13 FY14 FY15 FY16
Refi
nin
g C
ap
acit
y
India’s Leading Oil and Gas Company with presence across the Hydrocarbon Value Chain
MMT
MMT
(1) Also reflected in consistently improving market capitalization(2) Wood Mackenzie, Company reports
MMBOE - Million barrels of oil equivalent
Market capitalization figures as on period end
TCF- Trillion cubic feet of gasFY means Financial year ending 31st March Source: National Stock Exchange
253.16 273.11332.8
586.3 653.9
FY12 FY13 FY14 FY15 FY16 H1FY17
INR bn

Important Milestones
6
1976 1998
20032006
2007
GoI acquired Burmah
Shell Refineries. Name
changed to BPCL in
1977
BPCL entered the LNG
market by signing a gas
sales purchase
agreement with Petronet
LNG
Entered into
upstream business
and formed Bharat
Petro Resources
Limited (BPRL)
MR capacity enhanced to
12 MMTPA.
BPCL and Videocon JV
acquired 50% stake in
Brazil's EnCana
Brasil Petroleo
2008
2009
2011
Commissioning of
6 MMTPA
Bina Refinery
Kochi Refinery
capacity
enhanced
to 9.5 MMTPA
Started operations at its
Bina refinery by launching
its crude distillation unit
Euro III / IV products
launched at Mumbai and
Kochi Refinery
First in the Indian
Oil Industry to roll
out ERP Solution
2002
Restructured business into
corporate centre, Strategic
Business Units (SBU) and
Shared Entities
Refrigerated LPG
storage and
handling facility at
JNPT and Uran
LPG plant
commissioned
2012
BPCL and GAIL
formed a JV,
IGL, for
distribution of
Natural Gas in
entire capital
region
2014
CCR1 unit at
Mumbai
Refinery
commissioned in
March 2014
1. CCR: Continuous Catalytic Regeneration Reformer Unit.
Commissioned
Energy Efficient
CDU IV with
replacement of CDU I
& II at Mumbai
Refinery
Commissioned Kota
Jobner Pipeline and
Terminal
2015
2016
Announced
acquisition of
upstream
assets in
Russia
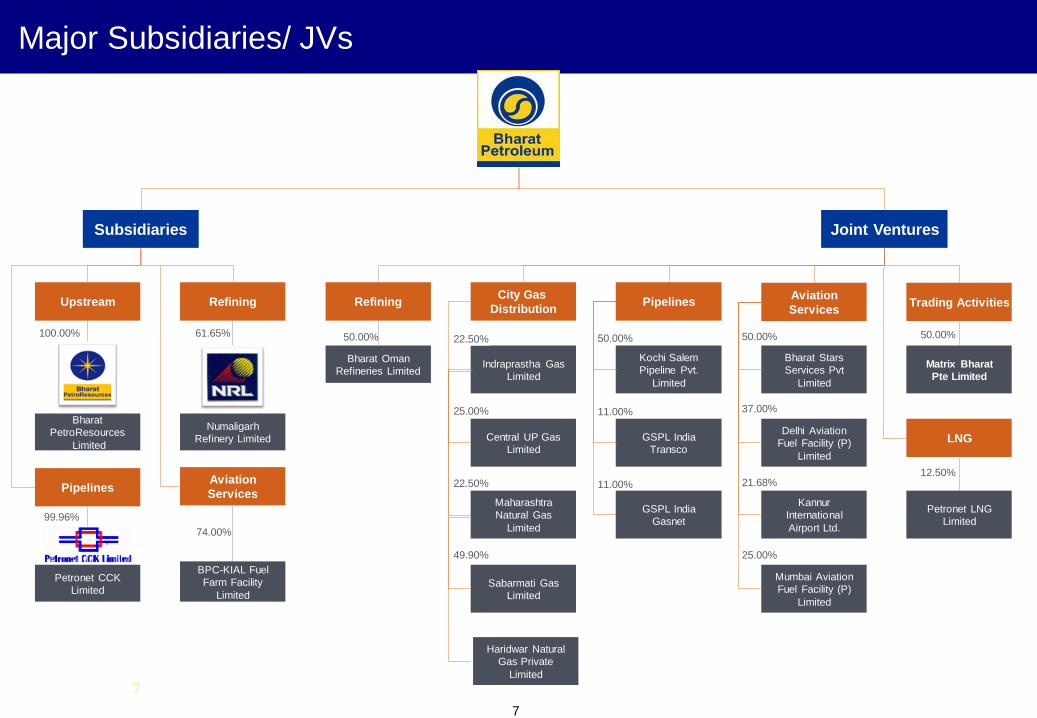
Major Subsidiaries/ JVs
7
7
Subsidiaries Joint Ventures
Upstream Refining
LNG
City Gas
Distribution
Bharat
PetroResources
Limited
Numaligarh
Refinery Limited
PipelinesAviation
ServicesRefining
Bharat Oman
Refineries LimitedIndraprastha Gas
Limited
Central UP Gas
Limited
Maharashtra
Natural Gas
Limited
Sabarmati Gas
Limited
100.00%
Petronet LNG
Limited
Kochi Salem
Pipeline Pvt.
Limited
Bharat Stars
Services Pvt
Limited
Delhi Aviation
Fuel Facility (P)
Limited
61.65% 50.00% 22.50%
22.50%
49.90%
50.00% 50.00%
Trading Activities
Matrix Bharat
Pte Limited
12.50%
50.00%
GSPL India
Transco
GSPL India
Gasnet
Kannur
International
Airport Ltd.
21.68%
11.00%
11.00%
Mumbai Aviation
Fuel Facility (P)
Limited
25.00%
25.00% 37.00%
Petronet CCK
Limited
99.96%
BPC-KIAL Fuel
Farm Facility
Limited
74.00%
PipelinesAviation
Services
Haridwar Natural
Gas Private
Limited
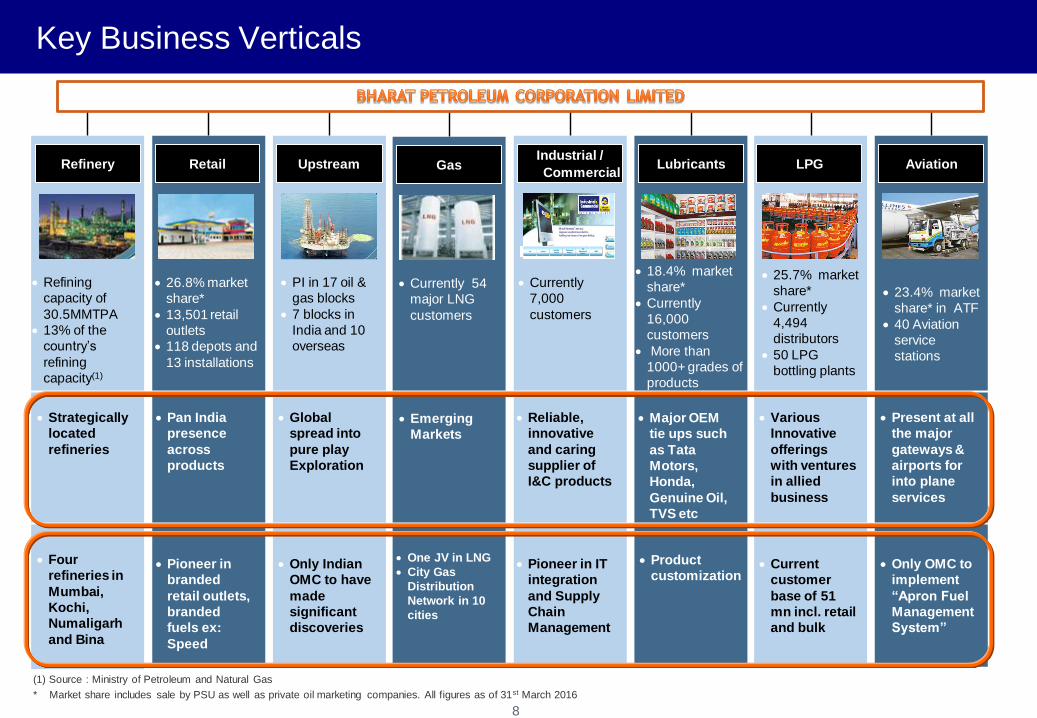
Key Business Verticals
RetailAviationIndustrial /
CommercialLubricants LPG AviationRefinery GasUpstream
26.8% market
share*
13,501 retail
outlets
118 depots and
13 installations
Pan India
presence
across
products
Currently
7,000
customers
Reliable,
innovative
and caring
supplier of
I&C products
18.4% market
share*
Currently
16,000
customers
More than
1000+ grades of
products
Major OEM
tie ups such
as Tata
Motors,
Honda,
Genuine Oil,
TVS etc
25.7% market
share*
Currently
4,494
distributors
50 LPG
bottling plants
Various
Innovative
offerings
with ventures
in allied
business
23.4% market
share* in ATF
40 Aviation
service
stations
Present at all
the major
gateways &
airports for
into plane
services
Refining
capacity of
30.5MMTPA
13% of the
country’s
refining
capacity(1)
Strategically
located
refineries
Currently 54
major LNG
customers
Emerging
Markets
PI in 17 oil &
gas blocks
7 blocks in
India and 10
overseas
Global
spread into
pure play
Exploration
Pioneer in
branded
retail outlets,
branded
fuels ex:
Speed
Pioneer in IT
integration
and Supply
Chain
Management
Product
customization Current
customer
base of 51
mn incl. retail
and bulk
Only OMC to
implement
“Apron Fuel
Management
System”
Four
refineries in
Mumbai,
Kochi,
Numaligarh
and Bina
One JV in LNG
City Gas
Distribution
Network in 10
cities
Only Indian
OMC to have
made
significant
discoveries
8
(1) Source : Ministry of Petroleum and Natural Gas
* Market share includes sale by PSU as well as private oil marketing companies. All figures as of 31st March 2016

9
Credit Highlights
2. Business Overview
1010
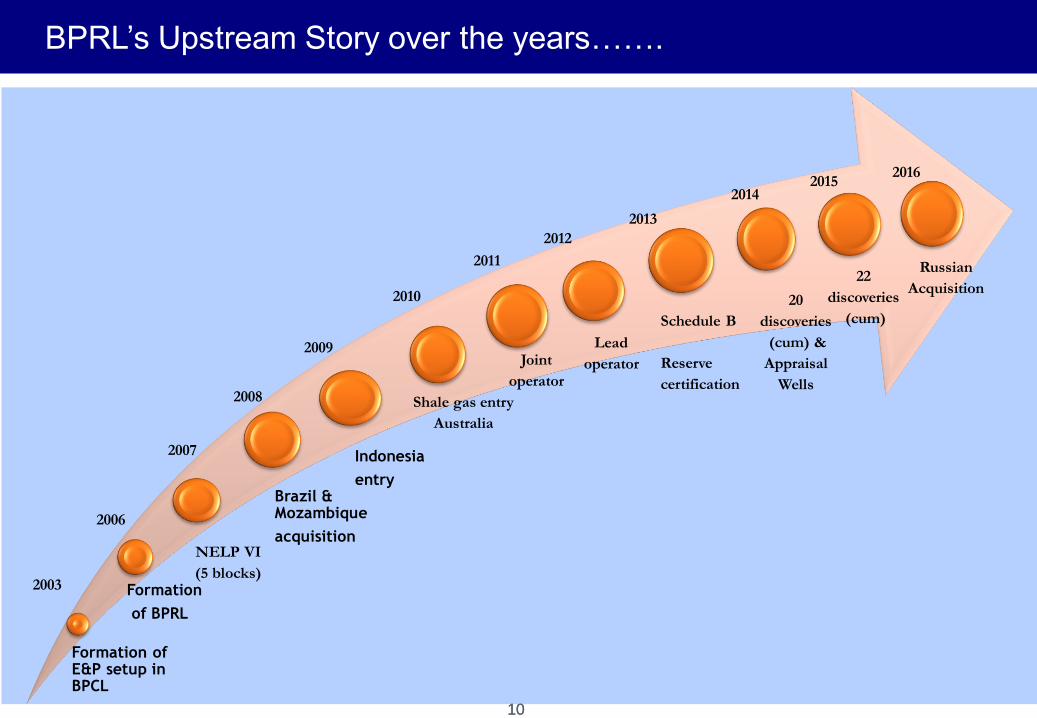
BPRL’s Upstream Story over the years…….
Formation of E&P setup in BPCL
Formation
of BPRL
Brazil & Mozambique
acquisition
Indonesia
entry
2003
2006
2008
2010
2009
2007
2011
2012
2013
2014
Shale gas entry
Australia
Joint
operator
Lead
operator
Schedule B
Reserve
certification
20
discoveries
(cum) &
Appraisal
Wells
NELP VI
(5 blocks)
2015
22
discoveries
(cum)
2016
Russian
Acquisition
1111
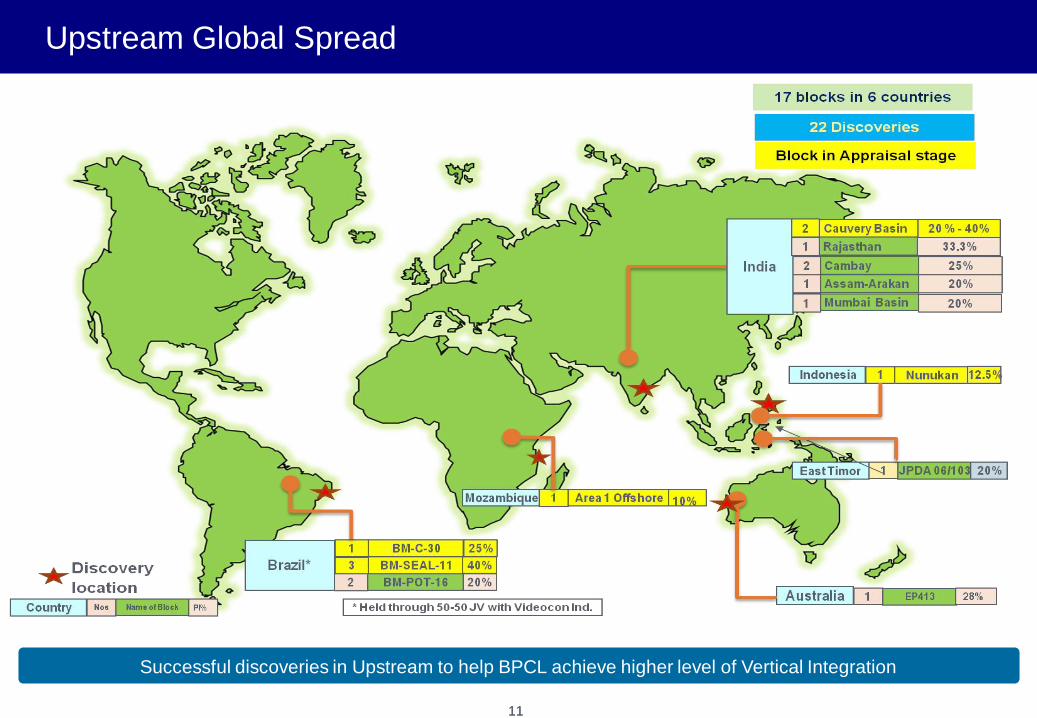
Upstream Global Spread
Successful discoveries in Upstream to help BPCL achieve higher level of Vertical Integration
`
1212
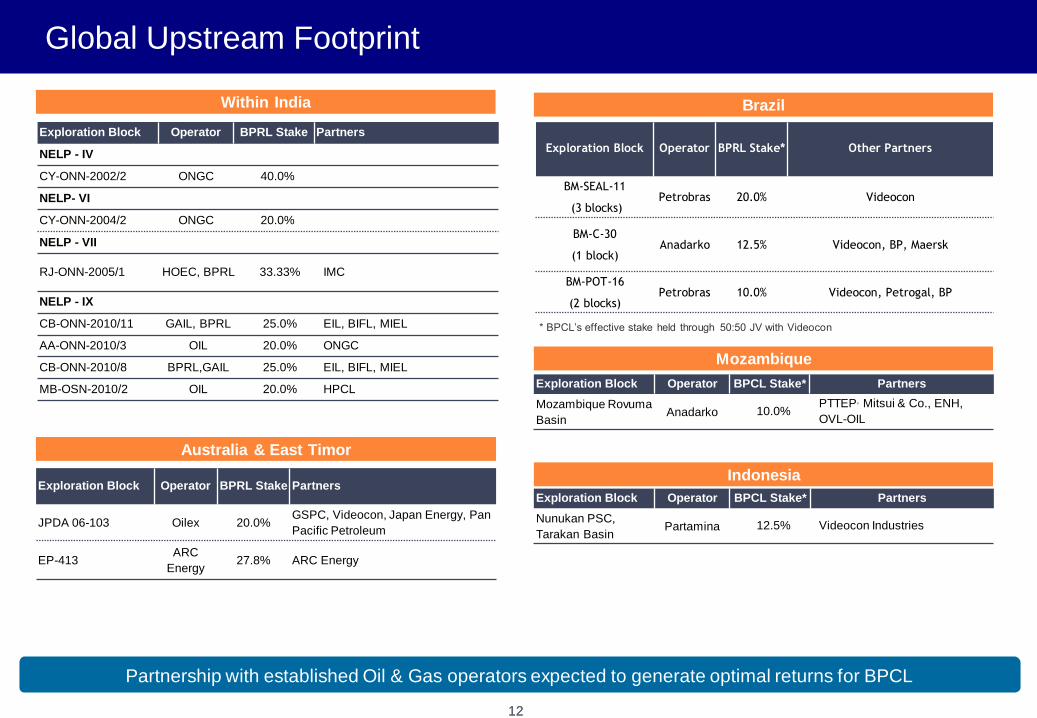
Global Upstream Footprint
Partnership with established Oil & Gas operators expected to generate optimal returns for BPCL
Within India
Australia & East Timor
Brazil
Mozambique
Exploration Block Operator BPCL Stake* Partners
Mozambique Rovuma
BasinAnadarko 10.0%
PTTEP, Mitsui & Co., ENH,
OVL-OIL
Indonesia
Exploration Block Operator BPCL Stake* Partners
Nunukan PSC,
Tarakan BasinPartamina 12.5% Videocon Industries
Exploration Block Operator BPRL Stake Partners
NELP - IV
CY-ONN-2002/2 ONGC 40.0%
NELP- VI
CY-ONN-2004/2 ONGC 20.0%
NELP - VII
RJ-ONN-2005/1 HOEC, BPRL 33.33% IMC
NELP - IX
CB-ONN-2010/11 GAIL, BPRL 25.0% EIL, BIFL, MIEL
AA-ONN-2010/3 OIL 20.0% ONGC
CB-ONN-2010/8 BPRL,GAIL 25.0% EIL, BIFL, MIEL
MB-OSN-2010/2 OIL 20.0% HPCL
* BPCL’s effective stake held through 50:50 JV with Videocon
Exploration Block Operator BPRL Stake Partners
JPDA 06-103 Oilex 20.0%GSPC, Videocon, Japan Energy, Pan
Pacific Petroleum
EP-413ARC
Energy27.8% ARC Energy
Exploration Block Operator BPRL Stake* Other Partners
BM-SEAL-11
(3 blocks)Petrobras 20.0% Videocon
BM-C-30
(1 block)Anadarko 12.5% Videocon, BP, Maersk
BM-POT-16
(2 blocks)Petrobras 10.0% Videocon, Petrogal, BP

Refining Coverage
Four Strategically located
refineries across India
Refinery Utilization rates
significantly above global peers
935-km cross country pipeline to
source crude to BORL
10.11 10.32 10.40 10.71
13.10 13.03 12.96 13.41
2.48 2.61 2.78 2.52 2.86 2.73 3.10 3.20
-
5.00
10.00
15.00
20.00
25.00
30.00
FY 13 FY14 FY15 FY16
MMT Kochi Mumbai Numaligarh Bina
Capacity Utilization consistently above global peers for KR and MR
State of the art refinery at Bina - High Nelson Complexity Index of 9.1
Installed Capacity Refining Throughput
28.55 *
Mumbai – 240 kbpd
Kochi – 190 kbpd
Numaligarh – 60 kbpd
BORL – 120 kbpd
Refining Capacity
13
29.24*
* Bina Refinery throughput is considered proportionately because it’s a 50:50 JV
28.69*29.84*
1414
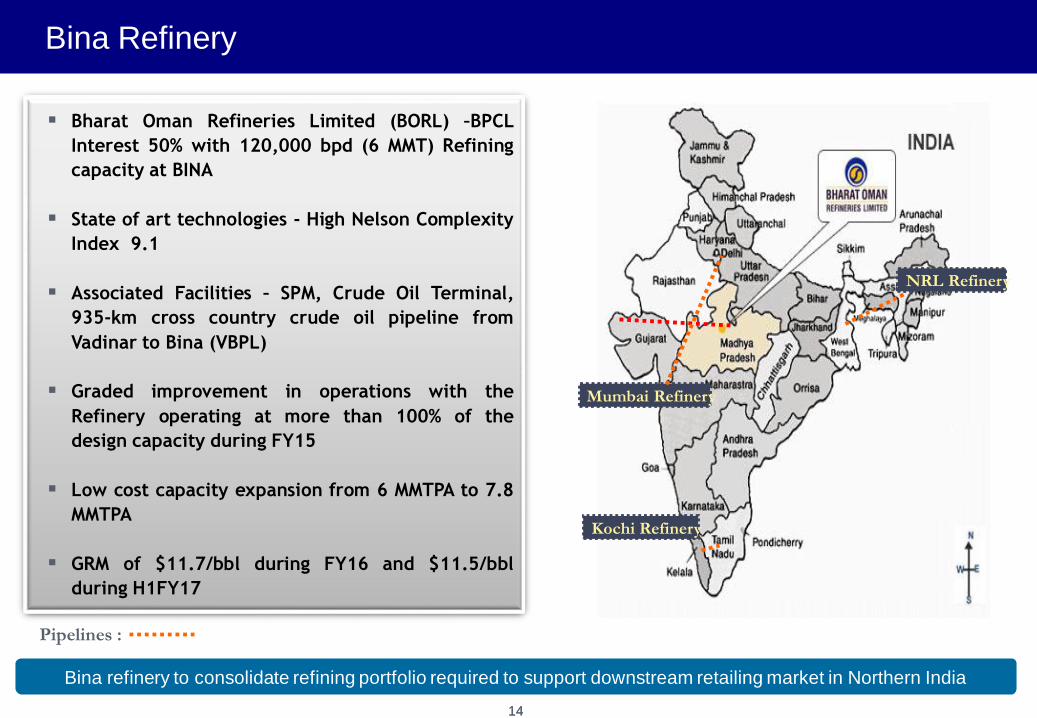
Bina Refinery
Bina refinery to consolidate refining portfolio required to support downstream retailing market in Northern India
Bharat Oman Refineries Limited (BORL) –BPCL
Interest 50% with 120,000 bpd (6 MMT) Refining
capacity at BINA
State of art technologies - High Nelson Complexity
Index 9.1
Associated Facilities – SPM, Crude Oil Terminal,
935-km cross country crude oil pipeline from
Vadinar to Bina (VBPL)
Graded improvement in operations with the
Refinery operating at more than 100% of the
design capacity during FY15
Low cost capacity expansion from 6 MMTPA to 7.8
MMTPA
GRM of $11.7/bbl during FY16 and $11.5/bbl
during H1FY17
Mumbai Refinery
Kochi Refinery
NRL Refinery
Pipelines :
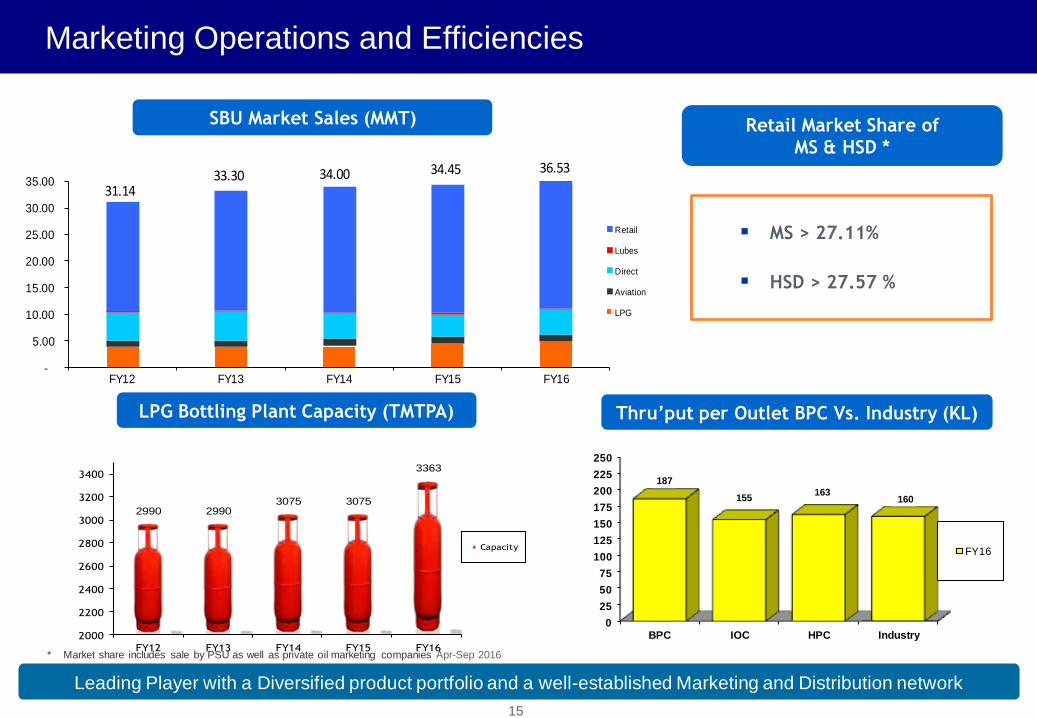
Marketing Operations and Efficiencies
-
5.00
10.00
15.00
20.00
25.00
30.00
35.00
FY12 FY13 FY14 FY15 FY16
Retail
Lubes
Direct
Aviation
LPG
31.1433.30 34.00 34.45 36.53
15
Leading Player with a Diversified product portfolio and a well-established Marketing and Distribution network
LPG Bottling Plant Capacity (TMTPA)
2990 29903075 3075
3363
2000
2200
2400
2600
2800
3000
3200
3400
FY12 FY13 FY14 FY15 FY16
Capacity
Thru’put per Outlet BPC Vs. Industry (KL)
0
25
50
75
100
125
150
175
200
225
250
BPC IOC HPC Industry
187
155163
160
FY16
MS > 27.11%
HSD > 27.57 %
Retail Market Share of
MS & HSD *
SBU Market Sales (MMT)
* Market share includes sale by PSU as well as private oil marketing companies Apr-Sep 2016
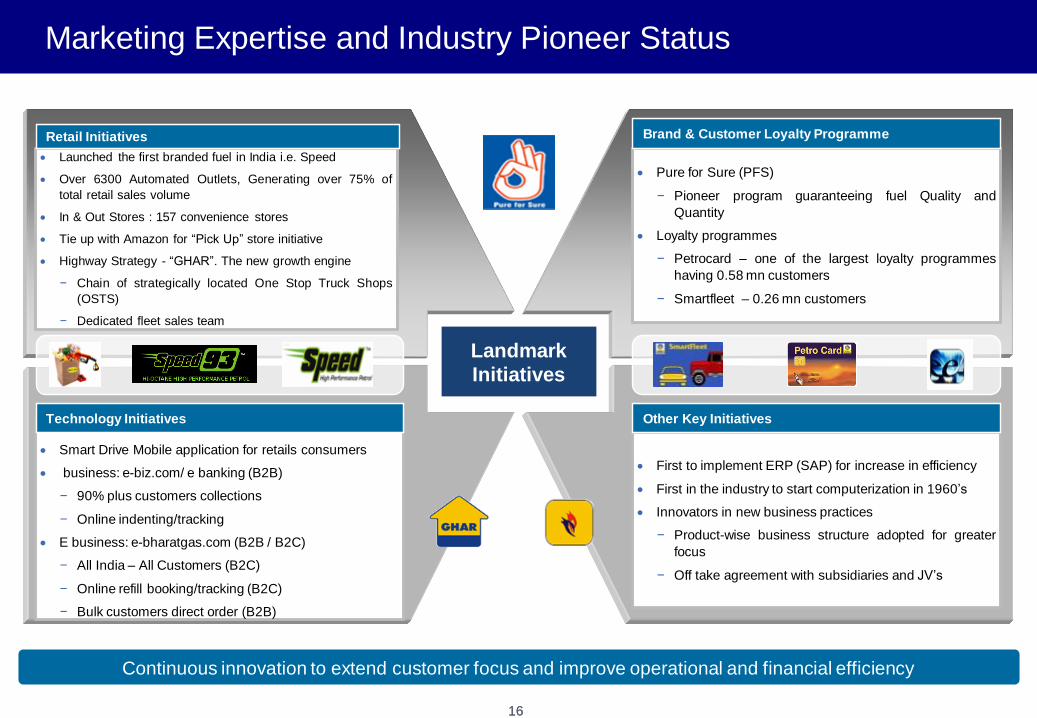
Launched the first branded fuel in India i.e. Speed
Over 6300 Automated Outlets, Generating over 75% of
total retail sales volume
In & Out Stores : 157 convenience stores
Tie up with Amazon for “Pick Up” store initiative
Highway Strategy - “GHAR”. The new growth engine
− Chain of strategically located One Stop Truck Shops
(OSTS)
− Dedicated fleet sales team
Landmark
Initiatives
Retail Initiatives
1616
Marketing Expertise and Industry Pioneer Status
Smart Drive Mobile application for retails consumers
business: e-biz.com/ e banking (B2B)
− 90% plus customers collections
− Online indenting/tracking
E business: e-bharatgas.com (B2B / B2C)
− All India – All Customers (B2C)
− Online refill booking/tracking (B2C)
− Bulk customers direct order (B2B)
Technology Initiatives
Pure for Sure (PFS)
− Pioneer program guaranteeing fuel Quality and
Quantity
Loyalty programmes
− Petrocard – one of the largest loyalty programmes
having 0.58 mn customers
− Smartfleet – 0.26 mn customers
Brand & Customer Loyalty Programme
First to implement ERP (SAP) for increase in efficiency
First in the industry to start computerization in 1960’s
Innovators in new business practices
− Product-wise business structure adopted for greater
focus
− Off take agreement with subsidiaries and JV’s
Other Key Initiatives
Continuous innovation to extend customer focus and improve operational and financial efficiency

Ongoing projects – thriving to be self sufficient integrated source of fuel supply
Integrated Refinery Expansion Project (IREP) at Kochi – Increasing refining
capacity from 9.5 MMTPA to 15.5 MMTPA along with modernization of existing
facilities to produce future quality fuels – Commissioning activities are underway
Mumbai Refinery – DHT Installation
Bina Refinery – Creeping Capacity Expansion from 6 MMTPA to 7.8 MMTPA
Investments in Gas pipelines – GIGL & GITL pipelines in Joint Venture
Kochi – Diversification into Niche Petrochemicals – Propylene Derivatives
Petrochemical Project (PDDP)
Retail : Network expansion with infrastructure growth and upgradation
LPG import terminal at Haldia, West Bengal
Significant Expansion in Downstream & Marketing network to drive future growth
17
Upcoming projects
Funding for upstream developments and new assets
Refineries – Upgrade/ Expansion / De-bottlenecking
Investments in Gas
Expansion of marketing infrastructure across all business verticals
More expansions in Upstream, Downstream business & Marketing network
18
19
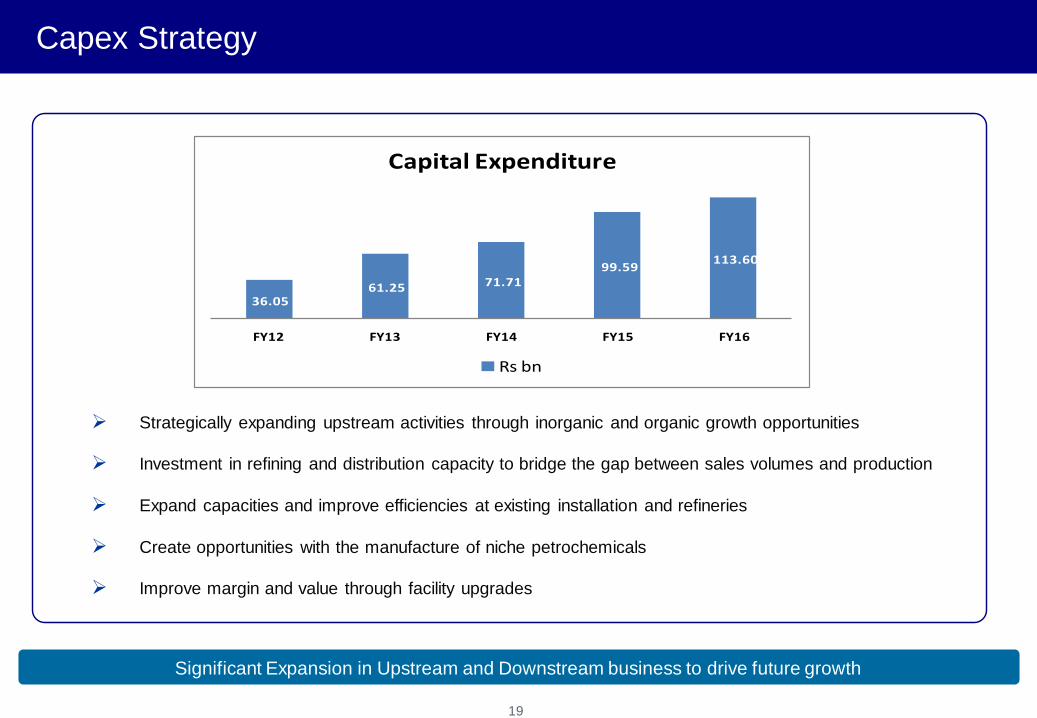
Capex Strategy
Significant Expansion in Upstream and Downstream business to drive future growth
Strategically expanding upstream activities through inorganic and organic growth opportunities
Investment in refining and distribution capacity to bridge the gap between sales volumes and production
Expand capacities and improve efficiencies at existing installation and refineries
Create opportunities with the manufacture of niche petrochemicals
Improve margin and value through facility upgrades
36.05 61.25 71.71
99.59 113.60
FY12 FY13 FY14 FY15 FY16
Capital Expenditure
Rs bn
20
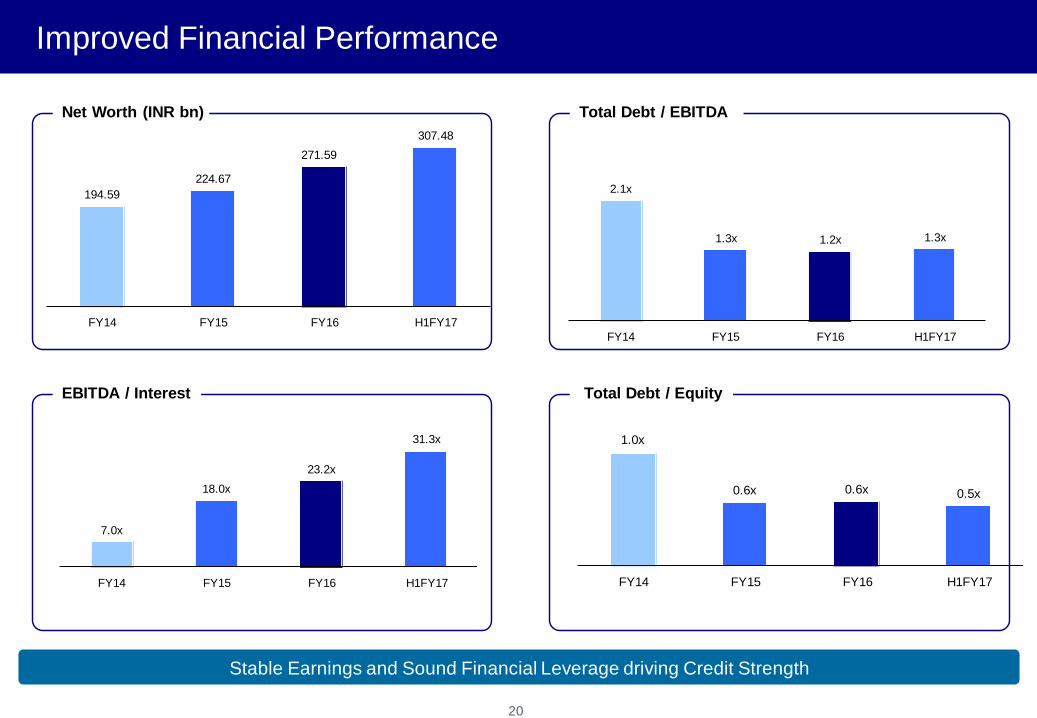
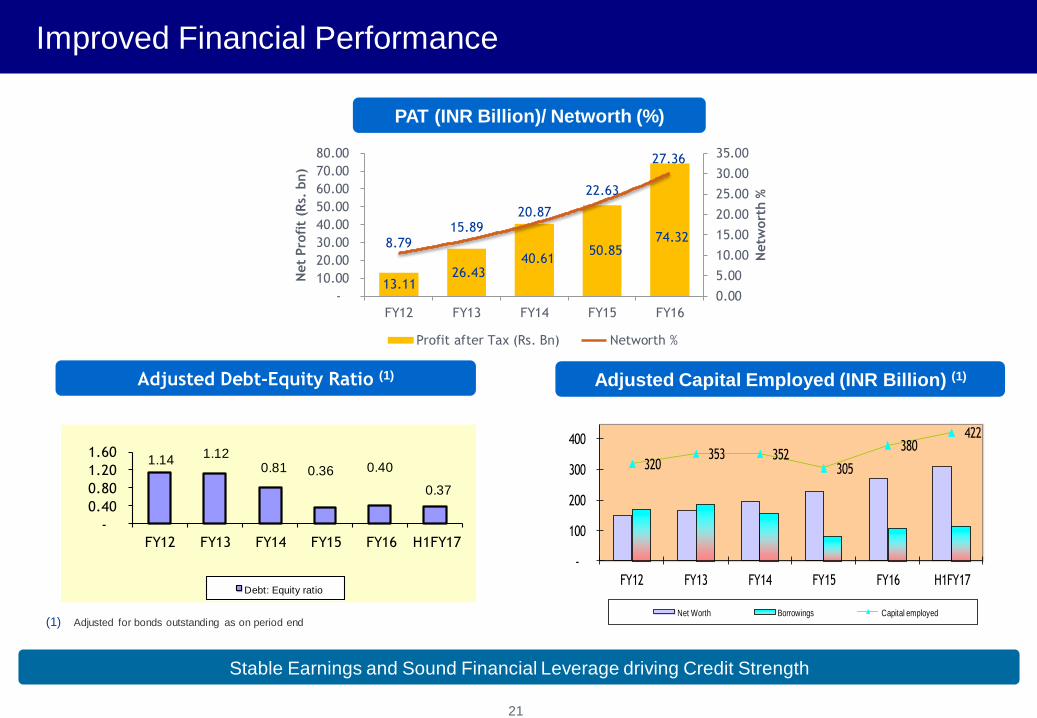
Improved Financial Performance
Stable Earnings and Sound Financial Leverage driving Credit Strength
Net Worth (INR bn) Total Debt / EBITDA
EBITDA / Interest Total Debt / Equity
194.59
224.67
271.59
307.48
FY14 FY15 FY16 H1FY17
2.1x
1.3x 1.2x 1.3x
FY14 FY15 FY16 H1FY17
7.0x
18.0x
23.2x
31.3x
FY14 FY15 FY16 H1FY17
1.0x
0.6x 0.6x 0.5x
FY14 FY15 FY16 H1FY17
21
(1) Adjusted for bonds outstanding as on period end
1.14 1.12
0.81 0.36 0.40
0.37
-
0.40
0.80
1.20
1.60
FY12 FY13 FY14 FY15 FY16 H1FY17
Debt: Equity ratio
Stable Earnings and Sound Financial Leverage driving Credit Strength
320 353 352
305
380 422
-
100
200
300
400
FY12 FY13 FY14 FY15 FY16 H1FY17
Net Worth Borrowings Capital employed
Adjusted Capital Employed (INR Billion) (1)Adjusted Debt-Equity Ratio (1)
PAT (INR Billion)/ Networth (%)
Improved Financial Performance
13.11 26.43
40.61 50.85
74.32 8.7915.89
20.87
22.63
27.36
0.00
5.00
10.00
15.00
20.00
25.00
30.00
35.00
-
10.00
20.00
30.00
40.00
50.00
60.00
70.00
80.00
FY12 FY13 FY14 FY15 FY16
Netw
ort
h %
Net
Pro
fit
(Rs.
bn
)
Profit after Tax (Rs. Bn) Networth %
2222
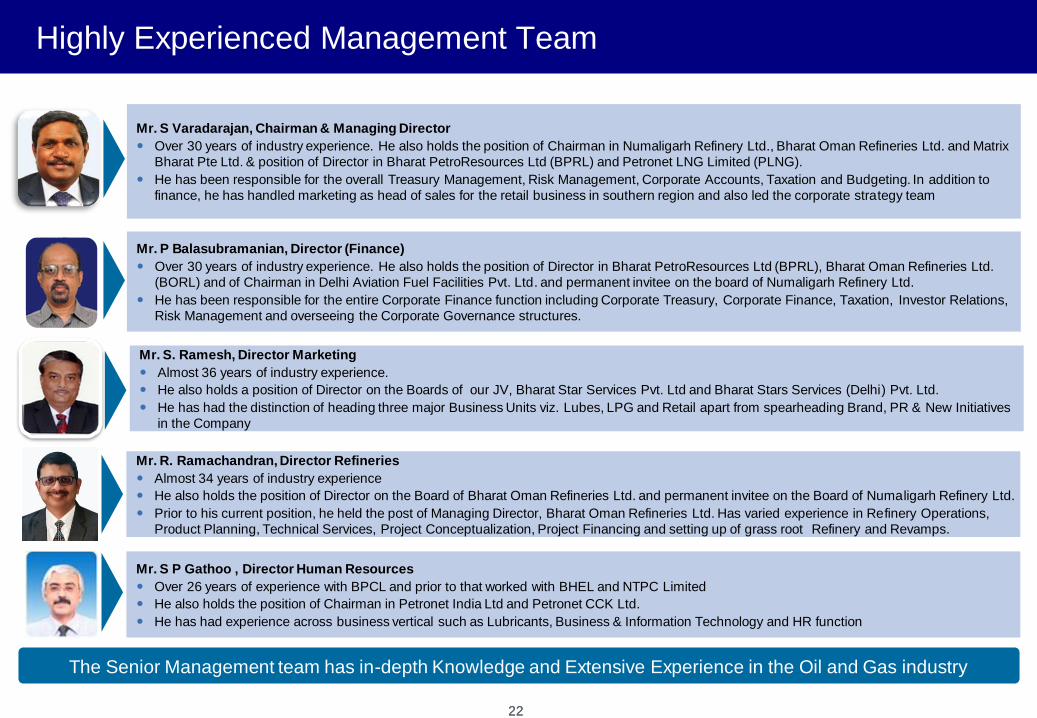
Highly Experienced Management Team
The Senior Management team has in-depth Knowledge and Extensive Experience in the Oil and Gas industry
Mr. R. Ramachandran, Director Refineries
Almost 34 years of industry experience
He also holds the position of Director on the Board of Bharat Oman Refineries Ltd. and permanent invitee on the Board of Numaligarh Refinery Ltd.
Prior to his current position, he held the post of Managing Director, Bharat Oman Refineries Ltd. Has varied experience in Refinery Operations,
Product Planning, Technical Services, Project Conceptualization, Project Financing and setting up of grass root Refinery and Revamps.
Mr. S P Gathoo , Director Human Resources
Over 26 years of experience with BPCL and prior to that worked with BHEL and NTPC Limited
He also holds the position of Chairman in Petronet India Ltd and Petronet CCK Ltd.
He has had experience across business vertical such as Lubricants, Business & Information Technology and HR function
Mr. S Varadarajan, Chairman & Managing Director
Over 30 years of industry experience. He also holds the position of Chairman in Numaligarh Refinery Ltd., Bharat Oman Refineries Ltd. and Matrix
Bharat Pte Ltd. & position of Director in Bharat PetroResources Ltd (BPRL) and Petronet LNG Limited (PLNG).
He has been responsible for the overall Treasury Management, Risk Management, Corporate Accounts, Taxation and Budgeting. In addition to
finance, he has handled marketing as head of sales for the retail business in southern region and also led the corporate strategy team
Mr. P Balasubramanian, Director (Finance)
Over 30 years of industry experience. He also holds the position of Director in Bharat PetroResources Ltd (BPRL), Bharat Oman Refineries Ltd.
(BORL) and of Chairman in Delhi Aviation Fuel Facilities Pvt. Ltd. and permanent invitee on the board of Numaligarh Refinery Ltd.
He has been responsible for the entire Corporate Finance function including Corporate Treasury, Corporate Finance, Taxation, Investor Relations,
Risk Management and overseeing the Corporate Governance structures.
Mr. S. Ramesh, Director Marketing
Almost 36 years of industry experience.
He also holds a position of Director on the Boards of our JV, Bharat Star Services Pvt. Ltd and Bharat Stars Services (Delhi) Pvt. Ltd.
He has had the distinction of heading three major Business Units viz. Lubes, LPG and Retail apart from spearheading Brand, PR & New Initiatives
in the Company
23
Corporate Overview
Credit Highlights
3. Industry Overview

India - Oil and Gas Demand
202
61
44
31
26
15
10
7
3
Singapore
US
Australia
Germany
UK
Russia
Brazil
China
India
bbl/day per 1000 people
14.3
15.4
15.6
16.3
17.6
19.0
14.2
15.0
15.7
17.1
19.1
21.8
60
64.8
69.2
68.4
69.3
74.6
FY11
FY12
FY13
FY14
FY15
FY16
Million Tonnes
Diesel Petrol LPG
Source: CIA World Factbook, Central Statistics Office, Estimates 2012
Significant Potential for Domestic O&G Companies given the Low per-capita Oil Consumption and Growing demand.
India Oil DemandPer Capita Oil Consumption
24
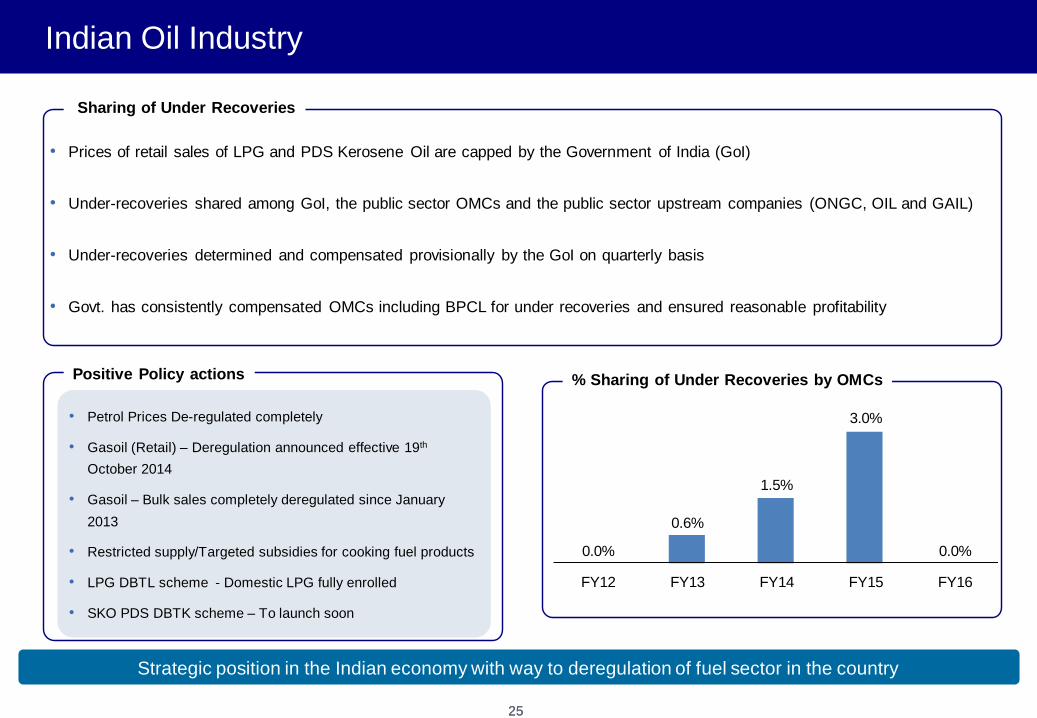
• Under-recoveries determined and compensated provisionally by the GoI on quarterly basis
• Prices of retail sales of LPG and PDS Kerosene Oil are capped by the Government of India (GoI)
• Under-recoveries shared among GoI, the public sector OMCs and the public sector upstream companies (ONGC, OIL and GAIL)
• Govt. has consistently compensated OMCs including BPCL for under recoveries and ensured reasonable profitability
2525
Indian Oil Industry
• Petrol Prices De-regulated completely
• Gasoil (Retail) – Deregulation announced effective 19th
October 2014
• Gasoil – Bulk sales completely deregulated since January
2013
• Restricted supply/Targeted subsidies for cooking fuel products
• LPG DBTL scheme - Domestic LPG fully enrolled
• SKO PDS DBTK scheme – To launch soon
0.0%
0.6%
1.5%
3.0%
0.0%
FY12 FY13 FY14 FY15 FY16
Strategic position in the Indian economy with way to deregulation of fuel sector in the country
Positive Policy actions % Sharing of Under Recoveries by OMCs
Sharing of Under Recoveries
Thank You