Bham Uni M Sc V2 Larner January 2008
62
Cooperative Public Purchasing Dr Andrew Larner Regional Director South East Improvement & Efficiency Partnership
-
Upload
andrewlarner -
Category
Documents
-
view
131 -
download
0
Transcript of Bham Uni M Sc V2 Larner January 2008

Cooperative Public Purchasing
Dr Andrew Larner
Regional Director
South East Improvement & Efficiency Partnership

Overview
• RCE History• How South East Centre (SECE) works• Priorities and prioritisation
• Key projects
• Joining up with the Improvement Partnerships• Where have we got to and where next• National Leads

RCE History

RCE History
• Formation– National Procurement Strategy– Regional Centre’s of Procurement Excellence– Formation July 2004 to March 2005
• Coordination– Regional Directors Group– Assistant Directors Group– Programme Management Team– National Leads

How the South East Centre (SECE) Works

The South East Region
• 55 Districts
• 12 Unitaries• 7 Counties• 5 Police Authorities
• 8 Fire Authorities
• SHA’s and PCT’s

How SECE Works
• Formed Late 2004, Programme Started April 2005• Efficiency and Procurement from the start• Governance
– Host authority Kent County Council– Board made up of Senior officer from around the region
• Mix of authority types• Representation from the 8 County areas
• Ways of working– Leadership of Workstreams spread around the region– Small core team seconded from Kent CC– Secondments from around the region– Virtual working– Admin support from one District in the regions centre
• Strong emphasis on business management– Project Management– Monitoring and Reporting
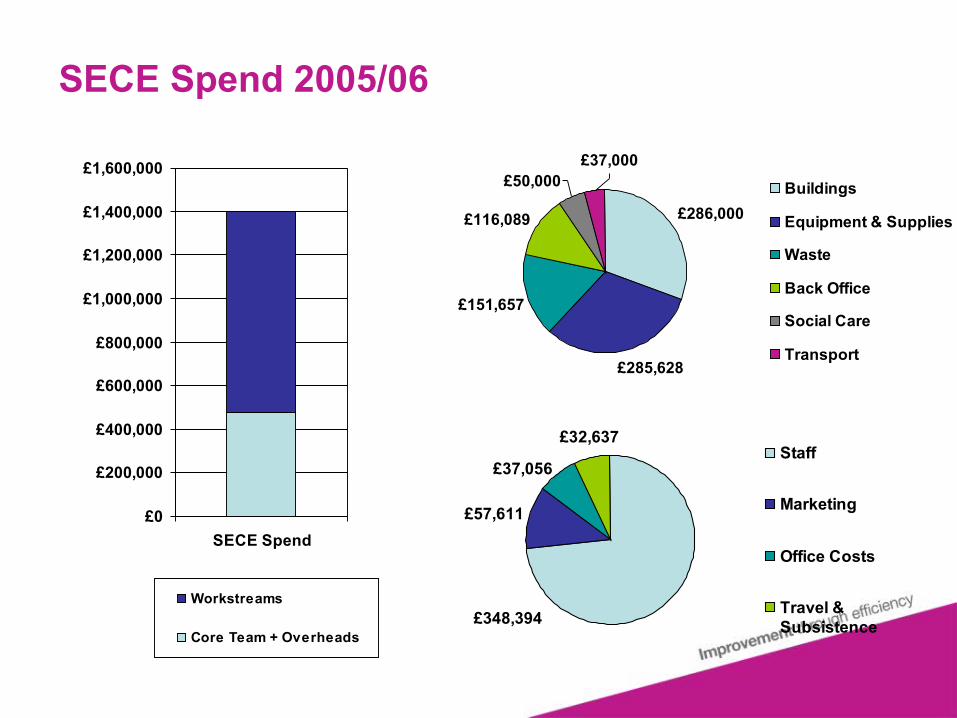
SECE Spend 2005/06
£57,611
£348,394
£37,056
£32,637Staff
Marketing
Office Costs
Travel &Subsistence
£286,000
£285,628
£151,657
£37,000
£116,089
£50,000 Buildings
Equipment & Supplies
Waste
Back Office
Social Care
Transport
£0
£200,000
£400,000
£600,000
£800,000
£1,000,000
£1,200,000
£1,400,000
£1,600,000
SECE Spend
Workstreams
Core Team + Overheads

Priorities and Prioritisation
Finding the right levers

Prioritisation
• South East Context– Grant floor– Net contribution of tax– Net decrease in government funding– Unable to raise local taxation
• Financial impact– For all authorities– Maximising return on investment– Threats (Opportunities)– Legislative drivers
• Used a Number of Methods– Evolving these– Give value in their own right as well as identifying
priorities for improvement

Supplier Spend Analysis
• 167 of 388 councils in England (43%)
• Relative amount of data gathered by Regional Centre of Excellence and by Authority Type
Sample Data by Regional Centre of Excellence
0
10
20
30
40
50
60
70
80
ECE EMCE LCE NECE NWCE SECE SWCE WMCE Y&HCE
Regional Centre of Excellence
Nu
mb
er
Total number of local authorities No. of local authorities with aggregate spend data
No. of local authorities with spend data by supplier
Sample Data by Authority Type
0
50
100
150
200
250
CC DC LBC MDC UA
Authority Type
Nu
mb
er
Total number of local authorities No. of local authorities with aggregate spend data
No. of local authorities with spend data by supplier

Master Category Spend Breakdown
-
2,000
4,000
6,000
8,000
10,000
12,000
14,000
Constr
uctio
n
Social
care
Facilit
ies
Profes
siona
l ser
vices
Enviro
nmen
tal se
rvice
s IT
Public
bod
ies
Financ
ial se
rvice
sTra
vel
Office s
ervic
es
Energ
y and
utilie
s
Logis
tics
Marke
ting a
nd m
edia
Miscell
aneo
us
Events
and l
eisur
e
Medica
l car
eFue
ls
Common
categ
ory
Master Category
Sp
end
(£
mill
ion
)
extrapolated aggregate spend by Master Category across all local authority councils in England. The extrapolated total spend is c£45 billion.

Level 2 Supplier Spend Analysis
Buildings
Waste Management
Commodities appear throughout
Social Care

Value from top suppliers

Value from top transactions
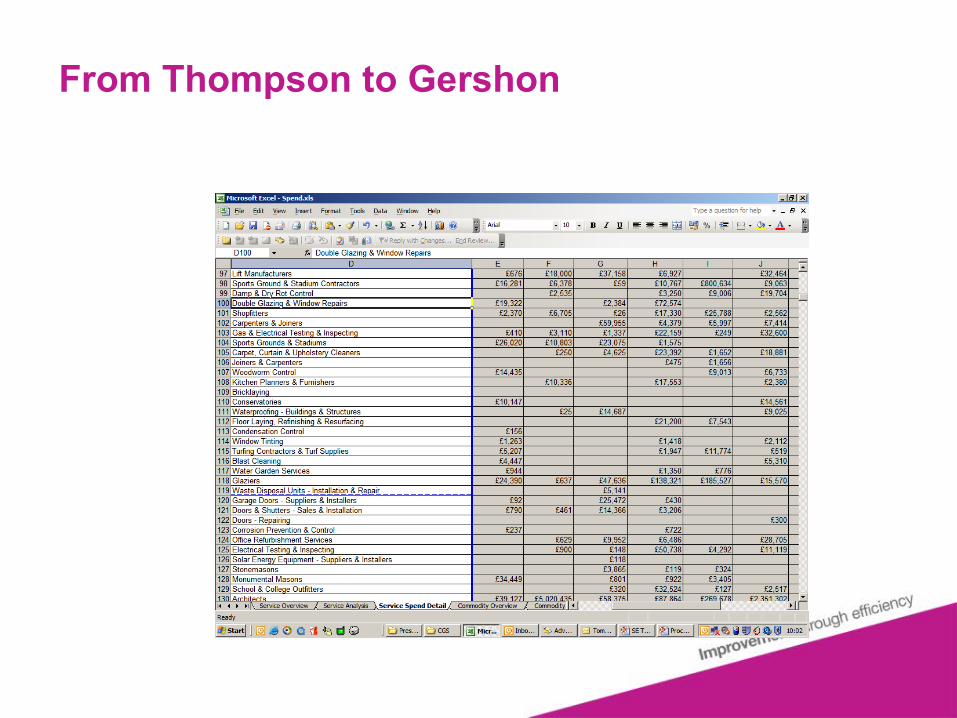
From Thompson to Gershon

External Spend – National Overview
Construction Spend: £14.3 Billion35% of total external spend
Corporate Services Spend: £14.2 Billion35% of total spend
Social Care Spend: £7.8 Billion19% of total spend
Waste Spend: £2.9 Billion7% of total spend
Commodity, Goods and Services. Spend in top 4 areas £11.3 billion, 30% of total spend
These four areas cover £96% billion of the total external spend
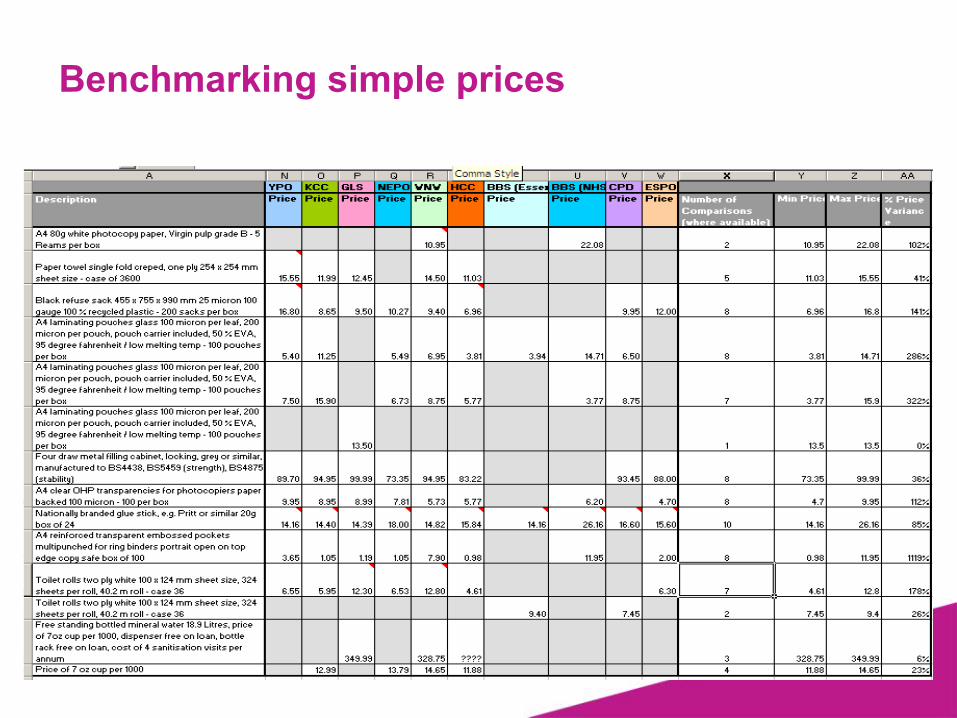
Benchmarking simple prices

Benchmarking Complex prices
Average gross weekly expenditure per looked after child in foster care or in a children's home (incl respite and short term placements and placed for adoption)
0
500
1,000
1,500
2,000
2,500
3,000
3,500
4,000
Hampshire
Isle
of W
ight U
AKen
t
Med
way T
owns
UA
South
ampt
on U
A
East S
ussex
West
Berks
hire
UA
Slough
UA
Wind
sor a
nd M
aiden
head
UA
Portsm
outh
UA
Brack
nell F
ores
t UA
Wokin
gham
UA
Reading
UA
Milto
n Key
nes U
A
Oxford
shire
Surre
y
Bright
on an
d Hov
e UA
Buckin
gham
shire
West
Susse
x
£ 10
00 Saving - Upper Quartile
Unit Cost
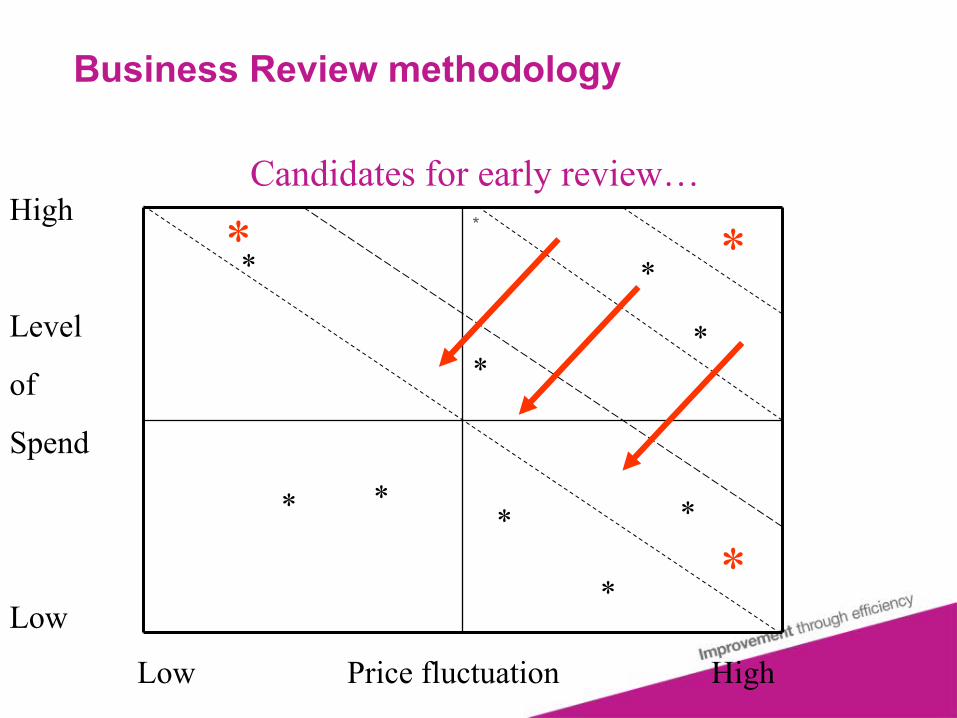
Business Review methodology
*
Low Price fluctuation High
High
Level
of
Spend
Low
*
* *
*
*
*
*
*
* **
*
Candidates for early review…

Comprehensive Gap Analysis
• What we do / buy? • From whom do we buy? • What we pay / cost?
• What contractual arrangements exist?
• Rate pay / outcome?

Business Review methodology
*
Low Price fluctuation High
High
Level
of
Spend
Low
*
* *
*
*
*
*
*
* **
*
Candidates for early review…Level of Spend (Cost)
•Actual Calculation
•Internal Costs (of service delivery)
•External Spend(of service delivery)
•On-Cost
•Service Management Costs
•Corporate
Result = Total/Unit cost

Business Review methodology
*
Low Price fluctuation High
High
Level
of
Spend
Low
*
* *
*
*
*
*
*
* **
*
Candidates for early review…Level of Spend (rate)
•Total Spend (now)
•No of Units of service delivery
•Rate per Unit
•Ratio of Management Costs:Service Costs
Result = Total/Unit cost
Take 5 yr projected position where service demands are dynamic

Business Review methodology
*
Low Price fluctuation High
High
Level
of
Spend
Low
*
* *
*
*
*
*
*
* **
*
Candidates for early review…Benchmark Information
(Price Fluctuation)
•Returns (PSS EX1, E51, BVPI’s CCPR etc etc)
•Contracts Portal
•External Spend Analysis
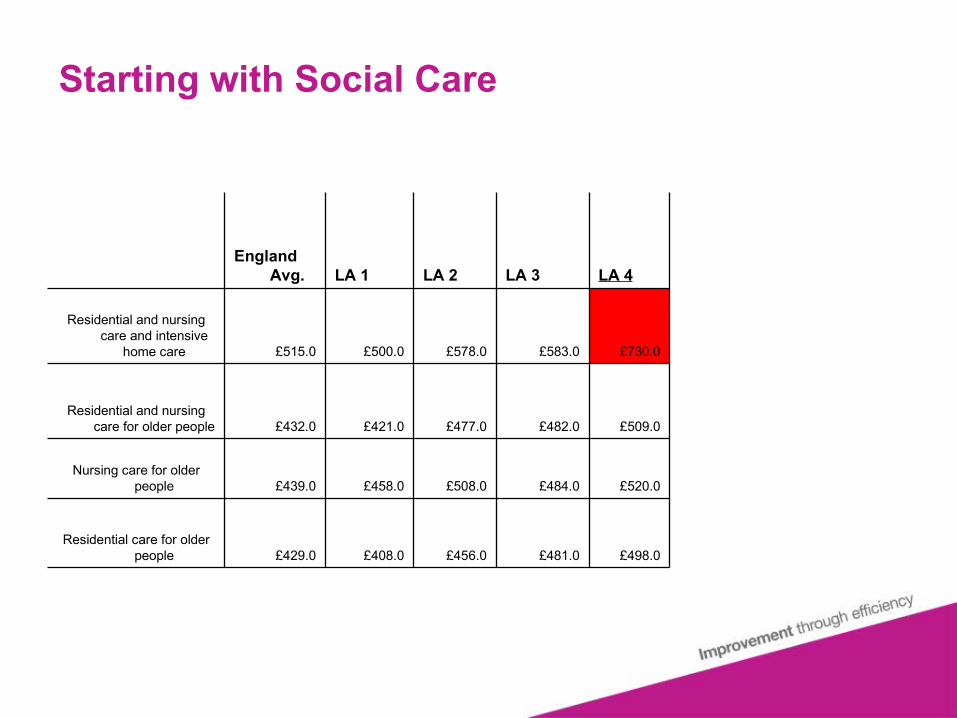
Starting with Social Care
England Avg. LA 1 LA 2 LA 3 LA 4
Residential and nursing care and intensive
home care £515.0 £500.0 £578.0 £583.0 £730.0
Residential and nursing care for older people £432.0 £421.0 £477.0 £482.0 £509.0
Nursing care for older people £439.0 £458.0 £508.0 £484.0 £520.0
Residential care for older people £429.0 £408.0 £456.0 £481.0 £498.0

Key Projects

Top 30 spend categories for all council spend
Buildings

Buildings
Partnership / Non Framework £43,000,000Strategic Frameworks £71,000,000Traditional procurement £393,000,000
Based on responses from 5 County Councils and 10 Unitary Councils in 2005

Pulling the levers: Buildings Construction Frameworks
• South East Regional Framework– No limit on the number of members– Savings 5% spot, 12% groups of blgs, 20%
programmes?
• Regional framework is well established and projects with commitment approaching £1.3 Billion in the first year
– Cost overruns are being reduced from an average of 10% to less than 1%
– Each project is saving more that £150K in procurement costs and savings on construction costs look likely to exceed 10%
– Participation now includes Police, Fire, NHS, Further Education (LSC)
– The first Hospital is being procured through the framework and the construction of the first project, Alfred Sutton School, is completed

Sub regional activity
• Sub Regional Frameworks– Intermediate projects, more local firms– Surrey, Berkshire, Hampshire
• Commodities - later• Client capacity
– Sharing professional resource– Supporting improvement– Consultancy framework
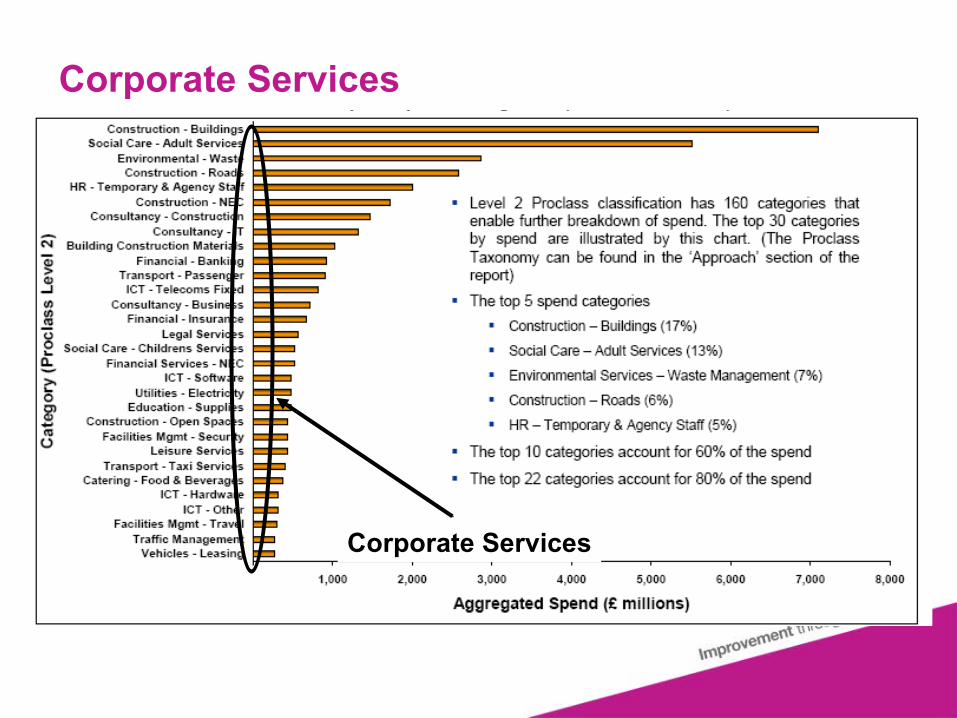
Corporate Services
Corporate Services

Corporate and Transactional Services
• South East Market– Individual business cases but no global business case– High expectations from government– No critical mass
• Significant local authority collaboration– Adur and Worthing merged officer structure– Adur, Mid Sussex and Horsham partnership– South Oxfordshire / Vale of White Horse– Berkshire Procurement and Shared Service Unit
• Service specific collaborations– Pan regional joint library management system contract signed
with £1m savings• Cross sector collaboration
– Police, Fire, Health, Local Authority• Isle of White• Brighton and Hove
• Corporate procurement– Legal services– Banking services

Commodity Goods and Services
Commodity Goods and Services

Extrapolated NationalCommodity Spend
Category CGS Spend
Temporary and Agency Staff £1,995,649,352
Building Construction Materials £1,016,584,553
Telecoms - Fixed £810,416,180
Insurance £675,133,872
Legal Services £558,092,496
Software £480,843,065
Electricity £475,761,198
Catering Food and Beverages £369,354,629
Hardware £319,213,999
Leasing £271,598,118
Commercial £236,517,481
Water £227,565,571
Mail Services £225,737,404
Furniture £212,980,958
Travel £208,160,545
ICT Other (NEC) £206,009,684
Accountancy £193,425,692
Print £190,622,913
Catering Services £184,057,186
Heavy Construction Equipment £183,413,585
Training and conferences £179,801,085
Gas £169,381,986
Stationary £155,082,049
Sports and Playground £144,315,463
Advertising £138,626,225
Social Care - Supplies £137,204,844
Extrapolated national spend of £10.6 billion

Commodity Goods and Services
• 30% of external spend is commodity spend (Directly identifiable)• From stationary to agency staff• Top 20 commodities account for 81% of the commodity spend• A saving of 10% would be 1.5% of an authorities total spend• Authorities can have off contract spend of 40% to 60%, although it may be as low
as 5%• Overpayment on 40% off contract spend equates to 0.6% of total budget• 3 levels of procurement
– Market knowledge and management– Aggregating buying power– Ensuring take up
• Tried to do all in every local authority – NPS wrong direction?• Initial views of consortia
– Little take up– Variation in performance for buy and sell price
– Lack of transparency and trust

Commodity activities
• Market intelligence• Business Portal
– Sharing contract information– One stop shop for suppliers– Identify opportunities to collaborate and save
• Best Deals – more later
• Commodity reverse auctions• Procurement Hubs
– Sharing procurement resource across local authorities

Example: Best deals service
• Compare over 3000 commodities– Over 2000% variation between price of a single
commodity is relatively common
• Market study to supplement the commodity comparison
• OJEU watch of local authority notices• Portal of local authority contract information, register
of contracts
• Bring together in pro-active and re-active service– Working with clusters of authorities to migrate to lowest
price– Advising authorities going to procurement of existing
opportunities– Creating procurement hubs to aggregate local authority
spend

Example: Commodity Reverse Auction
• Procurements in Y&H, NE.• Savings of 25% to 40%• SME friendly
– Increasing efficiency of SME usage– Reducing costs of the SME supply chain– Allowing SME’s to compete fairly

Social Care
Social Care

A complex set of areas
• A number of services– Some generic like needs assessment– Many specific
• A number of age ranges of customers
45%
39%
14%
2%
0%
0% Residential Care Homes
Nursing Homes
Home Care Services
Rest & Retirement Homes
Mental Health Centres
Home Help Services -Private
42%
41%
10%
4% 3%Adoption & Fostering
Children's Homes
Childcare Services
Children's Activity Centres
other

Social Care
• South East Market– Regional adult social care spend c. £673– Big area of cost overrun– Big variation in unit costs
• Low hanging fruit – e.g. Taxi services– C. £10 m per County area– Saving 40% with quality improvement
• Learning Difficulty Placements– high cost specialist residential care average 12% saving– Cost model
• Frameworks for specialist services– live-in domiciliary care and nursing dementia care up to 10%
• Centralised buying of temporary worker time 10% to 20%• Roll out of the Kent Purchase Card
– Savings and transparency of costs

Example: National Roll out of Learning Difficulty Toolkit

National toolkit pilots
All regions taking part in pilot
Total 71
6
11
6
9
2
18
76
6

Timeline
Phase Completion Date
• Establish team including recruitment of necessary resources Completed
• Property expert to develop a formula for property prices to be included in the tool
Completed
• Develop toolkit Completed
• Develop guidelines for use of model Completed
• Train pilot authorities • Pilot authorities use on at least 20 cases each
Completed Ongoing
• Pilot authorities feed back results of pilots End January 2008
• Model and guidelines updated • Estimate of savings achieved in pilot sites • Agree plan for ensuring continuing updates of national cost
assumptions
End February 2008
• Launch in Regions • Regional training programmes established
End March 2008
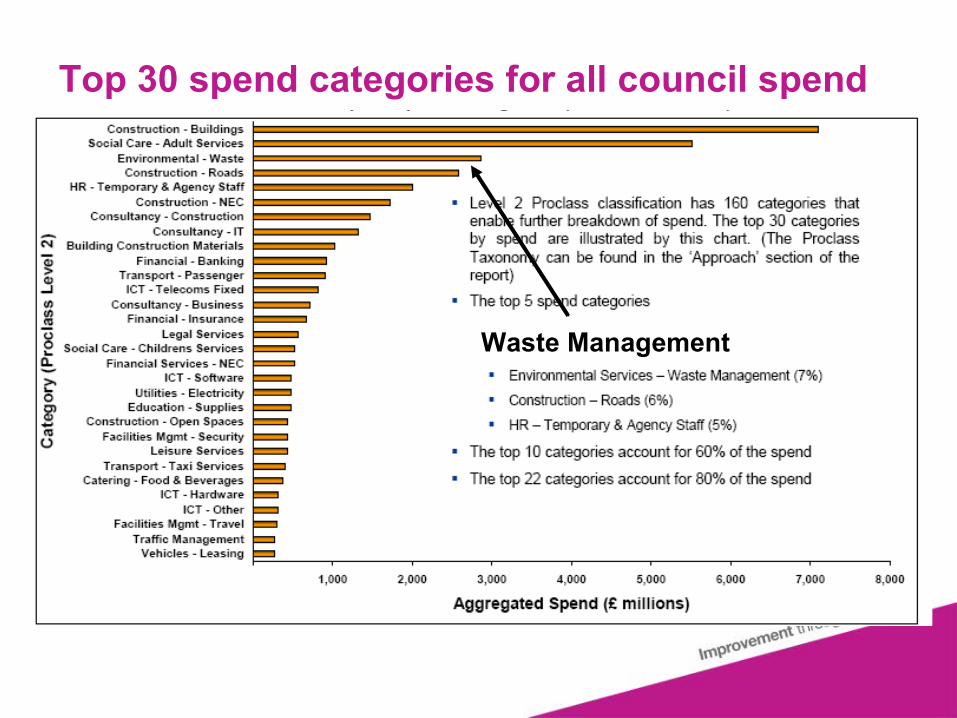
Top 30 spend categories for all council spend
Waste Management

The Municipal Waste Flow Diagram
Reprocessing and Market
Tre
atm
ent
Fina
l D
ispos
al a
nd
Mar
ketin
g
Energy RecoveryDispoal to Land
Material Recycling/Recovery Facility (MRF)
Mechanical Biological Treatment (MBT)
Composting
Civic AmenintyBring Banks
Col
lect
ion
Kerbside Collection
Hom
e se
pera
tion
Home Composting
Food Digestion
Re-Use
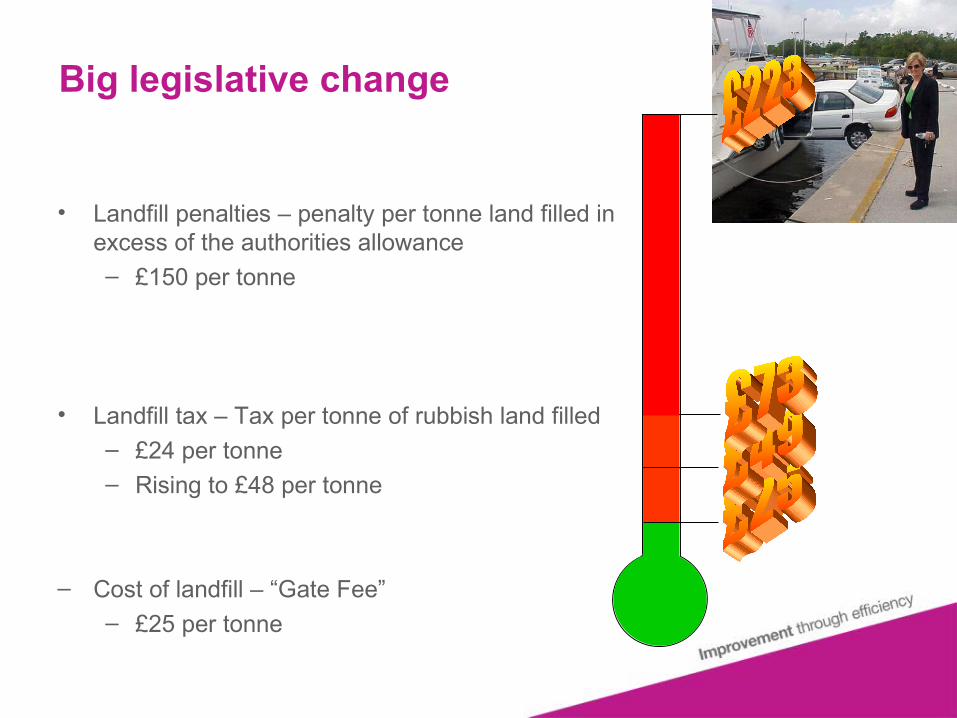
Big legislative change
• Landfill penalties – penalty per tonne land filled in excess of the authorities allowance– £150 per tonne
• Landfill tax – Tax per tonne of rubbish land filled– £24 per tonne– Rising to £48 per tonne
– Cost of landfill – “Gate Fee”– £25 per tonne

Waste Management
• South East Market– Regional waste management services spend c. £427 million– England
• Potential LATS fines of £2 billion to £3 billion - England• >60%% of collection contracts coming to market within 3 yr period
• Reduce disposal costs– WDA collaboration: Northants / MK, Bucks / RBWM– Use of new technology to reduce disposal required– Standardisation of collection methods
• Reduce the costs of collection– Collaborative procurement of commodities / reverse auctions– Use of e-tendering– Collaborative collection contracts
• Reduce the costs of procurement– Use of e-tendering

Joining up with the Improvement Partnerships
“when two elephants compete it is the grass that suffers.”
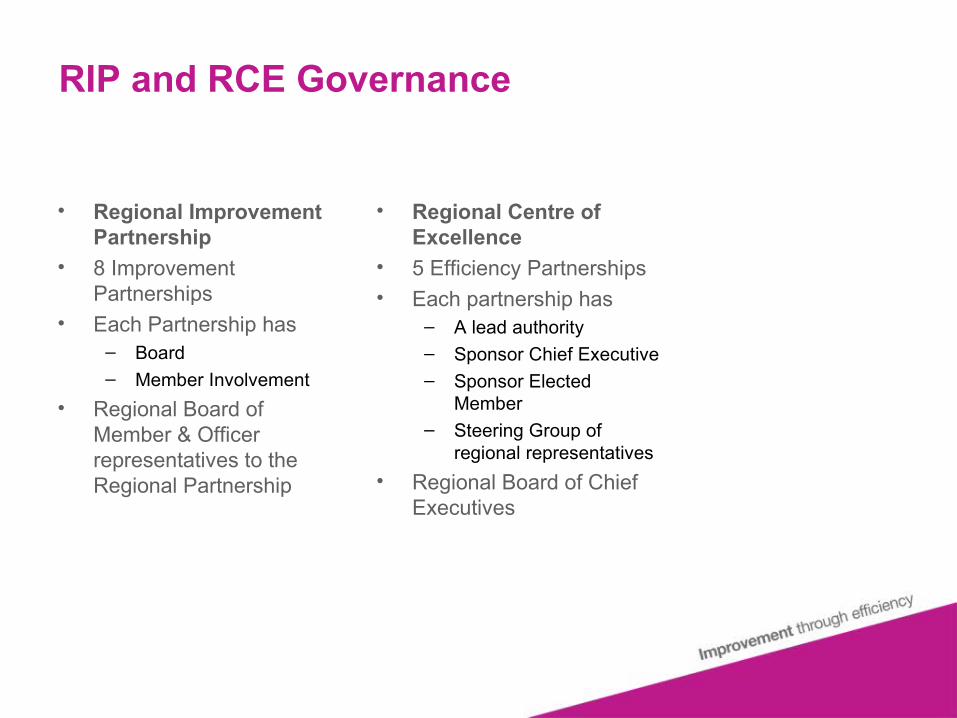
RIP and RCE Governance
• Regional Improvement Partnership
• 8 Improvement Partnerships
• Each Partnership has – Board– Member Involvement
• Regional Board of Member & Officer representatives to the Regional Partnership
• Regional Centre of Excellence
• 5 Efficiency Partnerships• Each partnership has
– A lead authority– Sponsor Chief Executive– Sponsor Elected
Member– Steering Group of
regional representatives
• Regional Board of Chief Executives

SOUTH EAST IMPROVEMENT AND EFFICIENCY PARTNERSHIP
Progress Through Partnership(LSP’s)
GEOGRAPHICAL
PARTNERSHIPS
Fire Improvement Partnership
Berkshire
Hampshire/Isle of Wight
Surrey
Kent & Medway
Sussex (East & West Sussex/Brighton & Hove)
Milton Keynes, Oxfordshire & Bucks
THEMED
PARTNERSHIPS
Waste(Led by East Sussex)
Social Care(Led by West Sussex)
Buildings Construction(Led by Hampshire)
Commodity Goods & Services(Led by Wealden)
Corporate & Transactional Services(Led by Aylesbury)
SEIEP Partnership Structure

Developing the SE CSR07 Regional Strategy
June AugJuly
SEIEP Board Approval by email
Develop PID
• Timescales
• Resources
• Roles
• Approval route
• Dependencies on CLG
• Formats and detailed plans for consultation
• Acceptance criteria for plan
• Evidence based template for proposals
31st
Subregional Strategies & Phase 1 Bids
10th?
NIS Published
Draft High LevelBusiness Plan
(compile component bids)
30th24th
Sept Oct Nov JanDec
RIPNetwork
19th
SECE Workstream Strategies & Phase 1 Bids
SEIEPConference
SEIEP Board sign-off
Draft Detailed Business Plan
Bid Review & Approval
(to include RIP Boards and SECE Board approval of local plans)
Final Draft Business
Plan
Rebuild of Evidence Base
• SECE spend analysis
• Audit Commission & IDeA views
• Summarise draft NIS etc.
SEIEP Member Panel
30th
Feb
RIPNetwork
19th
SEIEP
Member/Of
ficer Board
8th

Where have we got to and where next

South East Return on Investment
£0
£5,000,000
£10,000,000
£15,000,000
£20,000,000
£25,000,000
£30,000,000
EastMidlands
East ofEngland
London NorthEast
NorthWest
SouthEast
SouthWest
WestMidlands
Yorkshire& the
HumberRCE
Exp
ecte
d S
avin
gs
Reasonable
Analysis carried out by external consultants at end 2006
SECE Figures – Jan 07
Return on £1 Social Care Corp Proc Buildings Waste CTS
SECE £32 £42 £58 £40 £11
Total £26 £42 £58 £32 £3

SECE Budget Position
£0
£500,000
£1,000,000
£1,500,000
£2,000,000
£2,500,000
£3,000,000
Budget 07/08 Spend atend August
Core Team
Comms
Buildings
Waste
Social Care
CTS
CGS
• Budget includes variances to original budget agreed in July
• Spend running behind the curve due to resources only recently coming on board
• All workstreams forecasting to spend budgets
• £700k surplus predicted from original 3 yr funding of £6.8m – required to cover 08/09 contract commitments
• £10.7m evidenced savings to date• Expected savings over 5 years
– High confidence £38 million– Medium confidence £120 million
Where have we got to and where next?
• Collaboration– Some key examples
• Pan regional• Local• More to do to make this the norm ….• … Within and between regions
• Proven Financial Impact– But the challenge is getting bigger– More to do
• DCLG – “Challenging”• Easy things done?
How do we reduce lead time?
• 2 year lead time common– for complex projects this can be longer
• Engagement with local authorities
• Development and negotiation of– contracts and– shared services arrangements
• Some big wins already identified– Some are scaleable or repeatable– We need to work together on these
• Quick wins largely identified– Effort must continue in getting them implemented
How do we coordinate activity and share knowledge?
• National leads– Sponsor Chief Executive– National steering group
• All regions represented• Roll out across regions
– Links to government departments
• Regional Directors Group• Monitoring and reporting projects
– Consistent approach across regions– Clear and convincing information on benefits– Expanded to include improvement benefits
• Subject specialist information– Waste Information Network– Business Improvement Package– Lawshare– Spend analysis
• Events: conferences seminars and workshops

How do we coordinate with Government?
• Nationally, DEFRA has identified six key priorities to support delivery of efficiency targets for waste management:
Priority Best Placed Lead
1.Effective and efficient procurement of goods and services that provide value for money by WCA’s
RCE’s
2. Effective Regional Procurement of large scale waste recycling, treatment and disposal infrastructure projects
DEFRA
3.Promoting and supporting Local Authorities in recycling infrastructure projects and initiatives
WRAP
4.Improving skills, knowledge and awareness RCE’s/ CIWM/ WRAP
5. Streamlined efficient systems and processes RCE’s
6. Service improvement programmes delivering “best in class” performance
RCE’s / WRAP

How do we ensure we transplant success?
• Framework procurement process in parallel with the first procurements across South East
– Kent, Oxfordshire, Buckinghamshire• What variation would be possible?
– A number of standard options under the framework
– Some variables would be settled when the authorities contract is let e.g. cost of back door collection. But against a standard pricing calculator
– Costs of what we are asking for would be transparent• How would a partnership of collection authorities work?
– A contract is let which has a variable start date– For each authority the new contract would start as their existing contract
ended
– The contract as a whole would come into effect as the first authority entered into it
How do we capitalise on big wins?
• Where are the big wins?– Large Buildings Framework– Insurance Municipal– Care Placements Pricing Tool– Regional shared procurement– LawShare Project– Business Process Improvement ….
• What sort of expertise do we need?– Procurement and project management– Process improvement and service redesign– Market understanding and domain expertise
• Can we also impact improvement?– Expertise used to manage collective arrangements– Add to this capacity to support activity in struggling
authorities– Essential to ensure a minimum standard

Cooperative Public Purchasing
Dr Andrew Larner
Regional Director
South East Improvement & Efficiency Partnership
www.sece.gov.uk