![bf]u8fs]bf/, b]pmn]s, a}t8L](https://static.fdocuments.net/doc/165x107/617f170add094e35ff6a4207/bfu8fsbf-bpmns-at8l.jpg)
BF-ro Ft=~wqonlinepubs.trb.org/Onlinepubs/nchrp/nchrp_rpt_192.pdf · 192 bf-ro ft=~wq dec 4 1978...
55
192 BF-ro F t=~wq DEC 4 1978 MAT. LAB. NATIONAL COOPERATIVE HIGHWAY RESEARCH PROGRAM 19 REPORT PREDICTING MOISTURE-INDUCED DAMAGE TO ASPHALTIC CONCRETE ç rç IT I Ti SLPV Inuio TRANSPORTATION DEPARTMENT RESEARCH LIBRARY I J M- - - - - --------------- - - -' L '.iANA( i1f Ai i i ( )r PCI CXR. [~L WO " -A &'7f1 -- IIJI:J TRANSPORTATION RESEARCH BOARD NATIONAL RESEARCH COUNCIL
Transcript of BF-ro Ft=~wqonlinepubs.trb.org/Onlinepubs/nchrp/nchrp_rpt_192.pdf · 192 bf-ro ft=~wq dec 4 1978...

192
BF-ro Ft=~wq DEC 4 1978
MAT. LAB.
NATIONAL COOPERATIVE HIGHWAY RESEARCH PROGRAM 19 REPORT
PREDICTING MOISTURE-INDUCED DAMAGE TO ASPHALTIC CONCRETE
ç rç IT I Ti
SLPV Inuio TRANSPORTATION DEPARTMENT
RESEARCH LIBRARY I J M- - - - -
--------------- -
-
-'
L '.iANA(
i1f Ai i i ( )r PCI CXR. [~L
WO "
-A &'7f1
-- IIJI:J
TRANSPORTATION RESEARCH BOARD NATIONAL RESEARCH COUNCIL

TRANSPORTATION RESEARCH BOARD 1978
Officers
SCHEFFER LANG, Chairman PETER G. KOLTNOW, Vice Chairman W. N. CAREY, JR., Executive Director
Executive Committee
HENRIK E. STAFSETH, Executive Director, American Assn. of State Highway and Transportation Officials (ex officio) KARL S. BOWERS, Federal Highway Administrator, U.S. Department of Transportation (ex officio) RICHARD S. PAGE, Urban Mass Transportation Administrator, U.S. Department of Transportation (ex officio) JOHN M. SULLIVAN, Federal Railroad Administrator, U.S. Department of Transportation (ex officio) HARVEY BROOKS, Chairman, Commission on Sociotechnical Systems, National Research Council (ex officio) HAROLD L. MICHAEL, Professor of Civil Engineering, Purdue University (ex officio, Past Chairman 1976) ROBERT N. HUNTER, Chief Engineer, Missouri State Highway Department (ex officio, Past Chairman 1977) HOWARD L. GAUTHIER, Professor of Geography, Ohio State University (ex officio, MTRB liaison) KURT W. BAUER, Executive Director, Southeastern Wisconsin Regional Planning Commission LAWRENCE D. DAHMS, Executive Director, Metropolitan Transportation Commission, San Francisco Bay Region
L. DEBERRY, Engineer-Director, Texas State Department of Highways and Public Transportation ARTHUR C. FORD, Assistant Vice President (Long-Range Planning), Delta Air Lines FRANK C. HERRINGER, General Manager, San Francisco Bay Area Rapid Transit District ARTHUR J. HOLLAND, Mayor, City of Trenton, N.J. ANNE R. HULL, Speaker Pro Tem, Maryland House of Delegates ROBERT R. KILEY, Chairman, Massachusetts Bay Transportation Authority PETER G. KOLTNOW, President, Highway Users Federation for Safety and Mobility THOMAS J. LAMPHIER, President, Transportation Division, Burlington Northern, Inc. A. SCHEFFER LANG, Assistant to the President, Association of American Railroads ROGER L. MALLAR, Commissioner, Maine Department of Transportation MARVIN L. MANHEIM, Professor of Civil Engineering, Massachusetts Institute of Technology DARRELL V MANNING, Director, Idaho Transportation Department ROBERT S. MICHAEL, Director of Aviation, City and County of Denver, Colorado THOMAS D. MORELAND, Commissioner and State Highway Engineer, Georgia Department of Transportation GEORGE E. PAKE, Vice President, Xerox Corp.; Manager, Xerox Palo Alto Research Center DOUGLAS N. SCHNEIDER, JR., Director, District of Columbia Department of Transportation WILLIAM K. SMITH, Vice President (Transportation), General Mills JOHN R. TABB, Director, Mississippi State Highway Department JOHN P. WOODWARD, Director, Michigan Department of State Highways and Transportation
NATIONAL COOPERATIVE HIGHWAY RESEARCH PROGRAM
Transportation Research Board Executive Committee Subcommittee for the NCHRP
A. SCHEFFER LANG, Association of American Railroads (Chairman) KARL S. BOWERS, U.S. Department of Transportation PETER G. KOLTNOW, Highway Users Federation HARVEY BROOKS, National Research Council HENRIK E. STAFSETH, Amer. Assn. of State Hwy. and Transp. Officials ROBERT N. HUNTER, Missouri State Highway Department
W. N. CAREY, JR., Transportation Research Board
Field of Materials and Construction Area of General Materials Pro ject Panel D4-8(3)
W. H. GOETZ, Purdue University (Chairman) W. ADAMSON, University of Southern California GRANT J. ALLEN, Arizona Department of Transportation L. F. ERICKSON, Idaho Dept. of Transp. (Deceased) KAMRAN MAJIDZADEH, Ohio State University
Program Staff
KRIEGER W. HENDERSON, JR., Program Director DAVID K. WITHEFORD, Assistant Program Director LOUIS M. MACGREGOR, Administrative Engineer R. IAN KINGHAM, Projects Engineer ROBERT J. REILLY, Projects Engineer
C. PETERSEN, Energy Research and Development Admin. R. J. SCHMIDT, Chevron Research Company (deceased)
YORK WELBORN, Consulting Engineer STEWART R. SPELMAN, Federal Highway Administration W. G. GUNDERMAN, Transportation Research Board
HARRY A. SMITH, Projects Engineer ROBERT H. SPICHER, Projects Engineer HERBERT P. ORLAND, Editor HELEN MACK, Associate Editor EDYTHE T. CRUMP, Assistant Editor

NATIONAL COOPERATIVE HIGHWAY RESEARCH PROGRAM 192 REPORT
PREDICTING MOISTURE-INDUCED DAMAGE TO ASPHALTIC CONCRETE
ROBERT P. LOTTMAN
UNIVERSITY OF IDAHO
MOSCOW, IDAHO
RESEARCH SPONSORED BY THE AMERICAN
ASSOCIATION OF STATE HIGHWAY AND
TRANSPORTATION OFFICIALS IN COOPERATION
WITH THE FEDERAL HIGHWAY ADMINISTRATION
AREAS OF INTEREST:
PAVEMENT DESIGN
PAVEMENT PERFORMANCE
BITUMINOUS MATERIALS AND MIXES
MAINTENANCE, GENERAL
TRANSPORTATION RESEARCH BOARD NATIONAL RESEARCH COUNCIL
WASHINGTON, D.C. 1978
N

NATIONAL COOPERATIVE HIGHWAY RESEARCH PROGRAM
Systematic, well-designed research provides the most ef-fective approach to the solution of many problems facing highway administrators and engineers. Often, highway problems are of local interest and can best be studied by highway departments individually or in cooperation with their state universities and others. However, the accelerat-ing growth of highway transportation develops increasingly complex problems of wide interest to highway authorities. These problems are best studied through a coordinated program of cooperative research. In recognition of these needs, the highway administrators of the American Association of State Highway and Trans-portation Officials initiated in 1962 an objective national highway research program employing modern scientific techniques. This program is supported on a continuing basis by funds from participating member states of the Association and it receives the full cooperation and support of the Federal Highway Administration, United States Department of Transportation. The Transportation Research Board of the National Re-search Council was requested by the Association to admin-ister the research program because of the Board's recog-nized objectivity and understanding of modern research practices. The Board is uniquely suited for this purpose as: it maintains an extensive committee structure from which authorities on any highway transportation subject may be drawn; it possesses avenues of communications and cooperation with federal, state, and local governmental agencies, universities, and industry; its relationship to its parent organization, the National Academy of Sciences, a private, nonprofit institution, is an insurance of objectivity; it maintains a full-time research correlation staff of special-ists in highway transportation matters to bring the findings of research directly to those who are in a position to use them.
The program is developed on the basis of research needs identified by chief administrators of the highway and trans-portation departments and by committees of AASHTO. Each year, specific areas of research needs to be included in the program are proposed to the Academy and the Board by the American Association of State Highway and Trans-portation Officials. Research projects to fulfill these needs are defined by the Board, and qualified research agencies are selected from those that have submitted proposals. Ad-ministration and surveillance of research contracts are responsibilities of the Academy and its Transportation Research Board.
The needs for highway research are many, and the National Cooperative Highway Research Program can make signifi-cant contributions to the solution of highway transportation problems of mutual concern to many responsible groups. The program, however, is intended to complement rather than to substitute for or duplicate other highway research programs.
NCHRP Report 192
Project 4-8(3) FY '72 ISSN 0077-5614 ISBN 0-309-02851-5 L. C. Catalog Card No. 78-65091
Price: $5.20
Notice
The project that is the subject of this report was a part of the National Cooperative Highway Research Program conducted by the Transportation Research Board with the approval of the Governing Board of the National Research Council, acting in behalf of the National Academy of Sciences. Such approval reflects the Governing Board's judgment that the program concerned is of national impor-tance and appropriate with respect to both the purposes and re-sources of the National Research Council. The members of the technical committee selected to monitor this project and to review this report were chosen for recognized scholarly competence and with due consideration for the balance of disciplines appropriate to the project. The opinions and con-clusions expressed or implied are those of the research agency that performed the research, and, while they have been accepted as appropriate by the technical committee, they are not necessarily those of the Transportation Research Board, the National Research Coun-cil, the National Academy of Sciences, or the program sponsors. Each report is reviewed and processed according to procedures established and monitored by the Report Review Committee of the National Academy of Sciences. Distribution of the report is ap-proved by the President of the Academy upon satisfactory comple-tion of the review process. The National Research Council is the principal operating agency of the National Academy of Sciences and the National Academy of Engineering, serving government and other organizations. The Transportation Research Board evolved from the 54-year-old High-way Research Board. The TRB incorporates all former HRB activities but also performs additional functions under a broader scope involving all modes of transportation and the interactions of transportation with society.
Published reports of the
NATIONAL COOPERATIVE HIGHWAY RESEARCH PROGRAM
are available from:
Transportation Research Board National Academy of Sciences 2101 Constitution Avenue, N.W. Washington, D.C. 20418
Printed in the United States of America.
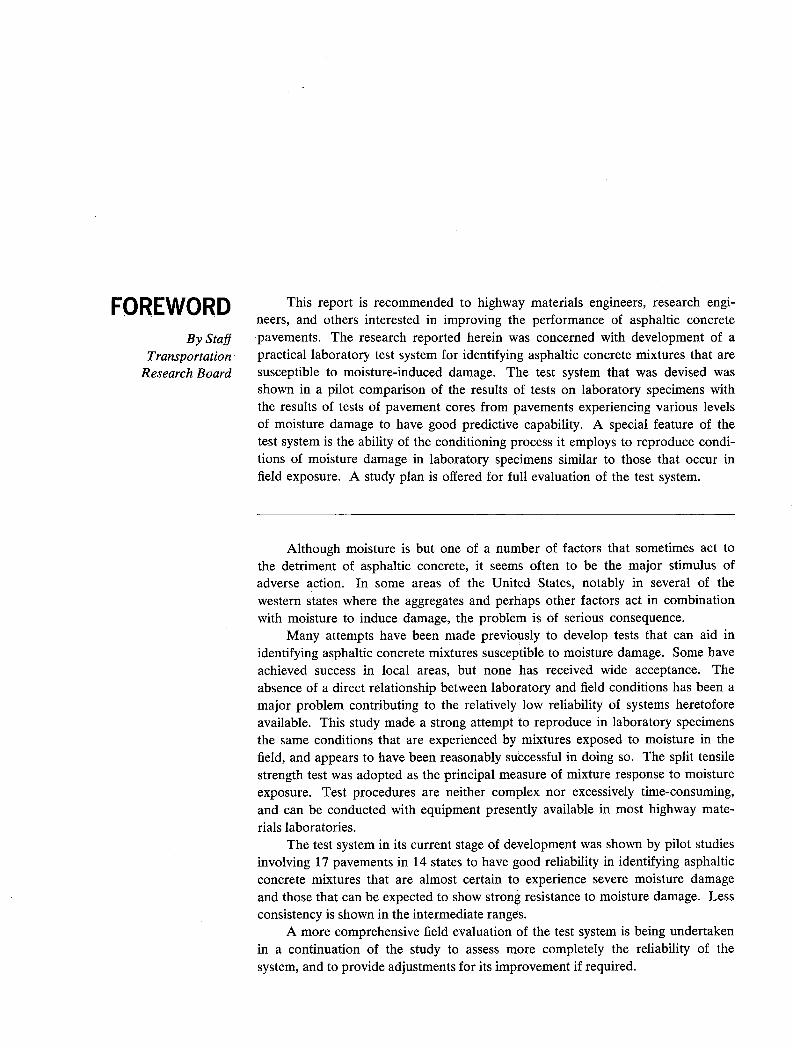
FOREVVORD This report is recommended to highway materials engineers, research engi- - neers, and others interested in improving the performance of asphaltic concrete
By staff pavements. The research reported herein was concerned with development of a
Transportation practical laboratory test system for identifying asphaltic concrete mixtures that are
Research Board susceptible to moisture-induced damage. The test system that was devised was shown in a pilot comparison of the results of tests on laboratory specimens with the results of tests of pavement cores from pavements experiencing various levels of moisture damage to have good predictive capability. A special feature of the test system is the ability of the conditioning process it employs to reproduce condi-tions of moisture damage in laboratory specimens similar to those that occur in field exposure. A study plan is offered for full evaluation of the test system.
Although moisture is but one of a number of factors that sometimes act to the detriment of asphaltic concrete, it seems often to be the major stimulus of adverse action. In some areas of the United States, notably in several of the western states where the aggregates and perhaps other factors act in combination with moisture to induce damage, the problem is of serious consequence.
Many attempts have been made previously to develop tests that can aid in identifying asphaltic concrete mixtures susceptible to moisture damage. Some have achieved success in local areas, but none has received wide acceptance. The absence of a direct relationship between laboratory and field conditions has been a major problem contributing to the relatively low reliability of systems heretofore available. This study made a strong attempt to reproduce in laboratory specimens the same conditions that are experienced by mixtures exposed to moisture in the field, and appears to have been reasonably successful in doing so. The split tensile strength test was adopted as the principal measure of mixture response to moisture exposure. Test procedures are neither complex nor excessively time-consuming, and can be conducted with equipment presently available in most highway mate-rials laboratories.
The test system in its current stage of development was shown by pilot studies involving 17 pavements in 14 states to have good reliability in identifying asphaltic concrete mixtures that are almost certain to experience severe moisture damage and those that can be expected to show strong resistance to moisture damage. Less consistency is shown in the intermediate ranges.
A more comprehensive field evaluation of the test system is being undertaken in a continuation of the study to assess more completely the reliability of the system, and to provide adjustments for its improvement if required.

CONTENTS
1 SUMMARY
PART I
3 CHAPTER ONE Introduction and Research Approach Project Objectives Research Approach Terminology
7 CHAPTER TWO Findings Test System Results
19 CHAPTER THREE Interpretation, Appraisal, and Application Pavement Moisture Damage Moisture-Damage Test System Application to Mixture Design and Selection of Materials Application to Structural Design of Pavements Mixture Limitations for Application of Test System
22 CHAPTER FOUR Conclusions and Recommended Research Conclusions Recommended Research
24 REFERENCES
PART II
25 APPENDIX A Laboratory Testing During Study
32 APPENDIX B Proposed Research Plan for a Field Evaluation Study
38 APPENDIX C Test Data
43 APPENDIX D Visual Characterizations
ACKNOWLEDGM ENTS
The research reported herein was performed under NCHRP Project 4-8(3) by the Department of Civil Engineering, Uni-versity of Idaho, with Robert P. Lottman, Professor of Civil Engineering, as principal investigator. Part of the work was performed by Battelle-Northwest and the University of Wash-ington under subcontracts with the University of Idaho.
The main portion of the test work was accomplished at the University of Idaho through the continuous assistance of Roger P. Chen and Sudhindra Kumar, Research Associates. Larry Wolf, Research Associate, assisted in the tensile E-modulus test measurements through a device he developed under a Phillips Petroleum Fellowship.
J. Leland Daniel, Research Associate, supervised the work at Battelle-Northwest, consisting of application of scanning elec-tron microscopy and low-power microscopy to the matching of moisture damage in asphaltic concrete. During the first part of the project, P. E. Hart, Senior Research Scientist, and G. L. Tingey, Technical Leader, joined with Dr. Daniel in evaluating moisture-damage test conditions by physical and
mechanical measurements. At the Department of Civil Engi-neering, University of Washington, Ronald L. Terrel, Associate Professor of Civil Engineering, and José Villa, Research Asso-ciate, performed moisture conditioning through repeated-load triaxial tests in the first part of the project and performed and analyzed thermal-cycle rate-of-damage tests in the second part of the project.
Materials engineers and others from a number of state highway and transportation agencies aided in selection of the pavements included in the study and helpfully provided the pavement samples and asphaltic concrete materials included in the testing. The following states were represented: Alaska, Arizona, California, Colorado, Idaho, Montana, Nebraska, New Jersey, Ohio, Oregon, South Dakota, Tennessee, Texas, Virginia, and Wyoming.
Asphalt viscosity, penetration, and softening-point data were obtained by Chicago Testing Laboratory on recovered asphalt from pavement cores and laboratory-fabricated specimens rep-resenting several pavements.

PREDICTING MOISTURE-INDUCED DAMAGE TO ASPHALTIC CONCRETE
SUMMARY Premature damage induced in asphaltic concrete by moisture is a severe problem in many areas of the United States. Experience has shown that many factors, such as asphalt characteristics, aggregate properties, mixture design, construction procedures, environmental condition, and traffic, contribute in some measure to the onset and severity of the condition. The presence of moisture, however, is usually the critical influence.
Numerous attempts have been made previously to develop tests that can aid in identifying asphaltic concrete susceptible to moisture damage. None has been more than moderately successful or has received wide acceptance. A primary problem has been a lack of direct relationship between test and field conditions.
The objectives of this research project were to: (1) develop a practical labora-tory test system, simulative of field conditions but using accelerated test condition-ing based on known research and experience, for quantitatively predicting the magnitude and rate of progression of moisture damage in asphaltic concrete; (2) assess the effectiveness of the test system through a pilot evaluation using information from in-place pavements; and (3) prepare a plan for a field evaluation study to test the predictive capabilities of the system against actual pavement performance and permit application of appropriate adjustments to the system, if required.
The approach selected for the study was based primarily on the supposition that proper moisture conditioning could reproduce in cores taken from pavements and in laboratory-prepared cylinders of the same materials compacted to the same densities, a strength condition representative of that occurring in the pavements with moisture present. It was supposed further that pavements, cores, and laboratory specimens must necessarily be identical to that applied to the cores. These same premises were applied in a similar but more limited earlier study conducted with locally available materials by the University of Idaho in cooperation with the Idaho Department of Highways with encouraging results.
Vacuum saturation was applied to cores to reproduce a saturated field condition. Vacuum saturation was also applied to laboratory specimens, but was found, in general, not to result in strengths as low as those of similarly treated companion cores when the materials were susceptible to moisture damage. This resulted in further experi-mentation with moisture conditionings to be applied to the laboratory specimens following vacuum saturation to produce strengths more nearly of the same order as those of the vacuum-saturated companion cores.
Strengths of both cores and laboratory specimens were determined using an indirect tension (diametral compression) test at a specified loading rate and temperature. Tensile strengths and an instantaneous E-modulus .were computed from the loadings. The test was applied to dry cores and laboratory specimens, to vacuum-saturated cores and specimens, and to additionally moisture-conditioned specimens.
In an attempt at normalization, most evaluations of moisture damage made use of a tensile-strength ratio and an E-modulus ratio, for which the tensile strength and E-modulus of dry cores and specimens served as reference bases.
The test system utilizes conventional-size test specimens, and test equipment that, with the exception of one item that can be fabricated in-house, is available in most highway materials laboratories.
Once the general format of the test system was established, different moisture-conditioning processes were applied to the laboratory specimens following vacuum saturation, and predictive capabilities judged by comparing responses of the treated specimens with those of companion vacuum-saturated cores when subjected to the indirect tensile test, and by comparing microstructures as observed through scanning electron microscopy and by low-power microscopy. Naaerous moisture-conditioning procedures to follow vacuum saturation were examined in the initial phase of the work; two procedures

that appeared to be the most promising were evaluated more exhaustively through the remainder of the project. In an initial series of tests, 6 pavements in 3 states, varying in age from 2 to 10 years, were represented in the study. When results appeared promising, the study was expanded to 17 pavements in 14 states, varying in age from 2 to 12 years. Pavements showing various levels of moisture damage, as well as pavements showing no visible signs of damage, were included in the study.
Both of the finally selected conditioning processes applied to laboratory specimens produced a moderate overprediction of actual core response to vacuum saturation on an over-all basis. However, matching of core response per pavement showed some underpredictions, some equal matches, and some overpredictions. The two moisture conditionings applied to vacuum-saturated specimens that appeared most promising were one cycle of freeze-plus-soak (0-140 F), and 18 cycles of 0-120-0 F. The thermal-cycle conditioning was somewhat more severe, over-all, but did not result in underpredictions. For the 17 pavements included in the evaluations, the test system was able to distinguish between poor performers and good performers in most instances.
Evaluation of freeze-plus-soak-conditioned specimens by the E-modulus ratio from the indirect tension test at 55 F (vertical deformation rate = 0.065 in. per mm) produced the best predictions of core response (overprediction by 15 percent). Over-all, test variabilities for the tensile-strength ratio were about 8 percent; for the E-modulus ratio, about 16 percent. It is believed that laboratory specimens to which an asphalt aging process is applied as part of the conditioning, when matched to pavement cores, will produce even closer predictions.
The progression of strength change that can be identified in laboratory specimens by applying the split-tensile test at the intermediate condition of vacuum saturation, in addition to the dry condition and after thermal or freeze-plus-soak cycling, is believed to have application in examining the rate at which moisture damage can be expected to progress.
The moisture-damage test system that was selected as having the greatest potential for success includes the following steps:
Fabrication of a series of laboratory specimens (cylinders) of the same materials and to the same density as the pavement to be constructed.
Exposure of two-thirds of the specimens to vacuum saturation. Exposure of one-half of the vacuum-saturated specimens to further moisture
conditioning. Testing of all specimens in the split-tension mode at a specified loading
rate and temperature. S. Computation of tensile strength (and instantaneous E-modulus if desired). 6. Evaluation of moisture damage using tensile-strength (and E-modulus) ratios,
for which the tensile strength (and E-modulus) of dry specimens are reference bases for the ratios.
A plan for a comprehensive field evaluation of the test system is proposed. The plan requires: (1) testing of samples of the same components used in pavements; (2) tests and observations on six simultaneously constructed new paving projects, two each at three different climate locations; (3) monitoring pavement moisture and temperature over a 5-year period from start of paving; and (4) refinement of proce-dures for laboratory specimen aging and accelerated moisture conditioning as necessary to attain a practical degree of accuracy in predicting pavement moisture damage.

cHAPTER ONE
INTRODUCTION AND RESEARCH APPROACH
3
Asphaltic concrete mixtures sometimes sustain moisture-induced damage that shortens appreciably the lives of the pavements in which they are incorporated. The damage results when moisture causes stripping from loss of cohesion due to the action of moisture within the asphalt or asphaltic matrix. Both stripping and softening sometimes occur in the same mixture.
Resulting damage has been assessed quantitatively by mechanical tests in which such properties as loss of tensile strength, or decrease of resilient and stiffness moduli, have been measured. It is possible that changes in fatigue behavior also occur as damage progresses. Decreases in strength and stiffness due directly to moisture reduce the performance of a moist asphaltic concrete pavement, and consequently should be considered in pavement design and mixture design practice.
Moisture-induced damage is usually easy to identify when stripping is evidenced. Where a loss of pavement stiffness or modulus occurs without visual stripping, the cause of the problem is less easily recognized, and not as much is known regarding the effects of this loss on pavement performance.
To be of maximum utility, a predictive test system must produce all of these damages to the extent that they occur in a pavement, and the resulting prediction of loss of mechanical stability must be relatively accurate for acceptance in practice.
A number of different tests have been used to predict the likelihood of moisture-induced damage occurring in asphaltic concrete (1, 2,. 3, 5, 6, 10, 13, 14, IS, 16, 19). Among these are, A TMD T0754, AASHO T5-, TSTM D 1664-69, and ASThID 2727-71. Additional tests, developed on the basis of experience with a limited range of materials and environmental conditions, have received local use in the areas of development. None of the tests developed to date has been sufficiently reliable for general acceptance.
The unfilled void space that compacted asphaltic concrete mixtures must contain if the asphalt content is to be maintained at a level that will prevent flushing is, unfortunately, sufficient in volume to hold damaging quantities of moisture in susceptible mixtures. The volume of these voids is a variable dependent on both the characteristics of individual mixtures and the degree to which they are compacted in the pavement. This situation, compounded by the varied character of the combinations of mixture ingredients themselves (asphalt and mineral aggregate), makes moisture-damage prediction difficult. The approach in NHRP Project 4-8(3) was to evaluate combinations of mixtures representative of pavement materials that exist in the compacted state after exposure to moisture.
To evaluate the performance of a structure successfully, an understanding of both its material characteristics and the influences to which it is exposed is required. Highway pavement research in past years has tended toward greater emphasis on material characteristics. Currently, the effects of the environment under which pavements serve, including both climate and loading, are receiving increased notice. Recent attention has been given to thermal cracking, moisture-induced damage, and asphalt redistribution in pavements due to temperature change. Also, more precise work is now being accomplished toward identification of the behavior of asphalt
cements as they are subjected to heat, light, and air.
Moisture-damage test systems can employ both environmental and load-associated conditioning procedures if required to reproduce field conditions. However, if a comiion response mechanism is found to be involved, the test system can be simplified through elimination of some of the complexities of climate and/or traffic.
A laboratory test system for predicting moisture-induced damage in asphaltic concrete must be both reliable and physically practical if it is to gain the confidence and support of highway materials and construction engineers. It must be adequately sensitive to material properties and changes. It must also be correlated with actual pavement perfor-mance so that its quantitative reliability will allow the highway materials engineer to adjust materials to provide optimum serviceability or, where necessary, to support recoiinnendations for use of more durable (and probably more expensive) materials, mixtures, or construction processes. Confidence is often lacking in the results obtained from current test procedures.
A prior three-year study of moisture damage in asphaltic concrete, conducted by the University of Idaho in cooperation with the Idaho Department of Highways (10), provided a considerable amount of backgroundTnformation for the present investigation. A predictive test system was developed for Idaho conditions in the earlier work using a vacuum to produce saturation in laboratory specimens and field cores, and following with a specimen conditioning procedure using several freeze-thaw cycles. Resulting moisture damage was evaluated quantitatively using slow-speed indirect tension tests at 55 F on a "before-and-after" approach. Because NCHRP Project 4-8(3) was to be of national scale, a re-examination of different types of moisture-conditioning and damage-evaluative procedures for a more diverse situation of pavements and locations was necessary.
PROJECT OBJECTIVES
The primary objective of this research was the development of a practical laboratory test system for quantitatively predicting the ability of an asphaltic concrete to resist the detrimental effects of moisture under field conditions. The test system was expected to: (a) be based on previous and current research, field experience, and laboratory experi-ments; (b) simulate the conditions under which asphaltic concrete pavements must perform in the field; and (c) provide a practical means for accelerated testing of asphaltic concrete to predict the magnitude and the rate of progression of damage due to the effects of moisture for any given set of influencing factors, such as asphalt character-istics, aggregate properties, mix design, construc-tion procedures, environmental conditions, and traffic loading. A pilot evaluation of the test system, involving a laboratory experimental program utilizing information from in-service pavements exhibiting both good and poor performance histories, was to be included in the research effort. In addition, a detailed research plan for a comprehen-sive field evaluation study to examine in depth the

LI
predictive capabilities of the test system and to provide for improvements as needed was to be prepared.
RESEARCH APPROAQ-I
In this study, the development of a laboratory procedure to predict the moisture-damage susceptibil-ity of asphaltic concrete mixtures was approached with the supposition that, if laboratory specimens of these mixtures could be moisture-conditioned to produce responses to mechanical testing in the same magnitude as moisture-conditioned cores from pave-ments of the same mixtures subjected to the same mechanical testing, and the moisture conditioning of the cores was reasonably representative of the moisture environment of pavements in the field, the laboratory specimens themselves would reflect the condition of the pavements from which the cores were taken.
Both damaged and undamaged pavements were rep-resented in the test program. All of the damaged pavements showed loss of adhesion between aggregate particles and the asphaltic binder in the manner usually associated with the presence of moisture. In most instances the causative involvement of the moisture could be accepted with confidence. In a
few, however, conditions were sufficiently atypical to suggest the possibility that moisture may not have been the prime cause of damage. For this reason, the emphasis of the project was placed primarily on the exploration of relationships between the responses of pavement cores and companion laboratory specimens to moisture conditioning, and secondarily on relation-ships between laboratory specimen response and observed pavement condition.
To meet the general objective of the project, the work was pursued in two major phases, in which the second phase followed completion of the first phase and was dependent on its outcome.
In the first phase:
1. Core samples were obtained from six pavements in three states (Arizona, Idaho, Virginia). Two of the pavements showed moisture damage (Category 1); four did not (Category 2). Summary data for the pavements sampled are given in Table 1. Pavement ages at the time of sampling ranged from 2 to 10 years, averaging about 5 years. The highway agencies of the three states submitted, in addition to cores, supplies of aggregates and asphalts representative of those in the pavements, together with related data on gradations, void contents, densities, and asphalt contents.
TABLE 1
iUMIARY DAIA FOR pAVF14ENTS SAMPLED
Location
State
Idaho 1-15-1(9) 61 Sect. B. Portneuf 1':C---South Poca- tello I.C. -
Condition Reported by Thickness Hwy. Agency of Asphaltic Concrete
Moisture 0.20' Class D a.c. bottom course; damage 0.10' Class D a.c. second course; (stripping) ½" seal coat top.
Ave. Annual Freezing Report
Year Degree-Days IdentiFication Paved After Paving Reference
1965 706 ID-a (Lab. match to bottom course)
Virginia Pamplin City By-pass US 460 460-6-107
Good 4" Type B-3 a.c. base; 1.75" Type 1-2 a.c. binder; ½" Type S-S a.c. surface course.
Arizona 1-40-4(23) 27o Good a.c. bottom course (no line East of Joseph City (for top slurry); 2" a.c. middle course
two courses) (line slurry); 2" a.c. top course (line slurry); ½" seal
--.----- ------ -- coat.
Idaho 101514-4(13) 97 / Good 0.10' a.c. top course; 0.20' a.c. bottom course.
Idaho F-FG-1024(13) Good 0.15' a.c. top course; 0.15' a.c. bottom course. Both a.c. courses treated with 1% anti-strip additive in asphalt.
Arizona 1-40-4(16) 262 Moisture asphalt-treated base; 3.5" West of Joseph City damage a.c. upper course (no lime
(stripping) slurry); ½" seal coat.
1969 267 VA-2 (Lab. match to binder)
1967 392 AZ-2(E) (Lab. match to line slurry-treated middle course)
1961 700 ID-2(MR) (Lab. match to bottom course)
1966 700 ID-2(B ST) (Lab. match to bottom course)
1966 392 AZ-l(W) (Lab. match to upper course no line slurry
Wyoming 1-80 Laranise- Moisture Two courses of 1½" and 1'. 1962 696 14) -i Cheyenne damage Lab. match to
(stripping) bottom course)
Nebraska Project Moisture Three courses (1½" top, 1967 704 NB-I F-130(16), d;unag 1½" and 3" bottom). (Lab. match to So. of Sidney bottom course)
Colorado Project Rutting and Two courses (111" top and 1969 364 CO-1 1-70-5(16) raveling 3½" bottom). (Lab. match to Burlington-East top course of 1½")
Oregon US 97 Moisture Two courses of 2" each. 1967 329 OR-1 Worden-California damage (Lab. match to State Line (stripping) bottom course)
South Route US 212, 30 Moisture Two 2" courses; "Reclainite" 1968 1630 SD-1 Dakota miles West of damage treatment was done before the (Lab. match to
Faith cores were sampled for test, bottom course)

TABLE 1 - (CONTINUED)
Location
State Route
Condition Reported By Hwy. Agency
Thickness of Asphalt Concrete
Year Paved
Ave. Annual Freezing Degree-days
After Paving
Report Identification
Reference
Montana Project Moisture Thickness of 4.20. 1960 1518 Mr-i 1-IG 15-1(9)0 damage ½" seal cost at top. Anti- (Lab. match to Liiaa-Monida (stripping) strip agent used in asphalt. bottom course)
Texas Project Moisture Four 1" a.c. courses. 1961 0 TX-i 2-10-8(24) 821 damage (Lab. match to Beaumont District (stripping) bottom course)
Alaska Project Moisture 1½" binder course and a 1½" 1966 2131 AK-i F- 031-2(2) damage wearing course; percent (Lab, match to Ingra-Gambell anti-strip agent used, wearing course) Couplet, Anchorage
Colorado Highway 95 on Good Two 11-2 -thick courses of 1968 390 CO-2 Sheridan Blvd. asphaltic concrete. (Lab. match to both Denver top and bottom
course)
California State Route Good A.c. pavement placed in 1970 0 CA-2 29 near Valiejo three courses. (Lab, match to
bottom course)
New Project Good Two 1½-thick courses of 1969 200 NJ-2 Jersey -295-1(38)9 a,c. pavement. (Lab. match to
Sec. 1 S) bottom course) Wiiliamstown area
Texas SH 145 Possible 2" and ½" seal 1972 0 TX-3 Chambers County moisture coat at top. (Lab. match to 2"- (Near IH-10) damage thick ac. course)
(new pavement)
Ohio Project 340-71 Possible Three courses of 1½", 1½" 1972 538 OH-3 Kirkland (Lake moisture and 5" at the bottom. (Lab. match to County) damage top 1½' course)
(new pavement)
61
Mixture materials were proportioned and compacted into laboratory specimens (cylinders) that reproduced as closely as possible the propor-tions and densities of the field cores.
Sets of cores were divided into two groups: cores of one group were brought to a dry state; cores of the other group were vacuum-saturated. Sets of laboratory specimens were divided into three groups: specimens of one group were maintained in a dry condition; those of the second group were vacuum-saturated; those of the third group were also vacuum-saturated, and then further conditioned by other processes, including thermal cycling, soaking, and water suction.
Several mechanical tests and other evaluative processes were applied to the cores and laboratory specimens following treatment. Mechanical testing involved principally an indirect-tension test procedure. Triaxial repeated-load testing was used to a lesser extent. Temperatures and other influen-cing factors were varied during testing. Other evaluative procedures were all variations of the visual process, including naked eye, scanning elec-tron microscopy (SEM), and low-power microscopy.
S. Using all available core-specimen matching data, giving consideration to the condition of the pavements from which the cores were taken, and considering practical requirements, the best combina-tions of conditioning and testing procedures for application to laboratory specimens to predict the likelihood of moisture-induced damage and to a lesser extent the rate at which damage progresses, were selected. Practical considerations, in addition to perfonnance matching ability, included the avail-ability of testing equipment in the average highway
agency, ease of testing, specimen size, ease of comparison with pavement cores in further develop-ment, sensitivity to mixture variations, and ease of application of test results in practice.
6. Over-all results were evaluated to determine whether further research was warranted and, if so, of what it should consist. This evaluation led to the conclusion that further research was necessary and desirable, and to the establishment of a second-phase work plan.
In the second phase:
Additional highway agencies were invited to participate in the sampling effort to gain broader representation on a national basis to confirm general applicability of the test systems tentatively estab-lished in the first phase, or to provide information that could lead to modifications that would result in general applicability.
As a result of the contacts made with addi-tional states, core samples were obtained from 13 more pavements in 11 more states that extended appreciably the climatic environment of the pave-ments studied. The states are well distributed and include Alaska. Eleven of the pavements had been in service from 2 to 12 years, averaging 6 years, at the time of sampling. Two were new pavements in good condition, but suspected of being constructed of materials susceptible to moisture damage (Cate-gory 3). Eight of the eleven pavements that had been in service over a period of years showed damage from loss of bond between aggregate particles and the asphalt binder (Category 1); three showed no damage (Category 2). Table 1 gives pertinent infor-mation relative to the pavements sampled.

As in the first phse of the study, the par-ticipating agencies furnished supplies of aggregates and asphalts representative of those in the pavements from which cores were taken, and provided related data on gradations, void contents, densities, and asphalt contents.
The submitted materials were proportioned and compacted into laboratory specimens reproducing as closely as possible the field cores.
S. As before, some of the cores and laboratory specimens were conditioned by vacuum saturation. Two additional conditionings (thermal cycling and freeze-plus-soak) were applied to a portion of the vacuum-saturated laboratory specimens. Other cores and specimens received no conditioning treatments.
The tentatively established mechanical test system (indirect tensile test) was applied to the cores and laboratory specimens.
The data obtained in items 5 and 6 were evaluated to determine the ability of the tentative test system to predict moisture-damage susceptibility.
In addition to the major study of the appli-cability of the tentatively selected test system for predicting susceptibility to moisture damage, the laboratory program to study trends in the rate at which moisture damage progresses, undertaken in the first phase, was continued. Visual examinations by naked eye and microscope of the basic characteris-tics of damage, started in the first phase of the study, also were continued but at a lower level of activity.
When the broader applicability of the adopted test system for predicting moisture-induced damage in asphaltic concrete was established, a research plan that could be used by any agency wishing to do fur-ther field evaluation was devised. The work plan offers well-defined guidelines for study that could lead to further improvement in the predictive capa-bility of the test system that has resulted from the project effort.
Two subcontractors, Battelle-Northwest Labora-tories in Richland, Wash., and the Department of Civil Engineering at the University of Washington n Seattle, Wash., were engaged by the University of Idaho to assist in conducting the study. The three agencies were active in both phases of the research project, having the following specific assignments: Battelle-Northwest performed microstructural studies and selected the test processes that provided the best predictions of moisture-induced damage; the University of Washington assisted in the solicitation of pavement samples and performed repeated-load tests during the first part of the project, and in the second phase evaluated rate of moisture damage through a repeated-load approach; the University of Idaho coordinated all of the research, performed the main portion of the laboratory moisture-damage tests, and had responsibility for all evaluation and for report preparation.
TERMINOLOGY
Special teniis used in the report arc dcfined as follows:
Tensile Strength - A computed strength of a pavement core or laboratory specimen tested in indi-rect tension (tensile split), in psi.
E-Modulus or Tensile E-Modulus - A computed instantaneous modulus or stiffness of a pavement core or laboratory specimen tested in indirect tension (tensile split), in psi. (Not a resilient modulus)
Tensile Strength Ratio (TSR) - The ratio of tensile strength of a moisture-conditioned core or specimen divided by tensile strength of a dry core or specimen.
E-Modulus Ratio (E-Mod R) - The ratio of E-modulus of a moisture-conditioned core or specimen divided by E-modulus of a dry core or specimen.
Vacuum Saturation - A room-temperature moisture conditioning consisting of application of a 30-min vacuum on a core or fabricated specimen sub-merged in distilled water followed by a 30-min soak in distilled water at ambient atmospheric pressure.
Dry - The condition of core or specimen at con-stant weight in a desiccator.
Thermal Cycle - An accelerated moisture condition-ing produced on a vacuum-saturated laboratory speci-men (or core from a new pavement), consisting of 18 cycles of 0-120-0 F, 8 hr per cycle.
Freeze-Soak - An accelerated moisture condition-ing produced on a vacuum-saturated laboratory speci-men (or core from a new pavement), consisting of 15 hr of 0 F air bath exposure followed by 24 hr. in a water bath (distilled water) at 140 F.
Soak - The submergence of a specimen in distilled water at a constant temperature.
Test Temperature - The temperature of mechanical tests used for obtaining tensile strength and E-modulus.
Conditioning Temperature - The temperature of soak or of other accelerated moisture conditionings.
Pavement Identification Codes - Two-letter state abbreviations (U.S. Post Office designation) followed by category of pavement condition. For example, WY-i is Wyoming, Category 1 pavement (Table 1).
Freezing Degree- Days - The freezing degree-days for post-construction years only; equal to the average annual sum of the number of days having average tem-peratures below 32 F multiplied by the difference in degrees between the average daily temperature (below 32 F) and 32 F per day.
Permeable Voids (Voids) - The voids that are permeated by water when dense-graded, compacted, asphaltic concrete pavement cores (laboratory speci-mens) are vacuum saturated in a submerged condition. These voids numerically are equal to or less than the maximum voids calculated by ASTM Method D 2041-71. (A relationship used to calculate permeable voids is given in Appendix B as part of a tentative test system proposed for field evaluation.)

FINDINGS
TEST SYSTEM
This section outlines in summary form the various procedures that were evaluated in the search for a satisfactory test system for predicting moisture damage, inclusive of those finally identified as producing the best results. Results are presented in the following section. Additional details are given in Appendix A.
1. Preparation of Pavement Cores and Laboratory Specimens Because the study was constructed around devising
a test procedure that could be applied to laboratory specimens with results that would match those obtained on pavement cores of similar materials sub-jected to the same testing, and which would be indicative of the moisture damage experienced by the pavement from which the cores were lifted, the taking of cores and the preparation of them for the mechan-ical tests to be applied were important to the ultimate success of the project.
Until a determination could be made as to whether wet drilling as normally used would have an adverse effect on core structure with respect to subsequent testing, both wet and dry drilling were done. When it was found that wet drilling had no apparent detrimental influence on the cores for the purpose of the project, only the wet-drilling process was used thereafter.
An earlier Idaho project (10) showed that the indicated strengths of most pavement cores tested in a dried state, even though lifted from moisture-damaged pavements, tend more nearly to reflect original strengths rather than the lower strengths that probably exist in the pavements at the time when moisture is present and causing damage. A study by Schmidt and co-workers (15) produced similar results. These findings led in t1i present project to an assumption that some form of moisture condition-ing should be applied to the cores before strength testing if cores are to be representative of pavements at the time of damage. However, it was thought that dry cores also should be tested to provide a basis for "nondamage" mechanical properties. Drying was accomplished by desiccation to constant weight. Even though a dried core could exhibit mechanical properties somewhat lower than those of the mix immediately after construction, this dry basis was conceived to be a practical reference for pavements that had been in service for some time.
When attempts were made to core pavements that had been badly damaged by moisture, material disin-tegration sometimes resulted in failure to obtain testable cores at individual locations. This suggests that the cores that reached the laboratory from badly damaged pavement sections probably represented a condition somewhat better than the worst prevailing condition.
Usually, core elements representing the bottom layer in multicourse construction (not plant-mixed asphaltic base) were cut from the full cores for the laboratory tests. Cutting was done with a masonry saw. The previous Idaho study (10) showed that moisture damage could be expecteTto be more severe in the lower courses. Upper portions of cores were tested only when state agencies reported specifically that the moisture-damage problem had occurred in the upper pavement course. Sometimes also, 1- 21-,-in. cores were taken from a single mix and did not require laboratory cutting.
All core section faces were brushed clean with a stiff bristle brush using distilled water before being placed in the desiccator.
Laboratory specimens companion to the cores were fabricated from aggregates and asphalts submitted by the highway agencies as offering the best possible representation of the materials in the pavements from which the cores were lifted. The aggregates furnished for the study were all from the original sources, and probably can be considered to be fairly representative of the original materials. The asphalts, although from the refineries of the origi-nal materials, may not always have been as truly representative, although the original viscosities and/or penetration-temperature relationships were approximately matched. Asphalt manufacturing processes had changed in the years following construction, and some changes in the characteristics of interest in the study may at times have resulted.
Aggregate gradations for the specimen mixes were averages as determined from record-sampling extracted-aggregate gradation data furnished by the partici-pating highway agencies. Asphalt contents of the specimens at first were set to meet construction project averages reported by the highway agencies. Later, they were set to match those determined for the companion cores.
The asphalt was extracted from pavement cores for checking asphalt content after laboratory tests for moisture damage. The average pavement core void content was used as a target void content for compac-ted laboratory specimens. Void content was based on permeable voids obtained by vacuum saturation. Four-inch diameter by 2.5-in, thick specimens were com-pacted by a kneading compactor, in two equal courses (scarified between courses), using a leveling load for final compaction. (Specimens for repeated loading were 4-in, diameter by 8-in, high, compacted in several courses). The number of compaction blows and the pressure were varied to achieve the required target voids. (Note: Before compaction, the loose mix was aged in a 140 F oven for 15 hr; mixing temperature was constant, 300 F). More than 2,000 test specimens were fabricated in the project.
Specimens after compaction were allowed to remain aL room temperature for 24 hr before measurement of voids and before further testing. Vacuum saturation was used with specimen volume to determine permeable voids (Appendix B). Because water was introduced by vacuum saturation, testing and conditioning of specimens proceeded immediately after permeable void determination.
The previous Idaho study (10) showed a high degree of sensitivity of moisture damage to permeable-void content in dense-graded asphaltic concrete. There-fore, only compacted specimens having permeable void contents within -'-0.5 percent of the target void con-tent were used to obtain data; the others were dis-carded.
2. Accelerated Moisture Conditioning Pavement cores were moisture-conditioned by
vacuum saturation to reduce their mechanical capabil-ities to what was conceived to be about the minimum that could be expected in the field situation (moisture damage). Laboratory specimens were simi-larly moisture-conditioned by vacuum saturation, and, in addition, subjected to a variety of other subse-quent conditionings designed to accelerate the moisture damage process, in a search for the combina-

tion that could best match the ci Cects produced on the cores and pavements by moisture.
The accelerated-conditioning processes, always applied following vacuum saturation, included: (1) simple soak tests at 120 F, and sometimes at 140 F and 160 F, for several days; (2) water suction; (3) thermal cycle tests (0-120-0 F and 40-120-40 F) using repeated temperature changes in an air bath; and (4) repeated load tests in a triaxial cell using variable pressure, drainage, temperature, and numbers of repetitions.
Information developed in the prior Idaho study (10) led to selection of the conditioning processes tJt were investigated. That study showed the best between-wheel path specimen-core match to be prod-uced by applying 12 thermal cycles of 0-120-0 F, 8 hr per cycle, on saturated laboratory specimens. The sane study showed that moisture damage also could be produced by repeated loading and by soaking at ele-'ated temperatures. It was thought that these condi-tioning processes produced moisture damage either by development of pore-water pressure within the specimen, or by reaction of warm water at the aggregate-asphalt interface, or by both. The number of cycles of the thermal-cycle conditioning test was increased from 12 to 18 on the present project when the first effort showed about 10 percent more damage at 18 cycles, and that 18-cycle damage was at about maximum when considering matching to wheel path cores. Each ty)e of accelerated conditioning required different equip-ment and test times, implying that equipment simplic-ity and time of test should be practical considerations in selecting a best method, providing close specimen-core matches could be achieved.
In the second phase of the proiect, the number of types of accelerated conditioning methods that were used was reduced to two: the 18-cycle, 0-120-0 F thermal-cycle conditioning after vacuum saturation; and a freeze-plus-soak (0 to 120 F) conditioning after vacuum saturation. The latter was introduced in the second phase of the project based on prac-ticality of procedure, time, and equipment, and a seeming capability to produce damage equivalent to that of the thermal-cycle conditioning. The length of time required to produce 18 thermal cycles of 0-120-0 F is six days, whereas the time for the new freeze-plus-soak conditioning is 15 hr at 0 F plus 24 hr at 140 F.
A 0 F air bath appliance-type freezer and a 140 F temperature-controlled water bath were used for the freeze-plus-soak conditioning. !utonatically timed air temperature chambers were used for the thermal-cycle conditioning. Figure 1 shows one of the temperature chambers used with plastic-wrapped vacuum- saturated specimens inside the chamber.
3. Mechanical Testin The indirect tension test was the major procedure
used to assess the moisture damage of both pavement cores and moisture-conditioned laboratory specimens. In the first phase of the project, a repeated-load triaxial test was performed to determine a modulus of resilience and the amount of permanent deformation. The resultant data for the laboratory specimens and pavement cores were found not to correlate well, and the test procedure was not further pursued. Some repeated-load triaxial tests were performed in the second phase of the project to determine applica-bility to the assessment of rate of progression of moisture damage, but again without much success. Therefore, the results reported in this chapter are based on data obtained only from the indirect tension test. Tensile strengths were determined by the indirect tension test in both phases of the study. During the second phase of the project, both tensile
Figure 1. Cyclic Air Tenrperature Chamber with Wrapped Test Specimen.
strength and an instantaneous tensile stiffness called an 'F-modulus' were calculated; compressive stiffness waa determined in the first phase but discarded because of an over-all lack of good matches and a belief that its use was less easy to rationalize as compared with tensile stiffness. Both tensile strength and tensile E-modulus data are reported in this chapter.
Tensile strength was calculated from the comnon diametral tensile stress (tensile split) equation modified by an equation for specimen flattening at maximum load. These equations are given in Appendix A. Many of the cores and specimens flattened to about 0.6 in., giving about a 4 percent reduction of tensile strength as calculated by the tensile split equation.
The data for calculation of tensile E-modulus were obtained during the indirect tension test by measuring tensile (horizontal) displacements and recording corresponding loads at 5-, 10-, or 15-sec time inter-vals up to the maximum load. These data were treated in diametral elastic equations (14) to calculate modulus values at the various te't times. These values were extrapolated to zero test time to arrive at an B-modulus (see Appendix A). A low-cost device was made to obtain the horizontal displacements.
Figure 2 shows a typical general test set-up and a close-up of the horizontal displacement device used (B-modulus device). Almost any compressive test machine that has a rate control and a load dial accurate to about 25 lb could be used.
During the time span of the project, Schmidt and co-workers at Chevron were independently developing a tens i le-res i lient -modulus MR) device for low strains in the indirect tension test, and it has been shown to be practical for assessing moisture damage in asphaltic concrete (14,15). It should be noted that the moduli calculated by the E-modulus device may be lower than the moduli calculated by the Chevron device because of the higher strain measurements used in the E-modulus device. Relative assessments of moisture damage could, however, be the same for both devices.

'4 AMA
),tILI I-
L
Figure 2. Gsngral Indirect Tcurion Set-c
Right: Horizontal or Tensile Dis-placement Device in Position During Test.
Indirect tension tests were conducted at 55 F and 73 F test temperatures. The 55 F test temperature was chosen on the basis of evidence from the previous Idaho study (10, 12) shr.wing that this temperature produces maximum over all indication of moisture damage under a vertical compressive deformation rate of 0.065 in. per min in the indirect tension test. This test temperature was used throughout the project. Later in the project (second phase), a 73 F test tem-perature, often considered room temperature, also was used. This temperature has the practical advantage of not necessarily requiring the constant-temperature water bath needed for the 55 F test temperature. The compressive deformation rate required to give maximinn moisture damage indication at 73 F was 0.150 in. per mm (10, 12). Therefore, compressive deformation rates of 67065 and 0.150 in. per min were used at test temperatures of 55 F and 73 F, respectively.
4. Evaluation of Test Data Tensile-strength and E-modulus data were obtained
for dry and vacuum-saturated cores, and for dry, vacuum-saturated, and vacuum-saturated plus addition-ally moisture-conditioned laboratory specimens for all pavements. Cores from Category 3 pavements (new pavements with potential for moisture damage) were subjected to both vacuum saturation and additional conditionings before testing. Each test condition is represented by no fewer than four samples, either cores or laboratory specimens as the case may be, and reported data are averages for the number of tests (usually four) conducted.
A study of the variability of tensile-strength and E-modulus data obtained in the second phase of the project showed variability to be somewhat depend-ent on tensile property measured, on test temperatures, and on whether or not the tests were made on pavement cores or laboratory specimens. Over-all average co-efficients of variation, Cv, in percent, were found to be as follows:
Tensile Strength - For both cores and speci-mens: T = 55 F, Cv = 8.3%; T = 73 F, Cv = 15.8 % F- Modulus - T = 55 F, Cv = 22.5% for cores, and Cv = 16.0% for specimens; T = 73 F, Cv = 26.7% for cores and Cv = 18.0% for specimens.
These data show less variability in the results of tests at 55 F as compared with 73 F, less varia-bility in the tensile strength determinations as compared with the E-modulus determinations, and less variability [or the laboratory specimens as compared with the pavement cores.
Visual tests employing photographs obtained under scanning electron microscopy (STi) and low-power microscopy also were used to compare moisture damage in pavement cores to that produced in laboratory specimens. During the first phase of the project, S1l was used for each pavement core set and each laboratory-conditioned specimen set to determine closeness of matching moisture damage. Kinds of things observed were those that can be detected by a trained surface morphologist. Among the observations were the consistency and flow of asphalt, the surface at the asphalt-aggregate interface, the coatings on the aggregate surfaces, and the amounts and types of aggregate debonded. This microstructure technique was used on fractured core faces and specimen interi-or faces produced by the indirect tension test. The technique produced information supplementary to moisture damage matching data from the indirect tension test, and assisted in selection of the most promising laboratory accelerated-moisture-condition-ing methods. During the second phase of the project, Sf was generally discontinued, and 2x photographs were taken to record the match between pavement cores and the laboratory specimens that had undergone accelerated moisture conditionings of thermal cycle and freeze plus soak.
RESULTS
The first portion of this section sunmiarizes the results of the split tensile-strength tests performed on the pavement cores and laboratory specimens in the search for a means to predict the susceptibility of asphaltic concrete to moisture damage. Influences exerted by various moisture-conditioning processes applied to the cores and specimens before strength determination are examined. Possible use of the mechanical test data to assess the rate at which moisture damage will take place is also reported. The results of a microstnictural examination of cores

10
Severe ModaratR Pavement Pavement Good
200 Damage Damage Condition
iSO PAVEMENT
140 CORES
140
120
100
$0
SO
40.
20.
AZ-i(W) MT-i - TX-1. OR-i VA-2 AZ-2(E) CA-2
TEST CONDITION
Figure 3. Representative Tensile Strengths for Pavement Cores.
Severe Moderate
TX-i MT-i 0$-1 CA-a
TEST CONDITION
Figure 4. Representative FI-Moduli for Pavement Cores.
C C
p. 4
00 0. 0 0 0 I-.
Cl) D
0 0
'U
'U -1
U) z 'U 5—
and laboratory specimens following testing, to deter-mine whether characteristics that can aid in estab-lishing the susceptibility of mixes to moisture damage are identifiable, are discussed. The final portion of the section is a sminnary of the principal findings of the project.
1. Representation of General Mechanical Properties Cores and laboratory specimens were moisture
conditioned before the determination of structural strengths on the theory that those mixes most susceptible to moisture damage would have the lowest structural strengths following conditioning. All of the moisture-conditioning processes examined in the study produced moisture damage in the cores and laboratory specimens. Vacuum saturation without further conditioning was found to produce a struc-tural condition in cores that seemed to be reasonably equivalent to the condition of the pavements from which they were lifted. With respect to the lab-oratory specimens, vacuum saturation alone was found not to reduce structural strength to the extent that it did in the cores. Simple soaking at elevated temperatures following vacuum saturation produced erratic results and poor microstructure matching. A water suction process following vacuum saturation was discontinued after it was found that water could not be pulled well enough through some of the Category 1 specimens that swelled after vacuum saturation. An 18-cycle, 40-120-40 F conditioning process applied following vacuum saturation of laboratory specimens was discontinued when it was found not to produce sufficient damage to match core damage from vacuum saturation alone. Repeated toad tests gave over-all erratic results for mechanical and microstructure
matching, and did not rank the pavements well within the scope of the triaxial test variables employed. Also, the results were found to be sensitive to presoak temperature and time. Limitations of the project time schedule and the implied practicability of other conditioning processes led to a decision not to proceed with the extensive basic research that seemed to be needed to learn more fully the effects of repeated-load variables in creating moisture damage.
Of the several conditioning processes applied in the first phase of the project to laboratory speci-mens following vacuum saturation, an 18-cycle, freeze-thaw (0-120-0 F) conditioning produced the most nearly satisfactory matchings of structural strength and microstructure with those of companion cores. It alone among the conditioning processes investigated in the early part of the study was continued in the second phase. To it was added, after some additional study, a freeze (0 F) plus soak (140 F) accelerated conditioning process that showed some promise. The practicability of its short conditioning period and the low cost of the equipment needed for its use gave special encouragement to its inclusion in the second phase of the study.
Additional details of the developmental work with conditioning processes are included in Appendix A. Essential test data are included in Appendix C.
The structural properties of all cores and lab-oratory specimens were assessed in the tensile mode, in which split-tensile strengths and E-moduli were determined as previously described. Dry cores, as well as moisture-conditioned cores and laboratory specimens were tested. Tests were made at 55 F and 73 F.

II
Severe Moderate Pavement Pavement Good
200.1 Damage Damage i Condition
1901 LABORATORY
SPECIMENS
C I C I ,. 1401 N a. I-C, z U W. - U)
'U —1
U) z 'U I-.
9001 I POOR MODERATE GOOD
— uuv
LABORATORY 700.
SPECIMENS
0 0
500
Co —I
400
0 300
'U Ui 20O
100
L!J 11 3.83 4. _ AZ.-I(W) MT-I TX-I OR-I VA-2 *2-2(E) CA-2
TEST CONDITION
Figure 5. Representative Tensile Strengths for Laboratory Specimens
The bar graphs of Figures 3 and 4 show typical magnitudes of tensile strength and E-modulus for cores tested under dry and vacuum-saturated conditions. Severely damaged, moderately damaged, and relatively undamaged pavements are represented by the cores. A tendency is noted for the damaged pavements to be represented by cores having the lower tensile strengths and E-moduli when tested in the vacuum-saturated state. It is evident that severe damage is associated with the lowest values of tensile strength and E-modulus; however, the relationship is not total-ly definitive through the entire range of pavement condition. It is also evident that damaged pavements are likely to be represented by cores that show relatively large drops in strength between the dry and vacuum-saturated states. Vacuum saturation evi-dently had little effect on the strength of cores taken from pavements that were in good condition. The strength of cores tested in the dry state provided no reliable indication of moisture suscep-tibility. An additional observation is that each set of cores has a unique set of tensile-strength and E-modulus values.
A general representation of the laboratory speci-mens for which tensile strength and E-modulus were determined dry, vacuum saturated, and vacuum satu-rated with an additional treatment of 18 cycles between 0-120-0 F, is shown in Figures 5 and 6. Severely damaged, moderately damaged, and relatively undamaged pavements are represented by the specimens. Pavements represented by cores in Figures 3 and 4 also are represented by laboratory specimens in Figures 5 and 6. The relationships that are evident between pavement condition and the strength proper-
Dvi g g
TX-I NT-i OR-i CA-2
TEST CONDITION
Figure 6. Representative PI-Moduli for Laboratory Specimens
ties of cores in Figures 3 and 4 are also evident for the laboratory specimens in Figures 5 and 6. It can be seen also in Figures 5 and 6 that the thermal cycling process applied to the laboratory specimens following vacuum saturation generally caused further reductions in tensile strength and E-modulus. Neither vacuum saturation nor vacuum saturation plus thermal cycling had much influence in reducing the strengths of laboratory specimens fabricated from materials representing those of pavements not suf-fering moisture damage.
A general comparison of the magnitudes of tensile strength at 55 F for laboratory specimens represent-ing all pavements of Categories 1 and 2 is shown in in Figure 7. A similar comparison of the available E-modulus values is shown in Figure 8. The decrease in the magnitudes of the values in Figures 7 and 8 as moisture-conditioning severity increases (dry to vacuum saturation to vacuum saturation plus thermal cycling) indicates that a trend in moisture-damage grouping may exist, although its exact nature is not discernible. The laboratory specimens representing pavement AZ-1 (W) showed an especially large strength decrease. This pavement was very sensitive to mois-ture, and showed damage soon after it was placed.
2. Renresentations of Moisture-Damage Magnitude and Rate A comparison of the tensile-strength and E-
modulus values for the dried and vacuum-saturated cores (Figs.3 and 4) with those for the dried and vacuum-saturated 'laboratory specimens (Figs. 5 and 6) shows that the values for the cores are, in general, higher. One possible explanation is that asphalt

M0
331
100
0 0
LABOR ATOI TEST TEMI
150
IMENS
DRY VACUUM &so. o DRY VACUUM 0-120-0 SATURATED 18 CYCLES
SATURATED TR CYCLES
LABORATORY TEST CONDITION
LABORATORY TEST CONDITION
Figure 7. Tensile Strength vs Conditioning for Figure 8. E-Modulus vs Conditioning for All All Laboratory Specimens at 55 F. Laboratory Specimens at 55 F.
TABLE 2
TEST DATA FOR ABSON-RECOVERED ASPHALT FROM CORES AND SPECIMENS
Pavement, Identi-
fication Core or Lab Spec.
Dry Tensile Strength at 55 F
(psi) A.C. (%)
S.P. R.B. (OF)
K.V. 275 F. cSt.
Pen. 77 F
Ash Content (%)
CA-2 Lab spec. 67 4.9 128 406 73 0.28 CA-2 Core 102 5.0 139 643 40 0.15 NB-i Lab spec. 72 5.4 130 374 62 0.25 NB-1 Core 89 5.5 141 658 29 0.31 NJ-2 Lab spec. 71 5.3 128 389 73 2.15 NJ-2 Core 114 5.6 145 743 27 1.24 OR-i Lab spec. 120 5.8 128 260 54 0.58 OR-i Core 100 6.0 138 414 26 0.05
age-hardening in the several-year-old pavements has been a stiffening factor not equalled in the labora-tory-prepared mixtures not exposed to long-term aging.
Table 2 gives penetration, softening point, and kinematic viscosity data for asphalts extracted from cores and laboratory specimens representing four pavements typical of those sampled. In every case the data show harder or stiffer asphalt in the cores. Using these data, mixture stiffnesses were estimated from Heukelom's charts (18); in every case the appar-. ent stiffness of the cores was indicated to be at least twice that of laboratory specimens.
In an effort to reduce the possible influence of asphalt stiffness on comparisons of core and labora-tory-specimen strength test results, an analysis was made based on ratios of the strengths of moisture-conditioned cores and specimens to the strengths of moisture-conditioned cores and specimens to the
strengths of companion dry cores and specimens. The normalization technique involved calculation of a tensile-strength ratio (TSR) and an E-modulus ratio CE-mod R) for the cores and laboratory specimens of each of the pavements represented. The ratios rep-resent the fraction of the dry mechanical property that has been retained after application of vacuum saturation and further moisture conditioning.
TSR's are shown in Figure 9 for laboratory specimens representing all Category 1 and Category 2 pavements. E-mod R's are shown in Figure 10, but only for laboratory specimens representing second-phase pavements to which B-modulus determinations were limited. In general, but not with total con-sistency, lower values of TSR and of B-mod R are associated with pavements reported to be in a damaged condition (Category 2). It appears that either a TSR or an B-mod R value of about 0.7, as determined

B
DRY VACUUM o-1,e 0
SATURATED 18 CYCLES
LABORATORY TEST CONDITION
SATURATED 18 CYCLES
LABORATORY TEST CONDITION
Figure 9. Tensile-Strength Ratio Changes for All Laboratory Specimens at 55 F.
for specimens subjected to vacuum saturation followed by the thermal-cycling process that was used, in most instances provides a separation point between specimens from damaged and undamaged pavements, with those from the damaged pavements showing the lower values. It is possible that the division would have been even sharper if the selection of damaged pave-ments to be included in the study could have been made with greater assurance that the observed damage was indeed traceable to the presence of moisture. If this ratio based on tests of laboratory specimens were to be accepted as a criterion for judging whether or not mixtures would be susceptible to moisture damage, the prediction would be accurate in about 80 percent of the cases for this particular set of data. In the few circumstances where the prediction would be in error, both mixtures that were predicted to serve satisfactorily would suffer moisture damage, and mixtures predicted to experience damage would serve satisfactorily. Conservatively, some overprediction (prediction that moisture damage will occur when it will not) is better than under-prediction. However, excessive overprediction is not practical.
The rate at which moisture damage advances in pavements, in addition to the amount of damage that ultimately occurs, is of interest. A pavement that does not begin to show a high progression of damage until the later years of its useful life may have a better record of over-all performance than a pave-ment that does not show as much damage at the end of the same life period, but which experiences a rapid progression of damage in its early years. There is no reason to expect damage always to progress at a uniform rate.
The determination of TSR and E-mod R values for laboratory specimens at the intermediate condition of vacuum saturation, as well as after additional conditioning has been applied, appears to hold some promise for examining the rate of damage progression. Reference is made to Figures 9 and 10 in this regard.
Also, because vacuum saturation alone is not an extremely severe debilitating process, its applica-tion may assist in identifying mixtures especially susceptible to damage. Mixture AZ-l(W) in Figure 9 offers an example. During construction of this pavement some portions had to be replaced after a sudden rainstorm during the paving period, indicating a high moisture damage rate for this mix. The same
Figure 10. S-Modulus Ratio Changes for All Laboratory Specimens at 55 F.
mix, however, with the aggregate treated in a lime slurry (AZ-2(E)) performed much better in the field and had a negligible rate of moisture damage. In fact, the TSR increased slightly after vacuum saturation.
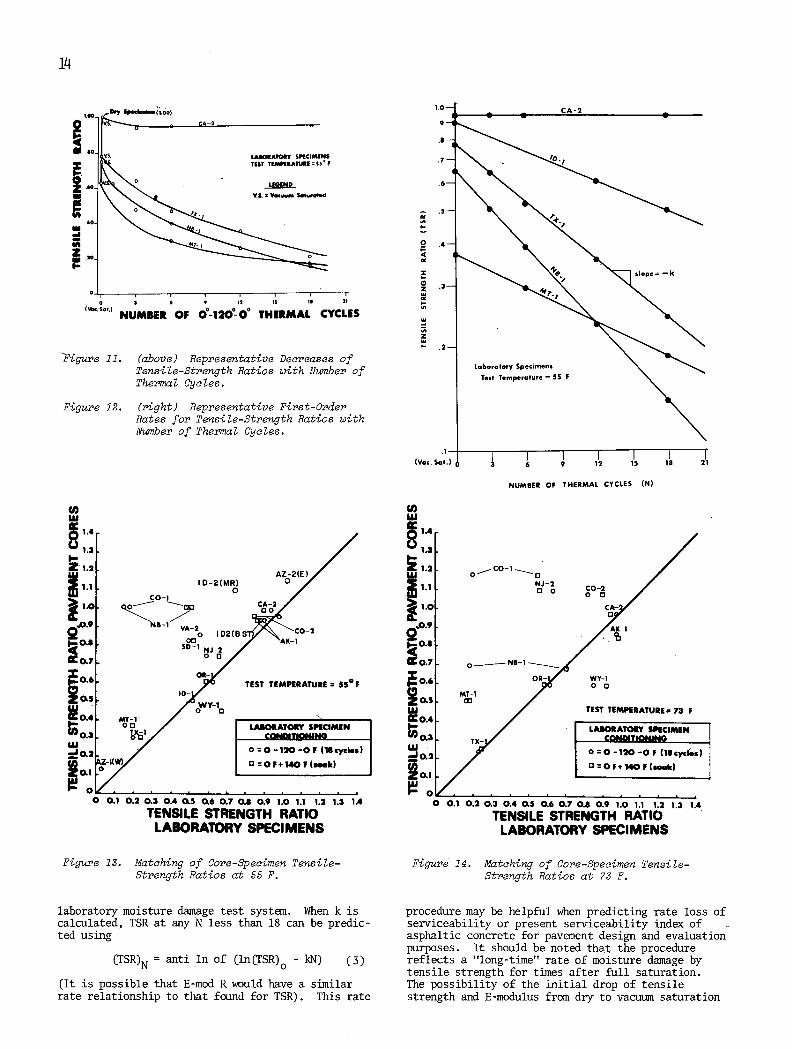
Changes of the laboratory specimen TSR's between vacuum saturation and 18 thermal cycles are shown in Figures 11 and 12 for thermal-cycled specimens for which these data were obtained at discrete thermal cycles. Here, at a test temperature of 55 F, the TSR's decrease at an exponential rate similar to first-order chemical reaction rate relationships. A higher rate is achieved in the first nine cycles than is achieved in the second nine cycles. Similar trends were found at a 73 F test temperature.
In Figure 12, the data from Figure 11, plus the ID-1 data from the first phase of the project, are plotted in a first-order rate relationship (In TSR vs N). The straight-line plots for the different mixes imply a rate relationship of the following:
(TSR)N = (TSR)0 e (1)
in which
(TSR)N = TSR at N thermal cycles, 0<N<18;
(TSR)0 = TSR at vacuum saturation (intercept of the straight lines); and
k = rate of change of In TSR with N (slopes of the straight lines).
By taking natural logs of both sides of the equation, the rate, k, for a mix can be predicted by
ln(TSR)0 - in (TSR)18 (2)
18
in which
(TSR)18 = TSR at 18 thermal cycles.
(TSR)0 and (TSR)18 can be determined using the
NUMBER OF THERMAL CYCLES (N)
0___ NJ-2 Do 01
NE-i
WY-i 00
0
4
I 0 z
(Vo.o. S
MT-i 0.5CM
Figure 14. Matching of Core-Specimen Tensile-Strength Ratios at 73 F.
w TEST TEMPERATURE 73 F 0.4 /
/ LAIORATOIY SPECIMEN 0.3 TX- / CCNTIONIW0
0 01200F(18cychs)
/ Zol
0 0.1 0.2 0.3 0.4 0.5 06 0.7 08 0.9 1.0 1.1 1.2 1.3 1.4
TENSILE STRENGTH RATIO LABORATORY SPECIMENS
114
100
00
CA-2 0 0
LAJOBATOY SPECIMONI TEST TEMPERATUBE 55 I
L000ND
20
0 3 6 1 12 II II 2!
NUMUR OF O012O0O0 THERMAL CYCLES
Figure 11. (above) Representative Decreases of Tensile-Strength Ratios with Number of Thermal Cycles.
Figure 12. (right) Representative First-Order Rates for Tensile-Strength Ratios with Number of Thermal Cycles.
U) uJ
1.4 11.3
Z1.2 Az-a(E)
1.1 ID-2(MR) 0 0
co-i
1.0 130 CA2 00
VA-2
Q .9
0 1D2(BS 00 AK-i
NJ-2
07 0 0
0.6 TEST TEMPERATURE = 55°F
O.S.ID-
0.4 MT-i
00 LABORATORY SPECIMEN
0.3 I C0TIOIlIN0 I UJ I 00-120-0F(IEcycI.$) I
Z-I(W) I 13 OF+140,(k) Z0.1 ° I I
. 0 0.1 0.2 0.3 0.4 0.5 0.6 0.7 0.8 0.9 1.0 1.1 1.2 1.3 1.4
TENSILE STRENGTH RATIO LABORATORY SPECIMENS
Figure 13. Matching of Core-Specimen Tensile-Strength Ratios at 55 F.
laboratory moisture damage test system. When k is calculated, TSR at any N less than 18 can be predic-ted using
(TSR)N = anti in of C1n(I'SR)0 - kN) (3)
(It is possible that E-mod R would have a similar rate relationship to that found for TSR). This rate
procedure may be helpful when predicting rate loss of serviceability or present serviceability index of asphaltic concrete for pavement design and evaluation purposes. It should be noted that the procedure reflects a "long-time" rate of moisture damage by tensile strength for times after full saturation. The possibility of the initial drop of tensile strength and E-modulus from dry to vacuum saturation

15
C,) Cl)
1.4-. CO-2 Ul1.4
8 1.3
§ 1.3
AK-i 0 0
_ 1-2
w 1.1 0 NB-i AK-i Z
1 0 CA-2 W 11 NJ-2 CO-2
CD CD
0.9 CO-1 0 0
0 CA-2 o..
os - 0- CO- i 000
NJ-
0
06 NI-i WY-i 0 OR-i 0.7
CC 00 TEST TEMPERATURE = 55 F
0.6 TEST TEMPERATURE = 73 F wy-i 00 __ ___ O.S.
I LABORATORY SPECIMEN I o.s -
0.4 TX-i
CONDITIONING o. - OR 1 [ LABORATORY SPECIMEN
0 0 I CONDITIONING /\ 0 =0-120-OF (iEcycI.$) ____________________
0.3 80_ 0 0 OF + 140 F (soak) 0.3 Mi 0 -120-0 F (18 cYcI.$)j MT-i 00
0.2. 0.2. I
0 OF+140F(5Oak)
W 0.1 0.1 00
0 0.10.20.3O.40.50.60.70.$0.91.01.1 1.2 1.3 1.4 0
0 0.1 0.2 0.3 0.4 0.5 04 0.7 0.8 0.9 1.0 1.1 1.2 1.3 1.4 E - MODULUS RATIO, LABORATORY SPECIMENS
E -MODULUS RATIO, LABORATORY SPECIMENS
Figure 15. Matching of Core-Specimen E-Modulus Ratios at 55 F.
was discussed previously as an indicator of damage rate.
In the project there was an over-all absence of field data on rate of moisture damage. It was un-possible to correlate numbers of thennal cycles speci-fically with field time (pavement age). These cor-relations need to be done through a controlled field evaluation study for N to have practical meaning.
3. Core-Laboratory Specimen Matching Results Matching of moisture damage of pavement cores
with moisture damage of conditioned laboratory speci-mens was accomplished by TSR, E-mod R, and micro-structure. The ratios for cores were calculated using dry and vacuum-saturated properties per pave-ment. The ratios for the laboratory specimens were calculated from the mechanical properties at dry, vacuum saturation, and vacuum saturation plus thermal-cycle and freeze-plus-soak conditions. Mechanical tests were made at 55 F and 73 F. The 73 F test temperature and freeze-plus-soak conditioning were used only in the second phase of the project.
a. Mechanical Test Matching Using TSR and B-Mod R Comparisons of the average TSR's for cores and
companion laboratory specimens are shown in Figures 13 and 14. E-mod R comparisons are shown in Figures 15 and 16. It will be recalled that the ratios were sele6ted for study in an attempt at normalization. A 45 diagonal line of equality is shown in each of the figures. Perfect matches between cores and com-panion laboratory specimens will fall on this line. It will be noted that, with a few exceptions such as the CO-1 and NB-i representatives, the matching be-tween conditioned laboratory specimens and companion cores is fairly close. It will be noted in all four figures that the plotted points in most instances fall above the line of equality. This indicates that the conditioning processes applied to the laboratory specimens generally caused a greater loss of strength than did the vacuum saturation alone applied to the cores.
Figure 16. Matching of Core-Specimen E-Modulus Ratios at 73 F.
The freeze-plus-soak conditioning was slightly less severe, over-all, than the thermal-cycle condi-tioning. Also, the freeze-plus-soak data are, on the average, a little closer to the line of equality. Although some differences will be seen to exist, visual examination of the data plots suggests that the two laboratory-specimen conditioning processes produced generally equivalent matchings with vacuum-saturated pavement cores.
Linear regression was used on the data in Figures 13 through 16 for TSR and E-mod R, for test tempera-tures of 55 F and 73 F, and for the thermal-cycle and freeze-plus-soak conditionings. The regression lines are shown in Figures 17 through 20. Regression lines that do not include the two poorest specimen-core matches, NB-i and CO-i, are also shown. The regression lines are referencedto the line of equality. As was to be expected, all regression lines are to the left of this line.
Some of the regression lines slope to the line of equality at high TSR's and E-mod R's. Over-all, the free-plus-soak conditioning gave a closer match than the thermal-cycle conditioning. (Leaving out NB-i and CO-1 matches shows an even closer match.) In addition, the test temperature of 55 F provided closer matches than testing at 73 F.
The best over-all match for laboratory specimens appears in Figure 19 (line 2a) at a test temperature of 55 F using E-mod R's after accelerated moisture conditioning of freeze (0 F) plus soak (140 F). The core E-mod R's are about 1.15 greater than the lab-oratory specimen E-mod R's. Figure 15 shows that this best match includes moisture-damage underpre-diction for WY-i and Mr-i pavements.
The second best over-all match occurred in Figure 17 (line 2a) at test temperatures of 55 F using TSR after freeze-plus-soak. The core TSR's are about 1.5 greater than the specimen TSR's.
Experience on the project suggests that if the laboratory specimens (or mixtures) had been seasoned further in the laboratory before testing to provide aging closer to that which had occurred in the pave-ment cores, .a better over-all match would have occurred.

16
U) U) LU LU 1.4 lz
8 1.3 1.3
I.-
Z 1.2 Z 1.2 LU LU
1.1 1.1
LU
1.0 1.0
,.09 0.9
0.7 TEST TEMPERATURE = 55 F 0.8
TEST TEMPERATURE 73 F 0.7
ZOS lb 0-120 -0 F (18 cycle. .1 Z0.s lb 0-120 -0 F (18 cycles), V'0 I
0.6 I REGRESSION LINE IDENTIFICATION o. -
j
REGRESSION LINE IDENTIFICATION 1
w NB a COt CVSIflSfltS LU '' NB & COt pavements
- 10 0-120 -OF(1ScycI.$) .p la 0-120 -OF(l8cycIes) I
0.4 z 2a: 0F+140F (soak) 0.4 2a 0F+140F (soak)
0.3 2b: 0 F + 140 F (soak), ___ . 2 b: 0 F + 140 F (soak), W'O LU
// NB a CO1 pav.m.nts Cl) 0.3__v
O.2 LU NB & C01 Pavements ___________________
0.2 -i
ZO.1 Zo.1
0 LU
0 0.1 0.2 0.3 0.4 0.5 0.6 0.7 0.8 0.9 1.0 1.1 1.2 1.3 1.4 0 0.1 0.2 0.3 0.4 05 0.6 0.7 0.8 0.9 1.0 1.1 1.2 1.3 1.4 TENSILE STRENGTH RATIO TENSILE STRENGTH RATIO
LABORATORY SPECIMENS LABORATORY SPECIMENS
Figure 17. Linear Regression Lines for Tensile- Figure 18. Linear Regression Lines for Tensile- Strength Ratio Matching at 55 F. Strength Ratio Matching at 73 F.
Cl) (A
LU 1.4 LUCc
1.4
8 1.3
1.2 . 1.2 2 2
LUll W1.1
LU
1.0 11
0.9 0.9 IL 0 0.8
I- 0.7 0.7
0.6 TEST TEMPERATURE =55 F 0.4 TEST TEMPERATURE = 73 F
la 0-120 -OF(l8cycI.$) 0.5 ,'""
REGRESSION LINE IDENTIFICATION 0.5 I REGRESSION LINE IDENTIFICATION
0.3 I lb O-120-0F(18cycIe.),VV
/ NB & COi pavements
I I 0.2 2b: OF+)40F (soak),
LU
2a OF +140 F (soak) 0.3
L
NB & Colpavem.nts 2b 0F+140F (soak),
0.4 / lb 0- 120 -0 F (18 cycles), VO 0.4 /
la: 0-120 -0 F (18 cycl.$)
2a: 0F+140F (soak)
all0.1
NB&C01pavements I NB&C01 pavem.nts
LU 0.1
0 . 0 0.1 0.2 0.3 0.4 0.5 0.6 0.7 08 0.9 1.0 1.1 1.2 1.3 1.4 0 0.1 0.2 0.3 0.4 0.8 0.6 0.7 0.8 0.9 1.0 1.1 1.2 1.3 1.4 E -MODULUS RATIO, LABORATORY SPECIMENS E - MODULUS RATIO, LABORATORY SPECIMENS
Figure 19. Linear Regression Lines for E-Modulus Figure 20. Linear Regression Lines for F-Modulus Ratio Matching at 55 F. Ratio Matching at 73 F.
-
b. Microstructure Matching The microstructures of cores and laboratory
specimens were examined in detail by scaiming elec-tron microscopy (SEM) to determine possible relation--ships with tensile-strength data. Observations were made on the fractures faces that resulted from tensile testing as soon as possible after the individual tensile testg were completed. Structures were observed at up to more than 2,000x magnification. Details of the microscopic examinations, including a number of typical photomicrographs, are presented in Appendix D.
Microstructure (particularly the characteristics of the asphalt phase, aggregate surfaces, and asphalt-aggregate interfaces) showed a progressive change with increasing water content. Therefore, it was important to maintain either dry or fully saturated conditions not only during mechanical testing but also during microstructure matching.
Microstructural studies in the first phase of the project showed that thermal-cycle conditioning of laboratory specimens followed by indirect tension testing at 55 F produced microstructures sufficiently similar to those of the corresponding pavement cores

.17
Pavement.Matching For ?X1 a 55 F Piüure 22. Visual Pavement Matching for NB-] at 55 F Too: Saturated Pavement core (2 x). Top: Saturated Pavement Core (2 x). Middle: Thermal-Cycled Laboratory Middle: Thermal-Cycled Laboratory
Specimen (2 x). Specimen (2 x). Bottom: Freese-plus--Soak Laboratory Bottom: Freeze-plus-Soak Laboratory
Specimen (2 x). Specimen (2 s).
to allow a close rating of the moisture damage. Microstructure matching results were not as good, over-all, with the other types of moisture condition-ings used in the first phase.
The simple addition of water to laboratory speci-mens by vacuum saturation did not produce microstruc-tures similar to those of the pavement cores, but subsequent thermal cycling of the saturated speci-mens resulted in a much closer match. If the thermal cycling was limited to the range of 40 F to 120 F, the order of pavement ranking was the same as that which resulted from the 0 - 120 F thermal cycling, but the distinction between good and bad was found to be much lower. A simple soak at 120 F reversed some test values and rankings. Microstructure of the asphalt-aggregate bonding showed reasonable correlation with the associated tensile strengths previously described, but plastic asphalt was more frequently observed, even in bad-performance mixtures, than actually occurred in the pavement cores.
Laboratory tests using load cycling instead of thermal cycling produced poorer microstructure correlations. Microstructure studies showed much less "stripping" of asphalt from aggregate surfaces to result from load cycling alone. Instead, asphalt-covered aggregate particles became less firmly bonded to the asphalt matrix, and the resulting open interfaces were not greatly changed by drying the material. Long-tenn vacuum saturation before load cycling, or sequential load and thermal cycling treatments, produced inicrostructures similar to those produced by thermal cycling alone.
Only a brief SEM study was conducted in the second phase of the project. Interpretation was difficult because both of the moisture-conditioning methods applied and the two test temperatures used in the second phase produced similar results for comparing laboratory specimens with vacuum - saturated pavement cores on an aggregate "particle-by-particle" basis. However, a distinction was made by SEM in the average extent of stripped and debonded aggregate, and this could be related to low-magnification observations. Microstructure observations showed that change in test temperature usually introduced greater differ-ences than change in moisture-conditioning.
Typical photographs of 2x magnification are shown in Figures 21 through 23 for TX-i, NB-1, and CA-1 mixes. The figures show that a reasonably good visual match between vacuum- saturated cores and lab-oratory specimens was accomplished by applying thermal-cycle and freeze-plus-soak conditionings to the laboratory specimens. For the NB-1 mix, Figure 22 shows a poorer match where both of the moisture conditionings produced more uniform moisture damage than that typically occurring in the cores.
Microstructural comparative observations by low-power microscopy and direct examination for the second-phase pavements of Categories 1, 2, and 3 are sizimiarized in Table 3. The best and second-best matches are listed. The four conditioning-test temperature combinations frequently produced very similar microstructures, and the laboratory speci-men match with the pavement cores is generally good over-all by comparison. Usually, however, the best

lABIAl 3
MICI1CSTISICIIfllJl-VISUIJ. BIAIQIES FOR SF035 }IIXS5 PA532IINF EVAWAFICJN
Accelerated laboratory Ibisture Condition
Core 55 F 73 F Pavonent rest rhndbo1 Trceze TRennal Fre3
ldeniifi ion lnsy. css fr JlIus &,aS Cycle - plus lb,)
OR-I 55 F Rest 2nd Best -- - OR-I 73 F Rest 2nd Best -. -
SD- I 55 F - - Best -- 2nd Best SD-I 73 F -- Rust 2nd Best
tr-i 55 F - - Re-.t 2nd Best sIr-i 73 F - - -- Best 2nd Best
TX- I 55 F Best 2nd Best IX- I 73 F Best 2nd Best - - -
Co-i SI F - - - - --' n-J he-I UI- I 73 F - - - - Re-t 2nd lIsZt
WY-I 55 F Best -- 2nd Ry--t - - - WY - i 73 F Best -. 2nd ne-a - --
NB-I 55 F Best -- 2nd Best NB-i 73 F Best 2nd Best - - - -
All-i IS F 2nd Best Best - - AX-i 73 F - - - - 2nd Best Best
55 F 2nd Best Best -- 73r 2ndik-t ilet -
CA- 2 55 F Best 2nd Best - - - - - 05-2 73 F -- 2nd Best Rest
(:0-2 55 F -- - - Rest 2nd Best 03-2 73 F - - - - 1nI Best Best
UI-A 55 I- 202 tb-st - - Best - - - CII 3 73 F 2nd Be., t he - -.
IX 7 Bust 2nd lI.t F 2nd Best
IN
Fiaure 23. VisuaL Pavement Matching for CJ1-2 at 55 F f: Saturated Pavement core (2 x). Middle: Thermal-Cycled Laboratory
Specimen (2 .z). Bottom: Freeze-plus-Soak raboratory
Specimen (2 x)
match occurred at the 55 F test temperature and thermal -cycle conditioning combination.
4. Stsiunary Results of indirect-tensile tests of cores from
19 asphaltic concrete pavements, and of laboratory specimens fabricated from the same mixtures, showed a wide range of split-tensile strength and E-modulus values for samples tested in the dry, vacuum-saturated, and vacuum-saturated and additionally moisture-conditioned states.
The split-tensile strengths and E-moduli of vacu-saturated pavement cores, and perhaps to a greater extent the ratio of these values to similarly determined values for companion cores tested in a dry state (TSR's and fl-mod R's), offered a fairly reliable indication of the propensity of the pavements from which they were lifted to experience moisture damage. Those cores exhibiting relatively low values of tensile strength and E-modulus in the vacuum-saturated state, and relatively low TSR's and fl-mod R's compared with the results for companion cores tested in the dry state, most consnonly came from pavements susceptible to moisture damage. Cores associated with undamaged pavements usually showed higher strengths and strength ratios.
Companion laboratory specimens, fabricated from the same materials contained in the cores and compacted to approximately the same densities, showed tensile strengths and E-moduli very similar to those exhibited by vacuum-saturated cores when the labora-tory specimens were suhj ected to certain additional conditionings following vacuum saturation. Ratios of
the tensile strengths and E-moduli of the conditioned specimens to those for specimens tested in the dry state also were similar to the same ratios for the cores. The additional conditionings consisted of 18 cycles of freeze-thaw (0-120-0 F), and of freeze-plus-soak (0-140 F). On an over-all basis, both of the added treatments produced somewhat lower tensile strengths and E-moduli (and ratios) for the laboratory specimens. Of the two, the freeze-plus-soak condi-tioning was the less severe. The E-modulus ratio seemed to describe damage more closely than the tensile-strength ratio, although E-modulus ratios were marked by greater variation.
Strength determinations for the laboratory specimens at the intermediate condition of vacuum saturation, in addition to determinations at the dry state and following thermal or freeze-plus-soak con-ditioning, appeared to offer some promise for examin-ing the rate at which damage progresses.
Moisture-damage matching was achieved qua1Tatively by examination of core and laboratory-specimen interiors using scanning electron micros-copy and low-power microscopy. Micrographs and low-power photographs were helpful for comparative examination and illustration of the types of moisture damage that occurred. Microstructure matching showed the vacuum-saturation plus thermal-cycling treatment of laboratory specimens to produce structural condi-tions most nearly similar to those of vacuum-saturated cores.
Tests and microstructure observations at a temperature of 55 F produced generally better matching results than tests and observations at 73 F.

GIAPTER THREE
INTERPRETATION, APPRAISAL, AND APPLICATION
19
The stated objcctivc of the research described herein was to develop a practical laboratory test system for quantitatively predicting the ability of an asphaltic concrete to resist the detrimental effects of moisture under field conditions. This obj ective has been met to the xtent that what appears to be a practical system that can identify in a majority of instances those mixtures susceptible to moisture damage has been developed. Seventeen pave-ments of ages 2 to 12 years, 10 reported to show moisture damage and 7 reported to be undamaged, were represented in the study. Application of the system without further development could lead to a few rejections of acceptable mixtures, and to a few acceptances of inferior mixtures. Although trends in the results achieved suggest that quantitative predictions of moisture damage may some day be pos-sible, this degree of precision was not achieved in the project. Pavements selected for study as experiencing moisture damage were chosen on the basis of visual signs (mostly severe raveling) usually associated with moisture damage. In one or two in-stances test results suggested that moisture may not have been a prime cause of deficient performance. If this were proven to be true, the relationships developed on the project would be even better than reported.
Because the pavements under study had been in service for several years before the project started, a probability exists that the materials acquired for use in the laboratory tests that were intended to reproduce field conditions may not always have been as representative as desirable. This is particularly true of the asphalts. This qualification must be recognized in interpreting the project results.
PAVEMENT MOISTURE DAMAGE
It is to be expected that any asphaltic concrete pavement section extending over several miles will have some variations in void and asphalt contents, and in moisture content, even though the mixing for-mula and ingredients remain unchanged. Because of these variations, variations in the extent of mois-ture damage that takes place in susceptible pavement of any one construction section are to be expected. Investigation of this subject was not within the scope of the present project. The application of the laboratory predictive data, therefore, needs to be correlated with over-all pavement performance in an averaging-weighting procedure. To do this, knowledge of the variability of moisture content and mixture properties over pavement length needs to be obtained.
The average age of the 2- to 12-year-old pave-ments in Categories 1 and 2 was about 6 years. There was an indication that the procedures employed in conditioning the cores and laboratory specimens pro-duced the best matches between cores and specimens at the 8- or 9-year pavement-age level. Refinements in the process could lead to better predictions of pavement damage at any selected age level.
A laboratory-specimen aging procedure in which the asphalt aging that takes place in pavements is more nearly reproduced in the laboratory specimens might lead to improved predictability of pavement damage. A procedure that consists of retaining com-pacted specimens in an oven at 140 F for several days before test, as suggested by Smith and Gotolski (8), might be employed. Another possibility would include the movement of an aging material in liquid
or gas form through compacted specimens. (Aging of a loose mixture probably would not be acceptable.)
MOISTURE-DAMAGE TEST SYSTEM
The proposed moisture-damage test system that resulted from this study consists of four steps:
Fabrication of laboratory specimens to dup-licate the physical properties of the compacted pavement mixture.
Vacuum saturation of two-thirds of the speci-mens, and subjection of one-half of the vacuum-saturated specimens to additional moisture condition-ing, such as freeze-plus-soak or thermal cycling.
Testing of the dry, vacuum-saturated, and the further moisture-conditioned specimens using the indirect-tension test.
Evaluation of the mechanically tested speci-mens using, for example, TSR's and E-mod R's for vacuum saturation and accelerated conditioning; assessment of rate of damage by comparing TSR's and E-mod R's at vacuum saturation with TSR's and E-mod R's after conditioning. (TSR is the ratio of the tensile strength of a conditioned specimen to the tensile strength of a companion dry specimen; E-mod R is the ratio of the E-modulus of a conditioned specimen to the E-modulus of a companion dry speci-men).
Fabrication of laboratory specimens can follow existing procedures of the individual laboratories for making specimens used to determine design asphalt content for a particular mixture. A 4-in. -diameter by 2½-in. -thick specimen was found to be suitable for moisture conditioning and indirect-tension test-ing. It was not determined, however, whether Marshall-hammer compaction, kneading compaction, or gyratory compaction is more desirable, or if they are equivalent for producing equal test response; kneading compaction was used in the project. A specimen-aging procedure could, and perhaps should, be added.
In the project, 12 specimens, each compacted to within 0.5 percent of the average voids of cores from the pavement sampled, were tested in sets of four in the split-tensile mode. One set was tested dry, one after vacuum saturation, and one after vacuum saturation and additional conditioning. More than four specimens per set may be impractical.
One of the objectives in developing the test system was to keep test equipment and procedures as conventional as possible. Equipment for vacuum saturation can be the same as used for determining the maximum specific gravity of asphaltic concrete by ASTM Method D 2041-71. For moisture conditioning by freeze-plus-soak, an ordinary freezer and a heated constant-temperature water bath are sufficient and available in most highway materials laboratories. If thermal cycling is to be used, the purchase of a timed cyclic air chamber will be necessary for many laboratories. The indirect tension test can be performed with most standard test machines that have a load output and a vertical compression-rate ad-justment. Obtaining the E-modulus will require fabri-cation of a horizontal deformation measuring device for specimens, and use of a second operator to mon-itor the deformations as a function of load and test time. Use of a modulus of resilience device with pulse loading in the linear response range would be

20
an alternative. If this alternative were selected, a method for simple prediction of linear response range for a mixture would need to be determined, and the equipment would need to be purchased, but the number of test specimens could be reduced by at least one-half (the same specimens as tested at dry condi-tion could be used for tests after moisture condition-ing). Use of a 55 F test temperature (recommended) would require a cooling constant-temperature water bath.
Freezing degree-days at the pavement locations studied did not correlate with moisture damage. However, differences in pavement age and other variables could have obscured possible relationships. Alditional field evaluation is needed to determine whether accelerated moisture conditioning should be changed, depending on climate--either freezing degree-days or the range and repetitions of cold-warn cycles. At first glance, inclusion of a freeze in the accel-erated conditioning regardless of climatic environ-ment seems difficult to justify. However, it is possible that the disturbance of the asphalt-aggregate interface by a freeze may somehow be equivalent to traffic effects, and that this disturbance can occur in nonfreezing as well as in freezing climates. This needs verification from a field evaluation study.
When assessing moisture damage, a choice need not be made between tensile strength or E-modulus. It was found that the E-modulus gave closer core-laboratory specimen matches within the scope of the test system used, but that the variability of E-modulus at 16 percent was about twice that of tensile strength at the recommended test temperature of 55 F. But because E-modulus and tensile strength were determined simultaneously during the indirect-tension test as employed in the project, both properties can be determined if both are important in assessment of mixture performance.
APPLICATION TO MIXTURE DESIGN AND SELECTION OF MATERIALS
The findings of the project that asphaltic-concrete mixes with TSR or E-mod R values lower than about 0.7 after accelerated moisture conditioning usually will experience significant moisture damage in pavements has application in the design of mixtures and the selection of materials.
Sometimes, variations in asphalt content, aggre-gate gradation, or void content probably will upgrade a mixture sufficiently to provide satisfactory ser-vice. More often, perhaps, some form of protective treatment will be needed to provide adequate serVice if materials susceptible to moisture damage are to be used. Current treatments for minimizing moisture damage in asphaltic concrete include use of any of numerous available "antistrip" additives that can be combined with the asphalt, addition of lime or port-land cement to the mixture during mixing, and coating of the aggregate surfaces with a hydrated lime slurry before drying, heating, and mixing. Varying degrees of success have been reported in the literature for all of these approaches. Evidently, what is success-ful in one application is not always successful in another.
In some instances, the most appropriate course of action will be replacement of the damage-susceptible material(s) with higher-grade material(s).
The availability of a reliable predictive moisture-damage test system has the further advantage of pro-viding a quick means for initially screening new antistripping additives placed on the market. The use of full-scale construction trials, with the ever-present potential for costly failure, can be reduced.
No doubt, the lower the TSR and E-mod R values, the greater the need for corrective action. In the case of the Arizona mixes, the mix identified as AZ-1 (W) was vastly improved by use of a hydrated lime slurry (AZ-2(E)). Similarly, a cationic asphalt additive resulted in a greatly improved mix in Alaska (AK-l). Both the AZ-1 (1) and AK-1 mixes had TSR and E-mod R values near 1.0 after moisture conditioning.
APPLICATION TO STRUCTURAL DESIGN OF PAVEMENTS
Most laboratory evaluations of the mechanical properties of asphaltic concrete pavement mixes are based on tests of the mix (or specimens) in dry condition. When moisture damage tests have been performed, the data from them have been supplemental and not generally used for design of the pavement mix for field application. Implications from this project suggest that data from the moisture-damage test system that was employed can be used to represent several of the design properties of the pavement mix.
Tensile properties are of interest in pavement design because of the pavement cracking problem. The properties of tensile strength and E-modulus were found in the project. Also obtainable are modulus of resilience and tensile failure strain. If pave-ment design is based at least partly on worst condi-tion, it would be reasonable to determine the strength properties of mixes after vacuum saturation and after accelerated moisture treatment. Most of the mixes evaluated in this project showed drops in strength after saturation and accelerated moisture condition-ing. Layered elastic methods use E-modulus for cal-culating maximum tensile strain of the asphaltic concrete, and maximum compressive strain of the sub-grade. Comparison of maximum tensile stresses in asphaltic concrete to the tensile strength of asphal-tic concrete would be of interest.
Fortunately, laboratory tests have shown that strength and E-modulus for some mixes rebound toward their higher values when drying takes place in a pavement. This suggests that annual field pavement moisture profiles could be helpful to pavement designers. Seasonal properties such as E-modulus could then be placed in numerical methods with recog-nition that E-modulus and tensile strength could be variable with seasonal moisture as well as with sea-sonal temperature. For other mixes that become increasingly and even permanently moisture damaged, an annual net decrease of E-modulus and tensile strength can be used; or, if currently used design procedures are followed,a reduction of asphaltic concrete layer structural coefficient could be em-ployed over the design period.
Fatigue analysis of asphaltic concrete specimens using the indirect tension test has not been common. However, a report on this topic by Maupin (17) points out the possibilities for correlation of fatigue life, magnitude of tensile strain, and stiffness of conventional-size specimens. Use of accelerated moisture-conditioned test specimens in a similar procedure, or even as beams in a standard fatigue procedure, could provide realistic fatigue proper-ties for pavement design.
Investigators have been establishing the appli-cability of layered elastic theory to the prediction of deflections and stresses and strains in asphaltic concrete pavements through comparisons of actual pavement responses. It is recommended that the elastic modulus and Poisson's ratio be found for vacuum-saturated and for additionally moisture-con-ditioned asphaltic concrete specimens in the labora-

21
tory if a correlation is to be made with an actual pavement that generallycontains moisture. This would be most helpful for correlation of asphaltic concrete tensile strains, which are dependent on the asphaltic concrete elastic modulus. The elastic modulus properties for some mixes tested dry in the laboratory will be higher than a moist pavement's properties. This has been recognized for soils and select granular materials, and should be recognized for asphaltic concrete as well.
MIXTUBE LIMITATIONS FOR APPLICATION OF TEST SYSTEM
The moisture-damage test system that was used was applied only to dense-graded asphaltic concrete. In the earlier Idaho study (10), information showed that the permeable voids of coiiacted mixtures must be less than about 2 percent to prevent entry of water in sufficient volume to cause significant moisture damage. It can be reasoned that an upper limit of permeable voids also exists, above which water can escape at a rate that will hold moisture damage within reasonable limits.
Accelerated moisture conditionings for laboratory specimens of open-graded mixtures could be performed either as accomplished in this project (see Appendix A), or modified by keeping the specimens immersed in water for entire times during the freeze-plus-soak and thermal-cycle conditionings. If the pavement mixture will not drain because of physical restric-tions, the latter procedure of immersion probably would be more suitable.
Dryer-drum-mixed asphaltic concrete designed as a dense-graded mixture retains some moisture at
paving and is not as dry as conventional mixtures. A "dry" base for TSR and B-mod R would have to be established by desiccating laboratory specimens made by simulated drum-mix conditions to a low moisture content "dry" equilibrium. Under a higher "equili-brium" moisture content usually expected for the field mixture after paving, TSR and B-mod R would be deter-mined to form a "moisture-damage" base referenced to \the dry condition. Thereafter, the effects of vacuum saturation and accelerated moisture condition-ings using TSR and B-mod R could be evaluated for long-term damage. Use of the dry base is a recogni-tion of the probability that pavements in dry areas will lose moisture ("equilibrium" approaches dry) during summer construction, whereas pavements being placed in wet or damp areas may not ("equilibrium" greater than dry). These latter pavements probably never reach a dry condition and will contain some "built-in" loss of tensile strength and E-modulus. On an over-all assessment of increase in moisture damage, even the dry pavements will gain moisture and the dry base appears to be a steady practical refer-ence to assess temporary (seasonal) and permanent loss of strength regardless of mix type.
This project evaluated mixes with 5/-in. maximum size aggregate. For mixes with aggregates of larger size, laboratory specimens would have to be made thicker, at least. The tensile-strength relationship takes into account specimen length or thickness; however, establishing uniform load contact may be a problem. Flat, l-in.-wide plywood strips placed between
Ispecimen and loading heads (or blocks) would
be helpful. Some increase of vacuum saturation time and soak time at test temperature may be required when applying the moisture-damage test system. Four-inch-diameter by 5-in, -thick specimens were used in portions of the earlier Idaho study (10).

PA
CHAPTER FOUR
CONCLUSIONS AND RECOMMENDED RESEARCH
The main intent of this project was to devise a predictive, practical moisture-damage test system for asphaltic concrete. The results and implications were reported in Chapters Two and Three. The labora-tory procedures followed are described in Appendix A. Details of a recommended test system for assessing the moisture susceptibility of asphaltic concrete mixtures, and of a plan for a field study to evaluate its applicability, are presented in Appendix B. The recommended field evaluation study is summarized under "Recoimnended Research" in this chapter.
CONCLUSIONS
The following major conclusions are drawn from the findings of this project:
1. An apparently workable laboratory moisture-damage test system can consist of:
Fabrication of conventional asphaltic concrete specimens to match the physical properties of mixtures in place in pave-ments. Exposure of specimens to moisture by vacuum saturation with the addition of either freeze-plus-soak or thermal-cycle moisture conditionings. Mechanical testing of dry, vacuum-satu- rated, and further moisture-conditioned specimens by indirect tension at 55 or 73 F, at specified loading rates, to obtain tensile strength and an E-modulus. Evaluation of moisture damage using ten- sile-strength and E-modulus ratios (TSR and E-mod R), for which tensile strength and E-modulus of dry specimens are the reference bases for the ratios.
2. Within the limits of the procedures investi-gated in the project, a moisture-damage test system that includes development of the E-mod R at a test temperature of 55 F (vertical deformation rate = 0.065 in. per mm), using vacuum saturation and the addition of freeze-plus-soak (0-140F) conditioning, predicts moisture-damage susceptibility most closely and with a good degree of reliability. Second closest predictions, also with a good degree of reliability, will be provided by the TSR at 55 F (vertical deformation rate = 0.065 in. per rain) using vacuum saturation and the addition of freeze-plus-soak moisture conditioning. Substitution of an 18-cycle, 0-120-0 F thermal-conditioning process for the freeze-plus-soak process will result in slightly less precision in predicting damage susceptibility. A tendency toward overprediction (predicting somewhat more damage than is likely to occur) can be expected.
3. Use of scanning electron microscopy (SEM) and low-power microscopy following application of the moisture-damage test system provides a means for dis-cerning similarities and differences between pavement cores and companion moisture-conditioned specimens. Best over-all niicrostructure matching was found by using test system variables of vacuum saturation with the addition of thermal-cycle conditioning at a test temperature of 55 F (yertical deformation rate = 0.065 in. per miii), although good matches were found with the freeze-plus-soak conditioning at 55 F as well. It was concluded from mechanical and micro-structure matching that, following vacuum saturation,
the freeze-plus-soak conditioning is not as severe, over-all, as the thermal-cycle conditioning.
Over-all results suggest that prediction precision could be improved by subjecting laboratory specimens to an aging process that will more nearly reproduce the results of field aging. In this pro-ject, the mixes were cured at 140 F for 15 hours, which resulted in specimens having recovered asphalt of lower viscosity, etc., than the recovered asphalt in pavement cores.
The moisture-damage test system that has been devised can predict the highly moisture-damaged pavements and the low or negligibly moisture-damaged pavements with a high degree of accuracy. The test system also can predict moderate moisture damage in pavements, but the closeness of the predictions varies from pavement to pavement. Generally, moder-ate to significant moisture damage can be expected to occur when specimens that undergo test by the system that has been devised show values and E-mod R values of less than 0.7.
A possibility exists for predicting an ini-tial rate of moisture damage by evaluating the TSR and E-mod R at the vacuum-saturated condition, and using the first-order rate relationship for long-term rate of damage with TSR and E-mod R at vacuum saturation and added moisture conditionings.
The moisture test system can utilize Marshall or Hreem laboratory specimens and test equipment that is available in most laboratories. Application of the system requires fabrication of 12 test speci-mens and a two-day period for moisture conditioning and mechanical test if vacuum saturation with the addition of freeze-plus-soak conditioning is used.
RECOMMENDED RESEARCH
Objective 3 of the project required development of a general plan for a field study of the moisture-damage test system evolving from the project. This study is the main point of recommended research. It should provide practical adjustments to the four steps of the moisture-damage test system with an objective of providing a methodology for reaching even closer predictions. Recommendation of test specifications could also result from the study. Details of the field evaluation study plan are given in Appendix B. The following is a summary of the main steps of the plan:
It is important that moisture-damage predic-tion be based on laboratory specimens made from materials that represent precisely the asphalt and aggregate used in the pavement to be evaluated. The present project was deficient in that original asphalt was not obtainable for the older pavements and asphalt specifications had changed since the construction of the pavements therefore, for a field evaluation study, asphalt and aggregate should be obtained at the asphalt plant during construction.
A suggested minimum of six pavements should be evaluated from time of construction or paving. Selection of two pavements in each of three differing climatic zones would be desirable. The pavements should be preselected by apparent moisture-damage severity using a moisture-damage test system devised in this project (e.g., freeze-plus-soak accelerated conditioning with TSR and E-mod R at 55 F from in-direct-tension test results).

23
Moisture and temperature monitoring immediate-ly after paving and periodically thereafter, prefer-ably by cooperating highway agencies, will be re-quired. Moisture contents would be monitored period-ically at locations directly underneath the asphaltic concrete and in the subgrade underneath and also ia,terally distant from the pavement. Pavement tem-peràtures could perhaps be monitored from weather-station temperatures. The resultant data would be used to quantify the association between climatic environment and the severity of moisture damage, and for development of a rate-of-moisture-damage predic-tion method.
In addition, pavement core sampling would be required immediately after paving and periodically thereafter. Moisture contents in the asphaltic concrete would be measured in the laboratory, and mechanical properties of the cores would be obtained in dry as well as vacuum-saturated conditions. These data would be used to determine whether:
The asphaltic concrete moisture content can be correlated with the subgrade and subbase moisture contents. The dry mechanical properties of cores remain constant or decrease with moisture damage. The mechanical properties of vacuum-saturated cores provide levels of moisture damage equivalent to the damage as predicted by the moisture-damage test system using the actual paving materials.
S. Core sampling at 4-month intervals for the first 24 months is suggested. Thereafter, core sam-pling could be done twice a year, with consideration given to season, for an additional 36 months. The total evaluation period would be 5 years.
6. Near the end of the 5-year period, the mois-ture-damage test system may have to be adjusted so that its results coincide with the observed 5-year moisture-damage trend in the pavements. Laboratory
specimen aging may need to be varied to achieve the matching; some adjustments in the moisture condition-ing additional to vacuum saturation may be needed. Changes in specimen aging and moisture conditioning should be made only after careful- evaluations of moisture content and temperature data. The objective here will be to use the moistUre content and tempera-ture regimes that can be predicted for a pavement location for rational adjustments of the moisture-damage test system as a predictive procedure--not at after-the--fact adjustments.
An interim assessment at the end of the 24-month sampling period is suggested to determine whether additional costs and time required for the 6-month periodic sampling during the remaining 36 months would be worthwhile relative to the additional information to be gained. The test plan could be modified at that time if desirable. Another type of assessment that would influence the level of costs and intensity of sampling would be related to the practical level of moisture-damage magnitude and rate prediction actually required by highway agencies. This practical consideration, coupled with test time and equipment considerations, would influence the type of moisture-damage test system desired. The field evaluation study plan assumes that this infor-mation would be obtained from highway agencies in the beginning of the project and alterations in the study plan would be made accordingly.
At the end of the field evaluation study, there is high certainty that a more accurate moisture-damage test system will result. It is felt that the ability to use exactly the same materials for lab-oratory specimens that appear in the asphaltic con-crete pavement -would ensure a large measure of the expected improved predictability without using adjustments in the test system. Adjustments in the test system (specimen aging, etc.), however, would make further progress.

2'!
REFERENCES
1. Andersiand, 0. B., and Goetz, W. H., "Sonic Test for Evaluation of Stripping Resistance in Com-pacted Bituminous Mixtures." Proc. Ass. Asphalt Paving Techn., Vol. 25 C19565.
Majidzadeh, K., and Brovold, F. N., "Effect of Water on Bitumen Aggregate Mixtures." Report CE-1, Dept. of Civil Engineering, Univ. of FI3ida, Gainesville (Sept. 1966).
Gillespie, K. R., "Application of the Tensile Splitting Test to Asphalt Concrete Mixtures at Low Temperatures." M.S. Thesis, Univ. of Alberta, Edmonton (1966).
S. Majidzadeh, K., and Stander, R. R., Jr., "Strip-ping in Hot-Mixed Sand Asphalt Mixtures." Report No. EES 293 (DR 6669), Dept. of Civil Engineering, Ohio State Univ., Columbus (July 1, 1967).
Field, F., and Phang, W. A., "Stripping in As-phaltic Concrete Mixes: Observations and Test Procedures." Proc. Canadian Tech. Asphalt Ass. Vol. 12, pp. 61-88 (Nov. 1967).
Majidzadeh, K., and Brovold, F. N., "State of the Art: Effect of Water on Bitumen-Aggregate Mixtures." Spec. Rep. 98 (1968)
Smith, R. W., and Gotolski, W. H., "A Study of Physical Factors Affecting the Durability of Asphaltic Pavements." Spec. Rep. No. 3, Dept of Civil Engineering, Pennsylvania State Univ. (June 1969).
Johnson, D. L., "Debonding of Water-Saturated Asphaltic Concrete Caused by Thermally Induced Pore Pressure." MSCE Thesis, Univ. Of Idaho, Moscow (Sept. 1969).
and D. L. Johnson),Flnal Report (Feb. 1971), (R. P. Lottman); Research Project R-47, with Idaho Dept. of Highways, research undertaken at University of Idaho, Moscow.
Hadley, W. 0., Hudson, R. W., and Kennedy, T. W., "A Method of Estimating Tensile Properties of Materials Tested in Indirect Tension." Res. Rep. 98-7, Project 3-8-66-98, Center for Highway Research, Univ. of Texas, Austin (July 1970).
Gangopadhyay, N. K., "Development of the Split Cylinder Test for the Measurement of Debonding in Water-Saturated Asphalt Concrete." MSCE Thesis Univ. of Idaho, Moscow (Jan. 1971).
Lottman, R. P., "Debonding Within Water-Saturated Asphalt Concrete Due to Cyclic Effects." Sym-posium The Science of Asphalt in Construction Div. of Petroleum Chemistry, Am. Chem. Soc., Vol. 16 No. 1, pp. P146-155 (Feb. 1971).
Schmidt, R. J., "A Practical Method of Measuring the Resilient Modulus of Asphalt Treated Mixes." Hwy. Res. Record No. 404 (1972) pp. 22-32.
Schmidt, R. J., and Graf, P. E., "The Effect of Water on the Resilient Modulus of Asphalt Treated Mixes." Proc. Ass. Asphalt Paving Techn., Vol. 41, pp. 118-162 (1972).
Brown, E. C., and Kuntze, R. A., "A Study of Stripping in Asphalt Pavements." Rep.RR177, Dept. of Transportation and Communications, Ontario, Canada (Mar. 1972).
Maupin, G. W., Jr., "Results of Indirect Tensile Tests Related to Asphalt Fatigue." Reprint No. 86, Virginia Highway Research Council, Char-lottesville (Dec. 1972).
Heukelom, W., "An Improved Method of Character-izing Asphaltic Bituinens with the Aid of Their Mechanical Properties." Proc. Ass. Asphalt Paving Techn., Vol. 42, (1973).
2. Skog, J., and Zube, E., "New Test Methods for 11 Studying the Effects of Water Action on Bitumi-nous Mixtures." Proc. Ass. Asphalt Paving Techn., Vol. 32, pp. 380-411 (1963).
10. "The Moisture Mechanism That Causes Asphalt 19. Jimenez, R. A., "Testing for Debonding of As- Stripping in Asphaltic Pavement Mixtures." phalts from Aggregates." Rep. AHD-RD-10-123, First Annual Report (Nov. 1968), (R. P. Lottman), Research Div., Arizona Highway Dept. (May 1973). Second Annual Report (Dec. 1969), (R. P. Lottman

APPENDIX A
LABORATORY TESTING DURING STUDY
A. PROCEDURE FOR PREPARATION OF LABORATORY-FABRI CATED SPEC fl'ENS
1. Materials Aggregate: Aggregate was brought to the
average gradation reported by highway departments on the basis of record sampling of cores after pave-ment construction. The combined aggregate batch was progressively split to specimen weight (1,100 grams). Aggregate samples were heated in a 320 F gravity convection oven for 15 hr before mixing with asphalt.
Asphalt: Asphalt obtained from highway departments was matched by refinery and consistency-temperature relationship to the asphalt originally used in the pavement. Original asphalt was not ob-tainable. Asphalt contents used in the beginning of the project were average values as reported during record sampling after pavement construction. Later, asphalt contents were set to match those determined by extraction from pavement cores. Asphalt was heated in a 300 F gravity convection oven for 2 hr before mixing with aggregate.
Asditives: Some pavement mixtures called for the addition of lime, lime slurry, and asphalt "anti-strip" additives. In these cases, the highway depart-ments sent additives that were considered representa-tive of those used in the pavements at time of construction for addition to the laboratory mixtures.
2. Mixing and Curing Mixing time was 4 mm , at 300 F, using a heating
mantle and a 4-qt bench-top mixer with wire-whip paddle. After mixing, the mixture was spread in a 7-in, by 11-in, by 1-in, pan and cooled at room tem-perature for about 2½ hr. The mixture was then placed in a 140 F forced-air oven for 15 hr for "curing". Following the curing, the mixture was heated in a 250 F gravity convection oven for 2 hr prior to compaction.
Compon jcimen ?ize was 4-in, diameter by 2.5 in. thick.
Compaction was performed using a standard kneading compaction operation (see Fig. A-i). The mixture was compacted in two 1¼-in, layers, scarifying the lower layer before the upper layer was placed. This seemed to produce more uniform specimens. Compaction pres-sure and blows were varied for each mixture until, by trial and error and interpolation of density-void-compaction data, the correct permeable voids and density were achieved. Leveling loads were also applied to the specimens (magnitude varied with mixture type) in the mold after kneading compaction. After extraction from molds, specimens 'er€ cooled at room temperature for a minimwi of 24 hr before moisture conditioning and testing.
Specimen Selection per Pavement Type Permeable voids and densities for laboratory-
fabricated specimens representing a given pavement mixture were calculated using the relationship given in Appendix B (Sect. B-3). Specimens not having permeable voids within +0.5 of the target voids (average of the pavement cores per pavement) were discarded. About 40 percent of all the specimens were discarded on this basis. (Moisture damage is sensitive to permeable voids, so close control of permeable voids in specimens is necessary.) Four or more usable laboratory specimens were fabricated for each test variable.
B. PROCEDURE FOR PREPARATION OF HIQIWAY PAVVIENT CORES
The purpose of obtaining pavement cores in this proj ect was to determine the amount of moisture damage in a given asphaltic concrete pavement and to
I I
IMM" P"
Figure ,4-i. Kneading Compacror for Pthricavion of Laboratoinj Specimens.
Figure A-J. Deciccator Used for Fr j irz' .Yavemcnt Cores.

26
use this damage as a base to which laboratory speci-mens, after accelerated moisture conditioning, could be matched to assess predictability of the laboratory test system.
From 20 to 24 4-in. -diameter cores were received per project. They were wet drilled by field crews of the various highway agencies contacted. A major-ity of the core sets contained the entire thic1oess of asphaltic concrete. These were cut by masonry saw to obtain the lower surfacing construction course of the asphaltic concrete. A few highway agencies desired evaluation of the upper courses. In these cases the upper courses were sawn. Core sections were then prepared and evaluated. All core sections were cleaned with a fine-bristle brush and surface washed with distilled water. Then they were surface dried by towel.
The core sections (cores) per project were ran-domly divided into four groups of four or more cores for testing: (1) dry at 55 F; (2) saturated at 55 F; (3) dry at 73 F; and (4) saturated at 73 F.
A minimum of four cores for each group was con-sidered desirable. (The first six pavement core sets of the project were separated for testing at 55 F only.)
All cores were placed in a desiccator at room temperature until weight loss ceased, producing a dry (not bone-dry) condition. The cores were then ready for testing and evaluation. Figure A-2 shows cores placed in a cabinet-type desiccator.
C. PROCEDURE FOR VACUUM SATURATION
Vacuum saturation at room temperature was con-sidered a pretreatment of moisture conditioning for laboratory specimens and a means of water-saturating pavement cores to assess moisture damage.
Specimens and cores were placed in thick-walled jars and maintained above the jar bottoms by spacers. Figure A-3 shows a specimen in a vacuum-saturation jar. The jars were connected in series to accomo-date the simultaneous saturation of six specimens or cores.
Distilled water was used to fill the jars to about 1 in. above the specimens and cores, and about 2 in. below the top rim of the jars. A wetted doughnut-shaped flexible urethane gasket was placed on each jar rim and an aluminum vacuum plate cover was placed on the gasket. Vacuum hoses from the vacuum pump were connected to the plate cover £ it-tings, providing access to the inside of the jars.
A vacuum of about 4 in. of mercury (about a 26-in. drop) was applied to the inside of the jars for a duration of 30 mm, during which time the jar sur-faces were gently agitated. After the 30 min of vacuum, the vacuum was removed and the inside of the jars was allowed to reach ambient atmospheric pres-sure. Specimens and cores were maintained submerged in the jars under atmospheric pressure for a minimum of 30 min. A total of 60 min was therefore allowed for the vacuum-saturation procedure.
At this time the specimens and cores were ready for follow-up conditionings or iinnediate mechanical-microstructure testing (also for weighings to deter-mine density and voids--see Appendix B, Sect. B-3).
(Note: There were indications that the total time for the vacuum saturation procedure could be reduced to less than 60 mm; e.g., 10 mm + 20 mm under vacuum plus under atmospheric pressure, re-spectively, or 30 min total. This, however, was not researched extensively in this project to provide assurances that full saturation could be reached for all pavements (cores) and all laboratory specimens in the 30-min time period.)
Figure A-3. Laboratory Specimen Under Vacuum Saturation.
D. PROCEDURE FOR ADVA"CED MOISTURE CONDITIONING OF LABORATORY- FABRICAFJ3D SPECIMENS
Advanced moisture conditioning of laboratory-fabricated test specimens consisted of applying ther-mal cycles or freeze-plus-soak conditionings follow-ing vacuum saturation. Four specimens were used for each conditioning.
1. Procedure for Thermal-Cycle Conditioning Automatic-cycle air-temperature chambers were
used to produce this conditioning. Chamber air tem-peratures were set at 0 F and 120 F, and the cyclic timer was set for 4-hr intervals in tripping at 0 F and 120 F. In other words, a complete cycle of 0-120-0 F was timed at 8 hr, or 4 hr per half cycle. Chamber characteristics showed less than 30 min for the air to reach 0 F or 120 F, so the air remained at 0 F or 120 F for slightly more than 3½ hr. Under these conditions, specimens placed in the chamber reached 0 F or 120 F in slightly more than 3 hr, and remained about 40 min at each temperature. (Ther-mocouples inside specimens were used at beginning of the test program to determine these specimen-temper-ature time lags.)
Following vacuum saturation, specimens were in-mediately wrapped in plastic and placed in the cyclic air-temperature chamber. For this procedure, speci-mens were left surface moist and each was covered separately and tightly with two layers of thin plas-tic film. This film was taped to each specimen. Each specimen was than placed in a plastic bag con-taining approximately 10 ml of distilled water and the bag was sealed. The wrapped specimens were then placed flat on the shelves of the cyclic air-temper-ature chamber and the temperature cycling was started. Figure A-4 shows specimens at various stages of wrapping and after placement in a cyclic air-temperature chamber.
Temperature cycling lasted six days (8 hr per cycle x 18 cycles). Once a day an operator would open the chamber and turn the specimens over to help

Figure .4-4. Left: Laboratory Specimens at Stages of Wrapping for Thermal-Cycle Conditioning:
Right: Cyclic Air-Temperature C'hwjther for Thermal-Cycle Conditioning
ensure an even distribution of moisture inside the specimens.
Upon completion of 18 temperature cycles, the wrapped specimens were removed from the chamber, ready for preparation for mechanical testing.
2. Procedure for Freeze-Plus-Soak Accelerated Conditioning A conventional air-bath freezer and a heated tem-
perature-controlled water bath were used for this conditioning. The freezer temperature was set at 0 F + 5 F and the water bath was set at 140 F + 1 F.
o1 lowing vacuum saturation, specimens were wrapped and bagged as previously described under Procedure for Thermal - Cycle Conditioning."
Specimens were then placed in the freezer at 0 F for 15 hr. (If this was done at 5 PM, specimens were removed at 8 AM the following day.) After removal from the freezer, the specimens were unwrapped and placed in the water bath at 140 F for 24 hr. The water bath contained distilled water.
After removal from the 140 F water bath, the specimens were ready for preparation for mechanical testing.
E. PROCEDURE FOR UhiI'EPNINING MEU-L&NICAL PROI'liItFlES OF LABORATORY-FABRICATED SPECIMENS AND PAVEMENT cORES
1. Mechanical Tests Each variable of study was represented by a
minimum of four cores or laboratory specimens, as the case might be, in the mechanical testing. Through a major portion of the experimental work, both cores and laboratory specimens were tested at 55 F and 73 F, dry, and vacuum saturated (testing was done at 55 F only for the first series of six pavements). Labora-tory specimens were tested also at 55 F and 73 F after thermal cycling and after freeze-plus-soak conditioning.
The four cores or specimens representing each test variable were placed in a temperature-controlled pump-circulated water bath at 54 F or 73 F for 3 hr. (A water-bath temperature of 54 P was found to give an average core or specimen temperature during test of 55 F.) In the water bath the dry cores or speci-mens were kept dry by placing them in watertight con-tainers immersed in the water bath. The vacuum-saturated cores and the vacuum-saturated and condi-tioned specimens were submerged in the water bath
27
without any wrapping. Figure A-S shows specimens in a water bath used for this purpose. Masking tape used for core and specimen identification was removed at start of mechanical testing and replaced after testing.
Tensile-Strength Tests: Each core or speci-men was then tested separately while the rest re-mained in the water bath at the test temperature. For obtaining E-modulus by tensile (horizontal) dis-placement, a horizontal displacement device was placed on the core or specimen. A flat loading block was placed on the core or specimen fitting through the tensile displacement device opening. The core or specimen (with or without horizontal dis-placement device) was placed under the loading head of a compression testing machine, set at the vertical deformation rate of 0.065 th./min for 55 F test tem-perature or at 0.150 in./nhin for 73 F test tempera-ture.
At the specified vertical deformation rate for the test temperature selected, the maximum compres-sive load of the core or specimen was recorded.
(Note: One can expect p - up to 2,000-3,000 lb for dry cores and specimens.m9or saturated or con-ditioned cores and specimens, one can expect p as low as 10 to 40 lb when moisture damage is Jthy severe.)
The load was then decreased rapidly to zero, the core or specimen was removed, and the procedure was repeated for remaining cores or specimens.
Each core or specimen after test was measured for flattening (corresponding to maximum load con-dition) to the nearest 0.1 in. A rub with a flat piece of chalk on top and bottom of the core or specimen made a visual trace for easy measurement of flattening. Figure A-6 shows the measurement of flattening on test specimens.
After recording maximum load and measuring flat-tening, cores and specimens were further deformed at the prescribed vertical deformation rate until the vertical tensile crack opened. The cores or speci-mens were then separated in half and their inter-faces examined and photographed for visual moisture damage, such as stripping.
Tensile Stiffness Modulus ('P-Modulus" Tests): The tensile displacement device measured tensile (horizontal) displacement indirectly through the recording of bending strain of the contact metal leaves and through the use of a strain displacement calibration factor (or curve). Figure A-7 shows the

4fl'
Figure A-5. Specimens Soa: Li oais-Tenzerz- ture Water Bath at Test Temperature for Indirect Tension Test.
Figure .4-7. Tensile Displacement Device
tensile displacement device and test set-up. The design of the University of Idaho device
is shown in Figure A-8; the calibration graph for the device is shown in Figure A-9. The ordinate of the calibration graph is the tensile or horizontal displacement. The metal leaves oil the device were bent inward to provide minimal but adequate pressure to create friction on the sides of the test specimen at the leaf contact rods so that this would support the entire device. The device "rode" with the test specimen during the testing. The metal-foil strain gauges were waterproofed by painting them with one or two coats of strain gauge waterproofing material. This was an added protection feature so that a drop of water from the test specimen, etc., would not short out the gauges.
The bending strain in the metal leaves was the snii of the output strains in four metal-foil strain gauges. Each leaf was considered a cantilever beam. Placement of one gauge on each side of one leaf created a strain output in tension and an output in compression. Thus, for both leaves a total of two tensile gauges and two compression gauges was used.
Figure A-C. Determination of Specimen Flattening.
The gauges were wired as a four-arm bridge; the two tensile gauges were wired opposite the two conipres-sive gauges so that tensile strain would he additive to compressive strain In this way strain output was doubled per leaf for better sensitivity under low core or specimen displacements. The wire leads from the strain gauges were labeled and subsequently hooked up by plugs to the four-arm bridge terminals on an ordinary strain indicator prior to running tests.
One of the 4-in, diameter cores or specimens to be tested was removed from the test-temperature water bath, quickly surf ace-dried by towel, and placed on a resting block so that the core or specimen was upright (r-in. -diameter sides vertical). The hori-zontal displacement device was placed on the core or specimen so that the contact bars on the two metal leaves contacted the middle of the outside circular surface of the core or specimen and the device was aligned by eye. The loading block was placed on top of the specimen, fitting within the block-shaped opening on top of the device. The assembly (device, loading block, and core or speci-

Aluminum Block Aluminum Plate
14 I
'••• I'2
1, z
t1FACTOR
n per 0.025 le (horizontal) ,meat
001 I I I
0 1000 2000 3000 4000
29
MICROINCHES Of STRAIN (increase from base reading for micrometer reading of 4.000 in.)
Figure .4-9. calibration Crash Oj Tensile Displace-ment Device.
men) was then placed on the lower loading platform of the test ja1dn arid aligned.
The loading head of the machine was then moved down (or up) until contact was made. Usually this was detennineci when a few pounds registered on the load dial or plotter. The load was then quickly and precisely backed off from this contact load until about zero load registered.
The strain indicator was then balanced and this reading was recorded. This became the base strain reading, from which differences were taken from successive strain readings.
The core or specimen was then loaded at the presciibed vertical deformation rate.
Strain and load readings were recorded every 5, 10, or 15 sec continuously from start of test. strength specimens and cores require readouts every 5 sec.) The test was stopped after the maximun load and corresponding strain reading (and corres-ponding test time) were obtained. The load was then removed, and the device with the specimen was removed from the machine.
c. TestMachines: Figure A-lU shows two test set-ups. The upper photo shows a closed-loop hy-draulic system utilizing an x-y recorder for load-vs-vertical deformation. The operator marks points
em
I ,ntoI 0 plosti. I
Figure A-8. General Dimensions of Tensile Displace-ment Device. (Left and Right)
Figure A-JO. Typical Mechanical Test Machines for Pcrfor-ming Indiroct Toncion Toot (Tensile Strength and E-Modulus).
on the load-vs-deformation curve being generated at constant time intervals of 5 or 10 sec. Correspond-ingly, the strain gauge operator records strains from the horizontal displacement device. The lower photo shows a mechanical test machine utilizing a load dial. The operator needs to record the loads registered on the load dial at constant time inter-vals from start of test. Both set-ups appeared to work satisfactorily.
2. Calculation of Mechanical Properties The tensilestrengtl thidtlie E-modulus were the
principal mechanical properties calculated from the indirect-tensile test results. The horizontal dis-placement device provided values needed in E-modulus computations.
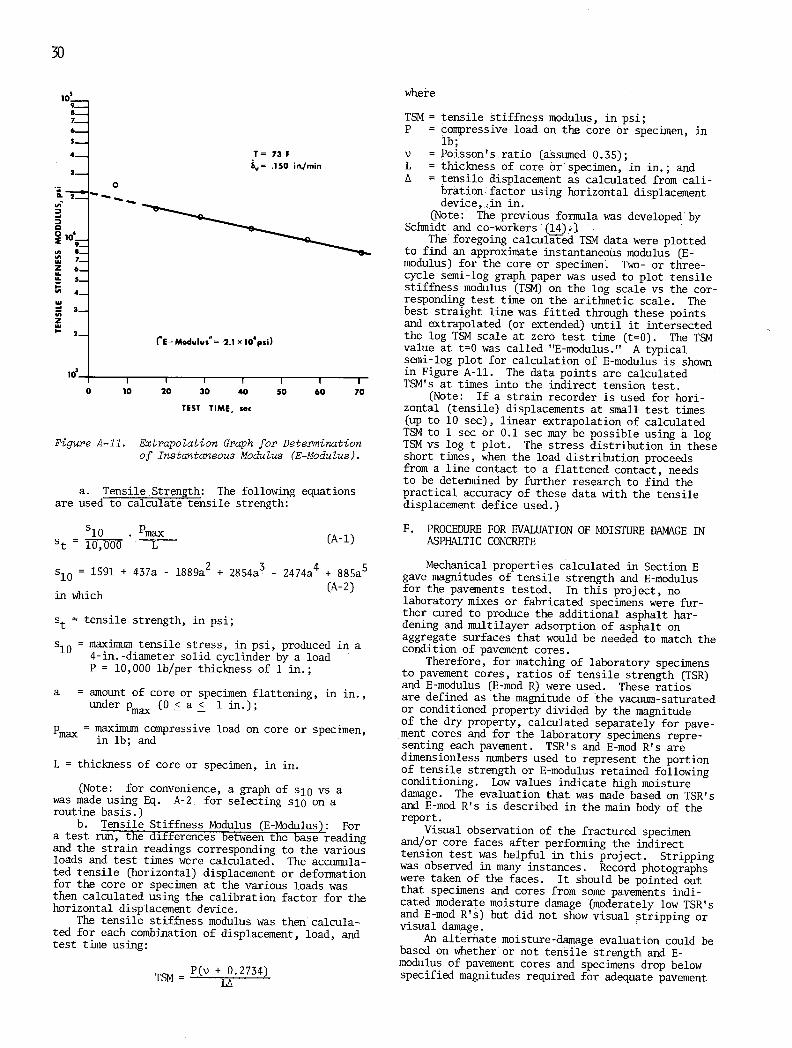
Q
0 10 20 30 40 50 60 70
TEST TIME, sec
Figure A-li. Extrapolation Graph for Determination of Instantaneous Modulus (E-Modulus).
a. Tensile Strength: The following equations are used to calculate tensile strength:
where
TSM = tensile stiffness modulus, in psi; P = compressive load on the core or specimen, in
lb; v = Poisson's ratio (assumed 0.35); L = thickness of core or specimen, in in.; and
tensile displacement as calculated from cali-bration factor using horizontal displacement device,in in.
(Note: The previous formula was developed by Schmidt and co-workers (14).)
The foregoing calculiThd TSM data were plotted to find an approximate instantaneous modulus (E-modulus) for the core or specimen. Two- or three-cycle semi-log graph paper was used to plot tensile stiffness modulus (TSM) on the log scale vs the cor-responding test time on the arithmetic scale. The best straight line was fitted through these points and extrapolated (or extended) until it intersected the log TSM scale at zero test time (t=0). The TSM value at t=0 was called "B-modulus." A typical semi-log plot for calculation of E-modulus is shown in Figure A-ll. The data points are calculated TSM's at times into the indirect tension test.
(Note: If a strain recorder is used for hori-zontal (tensile) displacements at small test times (up to 10 sec), linear extrapolation of calculated TSM to 1 sec or 0.1 sec may be possible using a log TSM vs log t plot. The stress distribution in these short times, when the load distribution proceeds from a line contact to a flattened contact, needs to be determined by further research to find the practical accuracy of these data with the tensile displacement defice used.)
10 . max St = 10,000 L
F. PROCEDURE FOR EVALUATION OF MOISTURE DAMAGE IN (A-l) ASPHALTIC CONCRETE
io = 1591 + 437a - l889a2 + 2854a - 2474a4 + 885a5
in which (A- 2)
tensile strength, in psi;
s 10 = maximum tensile stress, in psi, produced in a 4-in, -diameter solid cyclinder by a load P = 10,000 lb/per thickness of 1 in.;
= amount of core or specimen flattening, in in., underpmax (0<a< lin.); - -
max = maximum compressive load on core or specimen, in lb; and
L = thickness of core or specimen, in in.
(Note: for convenience, a graph of slo vs a was made using Eq. A-2. for selecting SlO on a routine basis.)
b. Tensile Stiffness Modulus (E-Modulus): For a test run, the differences between the base reading and the strain readings corresponding to the various loads and test times were calculated. The accumula-ted tensile (horizontal) displacement or deformation for the core or specimen at the various loads was then calculated using the calibration factor for the horizontal displacement device.
The tensile stiffness modulus was then calcula-ted for each combination of displacement, load, and test time using:
P(v + 0.2734) - TSM Li
Mechanical properties calculated in Section B gave magnitudes of tensile strength and E-modulus for the pavements tested. In this project, no laboratory mixes or fabricated specimens were fur-ther cured to produce the additional asphalt har-dening and multilayer adsorption of asphalt on aggregate surfaces that would be needed to match the condition of pavement cores.
Therefore, for matching of laboratory specimens to pavement cores, ratios of tensile strength (TSR) and E-modulus (E-mod R) were used. These ratios are defined as the magnitude of the vacuum-saturated or conditioned property divided by the magnitude of the dry property, calculated separately for pave-ment cores and for the laboratory specimens repre-senting each pavement. TSR's and E-mod R's are dimensionless numbers used to represent the portion of tensile strength or E-modulus retained following conditioning. Low values indicate high moisture damage. The evaluation that was made based on TSR's and E-mod R's is described in the main body of the report.
Visual observation of the fractured specimen and/or core faces after performing the indirect tension test was helpful in this project. Stripping was observed in many instances. Record photographs were taken of the faces. It should be pointed out that specimens and cores from some pavements mdi- cated moderate moisture damage (moderately low TSR's and E-mod R's) but did not show visual stripping or visual damage.
An alternate moisture-damage evaluation could be based on whether or not tensile strength and E-modulus of pavement cores and specimens drop below specified magnitudes required for adequate pavement

31
performance and integrity. Thus, this type of damage mechanical properties after being subjected to ac- evaluation would not be a ratio but a measurement of celerated moisture conditioning. the asphaltic concrete's ability to sustain minimum

32
APPENDIX B
PROPOSED RESEARCH PLAN FOR A FIELD EVALUATION STUDY
This appendix gives details of how the laboratory moisture-damage test system for asphaltic concrete described in this report can be field evaluated and adjusted, if necessary, for better correlation with actual moisture damage in asphaltic concrete pave-ments.
A. SPECIAL CONSIDERATIONS
The moisture-damage test system of the current project, which includes application of vacuum satura-tion plus either thermal-cycling or freeze-plus-soak additional conditioning to laboratory specimens, generally reduced specimen strengths below those of companion vacuum-saturated (only) cores, thereby tending to overpredict core strengths. Possible changes and additions to improve the matching in the proposed field evaluation study are listed, together with an estimate of priorities.
Original Materials Used in Laboratory Specimens It is considered essential to use the same as-
phalt and aggregates from the asphalt plant supply-ing the road paving material to make laboratory specimens. This is considered a Priority 1 item for inclusion, concerning both magnitude and rate of moisture damage.
Accelerated Aging of Laboratory Specimens (or Mix) TTs considered important to age compacted
laboratory-fabricated specimens, or perhaps the loose asphaltic concrete mixture, to an extent that ap-proxiniates the asphalt aging and aggregate absorption structure that would occur in a year-old or older pavement. Actual accelerated procedures would have to be developed from implications derived from other kinds of research performed, including the asphalt-aggregate interactive research presently being under-taken by the Laramie Energy Research Center of the U. S. Bureau of Mines, and past research performed on asphalt mix or specimen aging at other agencies such as Pennsylvania State University and the Virginia Highway Research Council. This is consider-ed a Priority 1 item for inclusion, concerned with both magnitude and rate of moisture damage.
Representation of Pavement Moisture Damage Should a pavement be represented by over-all
average physical properties such as average core voids and density, or by some lowest selected per-centile of physical properties measured to identify the moisture damage present? Should pavements be sampled and cored at locations of severest moisture damage? This consideration, using research results obtained from pavement serviceability procedures, should be included in the field evaluation study. This-is considered a Priority 2 item, and will be concerned with both magnitude and rate of moisture damage.
Evaluation of Moisture Variation in Pavements Water contents in asphaltic concrete and the
pavement roadbed materials need to be monitored seasonally to determine if variations of moisture would significantly affect the test system. This is considered a Priority 2 item, and will be concerned with rate of moisture damage.
Ttaffk (or Repeated Load) Effects Sampling pavements in wheelpaths is considered
important for finding traffic effects on moisture damage in the pavement, and to determine if these effects are represented in the test system to the degree of accuracy deemed desirable. This is con-sidered a Priority 2 item, and could be concerned with both magnitude and rate of damage.
Laboratory Compaction Methods Most highway agencies use the Marshall hammer
for specimen compaction; others use gyratory and kneading compaction for fabricating laboratory specimens. Laboratory compaction methods need to be evaluated to determine how significantly they affect the asphalt-aggregate orientation and thus the pre-dictability of the moisture-damage laboratory system. This is a Priority 2 item, concerned with system variability.
B. PROPOSED STUDY PROCEDURE
In Section A, recognition was given to a number of items that, if considered, should better the chance of success in improving and validating the predictive ability of the proposed moisture-damage test system. This section outlines a number of fur-ther considerations and describes the proposed test system for predicting moisture damage that is to be evaluated.
1. Pavement Location and Sampling Pavements need to be selected that are located
in different climate zones based on "freeze-thaw" and 'warming-indices" as well as freezing indices in order to evaluate the effect of climate on var-iables of laboratory moisture conditioning. The current project involved sampling of pavements with a variety of freezing indices and it was concluded that freezing index may not be a variable of first-order priority in the effect of moisture condition-ing. This question still remains, however, because of the requirements still in doubt that need to be satisfied (see Section A) and of the consideration of temperature extremes, rather than freezing index per se.
Pavement sampling by coring has proven to be satisfactory with respect to providing data on moisture damage. However, as moisture damage ad-vances, the strength of the dried cores may be re-duced. If this is so, there would be a problem of analysis of moisture damage at a given age of pave-ment. The continuous sampling (monitoring) of pave-ments with age at time of construction is also impor-tant for correlation of field time for pavement moisture damage with the number of thermal cycles in the laboratory thermal-cycle conditioning proce-dure.
Sampling of a given pavement on a continuous basis will also provide the following data: mois-ture content of soil and granular select layers vs moisture content of asphaltic concrete, for possible relationship with prediction of rate of damage; pavement temperature vs air temperature, for eventual correlation with laboratory conditioning variables; permeable voids change in pavement with age, for specimen fabrication correlation; and traffic repe-tition increase, for any possible accumulative effect on rate and magnitude of moisture damage.

33
Laboratory Test Variables The purpose of the laboratory program is to
physically make modifications of test specimen com-paction such as voids and conditioning variables (time and temperature) when warranted, to follow pavement moisture-damage conditions from paving to approximately 5 years of age. This would determine the significance of the changes in pavement physical conditions and environment (temperature, moisture, and traffic) on the physical steps recommended for predicting magnitude and rate of moisture damage in the moisture-damage test system.
Magnitude of damage is related to the severity of the laboratory conditioning variables such as time in freeze or soak and number of thermal cycles, and soak temperature and cyclic temperature extremes. Rate of damage is developed through a relationship between laboratory time for the magnitude of damage in specimens to occur and the field time for the pavement moisture damage to occur. The scope of the field evaluation study would be designed on this basis -- to obtain practical and predictable field data for adjustment of the laboratory moisture-damage test system.
Practicality of Laboratory Test System It is assumed that there is no need to develop
a moisture-damage test system that is more compli-cated, expensive, and time consuming than a minimum level of practicality and acceptability commensurate with a reasonable level of predictability. This was the goal of the current project and should continue as an objective of a field evaluation study. There-fore, decision-making should be continuous during the study to ensure reaching this objective without sacrificing rational procedures. Highway agencies should be consulted formally in the beginning of the study for their requirements in practice on levels of complication, expense, and time of the test sys-tem versus levels of predictability.
A suggested moisture-damage test procedure to be followed for dense-graded asphaltic concrete would consist of the following steps (Refer to Appendix A for other details):
a. Procedure for Preparation of Pavement Cores and Laboratory-Fabricated Specimens:
(1) Cores from new pavements (for moisture- damage prediction after construction):
Obtain 12 cores minimum, 4-in, diameter, per pavement section under investigation Determine critical construction coursc for investigation. Remove core section representing critical course in the laboratory, using a masonry saw. Min-imum thickness should be 1 1/2 in., maximum thickness about 4 in. Clean core section surfaces with brush and distilled water. Desiccate all core sections to constant weight; obtain "dry" weight.
[e) Randomly select 8 core sections, vacuum saturate, and calculate permeable voids for each of the 8 core sections using
Permeable Voids, %= (C'C+B_A)x 100
where (Bl)
A = weight in air of desiccated (dry) core section;
C = submerged weight of initially desiccated dry core section im-mersed in distilled water for 3 min at 73 F;
B = weight in air of core section quickly blotted by towel (surface dried) after obtaining weight C;
C' = submerged weight of vacuum- saturated core section in distilled water at 73 F (vacuum saturation is the application of 26 in. of mercury vacuum for 30 min to a submerged core section in distilled water at room temperature followed by 30 min of additional submergence in distilled water at atmospheric pressure),
(f) At this point there are to be 4 dry core sections and 8 core sections in a vacuum-saturated condition.
(2) Cores from old pavements (for monitoring current moisture damage):
Obtain 8 cores minimum, 4-in, diameter, per pavement section under investiga- tion.
Determine critical construction course for investigation. Remove core section representing critical course in the laboratory, using a masonry saw. Mini- mum thickness should be 1 1/2 in.; maximum thickness about 4 in.
Clean core section surfaces with brush and distilled water.
Desiccate all core sections to constant weight; obtain "dry" weight.
Randomly select 4 core sections and calculate permeable voids for each of the 4 core sections using the relation- ship in (1) (e), previously.
At this point there are to be 4 dry core sections and 4 core sections in a vacuum-saturated condition.
(3) Laboratory-fabricated specimens (for mois- ture-damage prediction before construction):
Fabricate 12 specimens minimum, 4-in. diameter by 21-,. in. thick, per specified constituents (asphalt, aggregate, ad- ditives, etc.) and per specified perme- able voids. Marshall and Hveem speci- mens are satisfactory.
Specimens after fabrication are to re- main dry and undisturbed at room tem- perature for 24 hr.
Randomly select 3 groups of 4 specimens each. Maintain 4 specimens (1 group) dry at room temperature. Vacuum satu- rate remaining 8 specimens (2 groups) and determine permeable voids (see Step (l)(e)) and bulk densities. The percent permeable voids is to be within +0.50 of the specified permeable void content. Specimens with voids outside this range should be discarded and additional specimens fabricated to obtain 8 specimens (2 groups) with ac- ceptable specified permeable voids. The 4 dry specimens Cl group) are to be maintained dry. They are approximately controlled for voids by matching their bulk densities (determined by weight, diameter, and height measurements in a dry condition) to bulk densities of the acceptable vacuum-saturated speci- mens corrected to dry density; addition- al dry specimens need to be made if any of the 4 required dry specimens have bulk densities greater or less than 1.5 pcf of the average of 8 acceptable

rd
vacuum-saturated specimens corrected to placed in a plastic bag containing dry density. Bulk density for vacuum- about 1 ml of distilled water to pro- saturated specimens is calculated using vide an additional moist barrier. These
bags are then sealed. - A = • A
(B-2) The baggedcores (specimens) are placed - B-C B'-C' in a 0 F air-bath freezer (appliance
where type is satisfactory) for 15 hr. After removal from the freezer, the
A, B, C, and C' are as defined under bagged cores (specimens) are unbagged Step (l)(e) and B' is the weight in and unwrapped immediately, when they air of vacuum-saturated, surface-dry become unfrozen at room temperature. (blotted) core section after obtain- The cores (specimens) are then placed ing weight C'. immediately in a bath of distilled
water at 140 F for 24 hr. At this point there are to be: 1 group (d) After removal from the water bath, the of 4 dry specimens and 8 vacuum- cores (specimens) are transferred in- saturated specimens in 2 groups of 4 mediately to a pre-test water bath each. NOTE: All pavement core sections (see section following). and laboratory-fabricated specimens that (2) Thermal-Cycle Conditioning: have been vacuum saturated must be (a) Do previous Step (1) (a). transferred immediately to the pre-test (b) The bagged cores (specimens) are placed water bath for mechanical testing or in a thermal-cycle air-bath chamber set advanced moisture conditioning. A for cycling between 0 F and 120 F; 4 vacuum-saturated condition needs to be hr per halfcycle (8 hr per full cycle: maintained during .this transfer. Core 0-120-0 F). The air heating or cooling sections are termed "cores" in the fol- time in the chamber is to be no greater lowing procedures. than 30 to 40 min per half cycle: 0-120
b. Decision for Need of Advanced Moisture Condi- F or 120-0 F. tioning: (c) The bagged cores (specimens) are to lie Four dry cores (specimens) and 4 vacuum-sat- flat in the chamber without contacting urated cores (specimens) are first tested to each other. Turn over each bagged core find average tensile strength and/or B- (specimen) every 24 hr during the part modulus. Refer to Steps d and e (following) of the cycle when cores (specimens) are for mechanical tests, unfrozen. For cores from new pavements and laboratory- (d) Eighteen (18) full 0-120-0 F cycles are fabricated specimens having low retained recommended (6 days of cycling). tensile strength or tensile E-modulus values (e) The bagged cores (specimens) are re- (TSR and/or E-mod R, see Step e) (e.g., 0.5- moved from the chamber near the 120 F or lower) it is not necessary to subject the end of the cycle when unfrozen to elm- remaining vacuum-saturated 4 cores (speci- mate sticking and problems of unwrap- mens) to advanced conditioning. The moisture ping in a frozen condition. damage at this point would be large enough (f) The bagged cores (specimens) are unbag- to classify the mix as highly moisture- ged and unwrapped immediately and sensitive and undesirable. transferred to a pre-test water bath A moderate to high retained strength and/ (see Step d. following). after mechanical testing (high TSR's and/ d. Pre-Test Temperature Control: or E-mod R's--see Step (e)) in vacuum- A water bath containing circulating distilled saturated condition indicates relatively water at 54 F is to be located near the low short-tern moisture damage. It is mechanical test machine. recommended that advanced conditioning Vacuum-saturated cores (specimens) and ad- be performed on the remaining 4 vacuum ditionally conditioned cores (specimens) are saturated cores (specimens) and this measured for length and diameter and then damage be assessed for long range moisture immersed in the water bath. Cores (speci- damage potential. Proceed to step C. mens) to be tested in a dry condition are Cores from old pavements: there is no need also measured, but placed one each in. water- to perform advanced conditioning since this tight close-fitting metal jars with jar tops is a monitoring procedure for current state protruding above the water level of the bath. of moisture damage. TSR's and E-Mod R's are Insulation is stuffed on top of the dry core reported -- see step e. (specimen) in each jar. The top of the core
c. Advanced Moisture Conditioning: At present, (specimen) in each jar is to be several either procedure Cl) or procedure 2) following, is inches below the water level of the bath. acceptable. Procedure Cl) requires simpler equip- (3) Cores (specimens) are to remain in the water meat and shorter conditioning times, but could result bath at 54 F for 3 hr before mechanical test. in some underprediction of damage. Procedure (2) The 3-hr bath time may be extended to 31-, hr requires a thermal-cycle air chamber (or equivalent) for some cores (specimens). and longer conditioning times, but does not appear e. Mechanical Tests and Results: to underpredict damage. Cores (specimens) are removed from the water (1) Freeze-Plus-Soak Conditioning: bath, blotted surface-dry with a towel, and
(a) Four vacuum-saturated cores (specimens) tested immediately in indirect tension (dia- from Step a.(l)(f) and Step a.(3)(d) are metral compression). immediately removed from the saturation The vertical deformation rate for the test chamber in a surface-moistened condition is 0.065 in. per mm. and wrapped individually and tightly A horizontal displacement device can be with one layer of thin plastic film, placed on a core (specimen) for obtaining Then each wrapped core (specimen) is data to calculate an E-modulus during this

35
testing. (See Appendix A for an example of a device and a procedure.)
(4) At maximum load Crecord maximum load), the core specimen) is to be reioved immediately for measurement of load-contact average flattening at top and bottom side ( -0.1 in. accuracy). Tensile strength at 55 F is cal-culated using the method in Appendix A, or it can be calculated to an approximate level of accuracy (assuming flattening is about 0.6 in.) using:
Cr
- 1.93 'max (B-3) 7tLD
where ot= tensile strength, in psi;
1.9.3 = constant (theoretically = 2, subtract approximately 3.5 percent);
P = maximum vertical load, in ib; mat = thickness or length or core (specimen),
in in.; and D = diameter of core (specimen) (usually 4 in.)
in in. (5) An E-modulus is also calculated if Step e. (3)
above is followed. (6) After recording maximum load and flattening,
cores (specimens) can be replaced in the test machine and further deformed at 0.065 in. per min until the vertical crack opens sufficiently. Final separation by hand will allow visual moisture-damage examination of the core (specimen) interior.
(7) The average tensile strength and/or E-modulus for each set or group of 4 cores (specimens) is reported in the following moisture-damage states:
dry; vacuum saturated; vacuum saturated plus advanced condition-ing. One should expect about an 8 to 9 percent coefficient of variation for tensile strength (set or group of 4 "identical" cores or specimens in a given moisture-damage state: (a), (b), or (c) above. For E-modulus (Appendix A procedure), one should expect coef-ficients of variation of about 23 per-cent for cores and about 16 percent for specimens.
(8) The ratios of tensile strength and/or E-modulus based on the dry state are reported for vacuum saturation and for the vacuum saturation plus advanced conditioning. These saturation ratios are defined as the fraction of retained mechanical property:
at (conditioned) TSR =
at (dry)
- E-modulus (conditioned) B-mod R - E-modulus (dry)
The lower the ratios (below 1.0), the higher the moisture damage or predicted moisture damage of the mix. Ratios are reported to the nearest tenth.
C. PROGRESS DETAILS OF FIELD EVALUATION STUDY
Steps are listed in the following for a 79-month field evaluation study with an interim review period at the end of the first 30 months. The steps reflect the methods emphasized in Sections A and B. 1. Preliminary Period (Months 1-5) (Month 1 begins
at start or end of calendar year) a. Laboratory specimen or mixture aging techniques
would be applied to two available "moisture-suscep-
tible" mixtures used in NCHRP Project 4-8(3) to form a standard laboratory-specimen aging procedure.
b. All state highway agencies would be contac-ted for detèr*iining availability of new construction of asphaltic concrete pavements having future possi-bility of moisture damage. Agencies would be asked about their willingness to cooperate in a 5-year evaluative sampling program with a reimbursement of expenses.
Response would be made to affirmative replies from Step l.b with request to the agencies to sub-mit 15 compacted asphaltic concrete specimens per pavement. Advanced moisture-damage conditioning and mechanical evaluation, as used in NCHRP Project 4-8 (3), would be performed on specimens received to determine which pavements may have measurable and most significant future moisture damage.
Based on findings from (c), climatic data on the locations for the promising pavements would be determined and a minimum of six pavements would be selected, two in each of three climate zones.
The agencies concerned with the six pave-ments selected would be further contacted to work out details of a pavement sampling program and materials shipment.
At time of construction, visitation by re-search staff to each of the pavement locations would be required to place temperature and moisture sen-sors in the pavement, correlate coring procedures with the agency personnel, and obtain the pavement's aggregate and asphalt materials (and mix data) at the asphalt plant for shipment to the research lab-oratory. 2. Initial Laboratory-Field Monitoring and Evalua-
ting Period (Months 6-9) At this point in the study, the pavements selec-
ted would be "set up" for sampling and data collec-tion, and the research laboratory would be adequately supplied with original aggregate and asphalt materi-als for each pavement.
From each pavement, a set of 15 cores would be drilled in the wheelpaths and a second set of 15 cores would be drilled between wheelpaths immediately after paving. These core sets would be sent to the research laboratory.
The core sets received would be tested to find range and averages of: moisture content, density, and permeable voids; tensile Mg, E-modulus (initial stiffness), and tensile strength at 55 F dry, vacuum-saturated, and additionally conditioned. Also, asphalt content and viscosity would be obtained.
For each pavement, two series of laboratory specimens would be fabricated in the research lab-oratory: For example, one series may be compacted by Marshall hanniier, the other by kneading compactor. Specimens would be aged according to Step l.a. These specimens would be fabricated to the average density (voids) and asphalt content determined from the core sets obtained from the pavement. A duplicate set of two series of specimens would also be fabricated, but at 50 percent less void content. The mechanical tensile properties of MR, E-modulus, and strength at 55 F would be determined for the specimens dry, vacuum-saturated, and additionally conditioned.
Pavement subbase moisture contents and pavement temperatures would be obtained through this period. Moisture contents of soil: in proximity to the pave-ment but not under pavement influence would also be taken.
At this point, tensile mechanical properties ob-tained for cores and laboratory specimens subj ected to advanced moisture conditioning would provide ten-tative predictions of about 5-year moisture damage in the pavements.

36
a)
a) a)
a) a)
a)a)ca I a)'- 1
4-a) a)H
00
I Cd
I 4-0Ha) I
0 a)a)l a)a)a) so
u.2' 2° I a)+4f a)a)a)
a) L) 4.4 -.,-1I
I €-a)a)a) I
a' '
F 10 20
MONTHS FROM START OF STUDY 30 40 50
'0
a) 'O
a)a)
a)a)
4-0 0 a)
a) 4.'
z 0
18
60 70 80
73 0 0 0
1
I-. tn 87
740 U
Figure B-i Progress and Cost Rate for Proposed Field Evaluation Study.
3. Tn-Annual Pavement Monitoring and Evaluating Period (Months 10-30)
Every four months, from first sampling in-mediately after paving, core sets would be drilled in each pavement as indicated in Step 2.a. Some periodic visitation by research staff to pavement sites may be required.
The research laboratory would obtain the tensile mechanical properties for the cores in a dry and vacuum-saturated condition. Additional core properties obtained would be density and permeable voids, asphalt content and viscosity, and moisture content.
Temperature of the pavements and subbase moisture contents would be monitored periodically. Continuous or periodic temperature monitoring should be used to provide adequate data for a correlative relationship between air temperatures and pavement temperatures. Moisture content should also be ob-tained periodically when temperature shifts occur (such as in cold weather) for evaluation of build-up of pavement moisture due to upward vapor flow from the soil and condensation. These data would determine how fast and how naich pavement moisture saturation is built up and if there is a correlation with subbase or soil .oisture content and with mois-ture content of soil without pavement.
If at any time during the 4-month pavement sampling period the core physical properties show a deviation from the laboratory specimen fabrication (void change) and predicted aging characteristics, the laboratory should make reconstituted specimens and maintain an up-to-date laboratory-specimen moisture-damage prediction. 4. Interim Analysis Period (Months 31-33)
a. Data for all measurements in field and lab- oratory would be finally assembled and the analyses (that were continuous for the first 30 months) would
be put into practical order. Minimal analyses would include: searches for correlations between pavement, subbase, and soil moisture contents; searches for ad-ditional correlations with temperature and tempera-ture change; study of the effect of laboratory com-paction on moisture-damage predictability, the level of predictability reached in two years of pavement life, and the time-magnitude relationship of the specimen mechanical properties during moisture con-ditioning to the pavement core changes and to theo-retical rate relationships.
b. An interim report would be written for sub-mittal at end of month 33. S. Interim Report Review Period (Months 34-36)
Adjustments in the working plan for the remaining two years of data collection and analysis would be undertaken if needed prior to further laboratory tests and field sampling. In addition, the study at this point could be phased out or phased down if it was determined that adequate data and analyses obtained to date were nearly complete for a final report. If termination is decided, an additional two or three months would be required to contact highway agencies and determine practical acceptability of methods for utilizing the moisture-damage test system and to write the final report. 6. Final Three-Year Laboratory-Field Monitoring and
Evaluating (Months 37-73) Pavement cores would he taken semi-annually;
exact sampling times would be determined by climate (location) and time. of year for measuring at least one "worst condition" of moisture damage in the pave-ment (perhaps winter or early spring). All laboratory and field procedures would be similar to Steps 3.a, 3.b, 3.c, and 3.d.
Analyses would be continuous, as described in Step 4.a. In addition, highway agencies would be further contacted to determine level of acceptance and practicality of the moisture-damage test system.

37
c. The study during these three years could be terminated at any time if it is determined that adequate data and analyses have been obtained for the objective of the study [see Step 5). 7. Final Analysis and Report Period (oiths 74-76)
This period would be used to write the final re-port after performing final analyses of all the data The report needs to demonstrate:
That climate and moisture in the field do or do not affect the variables of concern in the lab-oratory moisture-damage test system in a manner that permits prediction of magnitude and rate of damage with tolerable accuracy for practical purposes.
How, if the response to Step 7.a is affirma-tive, one practically goes about pre-setting the advanced laboratory moisture-conditioning variables based on predictable field data such as temperature and moisture-content change at a future pavement site.
If the response to Step 7.a is affirmative,
what practical test equipment and procedures are available for application to predict on a reasonably rational basis the magnitude and rate of moisture damage that can be expected in asphaitic concrete pavements in..typicai given.sets of circi.mistances. 8. Final Report Review Onths 77-79)
Review of and corrections to the final report may be accomplished in months 77-79.
D. PROGRESS GRAPH Figure B-i shows an approximate progress and cost
rate for the full 79-month period of the field eval-uation study described. The study could be terminated at the end of 33 months or at the end of any subse-quent 12 months, dependent on sufficiency of data to meet the objectives. The cost projection does not include costs for rehabilitation of pavement surfaces of the sampling sites at the conclusion of the pro-ject, but does include 40 percent overhead charges on salaries and wages.

APPENDIX C
TEST DATA
A. DATA SUMMARY FOR PAVEMENTS IN PHASE 1 STUDY The Phase 1 study consisted mainly of a wide-
ranging search for conditioning processes that could be applied to pavement cores and matching laboratory specimens to produce moisture-damage conditions sim-ilar to those being experienced by the pavements represented. Responses were measured by the indirect-tension test and by a triaxial repeated-load test. The repeated-load test used in the study was abandoned when the indirect-tension test seemed to be producing better results.
Cores, and materials used to fabricate matching laboratory specimens, were obtained from six pave-ments in three states. Two of the pavements showed signs of moisture damage; four did not. Information regarding the pavements sampled is as follows:
AZ-l(W) (Arizona). This pavement, constructed in 1966, consists of a 3-in, asphalt-treated base, a 3 1/2-in, upper course of asphaltic concrete, and a 1/2-in, seal-coat topping. There was considerable visual evidence of moisture damage at the time of sampling. Construction records show that at one point the mixture experienced such severe moisture damage from a rainstorm that occurred soon after paving that replacement was necessary. Laboratory specimens matched the lower portion of the upper course.
ID-1 (Idaho). This pavement, constructed in 1956, consists of a 0.2-ft asphaltic concrete lower course, a 0.1-ft asphaltic concrete upper course, and a 1/2-in. seal-coat top. Surface damage from moisture was visible in the wheelpaths at the time of sampling. Moisture damage, although not visible from the sur-face, was thought also to be present outside the wheelpaths. Laboratory specimens matched the lower course.
AS-2(E) (Arizona). This pavement, constructed in 1967, has a 2-1n. asphaltic concrete bottom course without anti-stripping treatment, two w-in. asphaltic concrete upper courses with lime slurry added, and a 1/2-in, seal-coat top. No moisture damage was evi-dent at the time of sampling. Laboratory specimens matched the middle asphaltic concrete course contain-ing lime slurry.
ID-2(B ST) (Idaho). This pavement, built in 1966, is of two-course asphaltic concrete construction in which each course is 0.15 ft thick. Both courses were treated with an anti-strip additive. No mois-ture damage was evident at the time of sampling. Laboratory specimens matched the middle asphaltic concrete course containing lime slurry.
ID-2(MR) (Idaho). This pavement, built in 1961, consists of a 0.20-ft asphaltic concrete lower course and a 0.10-ft asphaltic concrete upper course. No moisture damage was evident at the time of sampling. Laboratory specimens matched the lower course.
VA-2 (Virginia). This pavement, constructed in 1966, has a 4-in. asphaltic concrete base course, a 1 3/4-in. asphaltic concrete binder course, and a 1/2-in. asphaltic concrete surface course. No moisture damage was evident at the time of sampling. Laboratory samples matched the binder course.
The results of the indirect tension tests per-formed on the cores and laboratory specimens during the first phase of the project are given in Table C-l. As used herein, the term "core" applies only to the portion of the extracted core representing the pavement layer of interest, usually the bottom asphaltic concrete construction course. Procedures followed in sampling, preparing specimens, and test-ing are described in Appendix A. The Compressive Stiffness Index given in the table is an index that was determined from the indirect tension test during the first phase of the project by dividing the cal-culated slope of the central half of the compressive load-vertical (compressive) deformation curve by the thickness of the specimen. The Compressive Stiffness Index determinations were discontinued when they were found to have no special value as indicators of moisture damage.
B. DATA SUMMARY FOR PAVEMENTS IN PHASE 2 STUDY After the preliminary development of the test
system, state highway agencieswere contacted for sampling of three categories of asphaltic concrete pavements. These categories were:
Category 1 - An approximately 5-year-old asphal-tic concrete pavement having no evidence of
TABLE C-i
INDIBECT TENSION TEST RESULTS FOR CORES AND SPECIMENS OF FIRST PHASE OF STUDY'
Pavement ç20jepgi1eStrfl5h Per- Laboratory Specimen Teni1e Strength - Indirect Tension
Identity- Year meable 3) 3) 3) 3)
State and Built Dry Vacuum Ratnd Voids Dry Vacuum Ratio V.S.x18 Cycles Ratio V.S.x18 Cycles Ratio Soak Ratio Soak Ratio
Category Saturated Saturated (TSR) 0-120-0F (TSR) 30-120-40 F !L I1 L11F (TSR)
psi psi t psi psi psi psi psi psi
AZ-1 (N) 1966 119 11 0.13 6.S 106 11 0.10 3 5.03 5 -0.05 4 0.04
ID-1 196173 46 0.42 5.6 109 100 0.92 47 0.43 97 .0.89 27 0.25 ER 0.63
A2-2 (E) 1967 169 192 1.14 6.0 121 130 1.08 123 1.02 133 1.50 118 5.98
1 D-2(B ST) 1966 Ri 91 1.06 7.4 02 76 0.93 62 0.76 54 0.66
10-2 (MR) 3961 80 88 1.10 3.1 117 012 0.96 67 1.07 77 0.66
VA-2 1969 79 70 ORg 4.4 102 87 0.86 so 0.41) 44 49 0.48
Pavement Stiffness Index Laboratory Specimen Compressive Stiffness Index
Identity- Year . 3) 3) 3) 3) 3) 3)
State and Built Dry Vacuum Ratio Dry Vacuum Ratio V.0+11 Cycles Ratio V.S.+58 Cycles Ratio Soak Ratio Soak Ratio
Category Saturat9d (SIR) Saturat9d (SIR) 0-120-S F 40-120-40 F (SIR) 160F 120F ()3)
lb/xn TS7T0 lb/in' lb/au' lb/io Th7102 157T0° A2-1 (5) 1966 13,283 3,124 0.24 11,110 886 0.08 235 0.02 582 0.00 415 0.04
10-1 1905 940 4,520 4.81 9,860 7,600 0.77 6,930 0.70 8,890 0.98 2,816 0.29 4,916 0.50
.AZ-2 (1) 1967 17,801 17,924 1.01 11,000 12,320 0.12 9,100 0.83 18,173 0.99 8,595 0.78
ID-2(B ST) 1966 - 10,780 6,707 5,409 0.01 4,958 0.74 3,280 0.64
ID-2 (55) 1961 9,780 10,646 9,680 0.91 8,040 0.76 0,060 0.62
VA-2 1969 8,290 6,047 6,413 0.92 0,176 0.80 3,162 0.41 3,532 0.12
1) Reported results are generally averages for F nur cores or specimens. 2)Compressive Stiffness Index = slope of loaddefomution curve/thickness of specimen. 3) Ratio of test value for conditioned core or specimen to test value for dry core or specimen.

39
distress: made with aggregates that have a tendency to strip or be sensitive to water, or showing strip-ping or softening (sometimes shown by recent coring, surface material loss, or high deflections, especial-ly during wet seasons; surface cracking, buL not due to weakened subgrade or aggregate base only, or other indicators based on eperience).
Of the state highway agencies contacted, those that responded affirmatively and were selected were: Alaska, Oregon, Nebraska, Wyoming, Colorado, Texas, South Dakota, Montana, and Tennessee. (Note: the Tennessee pavement was not evaluated, after discus-sion with the Tennessee highway agency, because the cores represented a thin lift (about 0.6 in. thick) thought to be too thin for an accurate determination of mechanical properties by the indirect tension test.)
Category 2 - An approximately 5-year-old asphalt-ic concrete pavement having no evidence of moisture distress. Affirmative response from highway agencies produced the selection of California, Colorado, and New Jersey.
Category 3 - A newly-constructed (1972) asphaltic concrete pavement having a potential of moisture damage because of history of moisture-sensitive aggregate used, etc. Affirmative response from high-way agencies produced selection of Ohio and Texas.
The pavements included in the study exhibited the following conditions at the time of coring:
AK-i (Alaska). Surface deterioration on the Ingra-Gambell Couplet is occurring as raveling and potholing. There does not appear to be significant surface cracking or stripping. Considerable wear from studded tires is noticed. It is thought that the raveling and potholing might begin 'as freeze-thaw action resulting from moisture between the binder and surface courses.
The asphaltic concrete pavement consists of a 1½-in, binder course and a 1½-in, wearing course. Laboratory specimens represented the surface course.
CO-1 (Colorado). This 10.3-mile asphaltic con-crete pavement section began to show surface weather-ing and raveling soon after its construction in 1969. Surface deterioration has continued at a fast rate. Longitudinal cracking began 18 months after construc-tion. The outside lane has ruts approximately ½ in. deep. Colorado highway engineers report that surface damage is in excess of what would occur under studded tires and that the wheel ruts are probably caused by material deformation. It was also indicated that the damage was not throughout the lift. Laboratory specimens represented the full pavement thickness of 1 1/2 in.
MT-i (Montana). This asphaltic concrete pavement deteriorated internally due to asphalt stripping since its construction in 1960. A 1971 field study by Montana highway department personnel showed strip-ping; pavement brittleness was noticed where asphalt binder was not stripped from aggregate surfaces. It is surmised that the seal coat is presently providing surface continuity for the pavement. The department has plans for an overlay using a more moisture-resis-tant asphaltic concrete. The present asphaltic con-crete is 0.35 ft thick. This pavement has internal characteristics similar to the Idaho pavement, 1-15, evaluated in Phase I of the research project. Lab-. oratory specimens represented the bottom lift. (The Idaho pavement had retained tensile strengths of about 40 to 50 percent for these cores that could be obtained in a suitable condition for test.)
NB-i (Nebraska). Loss of material from the pave-ment surface after the first winter was significant in spite of the addition of hydrated lime to the mix
during the original paving in 1967. An armor coat was applied to the pavement surface in 1968, providing a satisfactory wearing surface as a tem-porary remedy to the problem. Laboratory specimens represOnted.the bottom lift.
OR-i (Oregon). Present serviceability is good. The surface has been sealed because of loss of surface aggregate in the wheeltrack area and longi-tudinal cracking. Some cracking with surface ravel-ing of the cracking has occurred. Laboratory speci-mens represented the bottom lift.
SD-i (South Dakota). The pavement presently consists of two 27n, lifts of asphaltic concrete constructed in 1968. The present surfacing is showing considerable raveling and "pop outs" of the coarse aggregate, apparently related to moisture-induced stripping. Also, some random cracks (es-timated at 3 cracks per 100-ft section), 15 to 30 in. in length and approximately 1/8 in. in width, are developing in the surface. The cracks do not presently extend completely through the 4-in, thick-ness and may or may not be moisture induced. Main-tenance forces applied a "Reclamite" treatment to the surface the week before the cores were obtained in the hope of reducing future surface raveling and crack development. Laboratory specimens represented the bottom lift.
TX-i (Texas). Severe moisture damage (stripping) was noticed by the Texas Highway Department in the lower construction lifts of this pavement. The pavement presently consists of several construction lifts of asphalt concrete: 1961 (1st lift), 1965 (2nd lift), 1968 (3rd and 4th lifts over a seal coat on the 2nd lift). Laboratory specimens represented the bottom lift.
1Y-1 (Wyoming). In October 1972, this 1962-constructed pavement had alligator-type cracking and the asphaltic concrete mix showed severe stripping. Wyoming highway engineers indicated that the strip-ping occurs on slick cleavage planes of the feld-spar crystals and particles of mica in the mix ag-gregate. The aggregate is a decomposed granite. Stripping severity seems to be associated with traf-fic volume. Laboratory specimens' represented the bottom lift.
CA-2 (California). This 1970-constructed as-phaltic concrete pavement is without visible signs of moisture distress. It was placed in three lifts, each approximately 0.16 ft deep. The pavement has no seal coat. The area has an annual rainfall of approximately 19 in.; the ambient temperature range is 45 F to 75 F. Aggregate used was a sound basalt from nearby. Tests indicated the aggregate and asphalt not to be susceptible to film stripping. Laboratory specimens represented the bottom lift.
CO-2 (Colorado). This 1968-constructed asphaltic concrete pavement (two 1½-in, lifts) appears to be in very good condition with no visible signs of moisture distress. Laboratory specimens represented full pavement thickness.
NJ-2 (New Jersey). This 1969-constructed as-phaltic concrete pavement surface (two 1½-in, lifts) is without significant visible signs of moisture distress although some lamination due to clay in the fine aggregate was noticed. The surface was there-fore overlayed (approximately ¼ to ½ in.) at a later date. The cores and laboratory specimens represent the original pavement surface.. Coarse aggregate used was a 3/8-in. maximum size gneiss; fine aggre-gate used was unprocessed bank run sand; pulverized limestone mineral filler was used, as was AC-20 asphalt. Laboratory specimens represented the upper lift of the original construction.
OH-3(Ohio). This 1972-constructed asphaltic concrete pavement was judged by the Ohio Department

[I]
TPJ3LE C-2
1) DIIJIIfCF 1tNSICN TEST IJLTSfOR COS LW SFECINS OF SECC1D PHASE OF S1JDY
Core Test Results
Pavement Tensile Strength E-Modulun/(103) Tensile Strength Identity - Year Test - 2) 2) Per- 2) State and Built Temp. Dry Vscuum Ratio Dry Vacusm Ratio rseable Dry Vacuum Ratio V.S.+Freeze Category - Saturated j5 - Saturated (E-Mod-R) Voids - Saturated 1I1 (OF)+Soak(14OF)
F psi psi psi psi psi e psi psi P5
AK-1 3) 1966 55 112 106 0.93 160 210 1.30 - 61 66 1.08 55 (so) (78) (So) (65) (2.5) (3.1) (6.3)
6) 55 68 66 0.95 132 158 1.12 9.0 (13.5) (25.0) (6o) (69)
3) 73 51 57 1.12 31 Si 1.30 5.0 28 31 1.10 27 (19.3) (26.7) (15) (28) (1.8) (1.0) (1.8)
6) 73 38 33 0.87 52 27 0.51 9.0 (11.0) (7.2) (31) (12)
00-1 1969 55 116 116 1.0 353 286 0.81 6.5 68 59 0.87 37 (13.2) (26.6) (38) (66) (8.5) (6.0) (7.2)
73 60 71 1.18 78 72 0.92 So 33 0.82 22 (10.6) (6.0) (17) (15) (2.6) (So) (2.3)
MT-1 1960 55 118 55 0.37 759 212 0.28 6.9 65 So 0.63 13 (29) (12) (385) (176) (3) (0)
73 59 25 0.51 125 35 0.28 35 21 0.60 6 (26) (10) 155 18 (2) (1)
NB-1 1967 55 89 88 0.99 101 113 1.12 5.0 72 55 0.75 So (6.6) (16.9) (15) (13) (5.0) (s.6) (S.$)
73 65 55 0.69 85 62 0.76 40 32 0.80 28 (11.3) (13.6) (6) (1) (6.5) (3.0) (3.2)
OR-1 3) 1967 55 166 121 0.73 1,000 600 0.60 3.7 120 100 0.83 71
5) 55 100 61 0.61 590 327 0.67 6.5 - - - 3) 73 100 60 0.60 235 51 0.22 3.3 55 53 0.98 26
5) 73 58 29 0.60 85 55 0.53 7.1
SD-i 3) 1968 55 128 127 0.99 985 1.090 1.10 6.9 76 27 0.36 18 (18.3) (10.3) (113) 566 (3.3) (8.$) (9.5)
5) 55 116 95 0.82 59-, 585 0.82 7.9 (15.2) (3.3) (207) (90)
3) 73 79 70 0.89 131 250 1.91 35 11. 0.31 5 (6.0) (3.6) (7) (Ss) (3.6) (2.7) (0)
5) 73 85 65 0.77 233 181 0.78 (6.2) (9.5) (is) (70)
TX-1 1961 55 60 18 0.30 561 133 0.29 6.3 55 52 0.78 13 (22.2) (5.0) (560) (95) (5.5) (3.5) (2.0)
73 29 7 0.26 106 10 0.09 29 26 0.90 7 (s.$) (1.8) 2 2 (3.5) (ii) (o.$)
WY-1 1962 55 76 36 0.66 266 131 0.53 3.7 67 58 0.87 45 (5.8) (5.3) iSS 53 (S.) (2.1) (3.2)
73 50 25 0.60 51 29 0.72 35 35 1.03 31 (2.8) (2.2) (15) (s) (5.0) (2.0) (2.9)
CA-2 1970 55 102 100 0.98 603 513 1.02 6.0 67 68 1.02 65 (9) (11) (59) (85) (3) (3) • (8)
73 52 fl 72 62 0.87 39 37 1.06 33 (3) ()1) 0.98 (26) (19) (s) (5) (2)
00-2 1968 55 110 105 0.95 188 251 1.36 2.5 109 106 0.97 93 (7) (16) (s8) (39) (9) (12) (2)
73 73 79 1.08 59 51 1.05 62 62 1.00 56 (6) (25) (8) (29) (s) (5) (3) NJ-2 1969 55 uS 85 0.76 157 110 0.79 4.5 71 72 1.01 57
(3.5) (20.5) (iS) (33) (7.0) (2.6) (6.5) 73 66 71 1.10 53 45 1.06 53 S. 1.05 25
(3.0) (9.6) (6) (8) (5.0) (5.2) (3.3) 011-3 1972 55 60 63 1.05 72 70 0.98 8.8 52 55 0.85 25
(iS) (6) (17) (io) (s) (s) (3) 73 39 (9)
50 (8)
1.03 314 (5)
30 (6)
0.90 22 (1)
23 1.05 18 () ()
1972 55 99 93 0.96 135 110 0.82 1.5 116 100 0.86 108 (.$) (14.2) (58) (10) (6.2) (1.6) (15)
73 52 53 0.83 63 22 0.35 50 53 1.06 52 (5.5) (8.5) (22) (6) (1.3) (5.o) (11.7)
Reported results are generally averages for four cores or L-'- ory specimens. Conditioned.
Dry Wearing-course cores.
5) Binder-Course cores. 5) Standard deviation, psi, in parenthesea.

Laboratory Test Results
Tensile Strength 2)
Ratio V.S.+lBcycles Ratic Dry Vacuuni Ratio R)
2c v.S.+Freeze )oak (1I40F
Ratio vs+ ycleS __ -O
psi
Ratio
(.)B). 0-120-OF (TSR) 5atrated psi psi psi psi
0.90 53 0.87 67 76 1.10 69 1.03 67 (13)
1.00
(3.0) (7) (7) (19)
0.97 27 0.97 36 22 0.66 29 0.87 36 (9)
1.07
(14.0) (5) (2) 6
0.56 12 0.18 156 157 1.01 108 0.69 lii (io
0.26
(1.14) (13) (17) (214) 16 0.25 6 0.09
0.55 8 0.20 66 36 0.53 (2) (0.3)
(1.7) (13) (8)
0.20 10 0.16 1714 121 0.69 107 '17)
0.61 36 0.20
(3) (31) (31) 0.10 4 0.08 0.17 6
(i) 0.17 52
(20) 16 (2)
0.30 (i) (i)
0.56 11 0.15 1140 132 0.96 162 (59)
1.01 38 (6)
0.27
0.70 (0.3)
7.0 0.18 (16) 36
(28) 28 0.78 10 0.27 11
(i) 0.11
(0.6) () () (2)
0.59 75 0.62 211 175 0.83 103 0.69 96 0.65
0.59 26 0.62 147 39 0.83 16 0.33 12 0.26
0.26 17 .22 172 173 1.01 105 (9)
0.61 77 (65)
O.Lc
(10.1) (6) (98)
0.114 5 0.16 37 13 0.36 9 0.25 6 0.16 (i) (3)
0.214 11 0.20 88 66 0.53 314 0.38 32 0.37 (0.5) (26) (6) (6) (5) O."i 7 0.26 29 17 0.61 5 0.17 6 0.21 (0.5) (5) (14) (2) (0.14)
0.67 37 0.55 93 99 1.06 62 0.66 58 0.62 (14.7) (20) (314) (16) (10)
0.92 29 0.85 30 28 0.93 21 0.70 23 0.77 (2.6) (8) (3) (7) (8)
0.95 63 0.914' 122 120 0.98 86 0.69 90 0.76
(5) (37) (23) (22) (17) 0.96 314 0.97 28 29 1.014 15 0.53 20 0.73
(5) (3) (14) (6) (3)
0.85 107 0.98 260 200 0.80 208 0.80 260 0.98 (11) (61) (0) (13) (67)
0.90 51 0.82 50 60 1.21 1414 0.88 1414 0.89 (6) (11) (10) (5) (7)
0.66 62 0.59 76 62 0.82 57 0.75 66 0.61 (2.2) (8) (8) (7) (5)
0.56 27 0.63 29 26 0.89 13 0.116 13 0.146 (2.6) (6) (7) (1) (i)
0.66 314 0.65 60 314 0.714 39 0.85 28 0.60 (6) (9) (6) (19) (7)
0.82 16 0.73 ii 9 0.814 7 0.65 7 0.67 (2) (2) (2) (0.14) (1)
0.93 99 0.85 233 213 0.91 233 1.00 200 0.87 (21) (51) (66) (25) (25)
1.011 39 0.78 31 26 0.83 29 0.91 19 0.00 (7.3) (8) (2)

42
of Highways to be possibly sensitive to moisture, pri-marily due to the silica sand aggregate used in this mix, although records show little or no major problems with similar mixes made with the silica sand. Lab-oratory specimens represented full pavement thickness.
TX-3 (rexas). This 1972-constructed asphaltic concrete pavement was jduged by the Beaumont District to be potentially sensitive to moisture, primarily due to the type of aggregate used in this area. Lab-
oratory specimens represented full pavement thickness. The results of tests performed on cores and lab-
oratory specimens during the pilot evaluation phase of the project are given in Table C-2. Procedures followed in sampling, preparing specimens, and test-ing were as outlined in Appendix A. Where the term "core" appears in the tabulations, it applies only to the portion of the extracted core representing the layer of interest.

APPENDIX D
43
VISUAL CHARACTERIZATIONS
A MICPSCOPY EXAMINATION PROCEDURES Four-inch pavement cores obtained from the
two Arizona pavements, three Idaho pavements, and one Virginia pavement were tested in the indirect tension test at 55 F, 0.065 in./min vertical defor-mation rate, in both dry and vacuum-saturated con-ditions. Tensile strengths and E-moduli, and TSR and E-mod-R values, were determined as described in Appendix A.
Visual characterization of the fractured core surfaces were also obtained using scanning electron microscopy (with micrographs) as soon as possible after tensile testing. Microscopy specimens used were about 1 to 1 1/2 in. in diameter, glued to a specimen support and covered with a thin evaporated film of gold to provide an electrically conducting surface. These specimens were examined directly in the scanning electron microscope. Careful evaluation of surface detail under prolonged microscope examina-tion showed that the structures observed at up to more than 2,000x magnification were not affected by the microscope vacuum or the electron beam. When not in the microscope, the specimens were kept sealed in plastic bags; no significant changes in character of the fracture surfaces occurred during storage. The entire surface area was examined to determine "average" or "normal" conditions on each specimen, and several micrographs were prepared. Stereo electron microscopy was commonly utilized to study the three-dimensional characteristics.
The instrument used was a JEOLCO scanning elec-tron microscope Model JSM-U3 with television display and dual CRT readout systems. Observations were conducted mainly in the range from 35x to 1000x, allowing both visual "averaging' of structural fea-tures due to heterogeneous-component aggregate, and detailed examination of asphalt-aggregate interfaces.
A reference base of mechanical-physical-micro-visual data was obtained for each of the six pave-ments (via cores).
Laboratory-fabricated specimens were made with the objective of duplicating the pavement mix constituents and physical properties. Standard 47in.-diameter by 2.5-in. -high specimens were made for the thermal-cycle and water-soaking tests. Four-inch-diameter by 8-in. -high specimens were made for re-peated-load tests.
Microscopy evaluation of dry and water-conditioned laboratory specimens was accomplished by the same techniques as described previously for cores. The procedure was to compare or match the results to the pavement-core test results with the objective of assisting in selection of the best laboratory mois-ture-conditioning procedure.
B. RESULTS OF MICROSCOPY EXAMINATION 1. Three types of features were found in the
microscopy examination to give a good comparison of the nature of moisture damage in each of the materials studied: (1) the nature of the asphalt itself;(2.) the extent of unbonded surface of aggregate; and (3) the nature of the interface area between asphalt and aggregate particles.
a. Pavement COres: On the saturated ID-1 pave-ment cores, the fractured surfaces were mainly asphalt-free, with a prominent space between most of the asphalt and aggregate, and relatively little bonding of asphalt and aggregate in any area. The asphalt generally was dry and brittle, but still cohesive. There was no evidence of aggregate fracture.
On the same ID-i pavement cores in the dry con-dition, most of the aggregate surfaces were partially coated with thick fingers of asphalt randomly inter-laced around the aggregate surfaces. The asphalt was smooth and plastic in appearance, well bonded at its interfaces with:-the aggregates. There was a strong tendency to bridge between aggregate and as-phalt matrix, but where the aggregate surfaces were asphalt-free, the aggregate was clean and similar to the aggregate in the saturated cores.
The as-received cores of the same ID-1 pavement were intermediate in appearance between the dry and saturated specimens described. Cracks usually oc-curred between aggregate and asphalt, and the remain-ing asphalt was semi-plastic in appearance with some brittle features. Asphalt and aggregate were spottily attached with some plastic bonding; the over-all anpearance definitely suggested a transition stage between the wet and dry extremes.
Figures 11-1 through D-4 show typical micrographs of the Idaho pavement cores and laboratory-conditioned specimens.
The AZ-2(E) and AZ-l(W) pavement cores were of a completely different nature. Visually, these mater-ials had a very sandy texture, apparently due to the high percentage of aggregate fines. In the saturated AZ-i(W) cores that contained no additive materials, the many small grains distributed through the asphalt matrix had no apparent bonding to the asphalt. The asphalt itself was dry, flaky, and granular on all exposed surfaces of the aggregate. The same mater-ial, when completely vacuum dried, showed a disper-sion of asphalt fingers over the aggregate surfaces, similar to that observed in the dry ID-1 cores. The same asphalt appeared to be rather poor; it had a low density and frothy consistency, with most of the individual sand particles still very much in evidence.
In contrast, the saturated AZ-2(E) cores with lime-slurried aggregate showed only partially ex-posed aggregate surfaces in asphalt-free islands. There was good bonding between the aggregate and asphalt in other regions, and the asphalt was smooth, plastic appearing, with some surface wrinkling. The individual sand grains were not well defined, and the general appearance was of a relatively cohesive ma-terial. When the same pavement material was dried, the sand grains and larger aggregate particles be-came well-defined again; however, they were completely asphalt covered with a thin, but intact, layer mold-ing itself around the underlying rock surfaces. There was a moderate porosity evident between aggre-gate and asphalt, but good bridging still existed with plastic-looking asphalt.
The differences between saturated and dry micro-structure in the AZ-2(E) and AZ-l(W) cores correla-ted well with the observed changes in tensile strength. For AZ-i (W) with no lime slurry the microstructure appeared stronger when the specimen was dried, with an increased plasticity and adherence of the asphalt to aggregate surfaces. In the presence of lime slurry in AZ-2(E), the opposite reaction occurred; that is, in the saturated condition the asphalt was a continuous phase and the aggregate particles were not well exposed. Drying this same material de-creased the apparent bond strength of the asphalt phase, although it still maintained a good adhesion in a thin layer to the aggregates present.
The VA-2 cores provided yet another type of fracture surface. In the saturated cores, the frac-ture surfaces were completely covered with plastic

'4.::. •:
w;ç -•:;
..
!• •.4
Figure D-2. Microstructure of Dry ID-I Pavement Core, SEM Micrographs; magnification 70s (inset 200x). When asphalt is dry, fractures surfaces usually do not show moisture-damage effects, consistent with the higher tensile strengths also observed in the dry state. Asphalt ad-herds to the aggregate (ace inset) and appears plan tic.
Note: Micrographs in Figures D-1 through D-6 reduced 50 percent in publication.
Figure 0-2. Micros tructure of Saturated ID-i Pave-ment Core, SEM Micrographs; magnifica-tion 70x (inset 200x). The fracture character of a highly moisture-danaged mix differs markedly from the dry frac-ture. Most of the aggregate surface of a vacuum-saturated core is entirely stripped of asphalt (ace mast) and wide cracks occur between asphattic mastic and aggregate. Much of the bulk asphalt has a dry brittle appearance.
Figure D-$. Idicrostructure of Thermal-cycled ID-i Laboratory Specimen, SEM Micrographs; mag-nification 70s (inset 200x). Good dupli-cation of pavement-core fractures occurs when the specimen is vacuum saturated and thermal cycled at 0-120-0 F for 18 cycle8. The aggregate is largely bare and brittle asphalt is only loosely bonded to the aggregate (see inset)
Figure D-4. Micros tructure of Load-C2cled tO-i Lab-oratory Specimen1 SEM Micrographs; mag-nification 70x (inset 200x). Load-cycling a saturated specimen at constant temper-ature of 105 F does not always reproduce the moisture damage. In this case smooth asphalt coverage is generally retained on the fracture surface (see inset), but cracks open up in the asphalt alongside aggregate.

145
Figure D-5. Microstructure of Saturated VA-2 Pave-mnt Curve, SEM ?f .ruJ2uj&s, ifiL , ficot ton 70x (inset 200x). All fracture surfaces remain completely covered with plastic asphalt except for some bare aggregate cleavage surfaces (see inset). This may be an exconple of the asphalt-aggregate bond appearing stronger than the aggre-gate itself.
asphalt, except for scattered cleavage plane areas that are completely asphalt-free. The continuous asphalt phase appeared to be responsible for the moderately good tensile strength of this material, but the clean cleavage planes appeared to be due to failure of the aggregates themselves, rather than asphalt debonding. Some of the asphalt was very thin, showing outlines of the underlying aggregate sur-faces, but the weakest link in this material was probably the aggregates thcmsclvcs, which tended to break along cleavage planes rather than debonding at the asphalt-aggregate interface.
Figures 1)-5 and D-6 show the microstructure of a VA-2 pavement core and a laboratory-conditioned specimen.
b. Laboratory Moisture-Conditioned Specimens: Evaluation of —the laboratory-prepared specimens was conducted in part by comparison of the microstnicture of the specimens with the pavement core being dupli-cated. A wide variation of microstructures resulted from the various conditioning methods, but in the case of the ID-i specimens the best structural match definitely occurred with the 0-120-0 F cycling. The surfaces of most of the aggregate in the water-saturated specimens were almost entirely hare, and only partially bonded to brittle asphalt along the sides. Some plastic asphalt appears in scattered area on the aggregate particles (see Fig. I)-3).
In contrast, load cycling alone under the 105 F undrained condition produced almost no stripping or debonding of asphalt from the aggregate, although prominent cracks opened up alongside most of the ag-gregate grains. The asphalt was entirely smooth, with none of the brittle areas normally encountered
Figure D-6. Microstructure of Thermal-Cycled VA-2 Laboratory L'pectmcn, SEM ''tcrcgrapho; maification 70x (inset 200x). The specimen's fracture surfaces remain asphalt-covered with some of the scene aggregate cleavage as occurring on sat-urated pavement cores (see inset).
in moisture-damaged materials. There was some evi-dence of aggregate fracture with flat surfaces and river patterns (see 1:ig. 11-4).
The third combination of conditions, sequential application of load cycling and thermal cycling, resulted in much overemphasized moisture-damage con-dition. Most of the aggregate surfaces were com-pletely devoid of asphalt, and the interfaces with asphalt showed extremely poor bonding. The asphalt was cntircly of a brittle nature.
The AZ-2(E) specimens, on the other hand, were best simulated by the 40-120-40 F thermal cycling. General but not complete bonding occurred between all of the aggregates, with a heavy plastic asphalt cover on all surfaces. Most surfaces were of the smooth plastic type, closely resembling the pavement specimens. More extreme 0-120-0 F thermal cycling produced incomplete bonding between aggregate and asphalt, and left the asphalt with a semi-granular coarse appearance. The asphalt coating on the aggregate was discontinuous and patchy and less plas-tic and smooth than in the pavement, although void volume was similar to that in the pavement cores. Load cycling achieved virtually no debonding or stripping of the asphalt; all aggregate surfaces remained well covered. More asphalt-free void volume between the aggregates occurred than in the pavement, and the asphalt generally had a very wrinkled appearance. There was good bonding over-all, somewhat resembling the pavement cores.
In the AZ-1(W) specimens, application of the 0-120-0 F thermal-cycling condition resulted in almost entirely stripped aggregate surfaces, still interconnected somewhat with granular thin asphalt.

0. Some plastic asphalt was still evident, more than oc-curred in the pavement materials. Application of a dry preheating cycle followed by load cycling resulted in a better resemblance to pavement conditions, with most aggregate surfaces being ccmpletely bare on both top and sides. Very little asphalt occurred around most of the aggregate surfaces, but the as-phalt present was mostly granular with. only an oc-casional smooth plastic surface in evidence. most of the remaining aggregate was Ttfree_standing .?t
In the VA-2 cores, the best match occurred with 0-120-0 F thennal cycling, resulting in an aggregate covered with a thin asphalt layer revealing the underlying aggregate surfaces. Scattered areas of flat, very smooth surfaces also occurred, with frac-ture patterns and clean surfaces showing the crystal-line surface, apparently due to aggregate fracture similar to that observed in the pavement material
itself (see Fig. D-6). A somewhat similar appearance occurred with the cycling after preheating, but the asphalt was extremely wrinkled.
It was concluded from the microstructure study that the micrOstructUre and tensile measurements showed good agreement qualitatively in all specimens and that the tensile-strength measurements, there-fore, could be relied on to indicate that a simple visual observation of the broken specimen surface is.not always a reliable indication of the extent of debonding. For example, in many cases the very thin aspahlt layer was found to be highly effective in maintaining specimen strength. but a microscopic observation is necessary to verify the presence of the asphalt. Therefore, although an observation of a fractured surface is undoubtedly helpful to the experienced field engineer, it cannot always be relied on to give sufficiently precise data for performance predictions.

THE TRANSPORTATION RESEARCH BOARD is an agency of the National Research Council, which serves the National Academy of Sciences and the National Academy of Engineering. The Board's purpose is to stimulate research concerning the nature and performance of transportation systems, to disseminate information that the research produces, and to encourage the application of appropriate research findings. The Board's program is carried out by more than 150 committees and task forces composed of more than 1,800 administrators, engineers, social scientists, and educators who serve without compensation. The program is supported by state transportation and highway departments, the U.S. Department of Transportation, and other organizations interested in the development of transportation.
The Transportation Research Board operates within the Commission on Sociotech-nical Systems of the National Research Council. The Council was organized in 1916 at the request of President Woodrow Wilson as an agency of the National Academy of Sciences to enable the broad community of scientists and engineers to associate their efforts with those of the Academy membership. Members of the Council are appointed by the president of the Academy and are drawn from academic, industrial, and govern-mental organizations throughout the United States.
The National Academy of Sciences was established by a congressional act of incorpo-ration signed by President Abraham Lincoln on March 3, 1863, to further science and its use for the general welfare by bringing together the most qualified individuals to deal with scientific and technological problems of broad significance. it is a private, honorary organization of more than 1,000 scientists elected on the basis of outstanding contribu-tions to knowledge and is supported by private and public funds. Under the terms of its congressional charter, the Academy is called upon to act as an official—yet indepen-dent—advisor to the federal government in any matter of science and technology, although it is not a government agency and its activities are not limited to those on behalf of the government.
To share in the tasks of furthering science and engineering and of advising the federal government, the National Academy of Engineering was established on December 5, 1964, under the authority of the act of incorporation of the National Academy of Sciences. Its advisory activities are closely coordinated with those of the National Academy of Sciences, but it is independent and autonomous in its organization and election of members.

TRANSPORTATION RESEARCH BOARD National Research Council
2101 Constitution Avenue, N.W. Washington, D.C. 20418
ADDRESS CORRECTION REQUESTED
NON.PROFIT ORG. U.S. POSTAGE
PAl D
WASHINGTON, D.C.
PERMIT NO. 42970
N 0
>-rn
Li. 0
> 0
c uj 0
z a' w ON
0t' <N 0_i x
< 0
-4 cc 0w ow = v, 0)— <Q 0< 00 QE