Beyond the Rubicon - McKinsey
34
Global Banking & Securities Practice Beyond the Rubicon North American asset management in an era of unrelenting change November 2019
Transcript of Beyond the Rubicon - McKinsey

Global Banking & Securities Practice
Beyond the RubiconNorth American asset management in an era of unrelenting change
November 2019

1Beyond the Rubicon: Asset management in an era of unrelenting change
Authors and acknowledgements
Pooneh BaghaiSenior Partner, New York and Toronto [email protected]
Kevin ChoAssociate Partner, New York [email protected]
Onur ErzanSenior Partner, New York [email protected]
Ju-Hon KwekPartner, New York [email protected]
The authors would like to acknowledge the contributions of Jacob Dahl, Joe Ngai, John Qu, Miklos Dietz, Miklos Radnai, Yihong Wu, Nikhil Gupta, Zoe Huang, and Andrew Lu to this report.

2Beyond the Rubicon: Asset management in an era of unrelenting change
Beyond the Rubicon: Asset management in an era of unrelenting change “If we want everything to remain as it is, everything needs to change.” —Tancredi Falconeri1
Any question as to whether North American asset management has undergone a fundamental phase shift should have been put to rest in 2018 (and 2019 thus far). The period served up a heady mix of macroeconomic shocks to the financial markets as well as changes in the industry, spurring revenue and profit pressure for firms across the sector. While average assets under management (AUM) in North America edged up nearly 7 percent for 2018 to $43 trillion, the industry’s aggregate revenue pool gained just 1 percent and, facing a rising cost bill, industry profits fell nearly 4 percent. Net flows for the year were anemic, and the drop in both equity and bond markets late in the year made for a weak fourth quarter and a challenging start to 2019.
The macro environment of 2018 was a source of both opportunity and outsized challenge to asset managers. Volatility established itself as a near-constant fixture of the new environment, with the markets increasingly influenced by the whims of central bank policy, geopolitical tensions, and frictions in global trade.
An industry in structural transitionA set of now familiar industry forces continued to redraw the asset management landscape, and their impact was accelerated and intensified by the stresses of the macroeconomic environment. Six major themes played out in North America over the course of 2018:
— An intensifying search for yield and diversification, as institutional and retail
clients alike faced the realities of a “lower for longer” environment in global economic growth and interest rates. In addition, volatility in the financial markets diminished investor willingness to fulfill their funding needs primarily with public market beta. These developments have in turn encouraged meaningful growth in demand for yield-generating assets such as credit, as well as for private market investments such as infrastructure and real estate.
— A continued challenge to active management in the public markets, particularly in domestic equities. The overwhelming influence of interest rate policy led not only to heightened volatility, but to continued high correlation among stocks as well, further eroding the foundations of fundamentals-based security selection and raising questions in clients’ minds about the sustainability of alpha generation in some large, highly-efficient markets. In addition, the continued rise of an elite group of technology-powered and data-enabled investors created formidable competition in pursuit of alpha. In 2018 some 70 percent of assets in domestic equities underperformed their passive equivalents on an after-fees basis—adding to the pressures on this already-beleaguered sector and accelerating the shakeout of underperforming active equities managers.
— A power shift in favor of distributors and intermediaries. Market reactions to macroeconomic shocks have elevated the
1 From Il Gattopardo (The Leopard), a 1958 novel set during the 19th-century unification of Italy. Tancredi, a young noble caught up in the Risorgimento movement, offers this restructuring advice to his uncle, an old-school Sicilian prince who struggles between preserving traditional aristocratic values and adapting to new customs to hold onto his family’s wealth and influence for the future.

3Beyond the Rubicon: Asset management in an era of unrelenting change
importance of portfolio construction as a source of returns and resilience. Accordingly, investors have turned to specialists—advisors who deliver model portfolios in the retail market, outsourced CIO services among institutions, or expanded in-house asset allocation teams—expanding the role of professional gatekeepers. These moves have significantly raised the bar on manager performance, ratcheted up demands for transparency, and increased fee sensitivity in the industry, further amplifying the dynamics of product commoditization.
— Emergence of a new paradigm for pricing. Pressure on fees has been a consistent competitive theme over the past few years, but it reached a record high in 2018, bringing average declines in management fee rates over the last five years in the 6-to-9 percent range. Moreover, a few managers launched experiments with zero fees on a handful of retail products in a bold attempt to draw flows. In addition, growing demand for product delivery through vehicles like separately managed accounts and model portfolios, along with rising interest from distributors in sub-advisory mandates, created additional structural sources of pressure. Fee levels have become a more important factor in client purchase decisions, as the familiar winning formula of “good performance at a fair price” shifted to a new value equation of “good performance at the best price.”
— An untethering of costs from revenues, as the complexities of legacy operating models, the proliferation of products, the increasing demands of serving clients, and a growing legal and regulatory burden added to the fixed costs of doing business. In the current environment of low growth in AUM and revenues and clients’ sensitivity to fees, operating costs are an increasingly important item on the industry’s strategic agenda, as asset managers contemplate retooling and simplifying their operating models for a new era.
— Continued importance of scale and scope. Across multiple product and vehicle categories, net flows continued to drift in favor of managers benefiting from scale (with the ability to deliver products at low cost) and scope (with the ability to serve as anchor providers across a broad range of their clients’ needs). Moreover, industry consolidation gathered steam as managers sought to extend their presence in high-growth
areas like alternatives and ETFs via acquisitions and through combinations to create more efficient and scaled operating platforms. But size alone—particularly when measured with blunt metrics like assets under management—was no guarantor of success in the increasingly competitive arena of North America. In fact, 2018 was a year in which even some of the industry’s “trillionaires” faced outflows.
The market’s responseThe capital markets have been tracking these developments closely and casting their votes through valuations. In 2018 stock prices of publicly listed asset managers hit historical lows—both in absolute and relative terms—trading in a range of 10 to 12 times earnings. This modest valuation was a sharp reversal from the baseline of the past 10 years, when asset managers earned historical valuations of 14 to 18 times—a meaningful premium relative to the broader financial services sector and even to the market as a whole.
In our conversations with market participants and investors, the single most pressing issue clouding the industry is a perception that growth has hit a wall. Some have gone so far as to characterize the new world of asset management in starkly Darwinian terms—as a zero-sum game where growth will come only from the strong taking share from the weak.
Whither growth? While industry flows have indeed slowed across the board and economic pressures are real, it would be a mistake to assume a complete drought of new growth opportunities for individual asset managers. Indeed, 2018 illustrated the power of the macroeconomic environment to put significant amounts of money into motion across several fronts, including healthy demand for fixed income as a foil against volatility; private markets as a source of idiosyncratic returns; portfolio-level solutions (for example, outsourced chief investment officer and liability-driven investment mandates) to help manage complex liabilities in the face of uncertain markets; and innovative vehicles such as ETFs as tools for delivering precision intraday risk exposures.
Casting an eye further into the future, we see a set of longer-term fundamentals in place to restore the industry to a steady heading of growth. Asset management thrives where three conditions are present: sustained wealth creation; a set of growing

4Beyond the Rubicon: Asset management in an era of unrelenting change
2 We borrow this concept—by way of analogy—from a September 2015 speech by Mark Carney, Governor of the Bank of England, “Breaking the tragedy of the horizon – climate change and financial stability.”3 See Patrick Viguerie, Sven Smit, and Mehrdad Baghai, The Granularity of Growth: How to Identify the Sources of Growth and Drive Enduring Company Performance, Wiley, 2008.
retirement needs; and room for the deepening of financial systems.
All of these conditions currently hold in North America. A robust economy and ecosystem of innovation continue to be sources of wealth. A 75 million-strong cohort of baby boomers—the first generation to own the risk of their own retirement—is beginning to exit the workforce, bringing a new pool of retirement assets and seeking a means to manage them. Furthermore, other major societal challenges like climate risk and the infrastructure gap are crying out for massive financing solutions. And as professional management has penetrated just 25 percent of global financial assets, there remains tremendous room for growth in both developed and emerging markets. Overlaid across all these factors is the reality that investing has become far more complex in the current macroenvironment, making it more challenging for many groups of investors to “do it themselves.” Put simply, the conditions are in place for a new narrative of growth; however, the industry needs to write it.
A tragedy of horizons?2 The fundamental challenge for the North American asset management industry is therefore not simply one of where to find growth, but perhaps more importantly how to manage growth in the context of a multispeed portfolio of business, both old and new.
McKinsey’s research in the field of corporate strategy suggests that up to 80 percent of a company’s growth typically comes from its decisions about “where to play,” with the remainder coming from its decisions on “how to compete.”3 The analogies of this broad cross-industry observation to the asset management are clear. In the midst of a rapidly transforming industry, asset managers that succeed in pivoting towards areas of the market that are poised for secular growth will benefit from meaningful tailwinds. Yet even among managers who are aggressively pursuing these new growth opportunities, most are saddled with a large base of legacy assets for which there is anemic new demand, but which nonetheless remains a meaningful source of ongoing revenue that sustains their franchises.
As an example, the challenges that actively managed equities have faced over the past few years are well documented, as are the secular factors that have been encouraging outflows. Yet the asset class remains an outsized part of the industry—representing 31 percent of revenues in 2018. And it is not going away anytime soon: Even assuming a continuation of current performance and flow challenges, active equities are still expected to account for over 25 percent of revenues in 2023. Sustaining a near-term competitive position amid these shrinking but sizeable revenue pools, while investing in new capabilities and pursuing new sources of growth, is a challenge in management dexterity.
These conditions create a classic tension between defending the old and investing in the new. The risk at hand is a self-inflicted “tragedy of horizons,” where near-term pressures to defend profitable legacy businesses create organizational stasis which inhibits a investments in new capabilities and a structural pivot in business mix and practices in favor of longer-term growth.
Remaining in a defensive crouch trying to weather the storm of structural change is rarely a winning formula. In our view, then, current depressed industry valuations are not signaling a sector with fundamentals that are in inexorable decline. Instead, they reveal a broken connection between old business models and the realities of a new world.
But today’s valuations are by no means destiny. While the industry as a whole may have been slow to respond to secular trends, forward-looking firms have laid out decisive plans on where to compete, and how to win. The gap between the winners and losers is wide, but the capital markets still recognize and reward growth and profitability.
Five strategic questionsIn this report we explore the themes outlined above through the lens of five questions that we know are on the minds of most, if not all, asset managers in North America:
— Are the industry’s economics as pressured as the capital markets seem to think?

5Beyond the Rubicon: Asset management in an era of unrelenting change
— Where are the biggest structural shifts in demand?
— Is the industry in a race to the bottom on fees?
— Where is the industry in the journey to spur productivity and operating leverage?
— Which types of firms are positioned to win, and why?
The investment management competitive ecosystem continues to evolve with great pace, and asset managers increasingly face an existential question of who they want to be in the market and what distinct recipe they will use to create value.
Even as the structural shifts in the industry are clear, there is no one-size-fits-all path to success. But there are distinct recipes. At the end of this report, we define four that we believe will find resonance in the new industry landscape:
Sustained alpha generators that set themselves apart through a unique edge in investing and consistent outperformance; broad-based scale manufacturers that meet a full set of client needs and are well-positioned in their cost base by virtue of their size; vertically integrated distributors that leverage their control of the full value chain to capture flows; and solutions providers delivering value through bespoke services designed around individual client needs. When executed well, each recipe has outperformed the industry, and the top performers within these categories have produced striking growth.
North American asset management has entered a period of unprecedented challenges. New opportunities are available, but in order for the industry’s position to stay the same—earning premium growth, profitability, and valuation—everything will need to change.

6Beyond the Rubicon: Asset management in an era of unrelenting change
Are the industry’s economics as pressured as the capital markets seem to think? “Day-to-day fluctuations in the profits of existing investments … tend to have an altogether excessive, and even an absurd, influence on the market. It is said, for example, that the shares of American companies which manufacture ice tend to sell at a higher price in summer when their profits are seasonally high than in winter when no one wants ice.” —John Maynard Keynes
The precipitous fall in US equity markets that took place in late 2018 did not spare the share prices of the asset management sector. In fact, it was hit harder than most, and by the end of 2018, valuations of publicly listed asset managers in North America had sunk to 20-year lows both in relative and absolute terms. Yet this recalibration of valuations was not simply a response to nervous investors fleeing market volatility; it was instead the culmination of a downward trend playing out over the previous 36 months. Equity markets recovered over the course of 2019, but managers’ valuations have remained depressed in relative terms, and the natural question that emerges is whether the industry’s fundamentals have changed so much as to a merit this drastic re-rating.
A historical perspectiveOver the horizon of the past 20 years, current valuations of the asset management sector seem to be a historical aberration, and certainly a marked departure from where the sector traded in the early years of the recovery from the global financial crisis. At that time, asset managers earned a 4 to 6 times premium to other financial services groups (Exhibit 1), as investors were attracted to their capital-light business models and to the sector’s avoidance of the wave of regulation that weighed so heavily on the banking and insurance sectors.
The capital markets’ more favorable previous view of the asset management sector was rooted in the reality of its historical economic performance. Over the past 12 years, asset managers had realized far faster revenue growth than banks and insurers, and sustained that growth with attractive operating margins (in excess of 30 percent across the cycle) (Exhibit 2). While asset managers’ margins have been comparable to other leaders in financial services, the historical view of many investors has been that the operating leverage inherent in asset management should endow asset managers with an embedded call option—not just on the deepening of the broader financial services sector, but also on the natural appreciation of financial assets over the long term.
What’s in a number? The historical paradigm of asset management seems to have come under challenge in the past three years as equity market investors have factored in a number of structural shifts, and taken the view that weakness in the sector will be lasting. Indeed, if taken at face value, current industry multiples imply the expectation of a meaningful slowdown in growth—a secular force greater than the typical cyclical downturn that reverses after a year or two of weak markets. Based on a simple discounted cash flow simulation for the sector, average year-

7Beyond the Rubicon: Asset management in an era of unrelenting change
1 Includes 20 North American firms (equal-weighted). 2 Based on the MSCI All Country World Index Insurance USD. 3 Based on the MSCI All Country World Index Banks USDSource: Thomson DataStream; Capital IQ; McKinsey analysis
Forward price-to-earnings ratio 2001 to March 2019
Typical range(2001-17)
Current(3Q 2019)
14-18X
14-18X
8-13X
9-12X
17X
11X
11X
9X
S&P 500
Insurance2
NA asset managers1
Banks3
2001 2003 2005 2007 2009 2011 2013 2015 2017 2019
18
14
10
6
8
16
20
12
22
Exhibit 1
The asset management sector has been re-priced, with multiples recently hitting 20-year lows.
Source: McKinsey Panorama Global Banking Pools
2007
2018
2013
3% 32%
34%
5% 24%
2%
2%
6% 31%
17.7 36%
0%
Revenue CAGR2013-18
Operating margin2018
Asset management
Investment banking
Market infrastructure
Wealth management
Payments
Corporate and commercial banking
Retail banking
9 6 5
12 1415
6 66
6
2
6 7
2 2
3130
29
36 34
36
Annual global banking revenue, % share
Exhibit 2
Asset management has continued to outperform other sectors in nancial services, particularly in terms of growth.

8Beyond the Rubicon: Asset management in an era of unrelenting change
Note: Implied multiples based on discounted cash-flow analysis (terminal value based on growing perpetuity present value calculated as spread between WACC and revenue growth; WACC = 11%).Source: Thomson DataStream; McKinsey Performance Lens Asset Management Survey; McKinsey analysis
Revenue growth, %
Operating margins, %
27% 29% 31% 33% 35%
0% 8x 8x 9x 10x 10x
1% 9x 9x 10x 11x 11x
2% 10x 10x 11x 12x 13x
3% 11x 12x 13x 13x 14x
4% 13x 14x 15x 16x 17x
5% 15x 16x 17x 18x 19x
Current implied
Exhibit 3
Current valuation multiples are implying roughly 2-3% forward revenue growth, assuming current margins are maintained.
end 2018 valuations of 11 times earnings implied an expectation of just 2 to 3 percent revenue growth rate annually, versus the 6 percent average of recent years, while assuming the industry’s historically high operating margins can be maintained (Exhibit 3). Alternatively, assuming only a slight moderation of revenue growth to 4 percent, current multiples imply a compression of the industry’s profit margin from historical highs of 30 to 33 percent of recent history to the range of 21 to 25 percent.
What has changed so drastically in the market’s view of asset managers’ prospects? One harbinger of change was the decrease in the global industry’s AUM in 2018—the first in ten years, due to an unusual confluence of downturns in both the stock and bond markets, sending a stark reminder that an annual revenue uplift from market appreciation could not be taken for granted. Moreover, the bright spot of organic AUM growth of 2 percent was dimmed, as it was highly concentrated in emerging Asia (particularly China) where significant pools of domestic assets remained inaccessible to global managers. Flows in North America remained tepid, at close to zero organic growth, in line with a trend that had been playing out since 2015 (Exhibit 4).
Revenue and profit growth had started slipping as well: From 2010 to 2014, North American managers as a group saw average gains in revenues and profits of about 10 percent and 19 percent, respectively. Average growth slowed to about 5 percent and 4 percent for 2015 through 2018, notwithstanding a strong year for the markets in 2017. By way of comparison, managers in Western Europe saw similar flattish results, while managers in Asia pulled ahead thanks to strong net flows in local markets (Exhibit 5).
A closer look at North American asset manager results in 2018 reveals the forces behind the profit decline. Interestingly, the drop in profits was not primarily due to a lack of revenues, as AUM and associated fees benefited from relatively buoyant markets early in the year. However, this updraft was offset in equal measure by three sets of unfavorable changes: a reallocation of client portfolios in favor of lower-fee asset classes and strategies (e.g., fixed income and passive mandates); downward pressure on pricing from fee reductions; and a cost base that continued to grow out of proportion to revenues (Exhibit 6).

9Beyond the Rubicon: Asset management in an era of unrelenting change
Source: McKinsey Performance Lens Global Growth Cube (re�ecting 42 country markets); McKinsey analysis
Western Europe North America Developed APAC Emerging Asia Rest of World
0.3 0
2010
2012 2013 2014 2015 2016 2017 2018
2011
Global net �ow growth
0.4
0.2 -0.1 -0.1
0.4
1.4 1.0
0.7
1.1 0.3
0.3
0.4
0.3
0.2
0.2
0.5 0.9
0.8
0.7
0.6
0.5
0.5
0.6 0.3
0.9% 1.6% 1.3% 2.1%
0.8
0.4
0.3 0
0.1 0.1
0.7
0.3
0.3 0
0.1 -0.1
1.1
0.1 0.3 0.1
2.1
0.1
0.1
3.0
0.1
2.1
0.1
-0.1
2.0
0
0
0.2
0.1
0.1
1.8
3.3% 4.4% 2.9% 2.6% 2.0%
Net �ows by major geographic region, $ trillion
Exhibit 4
Organic growth was muted in all global regions in 2018, with the exception of Emerging Asia.
1 Includes 25 countries/regions from North America (2), Western Europe (12), Developed Asia (2), and Rest of Asia (9); analysis does not include GCC (1), CEE (6), Latin America (4), Africa, Belgium, Ireland, Portugal, Luxembourg.Source: McKinsey Performance Lens Global Growth Cube; McKinsey Performance Lens Global Asset Management Survey
Average AUM
North America
Revenue pools
Pro�t pools
Western Europe Asia
100 146 164 174
100151 163 166
100
201 225 244
100 137 156 158100
142 157 158100
249289 318
100 123 154 148100 124 144 141
100
201 240 259
2007 2016 2017 2018 2007 2016 2017 2018 2007 2016 2017 2018
Pro�t pools indexed to 2007, traditional assets under management (AUM) (excludes alternatives)1
Exhibit 5
Industry pro�tability was challenged in North America and Europe.

10Beyond the Rubicon: Asset management in an era of unrelenting change
1 Annual profit pools based on average AUM.Source: McKinsey Performance Lens Global Growth Cube
7.9
2017 pro�ts
Change inasset mix
Change infees/pricing
Changein costs
2018pro�ts
Market performance
Net �ows
44.3
0.8
(3.2)
(3.5)
(3.7)
42.6
$ billion (excludes alternative investments)1
Positive pro�t contribution despite year-on-year AUM decline, as average AUM in 2018 was up by nearly 7%
North American industry pro�t pool growth, 2017-2018
Exhibit 6
North American industry pro t pool shrank by about $2 billion in 2018, despite muted impact of year-end market returns.
So have the markets got it right?The conclusion we reach on this question is mixed. The acceleration of industry pressures is indeed real, so some degree of re-rating for the sector may be rational. Analysts monitoring the industry are expressing a range of legitimate concerns: insufficient controls on costs; an ongoing migration from higher-fee active management to passive strategies; widening size disadvantages on pricing and technology investment for smaller managers; and the emergence of zero-fee products. And all this occurs against a backdrop of widespread expectations of muted returns in the capital markets for years to come.
These pressures are all very real, but most importantly they have created a structural shift in the sources of growth in the industry and in the recipes for success. Slowing growth in AUM and revenues are likely for the industry as a whole, but large long-term growth opportunities wait for innovative managers.
Rather than reflecting a sector in inexorable decline, today’s depressed valuations actually highlight the fundamental disconnect between old business models and the realities of a new world of clients, markets, and competitors. Quite simply, the industry failed to take advantage of the “seven years of plenty” that followed the global financial crisis to restructure itself for the needs of the market and to redefine its narrative of growth in favor of new markets and new sets of client needs. Today’s valuations are telegraphing a message of the failure of outdated operating models, and the dangers of incrementalism—a message that even privately held managers should heed.
Yet valuations are by no means destiny. What lies beneath the industry averages is a massive spread in performance across the thousands of asset managers that compete in North America. While the industry at large has been slow to respond to secular trends, a number of managers have made deliberate pivots in where to play and how to win. The gaps in

11Beyond the Rubicon: Asset management in an era of unrelenting change
4 Interestingly, over this same period, multiples of major alternative investment managers have started to trade at a 20 to 30 percent premium over their counterparts in traditional asset management, an inversion of the trend from previous years, and an indication that the market has begun to recognize some of the secular trends around demand for private market which we discuss in the next chapter.
economics among the winners and losers continue to be quite wide—such as the 18-percentage-point differential in revenue growth between top and bottom quartile managers—and the markets have recognized them. Behind the dismal average
valuation of 11 times is a spread of 5 to 22 times between top and bottom performers, with the ability to sustainably capture organic growth as the best guarantor of valuations.4

12Beyond the Rubicon: Asset management in an era of unrelenting change
Where are the biggest structural shifts in demand? “We always overestimate the change that will occur in the next two years and underestimate the change that will occur in the next ten.” —Bill Gates
The nature and shape of demand in North American asset management has undergone a major shift over the last five years. The direction of travel is very clear: flows in favor of products and vehicles that are cheaper, yield-generating, more stable, and customized to overall portfolio objectives. This shift is the product of reinforcing factors: new business models (e.g., fee-based advisory); new methodologies of portfolio construction (e.g., risk factors); the maturity of new asset classes and vehicles (such as alternatives and ETFs); and the spillover effects of regulation (MiFID II)—all overlaid with a macroeconomic environment where low yields and volatility have become the norm. Together, these forces are leading to a redistribution of the pools of value across the industry.
Individuals rule, but intermediaries rise These changes in demand have occurred against a backdrop of slowing flows of new money into the North American market. In 2018, net flows subsided to just 0.4 percent of the beginning-of-year AUM base, down from 1.7 percent a year earlier, as market volatility sent many investors to the sidelines and rising interest rates turned bank deposits and cash into a source of competition for asset managers (Exhibit 7).
Yet even amid this slowdown, one major structural client trend continued apace—the gradual “individualization” of assets under management, enabled by the steady growth of individually held wealth serviced in the retail channels, and the slow but steady shrinkage of defined benefit pension plans. In 2018, net new flows from retail investors
were just 0.5 percent of beginning-of-year assets, but at $132 billion, made up most of the year’s new assets. Assets continue to flow out of defined benefit plans, the result of rising benefit payments to retirees and plan terminations. At $123 billion for the year, or 2 percent of beginning-of-year AUM, outflows from DB plans showed a slight acceleration versus 2017.
Defined contribution plans and corporations were not able to pick up the slack. The weakness of DC—exacerbated by the accelerating retirement of baby boomers—was a particular disappointment, as the US DC market has long been held out as a source of growth in its own right, as well as a replacement for declines in waning DB plans.
Two institutional client segments bucked the trend, showing surprising strength for the year: Endowments and foundations brought net new capital to managers equal to 3.7 percent of beginning assets, through healthy levels of charitable giving against the backdrop of a healthy real economy. Growth in the insurance market also provided welcome growth, through gains in insurance general accounts and an increasing willingness of insurers to outsource larger portions of their portfolios to asset managers, particularly for more complex asset classes.
These trends were accompanied by a parallel rise of an intermediary “layer”—a set of service providers focused on offering advice on portfolio construction and manager selection to end investors. This layer has deepened beyond generalist investment consultants to include specialist advisors (in alternatives, for instance), providers of outsourced chief investment officer services, and home offices

13Beyond the Rubicon: Asset management in an era of unrelenting change
with greater institutional capabilities. The growth of these new services has shifted the balance of power toward players who influence portfolio-level decisions, and thereby own the end-client relationship.
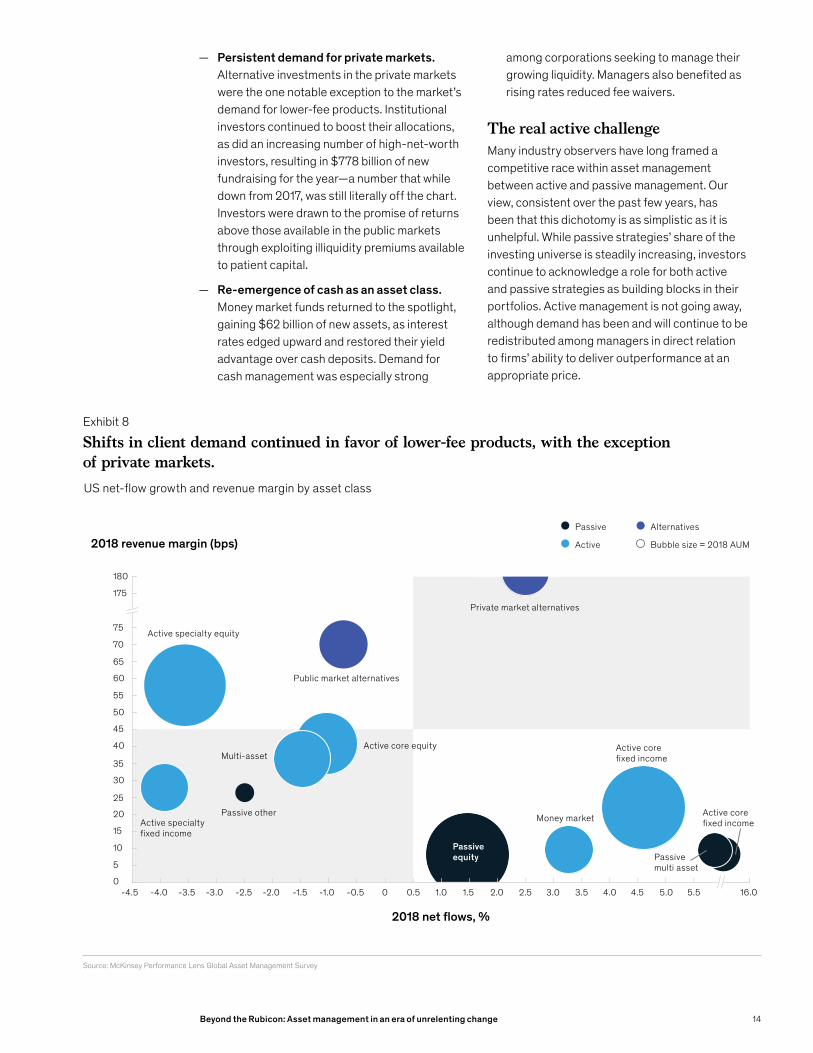
An industry-wide asset rebalancingA broader rebalancing of industry assets continued in 2018, favoring lower-priced products and vehicles and compounding the revenue impact of the weakened flow of assets. These cross-currents played out over the product landscape (Exhibit 8):
— Challenges for alpha-seeking strategies in the public markets—actively managed equities continued to experience pullbacks in demand. While core fixed income as a whole had a good year, demand for active in specialty categories dropped off as investors recalibrated their
appetites for credit risk. In total, these alpha-seeking strategies saw cumulative outflows to the tune of $100 billion for the year.
— High demand for low cost. Passive strategies and ETFs continued to post meaningful gains—inflows of $300 billion, equal to 3.3 percent of beginning-of-year AUM—even in a year of muted flows for the market as a whole. ETF adoption continued to expand across both the retail and institutional segments, with meaningful growth in newer areas such as fixed income.
— A rush for stability. Fixed income managers enjoyed 2018, as secular trends, such as aging populations and automatic asset allocation shifts from target date funds, led to steady growth. The “risk-off” mood that washed over the market late in the year further fueled demand, resulting in $280 billion of inflows.
1 Insurance general account, state and official entitiesSource: McKinsey Performance Lens Global Growth Cube
2017 net flows% of beginning-of-year AUM
2018 net flows% of beginning-of-year AUM
2018 net flows$ billion
Endowments and foundations
Retail
Total
3.1%
-4.0%
1.7%
0.5%
3.3%
0.4%
107
Corporates
6.4% 0.6% 7
49
Defined benefit
-1.6% -2.3% -142
Institutional other1
1.8% 2.2% 71
158
Defined contribution
1.1% 0.9% 68
Exhibit 7
Industry �ows decelerated in largest client segments in the US.
14Beyond the Rubicon: Asset management in an era of unrelenting change
Source: McKinsey Performance Lens Global Asset Management Survey
Passive
Bubble size = 2018 AUM
Alternatives
2018 net �ows, %
2018 revenue margin (bps)
Passiveequity
Multi-assetActive core equity
Public market alternatives
Active specialty equity
Passive otherActive specialty�xed income
Money market
Active core�xed income
Active core�xed income
Passive multi asset
Private market alternatives
Active
-3.5 -0.5 -1.0 -2.0 -1.5 3.5 2.0 0 0
3.0 2.5 1.5
40
10
4.0 5.0 -2.5
5
-3.0
15
20
25
30
35
-4.5
45
0.5
50
1.0
55
60
65
70
175
75
4.5 -4.0
180
16.0 5.5
US net-�ow growth and revenue margin by asset class
Exhibit 8
Shifts in client demand continued in favor of lower-fee products, with the exception of private markets.
— Persistent demand for private markets. Alternative investments in the private markets were the one notable exception to the market’s demand for lower-fee products. Institutional investors continued to boost their allocations, as did an increasing number of high-net-worth investors, resulting in $778 billion of new fundraising for the year—a number that while down from 2017, was still literally off the chart. Investors were drawn to the promise of returns above those available in the public markets through exploiting illiquidity premiums available to patient capital.
— Re-emergence of cash as an asset class. Money market funds returned to the spotlight, gaining $62 billion of new assets, as interest rates edged upward and restored their yield advantage over cash deposits. Demand for cash management was especially strong
among corporations seeking to manage their growing liquidity. Managers also benefited as rising rates reduced fee waivers.
The real active challenge Many industry observers have long framed a competitive race within asset management between active and passive management. Our view, consistent over the past few years, has been that this dichotomy is as simplistic as it is unhelpful. While passive strategies’ share of the investing universe is steadily increasing, investors continue to acknowledge a role for both active and passive strategies as building blocks in their portfolios. Active management is not going away, although demand has been and will continue to be redistributed among managers in direct relation to firms’ ability to deliver outperformance at an appropriate price.

15Beyond the Rubicon: Asset management in an era of unrelenting change
1 The performance of the cohort of index-tracking (passive) options in each category is defined as the hurdle, that decides success or failure for the active funds within the same categorySource: Morningstar Active/Passive Barometer © 2019 Morningstar. All Rights Reserved. The information contained herein: (1) is proprietary to Morningstar and/or its content providers; (2) may not becopied or distributed; and (3) is not warranted to be accurate, complete or timely. Neither Morningstar nor its content providers are responsible for any damages or losses arising from any use of thisinformation. Past performance is no guarantee of future results.
2017 2018
Equities Equities
29 30
43
31 31
21
Small Large Medium
49
67
57
41
21 24
World large stock
Emerging Markets
Europe
69 74 77
38
29 29
Intermediate bond
Corporate bond
High yield
Trends in active funds’ 1-year success rates versus passive funds1
Percent, by category
Exhibit 9
Active managers continued to face persistent challenges to investment.
To be sure, active management still faces material challenges, and nowhere is this clearer than in US equities. While 2018 seemed to show a slowing of active equity outflows, this was more a result of the slowdown in growth industry-wide than a respite for the asset class. In fact, the US fund market crossed an important milestone in mid-2019, when AUM in active and passive for domestic equities reached parity.
The existential challenge for active equities is achieving better and more consistent performance. In 2018, fewer than a third of active managers of large and mid-cap US equity strategies beat their indexes on an after-fees basis (Exhibit 9). Managers of US small cap equities, who had seen better success in past years, also encountered headwinds, as just 21 percent were able to surpass their benchmarks—half the proportion of 2017. Managers with equity mandates for international equities also lagged in 2018, both versus 2017 and against their counterparts based in local markets. This industry-wide performance shortfall created takeover opportunities for some active equities managers who sustained their outperformance, but it exerted an overall downward pull on the sector as investors directed their active risk budgets to other asset classes.
To date, the challenges to active equities appear to be concentrated in North America (Exhibit 10). One explanation may be environmental: The domestic equity market is measurably more efficient than many other global markets, making profitable stock picking more challenging, especially in the large-company universe. Our research has found that active strategies stand a better chance of outperformance in periods of volatile market environments, but they also need a high dispersion of individual stock returns, which lately has been absent.
In addition, the structure of the North American market—with its separation between managers and increasingly fee-based retail intermediaries—contributes to the challenges facing active products. Retail distribution in other major markets remains highly proprietary, and lacks the same extreme sensitivity to performance and fees that North American investors display. The question is whether these structural differences will persist. Changes in other markets are afoot, such as those motivated by regulatory changes such as MiFID II. Early evidence in 2019 suggests that Europe’s own active-to-passive shift in equities may have begun.

16Beyond the Rubicon: Asset management in an era of unrelenting change
1 Numbers have been rounded.2 Includes 26 countries in Western Europe and Asia-Pacific; does not include GCC, Latin America, Africa.Source: McKinsey Performance Lens Global Growth Cube
Active Passive Passive Active
$2.1T ($0.9T) $1.1T $3.8T
1,240 620
-1,780
105
510
2,600 320
420 10
105
-25085 195
680
10
390
Total net flows
Equities Fixed Income
North America
Rest of World2
$2.1T ($1.1T) $1.1T $3.5T
460
2018 2013-17Cumulative net �ows (2013-18), $ billion1
Exhibit 10
The future of active: Is North America the exception or the norm?
A quandary for active managers Nevertheless, rumors of the death of active management are greatly exaggerated. Even if the migration from active to passive continues at the same pace as the past several years, active equities strategies will still make up a large proportion of the aggregate AUM and revenue base of North American managers (estimated at 24 percent for 2023, down from 28 percent in 2018, and 31 percent five years earlier). As we have observed in the studies of prior years, even with a further decline in share, active equities would still likely represent the second-largest component of the industry’s revenue pool (Exhibit 11).
What current pressures are precipitating is the reinvention of active management. This will happen in three ways. First, there will continue to be a shakeout of benchmark-hugging strategies—both in terms of asset outflows and a repricing of the many funds whose current fee levels exert an excessive “tax” on performance. Second, a subset of successful high-conviction active managers will seek to reinforce their investing edge with investments in data, analytics, and technology.
Third, there is potential for a second wave of active demand for non-benchmark-focused strategies; for example, sustainable and thematic investing, particularly as societal challenges such as climate risk begin to loom ever larger on clients’ minds.
As a product class sustainable investing could have meaningful room to grow in the North American market, as the broader attitudes of end clients and other stakeholders (e.g., trustees of institutional plans) evolve. Clients will increasingly differentiate those strategies which simply consider environmental, social and governance factors as a part of a broader investment process—which investors are increasing treating as a prerequisite—from those that develop expanded views of sustainability and managing the risk factors and the implications of externalities. Essential, however, is an ability to communicate what value and mission such strategies would bring to investors’ portfolios, and how managers capture that value through their research processes.
The transformation of asset and revenue pools in active equities illuminates the strategic and managerial quandaries facing incumbent asset

17Beyond the Rubicon: Asset management in an era of unrelenting change
1 % based on ~$12 billion in projected NNRs.Source: McKinsey Performance Lens Global Growth Cube
11% 12% 12%
11% 11% 11%
22% 21% 20%
31% 28%24%
16% 21% 26%
9% 8% 7%
36% 38% 40%
12% 13% 13%
14% 12% 12%
34% 31% 27%
2% 2% 1% 2%
2023P2018
2013 2018 2023P2013
5%
<0%
9%
38%
22%
26%
% of net new revenues,2019-23P1
Passive/ETFs
Money market
Active equities
Active �xed income
Balanced/multi-asset
Alternatives1
52%oftotal
Net revenueAUM (third-party)
3%
31%
4% 5%
$33T
$180B
$216B
$139B
$43T
$56T
North American asset management
Exhibit 11
Traditional active will fall as a share of industry, but will remain an important revenue pool.
managers. Firms need to play offense and defense simultaneously, to preserve the large and lucrative book of legacy business in traditional active
strategies, while identifying successful new and innovative products, willing new customers, or both.

18Beyond the Rubicon: Asset management in an era of unrelenting change
Pricing was one of the most prominent themes in the North American asset management industry in 2018. Talk of price wars, fee compression and zero fund fees filled the headlines as asset managers began to hear a drumbeat of falling margins. And the industry did experience a flurry of price cuts throughout the year. Some were deliberate and strategic, initiated by managers seeking to plant a flag in new markets or gain share in existing ones, while others were defensive and reactive by incumbents caught on the back foot. Still others were regulatory-driven, as managers adopted more conservative policies for the pass-through of costs to funds in light of greater scrutiny.
Industry pricing has been under pressure for some time, but 2018 witnessed the largest aggregate fall in fees in recent years, across market segments and asset classes. But fee pressure played out in nuanced ways—at different rates across asset classes, with different sensitivities to investment performance, and through a rebalancing across different fee pools (e.g., management versus distribution). The industry has entered into a far more complex pricing environment, one in which the art and science of revenue management—a functional skill set for managing the interplay of pricing, volumes, client segments, and distribution expenses—is emerging as a critical new competency for asset managers.
Free-falling fees? Headline fee rates have fallen significantly since 2013—some 25 percent overall for both retail and institutional funds, and the declines have accelerated in the past 18 to 24 months. But behind those headline averages is a wide variation by asset class and strategy. In high-demand segments of the market, particularly ones where clients had greater conviction in managers’ ability to deliver outperformance, fee pressures were far more contained (Exhibit 12).
For retail-oriented funds with specialized active equity and fixed income mandates, the impact of fee compression was just half the rate of the overall market. Much of the decline was the result of growing funds hitting in-built breakpoints or mix shifts to more fee-efficient vehicles rather than flat-out price cuts. In institutional channels, active multi-asset mandates have experienced only single-digit declines since 2013, as clients are willing to pay for quality strategies.
On the other hand, fee pressure for commoditized asset classes and strategies was massive. Fees for passive funds, for example, declined by 40 to 50 percent, with the biggest declines in index equities in the institutional channel. Pricing pressure was real, but it played out very differently in different parts of the industry.
And despite the headlines predicting a cataclysmic impact of fee pressure, the actual impact on asset managers’ revenues was more muted (Exhibit 13). For example, asset management businesses focused on retail channels experienced a 6 percent decline in revenues realized on a dollar of assets managed, versus an average fall in fund-level fees of 25 percent.
The discrepancy between these two rates of compression points to a different set of dynamics playing out across different parts of the fee pool. While management fees paid to managers have come down, distribution-related expenses, such as 12b-1 and sub-transfer agency fees have been under greater pressure, as clients have demanded greater transparency, choosing new vehicles like ETFs, “clean” share classes, and institutional product vehicles like separately managed accounts. These shifts have radically reduced the cost of investing for end investors, but at the same time have opened a gap in the funding of distribution and shelf space at intermediaries.
Fees: A race to the bottom? “When prices go up, business goes down.” —Henry Ford

19Beyond the Rubicon: Asset management in an era of unrelenting change
1 Weighted-average total expense ratio by share class.2 Separate accounts and commingled vehicles; does not include retail separately managed accounts.Source: Morningstar; McKinsey Performance Lens Asset Management Survey
US-domiciled mutual funds and ETFsTotal expense ratio, indexed to 2013
Institutional vehiclesEffective net revenue, indexed to 2013
95
16 2013
60
14 15 17 2018 55
65
85
70
75
80
90
100
Active specialty equity
Passive equity
Passive �xed income
Passive multi asset
Active core equity
Active specialty �xed income
Active core �xed income
Active multi asset
15
105
2013 17 14 16
75
2018
50
90
80
45
95
100
Passive equity
Passive �xed income
Active multi asset
Active core equity
Active core �xed income
Active specialty �xed income
Active specialty equity
-6%
-8%
-9%
-7% -16% -13%
-50%
-11% -15%
-22%
-33%
-39%
-28%
-22% -16%
-55%
North American asset management
Exhibit 12
There were signi�cant reductions in headline fees for pricing across investment vehicles in 2018.
Source: McKinsey Performance Lens Global Asset Management Survey
Retail Institutional excluding defined contribution
Defined contribution
50 49 48 48 48 47
2013 17 14 15 16 2018
37 38 36 35 35 34
17 2013 2018 14 15 16
39 38 39 37 3835
2013 2018 14 17 16 15
-6%
-9% -11%
Average net revenue (2013-18), bps/AUM, North American asset managers
Exhibit 13
Fee compression is a real challenge, but not as dramatic as the headlines suggest.

20Beyond the Rubicon: Asset management in an era of unrelenting change
For institutional and defined contribution managers, fee rates have dropped about 10 percent in the aggregate since 2013. Fee pressures have been slightly higher in these segments given the prevalence of large, fee-sensitive clients who have been striking hard bargains for their sizeable institutional mandates and separate account opportunities, and in consolidating their asset manager relationships. In addition, the buying processes at smaller plans, aided by investment consultants and OCIOs, have become more rigorous, allowing clients such as smaller DC plans to capture lower fee rates.
The changing power of performanceA new pricing paradigm emerged during 2018. What was once a market where investment performance ruled above all else—investors seeking “good performance at a fair price”—has shifted to “good performance at the best price.” The implications for the industry, and a reordering of winners and losers, are significant.
Exhibit 14 illustrates a changing equation across fund performance, cost, and net fund flows. The analysis considers three-year returns through 2018, and covers a sample of about 6,000 funds across actively-managed equities, fixed income, and multi-asset products. The vertical axis measures deciles of fund cost, while the horizontal shows deciles of investment performance. (Thus the upper-right corner contains those funds with the best performance and the lowest cost, and the lower-left includes those with poor returns and high costs.) The size of the bubbles reflects the volume of net new assets; green designates inflows, and red outflows.
Clearly, performance is crucial to attracting new assets: only the top two performance deciles were able to avoid aggregate net outflows. But pricing is taking on a whole new level of importance. Of all funds with top decile investment performance, funds with below-average costs accounted for 74 percent of net flows. In fact, low-cost funds with “good enough” performance trumped the flows of high-cost funds with the best performance: Lowest-cost funds in the eighth to ninth deciles of investment performance generated $79 billion of flows for the year, compared to a mere $43 million generated by funds with top-decile performance that were also in the top decile by cost. Low pricing did not trump poor returns, but it helped massively in the sales of “good enough” products.
Down to zero (and below)The most dramatic and visible sign of pricing pressure was the introduction of zero-fee funds (and in one case, a negative fee fund) over the course of 2018. Some observers have characterized this as a clear shot across the bow of the industry from a few bold managers, signaling a larger price war that few managers can be shielded from.
Reality has played out in a slightly less dramatic way. Our analysis shows that the top 12 zero-fee funds in the market captured a grand total of about $25 billion in 2018—certainly not an unimpressive figure, but also not one that signals an industry being turned on its head. Moreover, the majority of new assets were concentrated in just four funds, and the assets gathered by this top group typically amounted to less than 2 percent of the flows captured by their respective sub-asset class categories. These funds were certainly successful, but by no means dominant. For 2018 at least, while low cost was an increasingly important criteria for success, zero cost was not required.
The real story of zero-fee funds is about fundamental shifts in business models by a small number of industry participants, rather than any sort of industrywide trend. The main sponsors of zero-fee funds have been a handful of vertically integrated asset managers who own end relationships with retail clients, placing the bet that by sacrificing their nominal manufacturing costs through a set of loss-leader products, they will be able to more than recover them through customer acquisition in their distribution arms. Additionally, investors can only access most zero-fee products through a wrap account or advisory relationship, likely to carry an annual fee of 100 or 125 basis points. We further discuss the implications of this emerging vertically integrated business model on page 28.
So where are we headed (besides down)? In any mature but competitive product market that is not constrained by supply, prices tend to move only in one direction: down. These conditions also hold true for the core of North American asset management.
But in our view, it is too early to declare a hazardous race to the bottom. Much of the ongoing fee reduction activity is a repricing to bring the

21Beyond the Rubicon: Asset management in an era of unrelenting change
1 Pricing defined by 2018 net expense ratio deciles, performance by 3-year annualized returns for 2018YE within the same Morningstar category. Excludes funds with no available data for returns and performance for the time period. N = 21,025.Source: Morningstar; McKinsey analysis
Net �ows,$ billion (38) (44)
Lowest
Highest
Investment performanceWorst Best
10
9
1
8
7
6
5
4
3
2
5 1 8 2 3 6 4 7 9 10
Pric
ing
(66) (106) (96) (58) (89)(78) 19 95
+$10 billion
-$4 billion
2018 active net �ows by net expense ratio decile and performance decile, $ billion1
Exhibit 14
Performance still counts, but at the right price.
industry in line with a more demanding set of client expectations, and that will have a positive impact on the industry’s longer-term health. The biggest impacts of price compression are being exerted on underperforming products which are suffering from excessive fee drag, as well as on old-school product vehicles, such as load-bearing mutual funds, that have not kept up with the needs of modern intermediary distribution models.
That said, pricing has risen to a new level of importance in clients’ buying criteria, to the point where they are often a gating factor in decisions. But pricing is a complex business, and when studied at a more granular level of asset classes and style, price elasticities vary widely across different asset classes, strategies, and client segments.
Looking forward, the greatest fee pressure will more likely result from changes in pricing structures rather than changes in pricing levels. Sole fund advisory relationships at high fees could, for example, retreat to lower-fee subadvisory arrangements; growth in unified managed accounts will move assets to lower-fee vehicles such as retail separately managed
accounts and cleaner share classes; aggregation of institutional demand by intermediaries will pressure those fee agreements and the largest investors will strike hard bargains in multiproduct mandates with strategic partners and potentially experiment with mechanisms like performance fees to build greater alignment of incentives; and in DC plans, traditional retail mutual funds will increasingly move to ETFs, institutional share classes, and collective investment trusts.
What is emerging is a much more complex pricing environment—one in which understanding demand at the level of customer segments is crucial to optimizing revenues. In a range of consumer-facing industries, revenue management—the art and science of understanding client demands at the segment level, optimizing price and availability of products, embracing new pricing models, and building linking investments in partnerships—is a highly-developed skill. In North American asset management, it will become a critical skill set in the industry of tomorrow.

22Beyond the Rubicon: Asset management in an era of unrelenting change
One of the economically attractive characteristics of the asset management business is the favorable operating leverage embedded in its business model. For many mainstream investment strategies, a moderate increase in AUM does not require a material change in the size of the underlying investment team. In addition, the AUM-linked fee model creates a “free option” for the industry to benefit from revenue growth tied to the appreciation of the markets. As a result, a well-run asset management firm can gather assets and convert them into revenues and profits more rapidly than it has to grow its cost base.
An untethering of costs from revenuesHowever, this relationship presumes that organizations are kept trim and efficient in line with AUM and top-line growth. In the ten years of rapid recovery and expansion that followed the financial crisis, the North American asset management industry as a whole failed to apply restraint to its cost base and neglected to invest its surpluses toward restructuring its operating chassis. As a result, multiple categories of costs have grown faster than revenues.
As the industry has become more complex, with the emergence of new asset classes and new sets of client demands, asset managers have invested to build an ever-expanding set of new capabilities (e.g., multi-asset solutions, alternatives, and specialized distribution teams) without developing the parallel discipline of scaling back on those that are older and less relevant to market needs. In the name of embracing best-in-breed technology, they have
layered multiple—often incompatible—systems onto their operating platforms. The result has been the equivalent of urban sprawl, adding cost and complexity that is coming back to hurt them in more stressful and competitively demanding times.
Now, a number of firms have taken moves rein in growth in their cost bases over the past 24 months. The majority of moves came in the form of expense targets imposed in the midst of market volatility of 2018. In addition, several multiboutique managers have sought to redefine their operating models in ways that allow them to build greater economies of scale, while still preserving diversity in investment approaches. Still others have turned to transformative M&A, bringing together firms and multiyear rationalization of their operating platforms through the removal of duplicated functions.
However, these efforts have thus far had little impact on the industry as a whole. In the aggregate, the cost base of North American asset managers expanded 4 percent in 2018, compared to revenues which grew at 1 percent. And the industry’s cost base grew in every category with the exception of operations. Distribution, in particular, grew at 8 percent, a particularly high number for what was a year of diminished flows (Exhibit 15).
Moreover, spending grew more rapidly in 2018 than the average for the preceding ten years. Likely the result of backward-looking budgeting processes, the industry’s spending for 2018 looked as if it was expecting another banner year for asset growth and flows, such as 2017, when in reality these ended up meaningfully down.
Where is the industry in the journey to spur productivity and operating leverage? “… Watch the costs and the profits will take care of themselves.” —Andrew Carnegie

23Beyond the Rubicon: Asset management in an era of unrelenting change
Interestingly, the continued rise in expenses was not a global phenomenon. Across the Atlantic, costs grew only half as fast for European managers, and were flat or declined in distribution, investment management, and operations. Some of this difference results from market structures: The European industry has a greater prevalence of bank and insurer-owned asset managers, and those investment arms have been subject to the greater cost management focus that has been widespread in their parent firms’ industries in the post-global financial crisis years.
Margins are intact, but vulnerableIn the defense of North American managers, expenses measured against AUM fell by 1 basis point to 24 basis points for 2018. The cost base is to a great extent fixed in the short run for a given level of AUM, and the cause of the year’s revenue weakness came on suddenly in the fourth quarter.
However, the industry’s expense levels become a concern when revenues are brought into the
picture. For 2018, revenue yields slid to 35.5 basis points of AUM from 37.1 basis points in the prior year—reconfirming the downward trend in revenue realization. The net result was that the industry’s operating margins edged lower—by 2 percentage points from the 2017 high-water market of 31 percent of revenues—a rare instance of a margin decline in a year where average AUM grew (Exhibit 16).
M&A as a lever, but not an easy one The theme of industry consolidation through mergers and acquisitions continued to play out over 2018. Globally, there were a total of 253 transactions of various sizes over the course of the year,5 with the value of AUM changing hands through these transactions hitting a record of $3.7 trillion.
One of the stated theses behind these transactions, particularly for larger deals, was the aim of building scale and lowering costs through a broader and streamlined operating model. While some firms have managed to rack up impressive levels of medium-
Source: McKinsey Performance Lens Global Asset Management Survey
Defined contribution
CAGR2007-17
CAGR2017-18
Investments
Management/administration/other
Distribution
Operations
Technology
Legal/risk/compliance
Cost/averageAUM, bps 26 26 25 24
14 16 17 181 3 3 4
610 11 11
7 625
3236 37
1617 18
$10
100% = $59 billion
135 3 43
8390 94
2007 2016 2017 2018
10%
9%
0.47%
4%
7%
3%
3%
3%
6%
-3%
3%
8%
4%
6%
Total North American asset management costs by function (estimate)2007-18, $ billion (traditional industry only, excludes alternatives AUM)
Exhibit 15
Despite 2018’s more challenging growth environment, North American asset managers increased spending in virtually every function.
5 Sandler O’Neill + Partners, “2018 Asset Manager Transaction Review & 2019 Forecast,” January 2019, www.sandleroneill.com.

24Beyond the Rubicon: Asset management in an era of unrelenting change
term cost synergies after their acquisitions, the industry’s long-term record of integrating acquired firms is mixed, given the difficult task of managing across disparate firm cultures, and the need to deliver meaningful revenue growth.
Going forward, building scale through M&A will remain an important tactic for managing the industry’s cost base, but it is by no means a silver bullet, and requires significant skill to pull off successfully. Managers pursuing this path will need to put as much emphasis on organic growth as they do on costs efficiencies in their integration planning.
The verdictThe industry has not done well in managing its structural costs. The seven years of plenty that followed the global financial crisis delivered a significant quantum of growth, but it came with some sticky costs which chipped away at the
industry’s operating leverage.
Many managers have announced cost-cutting efforts, but few have tackled the underlying structural factors of cost growth head on through a fresh look at their operating models, and seeking to drastically simplify their systems. As a result, industry profitability has become vulnerable to the revenue pressures discussed in earlier chapters.
As the macroeconomic environment remains uncertain, we expect a greater number of asset managers to embrace a mindset of cost management. But cost-cutting tends to be a relatively blunt tool and can only go on for so long before it reaches the muscle of a firm and begins to affect growth. What the industry needs is a fundamental retooling of operating models, as well as associated talent models, to enable firms to do more with less, drastically improve productivity, and restore the ability to grow with margin expansion.
Source: McKinsey Performance Lens Global Asset Management Survey
3330
22
33 31 3033 31
09 2007 08 13 17 14 16 15 2018
32
Operating prot, % of revenues
Net revenues/average AUM v bps bps
bps
38.9 38.0 35.338.5 37.7 37.1 36.7 37.1 35.5
2007 17 08 13 09 16 14 15 2018
25.8 25.8 27.0 26.0 25.3 25.5 25.6 24.9 24.4
08 2007 15 09 2017 13 14 16 2018
Operating costs/average AUM, bps
-
North American pretax prot margins
Exhibit 16
In North America, operating margins declined slightly to 31%.

25Beyond the Rubicon: Asset management in an era of unrelenting change
Taken together, 2017 and 2018 provided an excellent laboratory setting for identifying key characteristics of the likely winners (and laggards) among asset managers in North America. The former was a year of plenty, with strong gains across markets: Managers took in $683 billion in new assets from clients and saw operating margins match record highs at 33 percent of revenues. The latter, on the other hand, proved more challenging, as fourth-quarter interest-rate hikes by the Federal Reserve and concerns over global trade tensions weighed on both the equity and bond markets. Aggregate revenues inched higher, but aggregate profits fell, and the industry as a whole started 2019 on the back foot.
Our benchmarking of over 100 asset management firms in North America (representing 80 percent of industry AUM) suggests a more challenging period ahead. Growth and profitability are both in short supply as the industry is weighed down by investor nervousness and sticky costs. But even amid this downward gravitational pull affecting every firm, there is a surprising spread of performance among individual firms. Most important, more than a few firms are continuing to thrive. And surprisingly, their success defies easy definition, cutting across different shapes, sizes, client segments, and asset classes. In this chapter, we outline four “recipes” for success that are emerging and how they combine with scale to establish a foundation for strong performance in a rapidly changing environment.
Unreliable averagesAverages lie. So, too, can the aggregate “industry performance” of 30 percent operating margins and flat organic growth paint a misleading picture of how any individual manager has been doing.
For example, for managers in the top quartile of profitability, operating margins for 2018 remained at an enviable 51 percent in contrast to their counterparts in the bottom quartile, who posted margins in the range of 13 percent. The top-to-bottom spread in long-term net-flow growth varied from 10 percent to negative 8 percent, and revenue dynamics ranged from growth of 9 percent to a decline of 9 percent.
Exhibit 17 provides a striking visual representation of performance variability across the industry at the “molecular” level by setting 2018’s growth in flows against operating margins for the 100 firms in our sample. Three things became clear as we examined the underlying data: First, the majority of firms lost ground on growth or profitability (or both) relative to 2017—an unsurprising but important reality. Second, a subset of the industry continued to thrive—with 32 percent, for example, improving their position with net flows, 40 percent improving their position with operating margins, and 20 percent improving both. Third, success in 2018, whether measured by growth in flows or profitability, was unrelated to simple markers like firm size or asset class focus.
Four recipes for successSuccess in the industry defies easy categorization. Nonetheless, we undertook an analytical exercise to identify the markers of success over the next five to seven years. This process entailed elements of both art and science. We began with the hard numbers on manager growth and profitability over the past five years, to identify a set of managers with consistently good performance, and who seemed well-set for success. We paired this with a set of conversations with asset owners and intermediaries to understand their views of various asset manager
Which types of firms are positioned to win, and why? “All happy families are alike; each unhappy family is unhappy in its own way.” –Leo Tolstoy

26Beyond the Rubicon: Asset management in an era of unrelenting change
value propositions. We then engaged in a qualitative clustering exercise from which emerged four recipes that will define success for North American asset managers.
Each of these recipes represents both a clear value proposition to clients, and an internally consistent set of business model choices that deliver that proposition. When executed effectively, these choices create a self-reinforcing flywheel that constantly recreates that recipe’s conditions for success (for example, a sound investment culture driving investment success, and in turn attracting investment talent). Each recipe represents less a detailed blueprint, and more a “center of gravity” that a firm is trying to achieve in its business model. In reality, many firms will demonstrate aspects of more than one recipe (hence the representation below in Venn diagram form), but most successful firms will decide to be exceptional in one dimension.
Do these value propositions generate different performance outcomes? Yes, and each in its own way, particularly when one adds the caveat of “when executed well.” Does any one model dominate? No. The top performers demonstrate that it is possible
to be extremely successful within each value proposition (Exhibits 18 and 19).
Sustained alpha generators Firms that adopt this recipe seek to set themselves apart with a unique edge in investing that enables consistent outperformance of investment objectives. They build an effective “flywheel” of a strong investment culture and a disciplined investment process, which in turn generates outstanding results, attracting clients who understand their philosophy deeply (and thus are willing to stick with them through cycles), as well as top investment talent that is drawn to opportunities for learning and growth. As we have noted earlier, alpha has been in short supply, and this state is likely to continue against a market background of lower expected returns across traditional asset classes. Amid this backdrop, clients will continue to seek out and reward firms that consistently beat the market, as evidenced by the fact that top-quartile firms in this archetype have historically achieved outsized growth in AUM and revenues.
Yet conventional wisdom holds that the Hotel of Top Performance is always fully booked, but that the
Source: McKinsey Performance Lens Global Asset Management Survey
-25
-20
-10
-5
0
5
10
15
20
-15
2018 net �ows (% of beginning-of-year assets) Improved Declined
Average: 0.8%
2018 operating margins (%
-2 52 0 12 6 8 10 14 32 46 20 36 34 22 24 26 28 30 38 48 40 18 50 16 54 -10 56 42 68 44
North American asset managers
Exhibit 17
There continues to be signi�cant dispersion in individual manager performance—32% of �rms improved their net �ow growth year-over-year.
Average: 31%

27Beyond the Rubicon: Asset management in an era of unrelenting change
guests are constantly changing. As a group, active managers have struggled to deliver alpha and even some of the most prominent alpha-oriented firms struggle to deliver it consistently and through cycles. As a result, this archetype has historically generated negative net flow growth on average, although revenue and profit growth have been somewhat buoyed by the beta of the markets.
Going forward, the bar on alpha will be a high and rising one. An outstanding historical track record is likely not enough to score outsized growth for a firm. Firms seeking to execute on this recipe will need to shore up their talent, culture, and investment process, but also consider how these can be turbocharged through investments in next-generation capabilities in technology, data, and analytics. In addition, we anticipate that a number of winners will build on network effects and scale benefits to deliver privileged access to capital, deals, and talent that are essential ingredients for success at meaningful scale. These firms will marry distinctive alpha generation capabilities with a set of commercialization capabilities that enables them to optimize their capacity at the right price, through the right vehicles, and through the best-suited distribution channels.
Broad-based scale manufacturers Firms that embrace this recipe seek to meet a full set of client needs, and by virtue of their scale are well-positioned to efficiently manufacture and distribute products across the full range of asset classes required to do so. When successfully executed, this recipe enables firms to position themselves as core partners to their clients, a major advantage in a world where many clients are seeking out fewer but more strategic manager relationships. The key to success in this recipe is simplicity: Simplicity in terms of a client interface that seamlessly delivers the whole firm to clients in an intuitive way, and simplicity in an operating model that enables the delivery of capabilities at scale, increasing productivity as the firm grows.
Top performers in this group have achieved organic growth at approximately double the industry average, and the strongest revenue and profit growth. The most successful examples are those able to execute well on several factors—strong investment performance across asset classes, efficient packaging, and distribution breadth, for example aligned with a tailwind such as growing retirement needs. However, the costs of mediocrity in this recipe are high. Average performers in this
Source: McKinsey Performance Lens Global Asset Management Survey; McKinsey
Distinctiveness through a unique edge in investing and consistent performance
Distinctiveness through broadcapabilities (including low cost and unconstrained capacity)
Distinctiveness through control of the end-to-end value chain
Distinctiveness through advisory customized to client needs and speci�c outcomes
End-to-endmanufacturer
and distributors
Broad-basedscale
manufacturers
Solutionsproviders
Sustainedalpha
generators
Exhibit 18
Four winning “recipes” for success in asset management.

28Beyond the Rubicon: Asset management in an era of unrelenting change
group—typically those who achieve breadth in the absence of scale—struggle to grow and to deliver their offerings at attractive unit costs.
Given the increased pressure on pricing across the industry, the scale elements of this model take on an added layer of importance, as low-cost producers will have a considerable advantage.
Vertically integrated distributors Success with this recipe requires equal measures of skill in product management and industrial engineering. These firms internalize the full value chain from the manufacturing of investment products through to distribution through a set of proprietary “pipes” that provide them with privileged access to a set of end investors or permanent capital—via direct fund platforms, wealth management arms, recordkeeping platforms, or balance sheets that are owned or “rented.” In a sense, the retail version of this model is a throwback
to the early days of explosive growth of mutual funds in the 1980s, where a handful of firms developed products across asset classes and brought them directly to investors with novel waves of marketing and direct client outreach.
The successful 21st century versions of the vertically integrated distributor share a number of attributes. These include the heavy use of technology—in particular digital channels—to access clients in a highly scalable way, and a creativity in product development that enables them to provide broad relevance to all parts of their target clients’ portfolios. They also make strategic use of pricing, for example via fee reductions on established funds, and new products to accelerate customer acquisition with a set of high-visibility loss-leader products. Indeed, the zero-fee fund phenomenon discussed earlier was incubated in this set of channels. For more institutionally oriented firms, a variant of this model
1Source: McKinsey Performance Lens Global Asset Management Survey
Sustained alpha generators
Net flow growth, Percent of AUM, 2014-18
Business model archetypes
Revenue growth, Percent, 2014-18
Profit growth, Percent, 2014-18
Broad-based scale manufacturers
End-to-end manufacturers and distributors
Solutions providers
-2% 7% -10% 11% 4% -6% 17% 4% -13%
1% 5% -5% 7% 12% -4% 6% 9% -4%
4% 13% -5% 3% 5% -5% 6% -3% -21%
2% 9% -5% 5% 6% -3% 7% 5% -2%
Bottom quartile
Average Top quartile
Exhibit 19
Performance for each recipe over the last 5 years.

29Beyond the Rubicon: Asset management in an era of unrelenting change
employs balance-sheet capacity and other forms of permanent capital to seed new products and scale their investment platforms.
As one would expect, the most successful firms in this group have achieved the highest growth in net flows, on account of their proprietary access to clients. However, despite these superior flows, revenue growth has lagged other groups of managers, and these firms’ asset management margins tend to be weaker due to reduced fee rates. But their overall economics and prospects for future growth are still favorable given their ability to tap into adjacent profit pools beyond asset management—in wealth management, for example. Of course, only a few firms fitting this description are top performers: Many others with end-to-end capabilities have failed to exploit the strategic linkages across manufacturing and distribution, and many have allowed their legacy direct distribution business to turn dormant.
Solutions providers The final recipe for success is the solution provider. Firms in this category seek to create value less through outperformance of an externally derived benchmark, and more through the delivery of bespoke services designed around the needs of individual clients. Firms in this category seek to tap the growing needs of clients—particularly those with long-term, complex investment needs—for advice and services targeted at achieving portfolio level outcomes. Examples include liability-driven investing, outsourced CIO services, strategic asset allocation, and pension risk transfer advice.
Results for this group fall in the middle of the four archetypes—average providers achieve financial results comparable to industry averages, although typically with a stickiness of customer relationships that does not show up in aggregate numbers. That said, top-quartile providers have historically managed to generate relatively strong net flow growth and there seems a clear pathway for this growth to continue given the increasing complexity of client needs.
The biggest challenge for this recipe is its profitability. The customized nature of services
can often be an enemy of scalability, which means that managers following this recipe can find the achievement of sustained profitable growth a challenge. Addressing this challenge will require innovation in technology that enables mass customization and the delivery of highly specialized advice in ways that are not solely reliant on high-cost senior talent.
Scale rather than sizeThese four recipes are effective in generating both profitability and growth, but particularly so when combined with scale. We reiterate the definition of scale posited in our 2018 report—one that goes beyond just the absolute size of a firm’s assets under management. Instead, scale arises from being able to leverage multiple areas of expertise—intrinsic strengths such as intellectual capital, brand, and reputation; innovation in client solutions or service across the entire platform; the building of operational and marketing efficiency; and, of course, skillful investment management—and focusing these strengths across client and product footprints.
Firms that execute against the four winning recipes typically possess such scale. We believe that this new formulation of scale will prove itself as a more useful metric than size, given the likelihood of persistent volatility in the investment environment, heightened competition in the industry for a smaller pool of traditional new business, a more demanding client base, and ongoing pressures on management fees.
It is important to reiterate that scale and size are not synonymous. As in prior years, a firm’s absolute size in terms of AUM was not a reliable predictor of organic growth (Exhibit 20). Nowhere was this clearer than in the progress of the industry’s “trillionaires” during 2018. While five of the top ten firms by absolute net flow capture were in this trillion-dollar club, size was no guarantee of growth for others. Other large managers experienced net outflows, a sober reminder that an accumulation of assets in the absence of a winning recipe and true scale does not deliver a clear competitive advantage.

30Beyond the Rubicon: Asset management in an era of unrelenting change
1 Sample of firms with over $50 billion in mutual funs and ETFs and separate accounts listed on Morningstar as of 2018YE. N = 78 firms.Source: McKinsey Performance Lens Global Growth Cube; Morningstar
30
20
130
160
120
170
140
150
-10
110
0
10
Top 10 firms captured over 89% of positive flows
-50
-60
-20
-50
-60
-20
-50
-60
-20
>$1 trillion AUM Rest of industry
2018 net �ows, $ billion
Exhibit 20
New �ows were highly concentrated, but not all “trillionaire” �rms won.

31Beyond the Rubicon: Asset management in an era of unrelenting change
For an industry that has enjoyed a post-crisis decade of steady revenue growth, and enviable operating margins of 30 percent and higher, it is clear that for things to stay the same, quite a bit will need to change. The industry as a whole will need to pivot away from a mindset of zero-sum competition in a stagnant pool, towards a story of how innovation and investment excellence enable the tapping into new sources of demand, be they unmanaged assets (e.g., cash and securities), shifting client needs (e.g., retirement) underpenetrated markets (e.g., emerging Asia), or financing solutions to new challenges (e.g., climate risk). What’s needed is a fundamentally new narrative of growth.
As they consider their strategy and competitive positioning in a time of unrelenting change, asset management executives should consider three broad categories of actions:
Re-underwrite business beta — Take a hard-nosed, dispassionate look at
industry trends and secular demand shifts at highly granular levels of geographic markets, client segments, and investment offerings
— Reevaluate the degree to which market momentum of the current business mix will deliver growth aspirations given current
capabilities and performance
— Make a set of deliberate decisions on “where to play” and “how to win” over the next five years, backed up with plan that meaningfully realigns resources—including human capital—with the areas of greatest growth (and correspondingly cuts back on areas where growth will be an uphill struggle)
— Lay out decisive plans to capture and shape emerging sources of industry demand through building, buying, or partnering
Reinvigorate investment alpha — Engage in realistic appraisals of investment
skill relative to the right competitive set and structural market conditions
— Strengthen performance management processes for investors (e.g., debiasing, post-mortems, talent reviews)
— Identify opportunities to improve the efficiency and effectiveness of the investment processes through the application of technology, advanced analytics, and data
— Design investment vehicles that minimize drags on performance (e.g., tax, trading costs, and fees), particularly in light of the likely future environment of low returns
Concluding ideas As we look ahead to the next five years in the North American asset management industry, we expect the pace of change to remain unrelenting. But in many ways, this will be change of a very familiar sort, as the direction of travel has been fixed by a set of secular shifts—a “lower for longer” macro environment, greater efficiency in public markets, fee pressure, and the rise of intermediaries—that are as well-known as they are well-understood. In a sense, the river has been crossed and the die already cast. While the next five years will no doubt bring their share of idiosyncratic shocks—political, regulatory, and macroeconomic—these will likely either modulate or accelerate the pace of change rather than shift its fundamental direction.

32Beyond the Rubicon: Asset management in an era of unrelenting change
Reinforce distribution efficiency — Develop sharper understanding of client
needs and how they are evolving by segment; define clear firm value proposition against each segment and redesign sales and service choreography to better integrate client-facing capabilities across sales, client service, and product marketing to deliver stronger client experiences
— Create mechanisms for “delivering the firm” to the most important anchor client relationships (e.g., strategic partnerships)
— Build greater scalability into distribution teams by leveraging digital technology and highly targeted marketing
— Formalize revenue and pricing management capabilities to ensure appropriate economic tradeoffs for each client segment (e.g., discounts for scale mandates) and to ensure an ROI-oriented mindset to pricing (that is, fee reductions as “investments” in growth for which value needs to be tracked and captured)
Re-architect operating models for scale and speed
— Radically simplify overbuilt operating models with a “front-to-back” approach (e.g., product and service rationalization, removing friction from highest value customer journeys, strategic location decisions)
— Aggressively attack structural costs and technical debt by streamlining legacy architecture, eliminating duplicative applications, and through more aggressive outsourcing
— Invest in next-generation technical capabilities (e.g., private cloud, bots, automation, natural language processing) and operating norms (e.g., agile development and maintenance)
— Reevaluate what you are in the “core business” of, and consider fully outsourced solutions for all else
— Rethink business partners across front, middle, and back office through the lens of value creation and scalability, and not just cost
Managers will need to tap into these new sources of advantage and resilience to make the journey beyond the Rubicon. For the industry to reclaim its economically advantaged position in financial services, quite a bit will have to change.

November 2019 Copyright © McKinsey & Company
www.mckinsey.com/industries/financial-services/our-insights
@McKBanking