Beyond the “High-Tech” Suits: Predicting 2012 …ccss/files/Documents/2012 Brammer...Beyond the...
11
Measurement in Physical Education and Exercise Science, 16: 183–193, 2012 Copyright © Taylor & Francis Group, LLC ISSN: 1091-367X print / 1532-7841 online DOI: 10.1080/1091367X.2012.700253 Beyond the “High-Tech” Suits: Predicting 2012 Olympic Swim Performances Chris L. Brammer, Joel M. Stager, and Dave A. Tanner Counsilman Center for the Science of Swimming, Indiana University, Bloomington, Indiana The purpose of the authors in this study was to predict the mean swim time of the top eight swimmers in swim events at the 2012 Olympic Games based upon prior Olympic performances from 1972 through 2008. Using the mean top eight time across all years, a best fit power curve [time = a × year b ] was calculated and used to predict the finish time of the finalists for each event. Every event except the women’s 100 breaststroke is predicted to be slower in 2012 than it was in 2008. However, the results of the 2008 swimming competition were shown to be biased, likely caused by the now banned “tech suits.” The authors hypothesize that the 2012 Olympic performances will realign with the prediction curves, thus demonstrating the reliability and sensitivity of the model and further confirming the “suit bias” of 2008. Final conclusions will be dependent upon the athletes’ performances at the 2012 Games. Key words: London Olympics, swimming, textile technology, swim predictions INTRODUCTION The interpretation of performance trends using compiled results of athletic competitions dates back to the end of the 19th century, presumably coincident with the start of the modern Olympic Games. Today, because of the easy and nearly instantaneous access to competition results, there is a renewed interest in understanding the nature and prevalence of outstanding performances, particularly as they relate to Olympic and world records. For example, a real-time comparison of an athlete’s performance to the world record performance is commonly used to capture spec- tators’ interest. Further, new analytic techniques to evaluate the success of training regimes for individual athletes, team performances, and even national sport agendas are becoming common- place. The recent movie based upon the book authored by Michael Lewis, Moneyball, does well to illustrate how quantitative analysis is beginning to influence diverse aspects of amateur and professional sports. From the scientific perspective, the analysis of athletic performance provides an illustration of the progress of man’s peak performance. Factors affecting performance can then be identified, and our knowledge of how to improve athletic performance expands. For instance, advances in technology and athletic nutrition over the last 25 years may have led to acceleration in Correspondence should be sent to Chris L. Brammer, Counsilman Center for the Science of Swimming, PO Box 1351, Davidson, NC, 28036. E-mail: [email protected]
Transcript of Beyond the “High-Tech” Suits: Predicting 2012 …ccss/files/Documents/2012 Brammer...Beyond the...

Measurement in Physical Education and Exercise Science, 16: 183–193, 2012Copyright © Taylor & Francis Group, LLCISSN: 1091-367X print / 1532-7841 onlineDOI: 10.1080/1091367X.2012.700253
Beyond the “High-Tech” Suits: Predicting 2012 OlympicSwim Performances
Chris L. Brammer, Joel M. Stager, and Dave A. TannerCounsilman Center for the Science of Swimming, Indiana University, Bloomington, Indiana
The purpose of the authors in this study was to predict the mean swim time of the top eightswimmers in swim events at the 2012 Olympic Games based upon prior Olympic performancesfrom 1972 through 2008. Using the mean top eight time across all years, a best fit power curve[time = a × yearb] was calculated and used to predict the finish time of the finalists for each event.Every event except the women’s 100 breaststroke is predicted to be slower in 2012 than it was in2008. However, the results of the 2008 swimming competition were shown to be biased, likely causedby the now banned “tech suits.” The authors hypothesize that the 2012 Olympic performances willrealign with the prediction curves, thus demonstrating the reliability and sensitivity of the model andfurther confirming the “suit bias” of 2008. Final conclusions will be dependent upon the athletes’performances at the 2012 Games.
Key words: London Olympics, swimming, textile technology, swim predictions
INTRODUCTION
The interpretation of performance trends using compiled results of athletic competitions datesback to the end of the 19th century, presumably coincident with the start of the modern OlympicGames. Today, because of the easy and nearly instantaneous access to competition results, thereis a renewed interest in understanding the nature and prevalence of outstanding performances,particularly as they relate to Olympic and world records. For example, a real-time comparisonof an athlete’s performance to the world record performance is commonly used to capture spec-tators’ interest. Further, new analytic techniques to evaluate the success of training regimes forindividual athletes, team performances, and even national sport agendas are becoming common-place. The recent movie based upon the book authored by Michael Lewis, Moneyball, does wellto illustrate how quantitative analysis is beginning to influence diverse aspects of amateur andprofessional sports.
From the scientific perspective, the analysis of athletic performance provides an illustration ofthe progress of man’s peak performance. Factors affecting performance can then be identified,and our knowledge of how to improve athletic performance expands. For instance, advancesin technology and athletic nutrition over the last 25 years may have led to acceleration in
Correspondence should be sent to Chris L. Brammer, Counsilman Center for the Science of Swimming, PO Box 1351,Davidson, NC, 28036. E-mail: [email protected]

184 BRAMMER, STAGER, AND TANNER
performance improvement. Any significant change in the performance trend represents a bias,favourable or not. This, identifying potential bias in athletic performance, is the primary focus ofthe current study.
In the early 20th century, Hill (1925) described and proposed that common factors contributeto performance in many sports and equally in both sexes (Figure 1, top). Hill’s early research onthe nature of the changes in athletic performance as the duration of the event increased led to theconclusion that performance was influenced (or limited) by common physiological parameters.
FIGURE 1 Men’s Freestyle Record Progression (1925 vs. current). Top:World records plotted as a function of average speed vs. event duration(Hill, 1925). Bottom: Recreation of Hill’s graph of swimming speed vs.performance time. The solid line represents the current limits to freestyleswimming, whereas the dashed line represents records from 1925. Theslopes of the two lines are not significantly different (color figure availableonline).
PREDICTING 2012 OLYMPIC SWIM PERFORMANCES 185
Nearly a century later, the nature of these relationships appears to be unchanged with no escapefrom these common limiting factors being evident (Figure 1, bottom). As the required endurance(or rather, the length of the athletic event) increases, the speed at which an athlete can performthe event still necessarily decreases. In addition, at any given event length, the progression orimprovement in performance (over the years) has not appeared to disproportionally change.Distance athletes do not appear, for example, to have improved to a greater extent than sprintathletes. Thus, we expect that performances over time have improved similarly, regardless oftheir duration, although with some amount of variability between events. The variable rate ofrecord progression within an event over time, however, has led recent authors to use S-shapedlogistic (Nevill & Whyte, 2005), second order polynomial (Seiler, De Koning, & Foster, 2007),and multiple exponential decay (Berthelot et al., 2008) models to illustrate athletic performanceprogressions. Although these curves may better fit historical performance data, they maynecessarily account for variation due to bias or chance. If these models are to be useful to predictfuture performance, then they must minimize historical and undefined “chance” influences sincethese factors are inherently unreliable (Frucht & Jokl, 1964). Rather, it is likely that a singlepower curve, one that carries a certain range of error and asymptotically approaches a describablelimit, better describes the systematic progression of athletic performance. To do so, however,researchers are forced to focus on group performances rather than individual performance or thatof records per se.
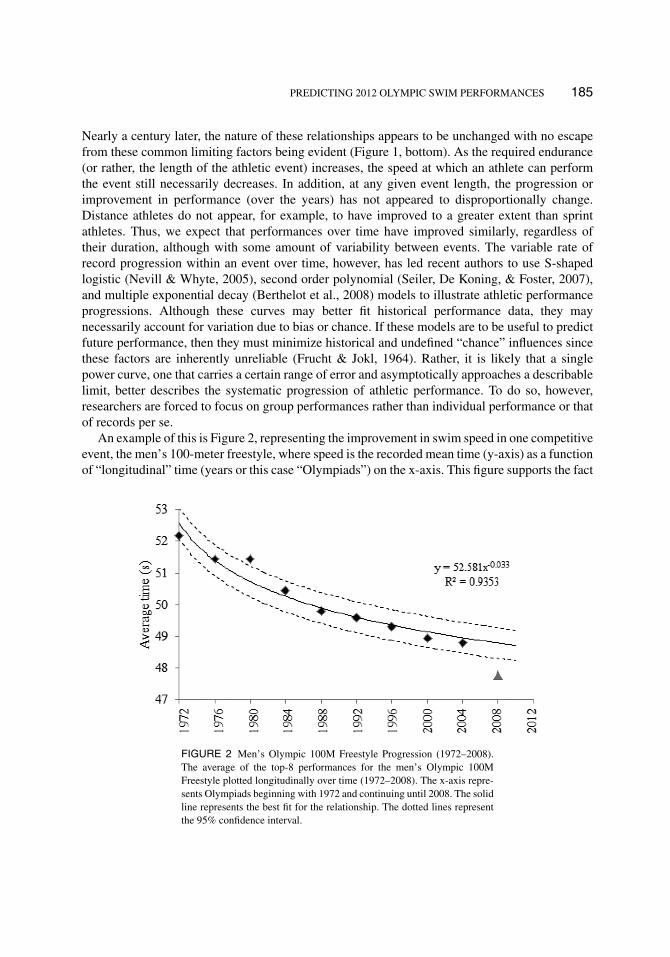
An example of this is Figure 2, representing the improvement in swim speed in one competitiveevent, the men’s 100-meter freestyle, where speed is the recorded mean time (y-axis) as a functionof “longitudinal” time (years or this case “Olympiads”) on the x-axis. This figure supports the fact
FIGURE 2 Men’s Olympic 100M Freestyle Progression (1972–2008).The average of the top-8 performances for the men’s Olympic 100MFreestyle plotted longitudinally over time (1972–2008). The x-axis repre-sents Olympiads beginning with 1972 and continuing until 2008. The solidline represents the best fit for the relationship. The dotted lines representthe 95% confidence interval.

186 BRAMMER, STAGER, AND TANNER
that 1) there has been a non-linear, longitudinal progression in performance, and 2) certain datacan be identified as being statistically “inconsistent” with the preceding data (swim performances)and/or all subsequent data. In Figure 2, for example, only two Olympic Games during whichswimmers did not perform as expected (outside of the 95% confidence interval): once in 1980 andagain in 2008.
One caveat to any mathematical analysis of performance based upon available records of his-torical performances is to accept that undefined and confounding variables may introduce biasesinto the analysis and potentially perturb the ability of any subsequent modelling to be accurate.As time goes by, additional performances will act to “correct” the model, allowing for any ear-lier unconfirmed bias to be obvious (assuming that which caused the bias is no longer present).However, the causes of the temporary perturbations will be speculative at best, until reinforcedby historical confirmation. The Olympic boycott by the USA in 1980 may have been cause forthe relatively slow Olympic performances at these games and the subsequent return to the normalprogression with the USA’s participation thereafter. To illustrate this effect further, the focus ofthis paper will be upon the progression in athletic performances (within competitive swimming),where a known and artificial perturbation was introduced in 2008 and was subsequently removedtwo years later in 2010.
Specific to the present discussion is the recent, hugely controversial “technical suit” issuein competitive swimming. In 2008, with the introduction of “high-tech” body suits, the swim-ming community experienced an extraordinary advancement in performance. At the 2008 BeijingOlympic Games, elite swimmers were shown to perform significantly faster than predicted(Brammer, Tanner, & Stager, 2009). The increased performance was speculated to be due tochanges in body buoyancy caused by the new fabrics incorporated into these suits. It was alsodetermined (by the athletes) that the performance effects of these suits could be magnifiedby wearing multiple suits simultaneously. In 2010, the Federal International Natation Amateur(FINA) proposed and enforced new rules that prevent swimmers from competing while wear-ing the newly introduced swimwear with which the athletes had achieved obvious success in theprevious two years.
The obvious question to pose is how will the swimmers accommodate to the new level of per-formance, now that artificially enhanced speeds have become normal and expected? Interestingly,because none of these new suits existed prior to 2000 and because it is possible to document whennewer versions have been introduced, the athletes and their performances can be used to test ifthese suits have introduced unnatural rates of improvement in swim performance. It is reasonedthat the influence of the new “high-tech” suits can be measured if swim performance models aresensitive enough to do so. The governing bodies and swimmers in 2012 will participate in anexperiment that will allow further understanding of the progression in athletic performance andthe ability to quantify performance bias.
Our primary purpose in this research was to use past Olympic performances to predict2008 and 2012 Olympic swim performances and to determine if the exceptional performancesin 2008 were biased. We hypothesize that, based on the predictive model, 2008 performanceswill not fit expectations, but the 2012 Olympic performances will. The swimmers’ choice ofswimwear in 2008 will explain our failures, and the suit restrictions imposed in 2010 will explainthe accurate prediction of the 2012 Olympic Games.
PREDICTING 2012 OLYMPIC SWIM PERFORMANCES 187
METHODS
The top eight times from the finals of Olympic swimming events from the years 1972 through2008 were obtained on-line from www.swimnews.com and www.usaswimming.org. Data wereanalyzed for mean and standard deviation. A best-fit power curve of the form Time = a × yearb
was computed across all years for each event, where a and b were coefficients, and year wasthe code for the year of the Olympics (1 = 1972, 2 = 1976, and so on up to 10 = 2008). Usingyear = 11 to indicate 2012, the power equations were used to predict the mean performance timeof the eight finalists for each individual event for the upcoming 2012 London Olympic Games.The percent difference between the predicted time and the actual time (absolute value) was cal-culated for each past year and averaged within each event. This number was used to estimate thestandard deviation of the predicted time for each event using the formula 1.25 × (mean percentdifference) × (predicted value)/100. This standard deviation was used to establish the 95% con-fidence interval for that event (predicted time ± 2 standard deviations). The actual mean timeof the finalists of the 2012 Olympics will be compared to this 95% confidence interval. Actualtimes that fall outside the interval will be considered significantly faster or slower than predictedperformances.
In addition, each of the previous six Olympic competitions was examined by using the sameanalysis. Furthermore, the number of instances where the actual performance time was above orbelow the corresponding prediction curve was counted. A binomial test of statistical significancewas then used to determine if the number of events that were faster or slower than predictedwas not expected due to chance alone. The results of this analysis determined whether or not aparticular year was faster or slower, in general, than predicted.
RESULTS AND DISCUSSION
2008 Olympic Analysis
The historical progression in elite swim performance is such that improvements tend to getsmaller from year to year, and thus, the line describing them is not linear but rather one witha decreasing slope as time progresses. Because of the small variance within elite swim times,a performance progression line based on Olympic finalists can be used to extrapolate futureperformances. Stager, Brammer, and Tanner (2010) tested the accuracy of their predictions bycomparing them to actual performances at each of the previous six Olympic Games (1988–2008).Adding data obtained from competitions before that time did not strengthen the nature of therelationships generated as might have been hypothesized. In other words, events two decadesprior to the current competition were shown to have little predictive value on future competitionsoccurring more than twenty years later.
In contrast to the analyzed results for 2000 and 2004, the actual competition results for the2008 swimming events were, in general, exceptionally fast and did not fit the expectations of themathematical model. The model successfully predicted the outcomes of the 2000 and 2004 com-petitions with only a few exceptions. In 2000, the outcome of only one of 26 events exceeded

188 BRAMMER, STAGER, AND TANNER
predictions (men’s 100M butterfly), and in 2004, only two events (men’s 100M butterfly and200M individual medley) failed the model. In contrast, for the 2008 Olympic Games, 10 outof 13 (77%) men’s and 7 out of 13 (54%) women’s events recorded mean times for the eightfinalists that were significantly faster than the predicted outcomes. In several cases, the actualperformances were in excess of five standard deviations from the predicted mean. Only 34% ofthe events in the 2008 Games were successfully predicted by the models. To put this in context,between 1988 and 2004, 87% of all events were successfully predicted. These data are presentedin Table 1 and Figure 3.
Similar calculations comparing actual versus predicted performances for each of the previoussix Olympics were performed. The number of standard deviations the predicted performance dif-fered from the actual in each event was averaged by Olympic year. When all events are “pooled,”the 2008 Games deviated from the model based predictions more than any previous Games, withthe average event offset being faster than statistical models by nearly three standard deviations(Figure 4). From 1988 until 2004, only one other Games stood out significantly. In that case(1996), however, the swimmers were slower than predicted, not faster. Additionally, unlike in2008, the events of the 1996 Games were, on average, within the predicted range of outcomes(i.e., within the 95% confidence interval).
For prior Olympics (1988–2004), the performances of the women were significantly slowerthan expected (p < .05) in 1992 and 1996. In contrast, for the Olympic Games in 1988, 2000 and2004, women swimmers performed as expected. Performances of the men were significantlyfaster than expected in 2000 (p < .05). However, the Games in 1988, 1992, 1996, and 2004 wereas predicted. The men and women combined swam significantly slower than expected (p < .05) in1996, significantly faster than expected in 2000 (p < .05), and as expected in 1988, 1992, and2004. The binomial test of statistical significance revealed that the 2008 Olympic swimming
TABLE 1Summary of Men’s Olympic Prediction Results in 2000, 2004, and 2008
2000 prediction analysis 2004 prediction analysis 2008 prediction analysis
Men’s event Pred M Actual M � (SD) Pred M Actual M � (SD) Pred M Actual M � (SD)
50 Free 22.28 22.19 .85 22.10 22.11 −.12 22.00 21.57 5.46†100 Free 49.28 48.95 1.17 49.00 48.80 .74 48.79 47.77 3.36†200 Free 1:47.58 1:47.43 .19 1:47.13 1:46.49 .96 1:46.61 1:45.81 1.23400 Free 3:47.10 3:46.21 .59 3:45.90 3:45.92 −.01 3:45.09 3:43.72 1.131500 Free 14:59.22 15:01.67 −.26 14:56.68 14:58.05 −.16 14:54.18 14:48.61 −.63100 Back 55.03 54.85 .39 54.76 54.52 −.57 54.50 53.28 3.04†200 Back 1:59.79 1:58.43 1.75 1:58.97 1:57.98 1.17 1:58.31 1:55.54 3.44†100 Breast 1:01.47 1:01.25 .66 1:01.14 1:01.15 −.02 1:00.91 59.64 4.45†200 Breast 1:12.86 1:12.85 .02 1:12.21 1:11.14 1.32 2:11.34 2:09.44 2.06†100 Fly 53.16 52.53 2.16† 52.77 51.98 2.41† 52.38 51.23 3.29†200 Fly 1:57.54 1:56.69 1.37 1:56.92 1:55.89 1.51 1:56.33 1:53.86 3.87†200 IM 2:01.26 2:01.13 .42 2:00.74 1:59.71 3.55† 2:00.02 1:57.88 5.46†400 IM 4:15.79 4:16.74 −1.49 4:15.00 4:14.71 −.42 4:13.99 4:10.54 5.45†
Note: Predictions were based on extrapolation of the mean of top 8 performances for each Olympics since 1972.� (SD) = the number of standard deviations between actual and predicted means.† = significantly faster than predicted, p < .05.

PREDICTING 2012 OLYMPIC SWIM PERFORMANCES 189
FIGURE 3 Predictive Success Rate of All Olympic Events (1988–2008).Percentage of total events successfully predicted (within 95% C.I.) foreach Olympic Games for men, women, and combined men and womencategories.
FIGURE 4 Olympic Prediction Model Accuracy (1988–2008). Averagedifference, in standard deviations, between actual and predicted per-formances of Olympic swimming events. A positive value denotes theaverage of actual event means were faster than the predicted event means.∗denotes significant difference compared to all other groups.
190 BRAMMER, STAGER, AND TANNER
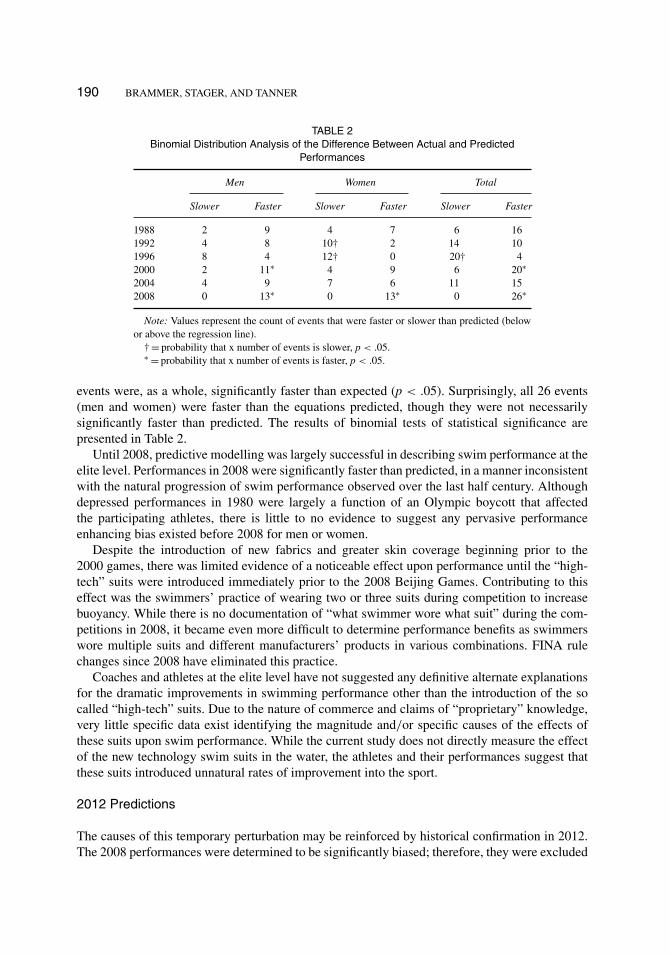
TABLE 2Binomial Distribution Analysis of the Difference Between Actual and Predicted
Performances
Men Women Total
Slower Faster Slower Faster Slower Faster
1988 2 9 4 7 6 161992 4 8 10† 2 14 101996 8 4 12† 0 20† 42000 2 11∗ 4 9 6 20∗2004 4 9 7 6 11 152008 0 13∗ 0 13∗ 0 26∗
Note: Values represent the count of events that were faster or slower than predicted (belowor above the regression line).
† = probability that x number of events is slower, p < .05.∗ = probability that x number of events is faster, p < .05.
events were, as a whole, significantly faster than expected (p < .05). Surprisingly, all 26 events(men and women) were faster than the equations predicted, though they were not necessarilysignificantly faster than predicted. The results of binomial tests of statistical significance arepresented in Table 2.
Until 2008, predictive modelling was largely successful in describing swim performance at theelite level. Performances in 2008 were significantly faster than predicted, in a manner inconsistentwith the natural progression of swim performance observed over the last half century. Althoughdepressed performances in 1980 were largely a function of an Olympic boycott that affectedthe participating athletes, there is little to no evidence to suggest any pervasive performanceenhancing bias existed before 2008 for men or women.
Despite the introduction of new fabrics and greater skin coverage beginning prior to the2000 games, there was limited evidence of a noticeable effect upon performance until the “high-tech” suits were introduced immediately prior to the 2008 Beijing Games. Contributing to thiseffect was the swimmers’ practice of wearing two or three suits during competition to increasebuoyancy. While there is no documentation of “what swimmer wore what suit” during the com-petitions in 2008, it became even more difficult to determine performance benefits as swimmerswore multiple suits and different manufacturers’ products in various combinations. FINA rulechanges since 2008 have eliminated this practice.
Coaches and athletes at the elite level have not suggested any definitive alternate explanationsfor the dramatic improvements in swimming performance other than the introduction of the socalled “high-tech” suits. Due to the nature of commerce and claims of “proprietary” knowledge,very little specific data exist identifying the magnitude and/or specific causes of the effects ofthese suits upon swim performance. While the current study does not directly measure the effectof the new technology swim suits in the water, the athletes and their performances suggest thatthese suits introduced unnatural rates of improvement into the sport.
2012 Predictions
The causes of this temporary perturbation may be reinforced by historical confirmation in 2012.The 2008 performances were determined to be significantly biased; therefore, they were excluded

PREDICTING 2012 OLYMPIC SWIM PERFORMANCES 191
TABLE 32012 Men’s Olympic Swimming Predictions
Predicted 2012
Men’s Events 2008 Actual Pred M ± S.D. 95% Confidence interval
50 Free 21.57 21.91 .08 21.75–22.07100 Free 47.77 48.64 .25 48.15–49.13200 Free 1:45.81 1:46.27 .64 1:45.01–1:47.53400 Free 3:43.72 3:44.35 1.23 3:41.95–3:46.751500 Free 14:48.61 14:51.59 7.34 14:37.21–15:05.97100 Back 53.28 54.32 .38 53.57–55.07200 Back 1:55.54 1:57.96 .86 1:56.27–1:59.65100 Breast 59.64 1.00.70 .27 1:00.17–1:01.23200 Breast 2:09.44 2:10.80 .89 2:09.06–2:12.54100 Fly 51.23 52.21 .38 51.47–52.95200 Fly 1:53.86 1:56.01 .77 1:54.51–1:57.51200 IM 1:57.88 1:59.62 .47 1:58.70–2:00.54400 IM 4:10.54 4:13.13 .65 4:11.85–4:14.41
Note: Shows a comparison of 2012 Olympic predictions to the 2008 actual Olympic per-formances in each event. The 2012 predictions were based on Olympic data from 1972–2004(without the inclusion of 2008 results). All of the event outcomes are predicted to be slowerthan in 2008.
from the 2012 prediction analysis. If the advancement in performance was not due to the intro-duction of the suits but rather due to better coaching or enhanced training techniques, then the“bias” should persist in 2012, and the prediction model will again fail. Alternately, if the suits didartificially improve performance, then the 2010 ban on “high-tech” swimwear will cause 2012 toreturn to the pre-2008 performance progression curve, and the prediction model will be deemedaccurate. Given the results of the 2012 Olympic prediction analysis, we predict that the aggregate2012 swimming performances will be, on average, slower than in 2008 (Tables 3 & 4).
The predicted 2012 Olympic performances in Tables 3 and 4 represent the predicted meanof the top-eight performances for each event of the 2012 Olympic Games, based on Olympicdata from each of the last ten Games, except 2008. Each prediction includes a standard deviationand a 95% confidence interval. Results that fall outside of this boundary will be deemed signifi-cantly faster or slower than predicted. The prediction model predicts that every event except thewomen’s 100M breaststroke will be slower in 2012 than in 2008.
If we attempt to predict which events are most likely to be faster than in Beijing, then it isbest to do so under the context of its historical progression. Comparing actual 2008 performancesto the prediction model, the corresponding year reveals either the length of time we are behindexpectations, or the length of time that we need to “catch up” with the artificially enhanced2008 performances. Assuming each event improves at a unique pace, then some events necessar-ily lag behind others in terms of the global performance progression. Indeed, the model predictsthat certain performances in 2008 are not expected to be achieved (unaided) until many yearsdown the road. Other performances from Beijing, because these events have not progressed tothe same degree, have a greater potential of being improved upon in London. Based on the pre-2008 prediction curve, performances in 4 out of 13 men’s and 9 out of 13 women’s events areexpected to be faster in 2012 than they were in 2008 (Table 5).

192 BRAMMER, STAGER, AND TANNER
TABLE 42012 Women’s Olympic Swimming Predictions
Predicted 2012
Women’s Events 2008 Actual Pred M ± S.D. 95% Confidence interval
50 Free 24.36 24.67 .09 24.50–24.84100 Free 53.80 54.28 .30 53.70–54.86200 Free 1:56.35 1:57.76 .58 1:56.63–1:58.89400 Free 4:04.89 4:06.42 1.65 4:03.18–4:09.66800 Free 8:24.42 8:24.69 3.28 8:18.26–8:31.12100 Back 59.53 1:00.65 .35 59.97–1:01.33200 Back 2:07.77 2:09.45 1.01 2:07.47–2:11.43100 Breast 1:07.30 1:06.98 .32 1:06.35–1:07.61200 Breast 2:23.30 2:23.80 .83 2:22.17–2:25.43100 Fly 57.70 58.36 .48 57.42–59.30200 Fly 2:06.58 2:07.77 .71 2:06.38–2:09.16200 IM 2:10.86 2:12.26 .42 2:11.44–2:13.08400 IM 4:35.15 4:36.96 2.46 4:32.13–4:41.79
Note: Shows a comparison of 2012 Olympic predictions to the 2008 actual Olympicperformances in each event. The 2012 predictions were based on Olympic data from 1972–2004 (without the inclusion of 2008 results). With only one exception, the women’s 100MBreaststroke, the event outcomes are predicted to be slower than in 2008.
TABLE 5Predicted Year the 2008 Olympic Performances were Expected
Men Women Men Women
Event 2008 top-8 Year 2008 top-8 Year Event 2008 top-8 Year 2008 top-8 Year
50 FS 21.57 2020 24.36 2016 100 BR 59.64 2024 1:07.30 2001100 FS 47.77 2023 53.80 2009 200 BR 2:09.44 2008 2:23.30 2005200 FS 1:45.81 2002 1:56.35 2015 100 FL 51.23 2017 57.70 2006400 FS 3:43.72 2002 4:04.90 2001 200 FL 1:53.86 2021 2:06.58 20091500 FS 14:48.61 1996 8:24.42 1995 200 IM 1:57.88 2021 2:10.86 2017100 BK 53.28 2019 59.53 2021 400 IM 4:10.54 2018 4:35.15 2000200 BK 1:55.54 2020 2:07.77 2008
Note: Using the pre-2008 progression curve for each event, the year in which the 2008 performance is predicted tooccur is provided. For example, the 2008 men’s 50 Freestyle top-8 average performance of 21.57 seconds was expectedto occur in the year 2020.
However, in many cases, the 2008 performances are between one and two standard deviationsfaster than the predicted 2012 values (Tables 3 & 4). Thus, these predictions would have to beglobally underestimating 2012 performances in order for the London Games, as a whole, to befaster than the Beijing Games. Given the results of the previous analysis (Table 2, Figure 3, &Figure 4), it is just as likely that, rather than underestimating 2012 performance, the model eitheraccurately predicts, or overestimates actual performance.
Unfortunately, predicting swim performance is a complex endeavour, and too often signifi-cant variables are not taken into account. If perceptions of “what is possible” and “what comes
PREDICTING 2012 OLYMPIC SWIM PERFORMANCES 193
to be expected” mirror the rate of performance improvement, and if these perceptions drive per-formance outcomes, then it may follow that the suit-aided performances of 2008 changed theperception of what is possible to a point well beyond what would be possible otherwise. If thoseperceptions have persisted beyond FINA’s ruling in 2010, then performance could continue to beelevated.
If a number of performances are faster in 2012 than in 2008, the public (especially suit man-ufacturers) may downplay the effect of the banned suits, which may lead to renewed discussionto allow the use of “high-tech” suits in competition. In fact, claims are already being made bysuit manufacturers that their suits (introduced in 2011 and 2012) provide performance advan-tages over previous fabrics and technology. Although the existing rules in swimming limit theuse of aides to improve performance, commercial manufacturing of these suits has continued toprovide a product that purportedly stretches those limits. However, even if the results of manyof the 2012 Olympic events are faster than in 2008, they may be within the predicted range.Therefore, faster performances in 2012 than in 2008 do not necessarily mean the “high-tech”suits of 2008 and 2009 did little to assist performances.
Conclusions
These results illustrate that prior historical outcomes of athletic competition allow for the pre-diction of future competition to a high degree of accuracy unless a bias is introduced into thecompetitive environment. We hypothesize that the 2012 Olympic swim performances will realignwith our prediction model, thus demonstrating the reliability of the authors’ prediction analysisand confirming the suit bias of 2008. We readily admit that these results are only partially com-plete, as the test of this analysis (i.e., the success of our predictions) awaits the conclusion of the2012 Olympic Games.
REFERENCES
Berthelot, G., Thibault, V., Tafflet, M., Escolano, S., El Helou, N., Jouven, X., Hermine, O., & Toussaint, J. F. (2008).The citius end: World records progression announces the completion of a brief ultra-physiological quest. PLoS ONE,3, e1552.
Brammer, C. L., Tanner, D. A., & Stager, J. M. (2009). Identification of bias in the natural progression of swimperformance. Medicine and Science in Sports and Exercise, 41, S306.
Frucht, A. H., & Jokl, E. (1964). Parabolic extrapolation of Olympic performance growth since 1900. Journal of SportsMedicine and Physical Fitness, 4, 142–152.
Hill, A.V. (1925). The physiological basis of athletic records. Nature, 116, 544–548.Nevill, A. M., & Whyte, G. (2005). Are there limits to running world records? Medicine and Science in Sports and
Exercise, 37, 1785–1788.Seiler, S., De Koning, J., & Foster, C. (2007). The fall and rise of the gender difference in elite anaerobic performance
1952–2006. Medicine and Science in Sports and Exercise, 39, 534–540.Stager, J. M., Brammer, C. L., & Tanner, D. A. (2010). Identification of a bias in the natural progression of swim per-
formance. In P. Kjendlie, R. Stallman, & J. Cabri (Eds.), Biomechanics and medicine in swimming XI (pp. 294–296).Champaign, IL: Human Kinetics.