BEYOND THE CLASSROOM: NATIONAL BUREAU OF ECONOMIC …
41
NBER WORKING PAPER SERIES BEYOND THE CLASSROOM: THE IMPLICATIONS OF SCHOOL VOUCHERS FOR CHURCH FINANCES Daniel M. Hungerman Kevin J. Rinz Jay Frymark Working Paper 23159 http://www.nber.org/papers/w23159 NATIONAL BUREAU OF ECONOMIC RESEARCH 1050 Massachusetts Avenue Cambridge, MA 02138 February 2017 The authors gratefully acknowledge funding from the John Templeton Foundation, without whose support this project would not have been possible. This paper is released to inform interested parties of research and to encourage discussion. The views expressed are those of the authors and not necessarily those of the U.S. Census Bureau or the National Bureau of Economic Research. During this paper's composition, one of the authors was employed by the Archdiocese of Milwaukee. NBER working papers are circulated for discussion and comment purposes. They have not been peer-reviewed or been subject to the review by the NBER Board of Directors that accompanies official NBER publications. © 2017 by Daniel M. Hungerman, Kevin J. Rinz, and Jay Frymark. All rights reserved. Short sections of text, not to exceed two paragraphs, may be quoted without explicit permission provided that full credit, including © notice, is given to the source.
Transcript of BEYOND THE CLASSROOM: NATIONAL BUREAU OF ECONOMIC …
NBER WORKING PAPER SERIES
BEYOND THE CLASSROOM:THE IMPLICATIONS OF SCHOOL VOUCHERS FOR CHURCH FINANCES
Daniel M. HungermanKevin J. RinzJay Frymark
Working Paper 23159http://www.nber.org/papers/w23159
NATIONAL BUREAU OF ECONOMIC RESEARCH1050 Massachusetts Avenue
Cambridge, MA 02138February 2017
The authors gratefully acknowledge funding from the John Templeton Foundation, without whose support this project would not have been possible. This paper is released to inform interested parties of research and to encourage discussion. The views expressed are those of the authors and not necessarily those of the U.S. Census Bureau or the National Bureau of Economic Research. During this paper's composition, one of the authors was employed by the Archdiocese of Milwaukee.
NBER working papers are circulated for discussion and comment purposes. They have not been peer-reviewed or been subject to the review by the NBER Board of Directors that accompanies official NBER publications.
© 2017 by Daniel M. Hungerman, Kevin J. Rinz, and Jay Frymark. All rights reserved. Short sections of text, not to exceed two paragraphs, may be quoted without explicit permission provided that full credit, including © notice, is given to the source.

Beyond the Classroom: The Implications of School Vouchers for Church FinancesDaniel M. Hungerman, Kevin J. Rinz, and Jay FrymarkNBER Working Paper No. 23159February 2017JEL No. H4,I2,Z12
ABSTRACT
Governments have used vouchers to spend billions of dollars on private education; much of this spending has gone to religiously-affiliated schools. We explore the possibility that vouchers could create a financial windfall for religious organizations operating private schools and in doing so impact the spiritual, moral, and social fabric of communities. We use a dataset of Catholic-parish finances from Milwaukee that includes information on both Catholic schools and the parishes that run them. We show that vouchers are now a dominant source of funding for many churches; parishes in our sample running voucher-accepting schools get more revenue from vouchers than from worshipers. We also find that voucher expansion prevents church closures and mergers. Despite these results, we fail to find evidence that vouchers promote religious behavior: voucher expansion causes significant declines in church donations and church spending on non-educational religious purposes. The meteoric growth of vouchers appears to offer financial stability for congregations while at the same time diminishing their religious activities.
Daniel M. Hungerman Department of Economics University of Notre Dame 439 Flanner HallNotre Dame, IN 46556-5602 and [email protected]
Kevin J. RinzUS Census Bureau4600 Silver Hill Road Washington, DC 20233 [email protected]
Jay FrymarkSt. Joseph ParishGrafton, Wisconsin [email protected]
1 Introduction
In the United States, private schools are dominated by religious organizations. According to
the Private School Survey, over 80% of all private school students in the 2011/2012 school year
attended a religiously-affiliated school. The most common type of religious private school in the
US is a Catholic School, and most Catholic schools are operated by the local Catholic Church.
The educational environment facing these schools and their churches has dramatically changed
in recent years with the rise of school vouchers and related programs that use government funds to
subsidize attendance at private elementary and secondary schools. These programs have become
enormously popular. Nearly half of all states have enacted a voucher-style school-choice program
supporting private schools (AFC Growth Fund, 2016), and billions of dollars have been spent on
these programs. The current presidential administration has indicated a strong interest in pursuing
large-scale voucher funding nationally, which would increase voucher support even further (Strauss,
2017).
With the rise of vouchers, a large literature has developed to investigate the effects of voucher
programs. Most of this work has focused on the impact of voucher programs on educational out-
comes (see Figlio, 2009; Hoxby, 2003a; the Center on Education Policy, 2011; and Epple, Romano,
and Urquiola, forthcoming, for reviews). The focus of this literature is quite understandable and
worthwhile.
However, since vouchers subsidize attendance at religiously affiliated schools, they have the
potential to impact not just educational outcomes, but the outcomes of churches that operate
private schools as well. Religious schools not only dominate private education, but also appear to
dominate the market for voucher-accepting schools. Data from the 2007-2009 wave of the Schools
and Staffing Survey indicates that, among all students attending a voucher-accepting private school,
85 percent attend a religiously-oriented school. But the implications of voucher programs for
religious groups is a topic that has received relatively little attention. In fact, to our knowledge it has
received no attention in prior academic work. At the same time, discussions of vouchers among the
media, policy makers, and ordinary citizens often concern whether, in the words of Justice William
Rehnquist, vouchers have “the effect of advancing or inhibiting religion” (Rehnquist, 2002).1
1See for example Bronner (1998), Editorial Desk of the New York Times (2002), Banchero and Levitz (2012),Weaver (2011), PBS (2014), Duncan (2003), and Kagan (2011).
2

In this paper, we take up the argument that a primary effect of vouchers may not involve
educational outcomes but instead may concern the funding of religious activities and the resultant
changes in how religious groups organize and behave. Our study uses a dataset of 71 Catholic
parishes in Milwaukee covering the years 1999 to 2013. In an era where studies featuring enormous
or unusual datasets have become commonplace, we nonetheless regard our dataset of Milwaukee
parishes as somewhat extraordinary. Churches do not have to provide financial information to the
government, and while some efforts have been made to obtain data from non-Catholic parishes
(e.g., Gruber and Hungerman, 2008), we are unaware of any prior study in any discipline which
provides financial information on a set of Catholic parishes and their schools over time. Our data
allows us to do so in a city featuring one of the most famous voucher programs in the country
(Rouse, 1998). Our data includes information on revenues and expenditures for a parish’s Catholic
school, voucher revenue for the school, non-educational revenues and expenditures at the parish,
and offertory revenue (e.g., contributions from worshipers). We can thus see how increased voucher
revenue affects school finances and non-educational church finances.
Participation in the voucher program is voluntary for both students and schools. Thus, parishes
with high levels of voucher revenue might differ from other parishes for a variety of reasons, includ-
ing reasons unrelated to voucher spending. Comparisons of parishes with voucher-accepting schools
to other parishes could confound the effects of vouchers with these other attributes. To address this
fact, we exploit several changes in school choice policies during the period of our sample. These
policies altered the maximum voucher payment, expanded voucher eligibility to new communities,
and changed the income-eligibility thresholds for some students in some years. We combine this
information with detailed address information on each parish to construct a measure of how gen-
erous voucher policy is in a given year for a given parish in a given neighborhood. We then exploit
the panel nature of our data to follow parishes over time, comparing financial outcomes for parishes
seeing significant changes in voucher policy relative to other parishes. Further, we can make this
comparision among parishes with schools as well as among those without.
We find that expansion in voucher policy is, unsurprisingly, associated with increases in voucher
revenues for parishes with schools. We also find that voucher expansion prevents parish closures
and mergers. We document this result using hazard regressions, but it is suggested by simple
inspection of the data: closures are reasonably common before the first major voucher expansion
3
we study and stop almost entirely thereafter.
We further see how voucher expansion impacts parishes’ finances. Interestingly, and the above
results notwithstanding, we find no evidence that vouchers subsidize parish religious activity beyond
the operation of religious schools. In fact, our estimates repeatedly suggest the opposite. Vouchers
cause a significant decrease in spending on non-school religious purposes such as religious staff
salaries, mission support, and church maintenance. We also find that voucher programs lead to a
significant decrease in church donations. These results are driven by parishes with schools and are
robust to a battery of tests.
These effects are large in magnitude. Our results suggest that if voucher eligibility in a parish’s
community increased from no eligibility to the level of eligibility in the average program, non-
educational religious expenditures (that is, expenditures on activities other than running a school)
would decline by about $175,000 and non-educational revenue would decrease by even more, about
$300,000. Put differently, our numbers suggest that, within our sample alone, the Milwaukee
voucher program has led over time to a decline in non-educational church revenue of $60 million.
These large effects are driven by the large size of the voucher program itself.
Thus, the intensive-margin investigation made possible by our financial data tells a very different
story than the extensive-margin one suggested by a simple focus on parish survival. While the
extensive- and intensive-margin stories work in opposite directions, the intensive margin effects we
identify are net effects that subsume the effect of vouchers on closures. That is, the overall impact
of vouchers on religious revenues and expenditures is negative.
These results indicate that voucher programs could have large and potentially unanticipated
impacts on religious life in the United States in years to come. The US finds itself today in an
unprecedented period of religious decline. Recent decades have seen a large rise in the fraction of
Americans reporting no religious affiliation, and even giving to religious causes (traditionally largest
area of charitable giving by far) has begun to fall while giving overall continues to grow (Hout and
Fischer, 2002; Velasco, 2015; Campbell and Putnam, 2012; Voas and Chaves, 2016). This shift is
noteworthy as studies have shown that religiosity is strongly related to a variety of economically
and socially relevant outcomes (Fruehwirth, Iyer, and Zhang, 2016; Hungerman, 2014; Fletcher and
Kumar, 2014; see Iyer, 2016 for a review), and that congregations provide a variety of public goods,
4

often jointly with the government.2
In this time of declining religion, our work suggests that such joint provision represents not
only a source of competition between church and state but also a potentially crucial source of
subsidization. The idea that public funding would provide an important, even dominant, source
of support to congregations would have been unthinkable a few years ago. But this possibility has
quickly become reality. In our data, the typical parish accepting vouchers gets more revenue from
government-funded vouchers (nearly a million dollars annually) than from offertory donations. But
our work highlights the complexity of this relationship: the meteoric growth of vouchers could
provide financial stability for congregations while at the same time diminishing their religious
activities. The “effect” of vouchers on religion depends upon whether one characterizes religion by
the prevalence of churches or by the activities within churches.
Our study also highlights the potentially large consequences of voucher expansion on outcomes
unrelated to educational attainment. This is particularly noteworthy since some scholars have
begun to conclude that vouchers may be somewhat ineffectual in generating gains in educational
attainment for voucher recipients. In their survey of voucher programs, Epple, Romano, and
Urquiola (forthcoming) surmise that “empirical research does not suggest that awarding students
a voucher is a systematically reliable way to improve their educational outcomes.” Prior work has
suggested that vouchers may nonetheless be influential by, for example, altering public education
(Figlio and Hart, 2014), but here we argue that the effects of vouchers could be broader still.
Perhaps a key, if not the key, impact of vouchers on society will involve educational attainment
only incidentally.
The next section provides background on Catholic churches in Milwaukee and on Milwaukee’s
voucher programs. Section 3 provides information on our data, empirical methodology, and speci-
fications. Section 4 gives results and section 5 concludes.
2 Background
2.1 The Milwaukee Archdiocese
There are over 6,500 Catholic elementary and secondary schools, enrolling over 40% of all
2Examples on the provision of public goods include Frank and Iannaccone (2014), Iyer (2016), Chen (2010),Bentzen (2015), Dills and Hernandez-Julian (2014), Gill (2004), Hungerman (2005), Gruber and Hungerman (2007),Gerber, Gruber, Hungerman (2016), and Chen and Lind (2016).
5

private-school students in the country (McDonald and Schultz, 2014). The Catholic Church is
organized into geographical regions; typically these regions are called either a diocese or an arch-
diocese.3 There are about 200 diocese and archdiocese in the United States. The data used in this
paper cover the Archdiocese of Milwaukee. The Archdiocese of Milwaukee includes the city (and
county) of Milwaukee, along with several other surrounding counties in southeastern Wisconsin.4
The term parish, which will be used repeatedly here, refers to a local Catholic church as well as
any related facilities, such as a school, under the supervision of a particular pastor. There were 216
parishes in the Milwaukee Archdiocese in 2007.
About half of parishes operate a Catholic school. Parish schools are typically—and in the case
of Milwaukee during our study, entirely—elementary schools.5 They are also, of course, private
schools. These schools are not operated by the local government and traditionally they have not
received any tax-based revenue. Instead, the operation and financing of a Milwaukee parish school
is overseen by the parish itself.6 Most parish financial decisions concerning the parish school and
parish church are made at the parish level, often by the pastor with the guidance of councils of
parish members. From a financial and operational standpoint, the parish church and the parish
school can be taken as an integrated agent.7
The setting we study—and the modern period of the US Catholic Church—is a setting where
many parishes have faced increased financial hardship. This hardship is often greater for parishes
with a school. Frequently, the school’s revenues do not subsidize parish activity; instead, parishes
use church revenues (such as offertory funds collected during worship) to subsidize their school.8
This relationship is not unique to the modern era nor is it unique to “struggling schools.” For
3A diocese is headed by a bishop while an archdiocese is headed by an archbishop.4The other counties are Dodge, Fond du Lac, Kenosha, Ozaukee, Racine, Sheboygan, Walworth, Washington, and
Waukesha. For an excellent discussion of the history of this archdiocese, see Avella (2002, 2014).5Subsequent to our study, St. Anthony School, a large and well-known school in Milwaukee, became a high school.6This is the case in Milwaukee, but it is not the case in all dioceses. For example, parish schools in the Archdiocese
of New York are currently managed separately from the parish churches (Otterman, 2014). The Archdiocese ofMilwaukee does own some property–for example, the archdiocese controls a cemetery that was the subject of “fiercelitigation” in a bankruptcy case that gained national attention (Vielmetti, 2015). But this archdiocese did not duringthe period of study here own any schools, or parishes, or their property. The bankruptcy case began during the finalyear of our study; dropping this year from our sample does not alter the main findings shown below.
7Most parishes and schools have a “one-to-one” relationship: the parish has one school and a school answersto a single parish. However, some parishes have jointly supported schools that serve multiple parishes, and some-times multiple schools may be consolidated into a single, multi-parish school (indeed, sometimes entire parishes areconsolidated). We discuss how we handle multi-parish schools and the consolidation of parishes more below.
8Of course, the estimates below will identify the marginal impact of a dollar of school revenue on finances, whichcould in theory be the same regardless of whether or not a school is a net contributor to its parish finances.
6

example, in the 1950s Pius XI was one of the most successful parish schools in Milwaukee (perhaps
the state of Wisconsin), but it was heavily subsidized by its parish, St. Anthony of Padua (Avella,
2002; pg 654).
In addition to parish support, many parish schools rely on tuition and donations for revenue.
Catholic schools typically charge lower-than-average tuition compared to other private schools.9
In the 2007/08 school year, average Catholic elementary school tuition was $4,200, less than half
as much as nonsectarian elementary schools (U.S. Department of Education, 2007-08). However,
Catholic education tuition costs have risen in recent decades; this has partly been driven by the
decline in the share of nuns as teachers (Meyer, 2007). The archdiocese does not subsidize parish
or parish-school activities.
Financial hardship has coincided with a decline in the participation of young families in the
Catholic Church. Figure 1 shows total infant baptisms in (a) the Archdiocese of Milwaukee and
(b) the entire United States, from 1999 to 2011. Each trend is normalized to 100 in 1999 so that
each line shows the percentage change, year after year, in baptisms, relative to 1999. (There were
about 1 million baptisms in the US in 1999, and about 9,000 in Milwaukee.) There are two main
takeaways from the picture. First, each trend shows a decline in baptisms, with baptisms in 2011
roughly 25 percent below their 1999 levels. Second, while the Milwaukee trend is unsurprisingly
somewhat noisier, it is reasonably close to the overall US trend.
Catholic schools in Milwaukee have faced other challenges mirrored by Catholic schools across
the country. As Henk and Maney (2013) write, “the trials and tribulations faced in Milwaukee will
sound all too familiar to anyone who knows the K-12 Catholic education sector.” Most notably,
the trends in Figure 1 have been accompanied by a decline in Catholic-school enrollment. In 2014,
there were about 2 million students in Catholic schools in United States; the population of Catholic-
school students makes up the plurality of US private school students but is far below its peak of 5.6
million in 1965 (McDonald Schultz, 2014). This decline has been largest in the Midwest and east
coast (where Catholic schools are most prevalent), and has been largest in urban areas (McDonald
and Schultz, 2014). Brinig and Garnett (2014) note several reasons for dwindling enrollment,
including competition from charter schools, struggles to appeal to under-served populations (e.g.,
9In fact, in the early 20th century in Milwaukee (before the period of study here), many Catholic schools weretuition-free (Avella, 2002, p. 450).
7

Hispanics), and increasing tuition costs. They summarize the situation of Catholic schools thusly:
“The Catholic school financial model—which depended upon the generosity of parishioners in pews
that are now empty and the free labor of nuns who are now retired—cannot be sustained.” Catholic
schools and parishes also had to contend in the early 2000s with accusations of abuse by priests,
an episode considered in Hungerman (2013), Dills and Hernandez-Julian (2014), and Bottan &
Perez-Truglia (2015).10
Facing these hardships, Catholic schools have become increasingly diverse and focused on serving
inner-city, disadvantaged students (Henk and Meyer, 2014). In 2014, 26 percent of Catholic school
students were nonwhite and 16 percent were non-Catholic (McDonald and Shultz, 2014). The story
is similar in Milwaukee.
It is in this context of declining finances, enrollment, and participation by young families that
vouchers in Milwaukee and elsewhere have been introduced. By subsidizing attendance at Catholic
parochial schools, these vouchers could impact overall parish life in several ways. First, since
Milwaukee parishes operate a unified budget and typically subsidize their schools, vouchers may
create a financial benefit by raising school revenue. This could happen either through increased
enrollment, or through increased tuition as would be the case in a standard subsidy-incidence story.
Next, vouchers could impact the composition of families at the parish school. The voucher
programs we study, discussed more below, mainly focus on populations of students that may be
unfamiliar with Catholicism. Inducing these students to enroll in Catholic parishes could lead to
new families joining or participating in parish activities. Vouchers could also alter the behavior
of those already involved in parish life. For instance, vouchers could increase participation in a
parish among established Catholics responding to increased vitality at a parish school. Alternately,
vouchers could “crowd out” the financial support of parishioners. Further, school participation
in vouchers is voluntary. Some schools choose not to accept vouchers. If vouchers prompt some
parish-school students to leave their parish school, we could see flight away from voucher parishes
to (for example) non-voucher parishes.
10Virtually all allegations of abuse occurred in the years before voucher expansions in our data. However, usinginformation made available by Bishop Accountability, we constructed a variable capturing the total number of ac-cusations made against current or former individuals associated with parishes in our data over time. Our empiricalmethodology, discussed below, will identify the effects of vouchers based on policy expansions that should vary in-dependently of these historical episodes, but we nonetheless control for allegations in all of our results shown in thetables. Our results are essentially identical regardless of whether we control for allegations or not.
8

The fact that school acceptance of vouchers is voluntary raises a central empirical challenge.
Since voucher money is not randomly assigned, one cannot simply compare outcomes at parishes
with high voucher revenues to other parishes to learn about the effects of vouchers, as parishes
voluntarily accepting vouchers may differ from other parishes. We discuss our empirical strategy
for dealing with this below—but, first, we discuss the details of the voucher programs themselves.
2.2 Milwaukee Voucher Programs
Several programs made vouchers available to students in the Milwaukee Archdiocese during
the period of our study. The first program, and one of the most famous voucher programs in
the country, is the Milwaukee Parental Choice Program, or MPCP. Epple, Romano, and Urquiola
(forthcoming) write that “Milwaukee is in many respects the most important voucher program
in the U.S. and has served as a model for others.” The program was enacted by the legislation
1989 Act 336. This program provided public funds to private schools in the city of Milwaukee,
via a voucher, to cover the cost of attendance for eligible low-income students living in the city
of Milwaukee. Schools initially were required to be nonsectarian (Kava, 2013). The program was
subsequently expanded to allow for the participation of sectarian schools, although this initial (and
well-known) expansion of the program precedes the period for which we have data.11
The maximum voucher payment in the MPCP program is capped each year. For each partic-
ipating student, a school can receive this maximum voucher payment or the school’s calculated
cost per student, whichever is less. The cap is increased each year “by the statewide per pupil
increase allowed under the revenue limits imposed upon public school districts” by the state of
Wisconsin (MPCP facts and figures, 2000). According to Ritsche (2006), for voucher students, tu-
ition checks are paid to the pupil’s parent or guardian but must be endorsed for use by the private
school.12 Beyond the voucher-payment, schools may charge certain fees to students, such as fees
for extracurricular activities, musical instruments, meals, and after-school care.13 For voucher stu-
dents in grades kindergarten through 8th (the population served by schools in our study), schools
may not charge tuition beyond the voucher payment (Evers, 2016). Schools cannot charge fees
for instruction, registration, books, or salaries. Schools cannot require parents to raise funds or
11This distinguishes voucher schools from charter schools, which are public (nonsectarian) schools in Milwaukee.No major expansions of charter schools in Milwaukee occur during our period of study.
12This method of payment has subsequently changed; today, vouchers are directly paid to the school.13Private schools are not required to provide transportation to voucher students.
9

otherwise volunteer for a school.
Currently, application for a voucher is done online. The only information private schools can use
to determine admission for voucher applicants is family income, prior year attendance, residency,
and the ages of students entering kindergarten or first grade. Schools cannot consider race, ethnic
background, or grades or test scores for admission. Schools also cannot base admission decisions on
religiosity. Schools may enroll as many voucher students as they wish, but they must notify parents
of how many voucher slots are available. In the event that applications exceed eligible slots, vouchers
are given via lottery. Following enrollment, if a voucher student’s parent or guardian submits to
a student’s teacher or principal a written request that the student be excused from any religious
activity, the school must honor that request (Evers, 2016).
During our period of study, the first noteworthy change in this program occurred with the
legislation 2005 WI ACT 125. (Despite its name, the law became effective in 2006.) This law raised
the income-eligibility limit for currently participating families to 220 percent of the poverty level;
before this it had been set at 175 percent of the poverty level. The income limit for new-applicant
families was kept the same. The program also eliminated the requirement that children applying
for a voucher had to have been in the prior year (i) not in school (ii) in a Milwaukee Public School
(iii) an MPCP participant or (iv) in grades K-3 in a private school (McShane, Kisida, Jensen, Wolf,
2012). This law also required schools to administer standardized tests and seek accreditation within
3 years (Ritsche, 2006), although the Milwaukee Archdiocese itself was an accepted accredidating
body (Kava, 2013).
In 2011, the income threshold for new voucher students increased to 300 percent of poverty.
Further, students continuing in the program no longer had to verify income eligibility. Additionally,
schools not in the city of Milwaukee could accept vouchers from eligible Milwaukee families. This
legislation also created the Racine Parental Choice Program, or RPCP, for students who reside
in the Racine Unified School District.14 This program provides vouchers to low-income students
living in the city of Racine.15
The Racine program differs in several ways from the MPCP program. Vouchers are only avail-
able to students who were in the program or in a public school in Wisconsin in the prior year, not in
14There is also now a statewide voucher program in Wisconsin, the Wisconsin Parental Choice Program, but itsintroduction came after the period of study here.
15Racine is a city of about 75,000 located in Racine county, which is the county just south of Milwaukee county.
10
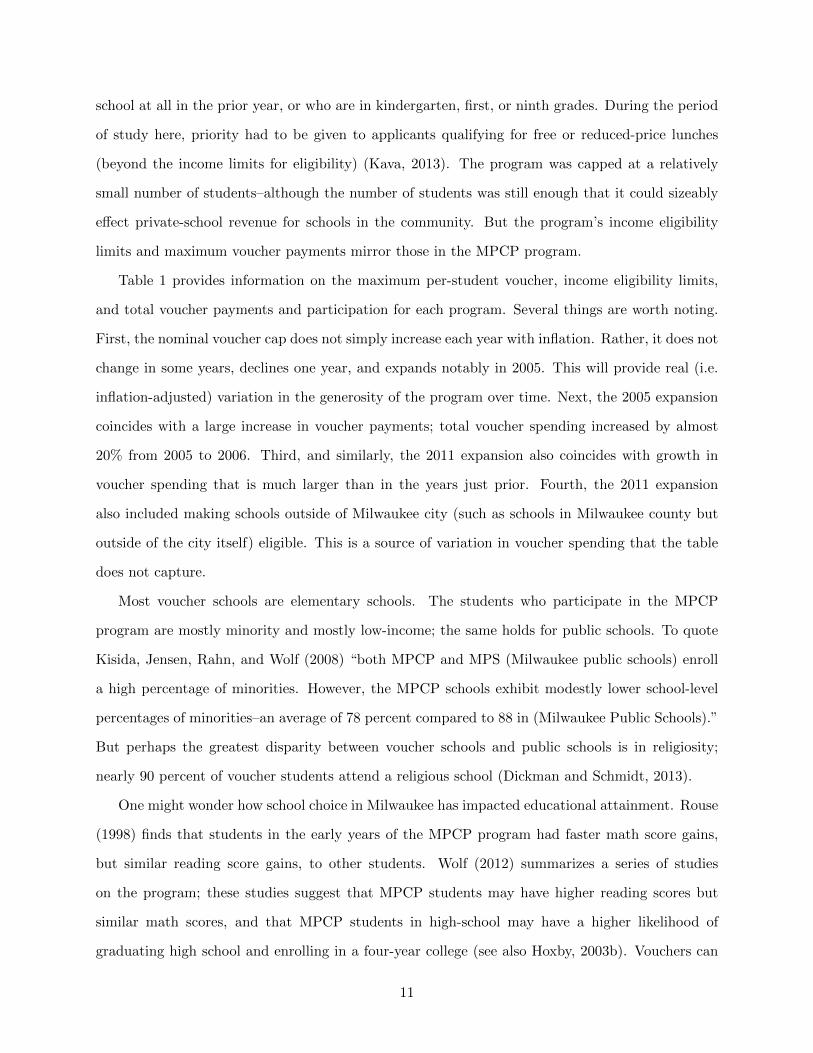
school at all in the prior year, or who are in kindergarten, first, or ninth grades. During the period
of study here, priority had to be given to applicants qualifying for free or reduced-price lunches
(beyond the income limits for eligibility) (Kava, 2013). The program was capped at a relatively
small number of students–although the number of students was still enough that it could sizeably
effect private-school revenue for schools in the community. But the program’s income eligibility
limits and maximum voucher payments mirror those in the MPCP program.
Table 1 provides information on the maximum per-student voucher, income eligibility limits,
and total voucher payments and participation for each program. Several things are worth noting.
First, the nominal voucher cap does not simply increase each year with inflation. Rather, it does not
change in some years, declines one year, and expands notably in 2005. This will provide real (i.e.
inflation-adjusted) variation in the generosity of the program over time. Next, the 2005 expansion
coincides with a large increase in voucher payments; total voucher spending increased by almost
20% from 2005 to 2006. Third, and similarly, the 2011 expansion also coincides with growth in
voucher spending that is much larger than in the years just prior. Fourth, the 2011 expansion
also included making schools outside of Milwaukee city (such as schools in Milwaukee county but
outside of the city itself) eligible. This is a source of variation in voucher spending that the table
does not capture.
Most voucher schools are elementary schools. The students who participate in the MPCP
program are mostly minority and mostly low-income; the same holds for public schools. To quote
Kisida, Jensen, Rahn, and Wolf (2008) “both MPCP and MPS (Milwaukee public schools) enroll
a high percentage of minorities. However, the MPCP schools exhibit modestly lower school-level
percentages of minorities–an average of 78 percent compared to 88 in (Milwaukee Public Schools).”
But perhaps the greatest disparity between voucher schools and public schools is in religiosity;
nearly 90 percent of voucher students attend a religious school (Dickman and Schmidt, 2013).
One might wonder how school choice in Milwaukee has impacted educational attainment. Rouse
(1998) finds that students in the early years of the MPCP program had faster math score gains,
but similar reading score gains, to other students. Wolf (2012) summarizes a series of studies
on the program; these studies suggest that MPCP students may have higher reading scores but
similar math scores, and that MPCP students in high-school may have a higher likelihood of
graduating high school and enrolling in a four-year college (see also Hoxby, 2003b). Vouchers can
11

change not only student outcomes, but institutional characteristics as well. Rinz (2016) shows
that large voucher programs can lead to better educational environments in private schools, but
that–especially for nonwhite students–choice programs can encourage entry from new schools with
worse-than average educational characteristics.
Aside from educational effects, one might wonder whether voucher programs will necessarily
increase school revenue. In theory, a voucher-like subsidy could leave enrollment and tuition un-
changed, so that the voucher payment effectively goes to the families. Even in this case vouchers
could alter the character and financial outcomes of affiliated churches. However, Hungerman and
Rinz (2016) consider this question for several statewide choice programs and find that voucher-style
programs increase school revenue. But their data essentially excludes Catholic schools and contains
no information on church finances. Given the size of per-student and total voucher payments in
Table 1, it is clear that voucher programs in this setting could significantly impact private-school,
and church, finances. We investigate this using parish data that we describe next.
3 Data and Specifications
3.1 Parish Data
Data on Catholic parish finances are difficult to come by. Catholic schools have been the
subject of extensive study in economics, with much work focusing on the strikingly better academic
outcomes experienced by Catholic school students compared to other students (Evans and Schwab,
1995; Altonji, Elder, and Taber, 2005). Other work has focused on the role of Catholic and other
private schools in affecting racial and economic diversity (see section 5 of Black, and Sokoloff, 2006).
We know of no rigorous study in economics (nor in other disciplines) using parish financial data.
While many aspects of the Catholic Church are hierarchical, the particulars of church finances
vary across dioceses and there is no part of the church that collects parish-level financial data at
the national level. Furthermore, Catholic churches are under no obligation to report their financial
information to the government. The same is true for Catholic schools. Many private schools must
fill out so-called 990 forms for the IRS each year, but Catholic schools generally do not have to file
this form and almost never voluntarily do so. Several surveys (discussed a bit more below) include
some basic information on a relatively small cross section of parishes, but we know of no available
12

survey providing the detailed information needed for our study here.
Our data on parish finances were provided with the help of the Catholic Archdiocese of Mil-
waukee. Parishes in Milwaukee have their own budgeting systems but follow common guidelines
set out by the archdiocese; they are asked to share their data with the archdiocese annually. The
archdiocese collates this data but does not disseminate it. In fact, each parish’s data is proprietary
to the parish itself, and cannot be shared by the archdiocese without parish permission. We first ap-
proached the archdioceses seeking permission to access parish data. Upon learning that permission
would be needed from each individual parish, we sought permission from parishes for use of their
data. We initially identified thirteen parishes with schools that were likely to have been affected
by expansions of voucher programs in 2006 and 2011. All 13 of these parishes reported that they
would be willing to participate in our study. We then asked all parishes in the archdiocese if they
would be willing to share their data. Overall, 71 (out of about 200) agreed to share data. Given
the historical reticence of Catholic organizations in sharing financial data, we view this response
rate as remarkably good. We discuss more below issues of generalizability from our sample.
Several parishes we use were formed through the merger of smaller parishes during the period
covered by our data. We treat each merged parish as a single entity in our main analysis, using the
post-merger address (which is typically the address of one of the component parishes) to determine
location. But we also consider mergers as an outcome variable.
For each parish, the archdiocese provided annual information on operating revenue, operating
expenses, and revenue from weekly collections at masses.16 For parishes that operate schools, it also
provided the amount of revenue derived from operation of the school, as well as expenditures on
the school. We calculate non-school revenue and expenses as the difference between operating and
school revenue/expenses. The archdiocese provided this information for each fiscal year beginning
in 1999-2000 and ending in 2012-13.17 Where valid observations are available before and after,
we replaced missing values and a limited number of outliers with linearly interpolated values; our
results are largely not sensitive to these adjustments as we show below.
Table 2 summarizes the financial characteristics of parishes in our sample. Dollar amounts are
16Revenue from weekly collections includes both planned contributions made regularly through a formal system ofdesignated envelopes (including any dues a parish may charge) and money contributed more spontaneously in theform of loose cash.
17The archdiocese’s fiscal year runs from July 1 through June 30, so the data provided line up well with theacademic year.
13

in 1000s, so that the average parish in the sample (column 1) has about $1 million in non-school
revenue and expenditures. Most of this revenue is offertory revenue (e.g., pledges and donations
collected during worship).
Regarding the generalizability of our sample, we can compare the average donation amount here
to average donations for Catholic parishes in the National Congregations Study.18 Using the 2006
and 2012 waves of that study (the two waves that overlap our period of data), the NCS reports
that the average Catholic congregation had $751,945 (in year 2014 dollars), an amount slightly
smaller but reasonably close to average offertory revenue in column 1 of Table 2. We can also
calculate average Catholic donations excluding rural churches from the NCS sample; this produces
average donations of $932,670, which is even closer to our own sample mean. Looking next at
school revenue, we can generate a rough estimate of typical Catholic school revenue in the U.S.
using average maximum tuition for Catholic schools in the Schools-and-Staffing survey ($4,200
in 2007/08 as mentioned earlier), times the average size of Catholic elementary schools, which
according to the 2007-08 Private Schools Survey was 240. This calculation uses maximum tuition
rather than average tuition, which could produce a number too high, but it does not take into
account other sources of revenue, which would make the number too low. This calculation suggests
revenue of 4200×240 = $1, 008, 000, which is close to the average school revenue amount in column
2. Finally, McDonald and Schultz (2014) report in their exhibit 24 that average cost-per-student
at Catholic parish elementary schools is $5,847, suggesting total costs of 5847× 240 = $1, 403, 280,
which is very close to average school expenditures in column 2 of the table. We take it as noteworthy
that for several variables the average parish in our sample resembles the average Catholic parish as
reported by other sources.
Looking further at columns 2 and 3 in Table 2, parishes that operate schools are substantially
larger than those that do not, as one might expect. Operating revenues and expenses at parishes
with schools (column 2) approach three times those at parishes without (column 3). Once school
revenues and expenses are removed, however, these two groups are more similar. Though parishes
with schools have non-school revenue nearly 57% greater than parishes without schools, expenditure
data suggests the scope of their non-school operations is similar, as parishes with schools spend an
18The relevant question in the NCS survey is, “how much [church income] came from individuals’ donations, dues,or contributions?”
14

average of only 3% more on those activities than those without.
Column 4 considers parishes with voucher-accepting schools. The results here underscore a main
point of this paper, which is simply that vouchers have the potential to become an enormously
important–even dominant–source of revenue for churches. Remarkably, these parishes actually
receive more of their revenue from government-sponsored vouchers than from offertory revenue
contributed by their worshipers.
Comparing the last two columns, the differences between parishes that ever receive vouchers
(column 4) and those that do not (column 5) are suggestive of how vouchers may influence parish
finances. Revenue and expenditures are higher at voucher schools than at non-voucher schools, and
while on average both types of schools lose money for their parishes (expenditures exceed revenue),
voucher schools lose less money despite being larger. Despite the difference in the “profitability”
of their schools, voucher and non-voucher parishes are in similar, slightly positive positions when
overall operating revenues are compared to operative expenditures, with non-voucher schools mak-
ing up for the lack of voucher money with higher non-school revenue. In particular, this non-school
revenue comes primarily from higher levels of offertory revenue. These differences suggest that
voucher participation may influence who covers schools’ operating losses, taxpayers or parishioners.
Before exploring this possibility more rigorously, however, we next describe other controls we will
use in combination with our parish data.
3.2 Community Characteristics & Empirical Methodology
Our parish information includes the address of each parish in our sample. Using this, we
can combine parish financial data with characteristics of their neighborhoods. We take these
characteristics from the 2000 Census and the American Community Survey from 2009-2013. Using
the addresses of each parish and the centroids of census tracts in Wisconsin, we match each parish to
all tracts with centroids that are within two miles of the parish. For parishes operating schools that
have different addresses than the parish, we use the address of the school. In the few cases where
a parish operates a school with multiple locations, we use the address of the location that is listed
first alphabetically. We calculate shares of the population in various age bins by race, education,
marital status, nativity, and language groups, the unemployment rate, and family income from
these collections of census tracts. For 2001 through 2008, we linearly interpolate between the
15

values we calculated for 2000 and 2009. We match each fiscal year to the calendar year in which it
began.
Average demographic and economic characteristics of the areas around the parishes in our
sample are presented in Table A1. We report all dollar amounts in thousands of 2014 dollars,
adjusted for inflation using the Consumer Price Index for all urban consumers (CPI-U). As the
table shows, parish schools receiving vouchers are located in areas that, on average, have larger
non-white populations, higher unemployment rates, lower income, less education, lower marriage
rates, and larger shares of the population who were born abroad and who speak a language other
than English at home.
In the results below, we will control for these community characteristics that could impact
both voucher spending and parish outcomes. But we can also combine information on a parish’s
community with the variation in program characteristics from Table 1 to address the concern that
schools voluntarily decide to accept voucher payments.19 Even within similar communities, parishes
that accept vouchers might differ in important ways from other parishes. For example, a parish
with a highly-motivated pastor dedicated to increasing the parish’s presence in the community
might both accept vouchers and also take actions that led to greater religious vitality in the parish.
In this case, parishes with vouchers might have different religious outcomes, but it would be the
pastor’s motivation, rather than the voucher itself, driving these differences.
To overcome this issue, our results will not use realized voucher spending as the key regressor.
Instead, we will exploit the policy variation in Table 1, as well as the aforementioned expansion of
the MPCP program to the entire county of Milwaukee during our sample, to construct a measure
of potential voucher revenue for each parish. We count the number of families with at least one
child at various levels of income living in tracts within two miles of each parish. Based on the
level of income and the child’s location, we can calculate the potential voucher revenue for each
parish each year. Thus, as a simple example, if we estimated that there were 5,000 families with
at least one potentially eligible child living near a parish, and the maximum voucher were $1,000,
potential voucher revenue for that parish would be 5, 000 × 1000 = $5, 000, 000. This estimate of
19One might wonder whether schools also voluntarily stop participation in the voucher program. Some schools do.Kisida, Jensen, and Wolf (2010) show that schools which exit the MPCP program are typically smaller and less likelyto be religious than other voucher schools. Our empirical strategy will allow us to address both voluntary entry andexit from voucher participation.
16

money a parish school could receive depends on variation in (a) geographic eligibility for vouchers
(b) income eligibility thresholds, and (c) the maximum voucher value, which all change over time.
Another source of variation that could affect our potential voucher spending variable is the
demographics of a neighborhood itself. Very rich neighborhoods will not have many families eligible
for vouchers in any year, and their parishes may have different outcomes than other parishes.
However, first, our results can include fixed effects that should account for fixed differences in
neighborhood characteristics over time. Second, in our calculations of potential voucher spending,
we can hold neighborhood characteristics fixed. That is, we will estimate potential voucher spending
using ex-ante Census 2000 data for every year in the sample. This ensures that the only source of
variation over time in our constructed potential voucher spending measure is policy driven. The
use of Census 2000 data also allows for reasonably high levels of precision in estimating community
characteristics. Additionally, we also report results below with different controls for time trends
or lead changes in potential voucher spending. Our main results are similar across these different
tests and our main conclusion–that vouchers fail to subsidize non-school religious activity–is clearly
supported by all of our results.
We also verify below that variation in potential voucher spending is closely related to variation
in actual voucher spending. We calculated actual school-level voucher payments each year using
(a) publicly-reported school-by-year data on voucher-eligible students (that is, counts of Full-Time-
Equivalent, or FTE, enrollment in each school) and (b) the final cost per pupil reported by each
school each year (provided by the Wisconsin Department of Public Instruction, or DPI). We con-
firmed with DPI officials that multiplying the amount in (a) by the lesser of the maximum voucher
value or (b) would allow us to calculate the voucher payment received by each school.
3.3 Baseline Specification
Our baseline specification will take the form
yit = δvoucherit + βXit + θi + φt + εit
were yit is an outcome variable for parish i in year t, such as actual voucher revenue, school
expenditures or revenue, non-school expenditures or revenue, or offertory revenue. The variable
voucherit is potential voucher spending for parish i in year t, Xit is a set of controls for community
17
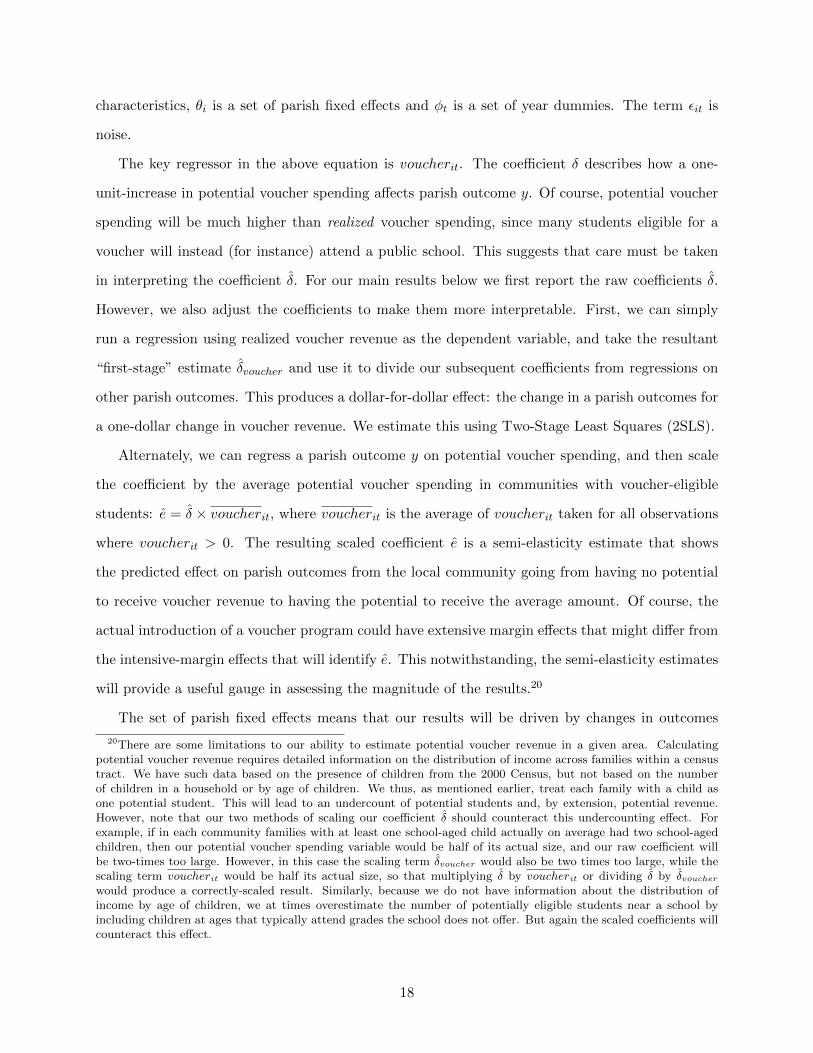
characteristics, θi is a set of parish fixed effects and φt is a set of year dummies. The term εit is
noise.
The key regressor in the above equation is voucherit. The coefficient δ describes how a one-
unit-increase in potential voucher spending affects parish outcome y. Of course, potential voucher
spending will be much higher than realized voucher spending, since many students eligible for a
voucher will instead (for instance) attend a public school. This suggests that care must be taken
in interpreting the coefficient δ. For our main results below we first report the raw coefficients δ.
However, we also adjust the coefficients to make them more interpretable. First, we can simply
run a regression using realized voucher revenue as the dependent variable, and take the resultant
“first-stage” estimate δvoucher and use it to divide our subsequent coefficients from regressions on
other parish outcomes. This produces a dollar-for-dollar effect: the change in a parish outcomes for
a one-dollar change in voucher revenue. We estimate this using Two-Stage Least Squares (2SLS).
Alternately, we can regress a parish outcome y on potential voucher spending, and then scale
the coefficient by the average potential voucher spending in communities with voucher-eligible
students: e = δ × voucherit, where voucherit is the average of voucherit taken for all observations
where voucherit > 0. The resulting scaled coefficient e is a semi-elasticity estimate that shows
the predicted effect on parish outcomes from the local community going from having no potential
to receive voucher revenue to having the potential to receive the average amount. Of course, the
actual introduction of a voucher program could have extensive margin effects that might differ from
the intensive-margin effects that will identify e. This notwithstanding, the semi-elasticity estimates
will provide a useful gauge in assessing the magnitude of the results.20
The set of parish fixed effects means that our results will be driven by changes in outcomes
20There are some limitations to our ability to estimate potential voucher revenue in a given area. Calculatingpotential voucher revenue requires detailed information on the distribution of income across families within a censustract. We have such data based on the presence of children from the 2000 Census, but not based on the numberof children in a household or by age of children. We thus, as mentioned earlier, treat each family with a child asone potential student. This will lead to an undercount of potential students and, by extension, potential revenue.However, note that our two methods of scaling our coefficient δ should counteract this undercounting effect. Forexample, if in each community families with at least one school-aged child actually on average had two school-agedchildren, then our potential voucher spending variable would be half of its actual size, and our raw coefficient willbe two-times too large. However, in this case the scaling term δvoucher would also be two times too large, while thescaling term voucherit would be half its actual size, so that multiplying δ by voucherit or dividing δ by δvoucherwould produce a correctly-scaled result. Similarly, because we do not have information about the distribution ofincome by age of children, we at times overestimate the number of potentially eligible students near a school byincluding children at ages that typically attend grades the school does not offer. But again the scaled coefficients willcounteract this effect.
18
realized within parishes over time. This set of fixed effects would subsume a fixed effect for the
community where parish i is located. The year fixed effects allow for us to control flexibly for
variation in parish outcomes over time as well.
4 Results
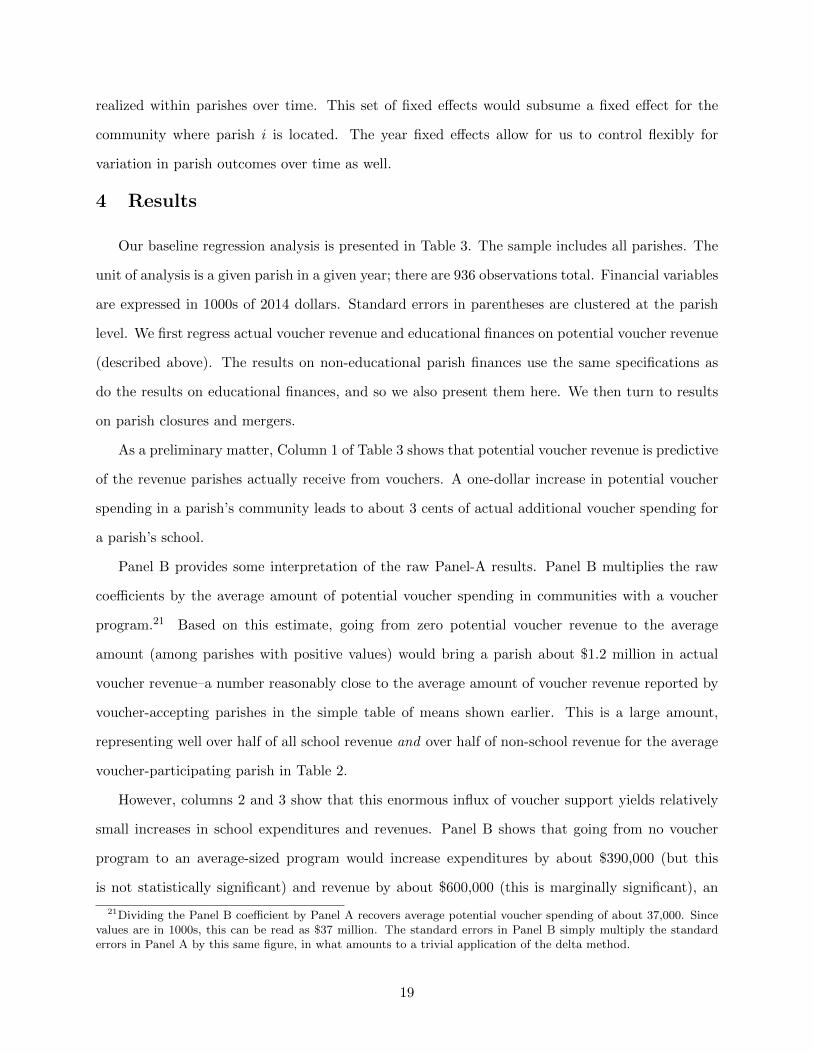
Our baseline regression analysis is presented in Table 3. The sample includes all parishes. The
unit of analysis is a given parish in a given year; there are 936 observations total. Financial variables
are expressed in 1000s of 2014 dollars. Standard errors in parentheses are clustered at the parish
level. We first regress actual voucher revenue and educational finances on potential voucher revenue
(described above). The results on non-educational parish finances use the same specifications as
do the results on educational finances, and so we also present them here. We then turn to results
on parish closures and mergers.
As a preliminary matter, Column 1 of Table 3 shows that potential voucher revenue is predictive
of the revenue parishes actually receive from vouchers. A one-dollar increase in potential voucher
spending in a parish’s community leads to about 3 cents of actual additional voucher spending for
a parish’s school.
Panel B provides some interpretation of the raw Panel-A results. Panel B multiplies the raw
coefficients by the average amount of potential voucher spending in communities with a voucher
program.21 Based on this estimate, going from zero potential voucher revenue to the average
amount (among parishes with positive values) would bring a parish about $1.2 million in actual
voucher revenue–a number reasonably close to the average amount of voucher revenue reported by
voucher-accepting parishes in the simple table of means shown earlier. This is a large amount,
representing well over half of all school revenue and over half of non-school revenue for the average
voucher-participating parish in Table 2.
However, columns 2 and 3 show that this enormous influx of voucher support yields relatively
small increases in school expenditures and revenues. Panel B shows that going from no voucher
program to an average-sized program would increase expenditures by about $390,000 (but this
is not statistically significant) and revenue by about $600,000 (this is marginally significant), an
21Dividing the Panel B coefficient by Panel A recovers average potential voucher spending of about 37,000. Sincevalues are in 1000s, this can be read as $37 million. The standard errors in Panel B simply multiply the standarderrors in Panel A by this same figure, in what amounts to a trivial application of the delta method.
19

effect half the size of the voucher revenue coefficient. In Panel C, we present 2SLS estimates; these
essentially divide the raw reduced-form coefficients in Panel A by the coefficient in column 1 of
Panel A to generate a dollar-for-dollar effect. A dollar of voucher revenue at a school increases
expenditures by 33 cents and revenue by 50 cents. The only study we know of to produce a
comparable revenue number would be Hungerman and Rinz (2016), which estimates that–in a world
where the incidence of a subsidy falls on families–the dollar-for-dollar revenue effect of a voucher is
85 cents.22 Certainly the precision in Table 3 cannot rule out an effect of that magnitude. Further,
it is not clear whether the results from the two studies should be comparable, as the sample in
that paper essentially excludes Catholic schools while the sample here is entirely Catholic schools,
and the two studies focus on different policies. But even if the effect here is slightly smaller than
that suggested in prior work, the coefficients here still suggest that the average voucher program
generates about $200,000 in excess revenue for parish schools, a reasonably large amount.
Does this amount correspond with greater religious vitality in a parish? Column 4 considers
how voucher expansion affects non-school expenditures such as pastor salaries, mission expendi-
tures, and church upkeep. Strikingly, the coefficients are negative and significant, so that these
activities actually decline when vouchers expand. The average voucher program diminishes non-
school expenditures by $177,000, or by 15 cents on the dollar. Non-school revenue falls by even
more, declining by almost $313,000 or 26 cents per dollar of voucher revenue. Another way of inter-
preting this effect would be to consider the aggregate decline in revenue caused by voucher programs
since the beginning of our sample. Table 2 shows in column 4 that total voucher revenue (in 1000s)
in our sample is 898.5 × 257 = $230, 914.5. The dollar-for-dollar estimates here suggest this $230
million in voucher revenue has caused a within-sample decline of $230, 914.5 × 0.26 ' $60 million
dollars in non-school revenue. Columns 6 and 7 show the effect on overall operating revenue and
expenditures which are statistically insignificant and much smaller than the voucher-revenue effect
in column 1; but this masks the decline in non-school activity shown in the prior pair of columns.
Rather than undergirding religious activity, it appears that an increase in revenue from vouchers
crowds out revenue from other sources. Column 8 shows that the decline in non-school revenue is
driven by a fall in offertory revenue; the typical voucher program leads to about a $200,000 decline
22That study cannot reject zero-incidence for schools when voucher programs restrict eligibility based on income.That is the case in Milwaukee, so that their zero-incidence estimate is a natural starting place for comparison.
20
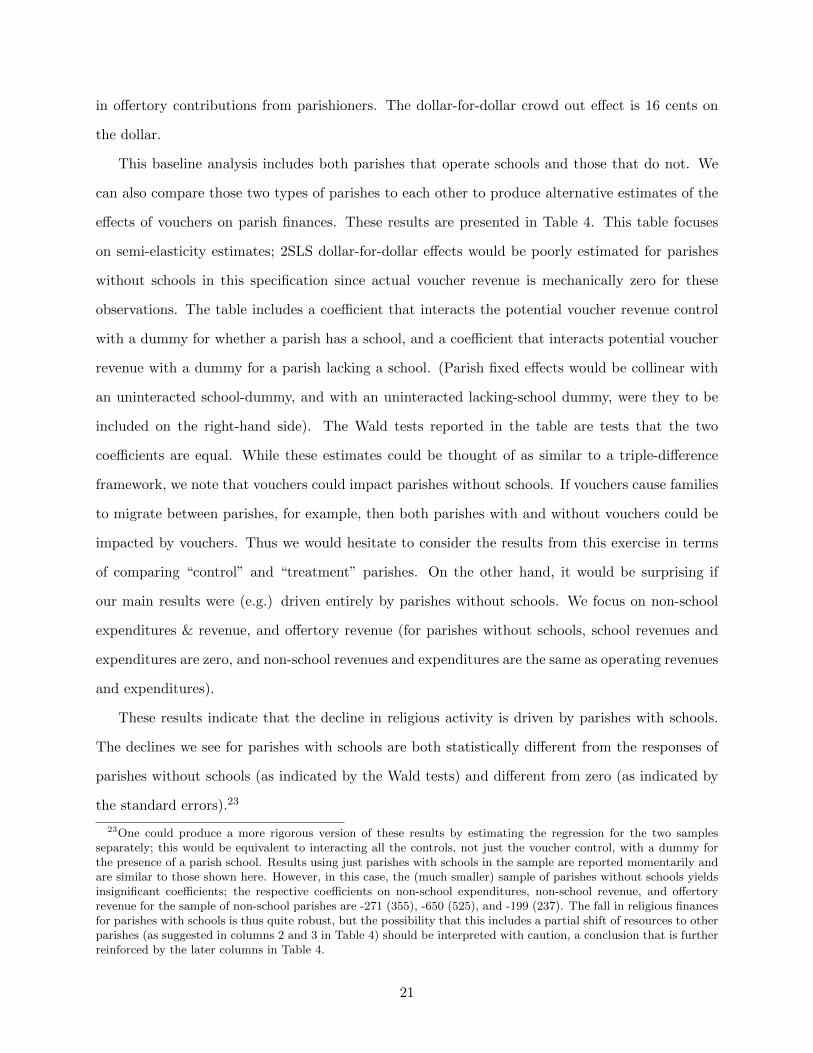
in offertory contributions from parishioners. The dollar-for-dollar crowd out effect is 16 cents on
the dollar.
This baseline analysis includes both parishes that operate schools and those that do not. We
can also compare those two types of parishes to each other to produce alternative estimates of the
effects of vouchers on parish finances. These results are presented in Table 4. This table focuses
on semi-elasticity estimates; 2SLS dollar-for-dollar effects would be poorly estimated for parishes
without schools in this specification since actual voucher revenue is mechanically zero for these
observations. The table includes a coefficient that interacts the potential voucher revenue control
with a dummy for whether a parish has a school, and a coefficient that interacts potential voucher
revenue with a dummy for a parish lacking a school. (Parish fixed effects would be collinear with
an uninteracted school-dummy, and with an uninteracted lacking-school dummy, were they to be
included on the right-hand side). The Wald tests reported in the table are tests that the two
coefficients are equal. While these estimates could be thought of as similar to a triple-difference
framework, we note that vouchers could impact parishes without schools. If vouchers cause families
to migrate between parishes, for example, then both parishes with and without vouchers could be
impacted by vouchers. Thus we would hesitate to consider the results from this exercise in terms
of comparing “control” and “treatment” parishes. On the other hand, it would be surprising if
our main results were (e.g.) driven entirely by parishes without schools. We focus on non-school
expenditures & revenue, and offertory revenue (for parishes without schools, school revenues and
expenditures are zero, and non-school revenues and expenditures are the same as operating revenues
and expenditures).
These results indicate that the decline in religious activity is driven by parishes with schools.
The declines we see for parishes with schools are both statistically different from the responses of
parishes without schools (as indicated by the Wald tests) and different from zero (as indicated by
the standard errors).23
23One could produce a more rigorous version of these results by estimating the regression for the two samplesseparately; this would be equivalent to interacting all the controls, not just the voucher control, with a dummy forthe presence of a parish school. Results using just parishes with schools in the sample are reported momentarily andare similar to those shown here. However, in this case, the (much smaller) sample of parishes without schools yieldsinsignificant coefficients; the respective coefficients on non-school expenditures, non-school revenue, and offertoryrevenue for the sample of non-school parishes are -271 (355), -650 (525), and -199 (237). The fall in religious financesfor parishes with schools is thus quite robust, but the possibility that this includes a partial shift of resources to otherparishes (as suggested in columns 2 and 3 in Table 4) should be interpreted with caution, a conclusion that is furtherreinforced by the later columns in Table 4.
21
The last three columns of Table 4 show results from including two “lead” potential voucher
controls, one interacted with a parish-school dummy and one interacted with a no-school dummy.
Each lead voucher control uses law changes two years in the future to calculate potential voucher
revenue. This serves as both a potential means to investigate trends in the data and an attempt to
determine whether parishes’ financial outcomes are changing contemporaneously with the preva-
lence of vouchers nearby. Column 4 shows that contemporary voucher eligibility drives the effect
on non-school expenditures, although the result is less precise than before (and larger in absolute
value). Column 5 shows that the main coefficients on non-school revenue are similar to before
and also larger in absolute value. For parishes without schools the main effect is smaller and in-
significant in both columns. Similarly, in column 6 the decline in offertory revenue is driven by
contemporaneous responses in parishes with schools. Turning to the lead-potential-voucher coef-
ficients in the last 3 columns, all are positive in sign, and two (for the non-school parishes) are
significant at conventional levels. None of these coefficients suggest that our estimates are driven
by trends in the data–indeed the coefficients are of the opposite sign of the main effects in Table
3. Positive signs could fit a scenario where families anticipate voucher expansion and respond by
moving to other nearby parishes (as our data is based on a fiscal year, rather than a calendar year),
but the lack of significance for most of these coefficients makes this possibility suggestive at best.24
Altogether, the main takeaway from the estimates across all specifications in Table 4 is that our
main effects are driven by parishes with schools, and that these effects appear at the time of policy
expansion, not before.
Tables 5 and 6 provide additional tests for the robustness of the semi-elasticity and IV results to
trends and other aspects of the estimation. Given the results in Table 4, here we focus on parishes
with schools, but results using all parishes are similar. As with the main results, estimates on
operating expenditures and revenues are not significant for these tests and are omitted for brevity.
Table 5 reports semi-elasticity results. The first column reports the estimates for parishes with
schools using the baseline specification. We then consider several alternative specifications: one
24One could also generate 2SLS results similar to the last 3 columns in this table by adding a lead voucher coefficientto the baseline 2SLS estimates in Table 3. Doing so continues to produce coefficients suggesting declines from voucherspending and insignificant lead effects, but for these estimates the standard errors are sometimes larger. For non-school expenditures, the contemporaneous voucher coefficient is -0.301 (se = 0.175) and the lead is 0.226 (0.195); fornon-school revenue the respective coefficients are -0.118 (0.193) and -0.057 (-.238) and for offertory revenue -0.0138(0.107) and -0.0772 (0.131). We discuss 2SLS results on the sample of parishes with schools more below.
22

that logs the dependent variable (column 2); specifications that include parish- or ZIP code-specific
linear trends (3) and (4)25 and specifications in which outcome variables have not had missing
values and outliers imputed (column 5).26
The first row of Table 5 shows that the relationship between potential voucher spending and
actual voucher spending is quite robust. The result is smaller when trends are included but clearly,
and unsurprisingly, potential voucher revenue does a good job of predicting actual voucher rev-
enue–that is, expansions in voucher policy robustly predict increases in actual voucher spending.
The second row confirms our main result that non-religious expenditures fall as vouchers expand.
This result holds regardless of the use of trends, and in fact given the estimates in row 1, the
dollar-for-dollar impacts are somewhat larger when trends are included (we return to dollar-for-
dollar estimates momentarily). The non-school revenue results similarly show declines as vouchers
expand. The coefficient becomes smaller when parish-specific trends are included although again
the suggested dollar-for-dollar result would be similar; results with ZIP code trends return semi-
elasticity estimates comparable to the baseline (and larger dollar-for-dollar effects than in baseline).
As before, these results are mirrored by a decline in offertory revenue. Using the raw data, rather
than imputing missing values or adjusting for outliers as described above, does not meaningfully
affect the results.
Table 6 reports 2SLS results along with first-stage estimates in row 1. Overall the results are
quite similar to those in Table 5.27 As anticipated in the earlier results, the estimates on non-school
expenditures get notably larger with trend controls, suggesting a 40 cents-on-the dollar effect. But
the result consistently suggests a decline in non-school revenue when vouchers expand. The effects
on non-school revenue and offertory revenue are also robust, and indeed quite consistently estimated,
with all estimates on non-school revenue between 15 and 40 cents on the dollar and all offertory
effects between 10 and 15 cents on the dollar.
Overall, the results repeatedly refute the possibility that vouchers subsidize or otherwise pro-
mote greater religious activity or vitality within recipient parishes. Indeed, the results suggest the
25We also checked specifications that include quadratic trends. Estimates were similar to those based on lineartrends, and we do not report them here.
26Note that columns (1) and (5) of row 1 show the same point estimates and standard errors when the dependentvariable is taken from the raw data. This is because there are no missing or outlier values to replace via imputation.
27We multiply the log-outcome coefficients by 100 for readability, corresponding to the proportionate effect of a$100,000 increase. This is about 1/9th of average voucher revenue (as suggested in Table 2); scaling these coefficientsby a factor of 9 accordingly generates second-stage results close to the log results in Table 5.
23

opposite. In particular, looking at expenditures on non-school religious activities, we repeatedly
find robust evidence that vouchers decrease parish religious activity.
The results so far have focused on changes within parish communities. We next consider how
the existence of parishes themselves could be impacted by vouchers. This impact is a priori unclear;
the results so far on parish finances would be compatible with several possible stories on parish
survival. On the one hand, if overall revenues and expenditures do not change when vouchers
expand, then vouchers could have no effect on parish survival. Alternately, if a fall in offertory
revenue signals a decline in the religious vitality of a parish, then vouchers could promote church
closures. Finally, if vouchers, for example, offer a relatively certain source of income for a struggling
parish, than vouchers may promote parish survival even if the short run effects on overall revenue
are negligible.
In the Archdiocese of Milwaukee, upon the closure of any parish, members of this parish will
merge with those in another parish–that is, closures are always achieved by mergers.28 In consulting
with the archdiocese office and with various years of the Official Catholic Directory, we can identify
which parishes merged in which years. Thus, while our data was retrospectively assembled, we can
nonetheless construct a complete list of all extant and previously-closed parishes within our sample
in any given year.
There were 12 mergers, involving 35 parishes, that occurred in our sample during the period
studied. Four mergers (14 parishes) occurred in 2000, 1 merger (2 parishes) in 2001, 2 mergers (6
parishes) in 2003, 2 (4 parishes) in 2005, 1 (2 parishes) in 2006, 1 (4 parishes) in 2007, and 1 (3
parishes) in 2011.
Combining this merger information with our information on voucher expansion, we can inves-
tigate how the two are related. Table 7 reports estimates of a Cox proportional-hazard model
with time-varying covariates.29 In the first two columns the outcome variable is whether a parish
closes in a given year, and the hazard model estimates the likelihood of this event (conditional
28One might wonder whether mergers ever occur voluntarily between two parishes. It is possible, and indeed oneof the mergers in our sample, between St. Francis Borgia and Divine Word in Cedarburg, was instigated at therequest of the parishes. However, during the period of study here most parish merger decisions were made by thearchdiocese to confront excessive financial hardship (although more recently mergers are voluntary); and even thecase of voluntary merger mentioned here was instigated in the face of limited personnel in Cedarburg. Given this,we do not attempt to subjectively differentiate between mergers in our study.
29Hazard estimation can be affected by the handling of “ties” (i.e. simultaneous closures) in the data. Here, forsimplicity, the results do not take ties into account in the estimation, but doing so produces similar estimates.
24

on survival to the current year and conditional on observables). The estimates are negative and
significant, suggesting that expansions in voucher eligibility lower the likelihood of a parish clo-
sure. The coefficients are quite large, essentially suggesting that, upon adoption of an average-sized
voucher program, the probability of closure falls by 100 percent. This can be seen by noting that
the proportional hazard model is of the form logλ(t; x) = xβ + logλ0(t), where λ(t;x) is the haz-
ard function representing the probability of closure at period t given survival to period t. Since
the average potential (as opposed to actual) voucher spending is about $37 million, and recalling
that the monetary amounts are in thousands, the predicted effect on the hazard of going from no
voucher program to an average-sized voucher program would be 100× (e(37,000×−0.006)− 1)≈− 100.
The result is similar whether or not covariates are included in the estimation. The large effect is
not surprising; a casual investigation of the above list of closures shows that mergers were fairly
common before voucher expansion and much less common after expansion.
If two parishes are struggling financially, the archdiocese could decide to combine them and the
decision for which parish to close might be arbitrary. In that case, it would be important not to
focus on parish closures alone as a key outcome, but rather to consider any involvement in a merger
as an outcome. The last two columns of Table 7 present results where the hazard now estimates the
probability of involvement in a merger, rather than just closure. The estimates are quite similar to
before, suggesting that voucher expansion generates a significant and economically large decrease
in the likelihood of any involvement in a merger.
Thus, Table 7 indicates that voucher expansion greatly lowered the probability of closure or
merger for parishes. How does this finding reconcile with the earlier estimates? First, as noted
above, for our earlier estimates we treated any merged parishes as a single entity in all years by
combining all pre-merger data. This was done to avoid concerns about selection on the dependent
variable since mergers were obviously a potentially endogenous occurrence in the data.
Second, parish mergers can be painful events for adherents, and they may directly affect parish
revenues by lowering attendance or contributions. If voucher expansion prevents mergers, this
could be a channel by which voucher expansion promotes greater religious activity. However, since
our prior estimates combine data for merging parishes in all years, this means our prior estimates
are net of any ameliorative effects of vouchers on parish survival. The estimated decrease in non-
school expenditures, revenues, and offertory funds documented above subsumes any anti-closure
25

positive-effect of vouchers on church finances. However, there may be harder-to-quantify benefits
of vouchers on keeping parishes in a neighborhood open. We turn to the complexity of measuring
the long-term effects of vouchers on all aspects of religious vitality in the conclusions.
5 Conclusions
This paper considers the impacts of vouchers on the finances of American churches, and by
extension the potential of vouchers to alter American religious and social life. We find that vouchers
often make up a very large fraction of church finances when a church operates a voucher-accepting
school. Indeed, we view that result, based on the simple means in Table 2, as a key result of
this study and one suggesting a potentially critical role for vouchers in determining the future of
American religion. We then show that Catholic parishes operating schools in our sample see a shift
away from non-school religious expenditures, and a decline in religious revenue, when vouchers
expand. At the same time, voucher expansion appears to halt parish closures. Vouchers thus may
help ensure the survival of churches, but may do so while diminishing churches’ non-school religious
activities.
This paper highlights the important role of education policy in affecting community outcomes.
Scholars have recognized that education policy can have important civic effects beyond the class-
room (Milligan, Moretti, Oreopoulos, 2004), and work on school choice has considered the effects
of choice policy on non-educational outcomes, such as community characteristics (Nechyba, 2000).
But the sizable potential impact of vouchers on American religion that we document here is, to our
knowledge, an effect not rigorously considered before.
We do not conclude from our study that school choice is good or bad, nor even whether it is
good or bad insofar as it impinges on religious behavior. On the one hand, religious activity has
repeatedly been shown to produce beneficial outcomes in terms of (for instance) civic participation,
so that the crowd out effects found here could lead to worse outcomes in communities if religiosity
falls. However, Catholic parishes and schools themselves have been argued to be important sources
of social capital in communities (e.g., Brinig and Garnett, 2012), so that the findings on parish
survival, combined with the crowd out effects, could lead to either positive or negative effects
overall. Further, even evidence of an increase in religious activities following voucher expansion
might concern those who worry that this expansion nonetheless would alter the character or focus
26

of religious groups in the long run, potentially in hard-to-measure ways. Alternately, the negative
effects we identify here could be compensated in the long-run if some voucher students return to
the Catholic church as adults (Banchero and Levitz, 2012), or if the long-term survival of parishes
proved beneficial in ways that our short-term results on finances miss. Our data cover over a
decade, but it is still the case that the long-term effects of vouchers on religious vitality could be
more positive than what we find here.
References
[1] AFC Growth Fund. 2016. School Choice Fact Sheet. Accessed from http://afcgrowth-fund.org/school-choice-facts/school-choice-fact-sheet/ on 6/24/2016.
[2] Altonji, Joseph, Todd Elder, and Christopher R. Taber. 2005. “Selection On Observed AndUnobserved Variables: Assessing The Effectiveness Of Catholic Schools” Journal of PoliticalEconomy 113: 151-184.
[3] Avella, Steven M. 2002. In the Richness of the Earth: A History of the Archdiocese of Mil-waukee 1843-1958. Marquette University Press.
[4] Avella, Steven M. 2014. Confidence & Crisis: A History of the Archdiocese of Milwaukee1959-1977. Marquette University Press.
[5] Banchero, Stephanie, and Jennifer Levitz. 2012. “Vouchers Breathe New Life Into ShrinkingCatholic Schools,” The Wall Street Journal, June 14.
[6] Bentzen, Jeanet. 2016. “Acts of God? Religiosity and Natural Disasters Across SubnationalWorld Districts,” Working Paper.
[7] Black, Sandra E., and Kenneth L. Sokoloff. 2006. “Long-Term Trends in Schooling: The Riseand Decline (?) of Public Education in the United States.” in Hanushek and Welch (eds.)Handbook of the Economics of Education, Volume 1. Elsevier.
[8] Bottan, Nicolas, and Ricardo Perez-Truglia. 2015. “Losing My Religion: The Effects of Reli-gious Scandals on Religious Participation and Charitable Giving,” Journal of Public Economics129: 106-119.
[9] Brinig, Margaret F., and Nicole Stelle Garnett. 2014. Lost Classroom, Lost Community:Catholic Schools Importance in Urban America. The University of Chicago Press.
[10] Brinig, Margaret F., and Nicole Stelle Garnett. 2012. “Catholic Schools and Broken Windows,”Journal of Empirical Legal Studies 9: 347-367.
[11] Bronner, Ethan. 1998. “Wisconsin Court Upholds Vouchers in Church Schools,” The New YorkTimes, June 11.
27

[12] Burke, Lindsey. 2011. “Wisconsin’s Walker Proposes Major Expansion of Milwaukee Vouch-ers,” Heartlander March 22. Accessed June 2016 at http://news.heartland.org/newspaper-article/2011/03/22/wisconsin%E2%80%99s-walker-proposes-major-expansion-milwaukee-vouchers
[13] Campbell, David, and Robert Putnam. 2016. “God and Caesar in America,” Foreign Affairs91 (2), 34-43.
[14] Center on Education Policy. 2011. Keeping Informed about School Vouchers. Research reportaccessed 7/19/13 at http://files.eric.ed.gov/fulltext/ED522161.pdf
[15] Chen, Daniel. 2010. “Club Goods and Group Identity: Evidence from Islamic Resurgenceduring the Indonesian Financial Crisis,” Journal of Political Economy 118(2): 300-354.
[16] Chen, Daniel, and Jeremy Lind. 2016. “The Political Economy of Beliefs: Why Fiscal andSocial Conservatives/Liberals (Sometimes) Come Hand-in-Hand” Working paper.
[17] Dills and Hernandez-Julian. 2014. “Religiosity and State Welfare,” Journal of Economic Be-havior & Organization 104: 37-51.
[18] Duncan, Kyle. 2003. “Secularism’s Laws: State Blaine Amendments and Religious Persecu-tion,” Fordham Law Review 72(3), 493-593.
[19] Editorial Desk of the New York Times. 2002. “A Matter of Church and State.” New YorkTimes, February 20.
[20] Epple, Dennis, Richard E. Romano, and Miguel Urquiola. Forthcoming. “School Vouchers: ASurvey of the Economics Literature,” Journal of Economic Literature.
[21] Evans, William N. and Robert M. Schwab. 1995. “Finishing High School and Starting College:Do Catholic Schools Make a Difference?” Quarterly Journal of Economics 110: 941-974.
[22] Evers, Tony. 2016. Private School Choice Programs. Wisconsin Department of Public Instruc-tion.
[23] Figlio, David. 2009. “Voucher Outcomes,” in Brends, Springer, Ballou, and Walberg (eds.)Handbook of Research on School Choice, New York: Routledge.
[24] Figlio, David, and Cassandra Hart. 2014. “Competitive Effects of Means-Tested School Vouch-ers,” American Economic Journal: Applied Economics 6(1): 133-156.
[25] Fletcher, Jason, and Sanjeev Kumar. 2014. “Religion and Risky Health Behaviors among U.S.Adolescents and Adults,” Journal of Economic Behavior & Organization 104: 123-140.
[26] Franck, Raphael and Laurence Iannaccone. 2014. “Religious Decline in the 20th Century West:Testing Alternative Explanations,” Public Choice, 159(3): 385-414.
[27] Fruehwirth, Jane, Sryia Iyer, and Anwen Zhang. 2016. “Religion and Depression in Adoles-cence.” Working paper.
[28] Gerber, Alan, Jonathan Gruber, and Daniel M. Hungerman. 2016. “Does Church AttendanceCause People to Vote? Using Blue Laws’ Repeal to Estimate the Effect of Religiosity on VoterTurnout,” British Journal of Political Science 46(3): 481-500.
28
[29] Gill, Anthony. 2004. “State Welfare Spending and Religiosity A Cross-National Analysis,”Rationality and Society 16: 399-436.
[30] Gruber, Jonathan, and Daniel M. Hungerman. 2007. “Faith-based Charity and Crowd-outDuring the Great Depression,” Journal of Public Economics 91: 1043-1069.
[31] Gruber, Jonathan, and Daniel M. Hungerman. 2008. “The Church vs The Mall: What Happenswhen Religion Faces Increased Secular Competition?” Quarterly Journal of Economics 123:831-862.
[32] Henk, Bill, and Jennifer S Maney. 2013. “Higher Education Working Together to Help CatholicSchools: The Greater Milwaukee Catholic Education Consortium,” Catholic Education: aJournal of Inquiry and Practice 17(1): 164-185.
[33] Hout, Michael, and Tom Smith. 2015. “Fewer Americans Affiliate with Organized Religions,Belief, and Practice Unchanged,” Key findings from the General Social Survey, Press Summary.March 10.
[34] Hout, Michael, and Claude Fischer. 2002. “Why more Americans have No Religious Preference:Politics and Generations,” American Sociological Review 67(2), 165-190.
[35] Hoxby, Caroline. 2003a. “School Choice and School Productivity: Could School Choice be aTide that Lifts All Boats?” in Hoxby (ed.) The Economics of School Choice. University ofChicago Press.
[36] Hoxby, Caroline. 2003b. “School Choice and School Competition: Evidence from the UnitedStates” Swedish Economic Policy Review 10.
[37] Hungerman, Daniel. 2005. “Are Church and State Substitutes? Evidence from the 1996WelfareReform,” Journal of Public Economics 89: 2245-2267.
[38] Hungerman, Daniel. 2014. “Do Religious Proscriptions Matter? Evidence from a Theory-BasedTest,” Journal of Human Resources 49: 1053-1093.
[39] Hungerman, Daniel, and Kevin Rinz. 2016. “Where Does Voucher Funding Go? How Large-Scale Subsidy Programs Affect Private-School Revenue, Enrollment, and Prices,” Journal ofPublic Economics 136: 62-85.
[40] Iyer, Sryia. 2016. “The New Economics of Religion” Journal of Economic Literature, June,54(2): 395- 441.
[41] Kagan, J. 2011. Dissenting Opinion in Arizona Christian School Tuition Organization v. Kath-leen Winn 563 US. . Supreme Court of the United States.
[42] Kava, Russ. 2013. Milwaukee and Racine Parental Choice Programs. Wisconsin LegislativeFiscal Bureau
[43] Kava, Russ. 2015. Charter Schools. Wisconsin Legislative Fiscal Bureau Informational Paper27.
[44] Kisida, Brian, Laura Jensen, James C. Rahn, and Patrick J. Wolf. 2008. “The MilwaukeeParental Choice Program: Baseline Descriptive Report on Participating Schools,” SchoolChoice Demonstration Project Milwaukee Evaluation Report #3.
29

[45] Kisida, Brian, Laura I. Jensen, and Patrick J. Wolf. 2010. “The Milwaukee Parental ChoiceProgram: Descriptive Report on Participating Schools 2008-2009.” School Choice Demonstra-tion Project Milwaukee Evaluation Report #17.
[46] McDonald, Dale and Margaret Schultz. 2014. United States Catholic Elementary and SecondarySchools 2013-2014. National Catholic Educational Association.
[47] McShane, Michael Q., Brian Kisida, Laura I. Jensen, and Patrick J. Wolf. 2012. “MilwaukeeParental Choice Program: Descriptive Report on Participating Schools 2010-11. School ChoiceDemonstration Project Milwaukee Evaluation Report #33.
[48] Milwaukee Parental Choice Program. Various Years. “MPCP Facts and Figures,” accessedJune 2016 from http://dpi.wi.gov/sms/choice-programs/data/mpcp-historical .
[49] Meyer, Peter. 2007. “Can Catholic Schools be Saved?” Education Next: A Journal of Opinionand Research 7.
[50] Milligan, Kevin, Enrico Moretti, and Philip Oreopoulos. 2004. “Does Education Improve Cit-izenship? Evidence from the United States and the United Kingdom” Journal of Public Eco-nomics 88: 1667-1695.
[51] Nechyba, Thomas J. 2000. “Mobility, Targeting, and Private-School Vouchers,” The AmericanEconomic Review 90(1), 130-146.
[52] Otterman, Sharon. 2014. “Heartache for New York’s Catholics as Church Closings Are An-nounced,” New York Times, November 2.
[53] Paige, Rod. 2002. “A win for America’s Children,” The Washington Post, June 28.
[54] PBS. 2014. “Society and Community: American Education: the School Voucher Debate,”March 26, accessed October 2016 at http://www.pbs.org/now/society/voucherdebate.html.
[55] Richard, Alan. 2006. “Deal May Pave Way for Milwaukee Voucher Expansion,” EducationWeek, March 1.
[56] Rinz, Kevin. 2016. “Undone by the Market? The Effects of School Vouchers on EducationalInputs,” Working paper.
[57] Ritsche, Daniel. 2006. “Milwaukee Parental Choice Program,” Wisconsin Briefs from the Leg-islative Reference Bureau Brief 06-15.
[58] Rouse, Cecilia. 1998. “Private School Vouchers and Student Achievement: An Evaluation ofthe Milwaukee Parental Choice Program,” Quarterly Journal of Economics 113: 553-602.
[59] Strauss, Valerie. 2017. “If Trump Really Wants to Fix Troubled Schools, here are Five ThingsHe Could Do.” The Washington Post, January 24.
[60] U.S. Department of Education Schools and Staffing Survey. 2007-08. “Private School DataFile,” accessed June 2016 at https://nces.ed.gov/surveys/sass/tables/sass0708 008 s2n.asp .
[61] Velasco, Schuyler. 2015. “Charitable Giving Sets New Record, but Why are Religious Dona-tions Waning?” The Christian Science Monitor, June 16.
30

[62] Vielmetti, Bruce. 2015. “Bankruptcy Judge Confirms Milwaukee Archdiocese ReorganizationPlan,” Milwaukee Journal Sentinel, November 9.
[63] Voas, David, and Mark Chaves. 2016. “Is the United States a Counterexample to the Secular-ization Thesis?” American Journal of Sociology 121(5), 1517-1556.
[64] Weaver, Heather. 2011. “School Vouchers Inflict More Harm than Good,” Statement fromthe American Civil Liberties Union, accessed June 2016 at https://www.aclu.org/blog/school-vouchers-inflict-more-harm-good
[65] Wolf, Patrick. 2012. “The Comprehensive Longitudinal Evaluation of the Milwaukee ParentalChoice Program: Summary of Final Reports.” School Choice Demonstration Project Milwau-kee Evaluation Report #1.
31
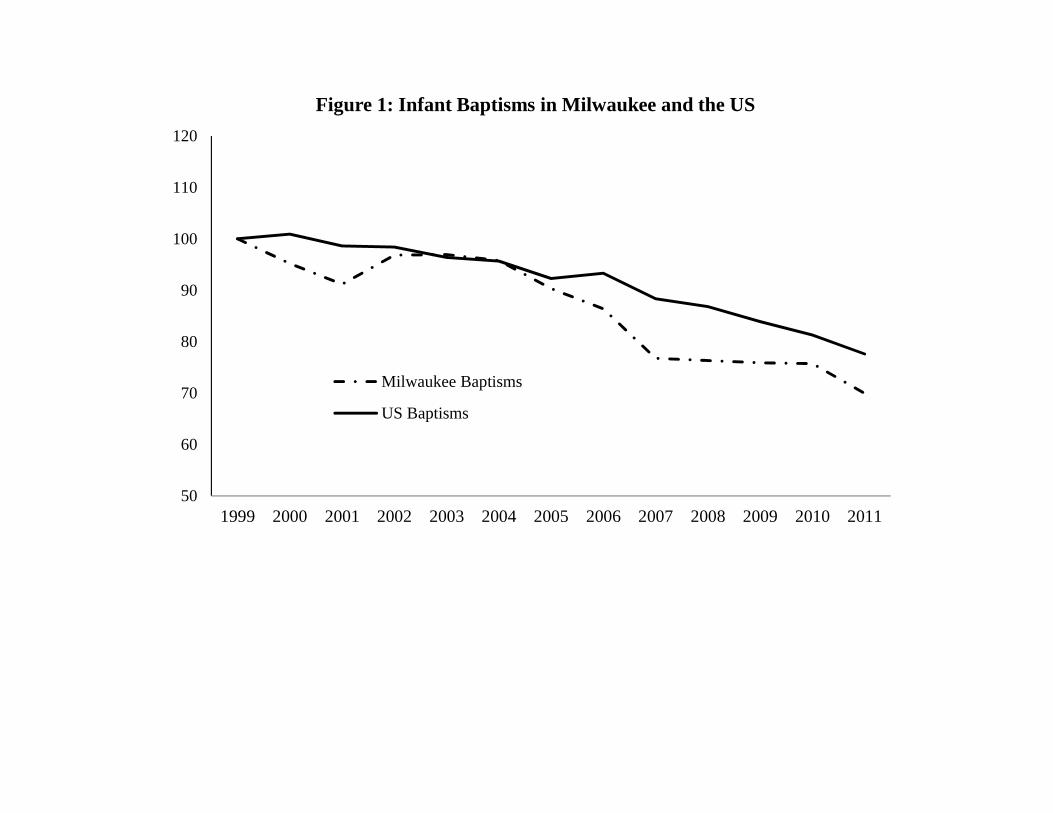
50
60
70
80
90
100
110
120
1999 2000 2001 2002 2003 2004 2005 2006 2007 2008 2009 2010 2011
Figure 1: Infant Baptisms in Milwaukee and the US
Milwaukee Baptisms
US Baptisms

Year Voucher Cap
Income Limits (% of Poverty)
Initial/Subsequent
Total Voucher Payments (millions)
Voucher Enrollment Voucher Cap
Income Limits (% of Poverty)
Initial/Subsequent
Total Voucher Payments (millions)
Voucher Enrollment
1999 4984 175/175 38.7 80072000 5326 175/175 49.2 96192001 5553 175/175 59.4 108822002 5783 175/175 65.6 116702003 5783 175/175 76.2 132682004 5943 175/175 87.4 15035 - - - -2005 6351 175/175 93.7 158872006 6501 175/220 110.5 177952007 6501 175/220 120.3 192332008 6607 175/220 128.8 201132009 6442 175/220 130.2 210622010 6442 175/220 130.8 209962011 6442 300/No Cap 144.3 23198 6442 300/No Cap 1.5 2282012 6442 300/No Cap 154.6 24708 6442 300/No Cap 3.2 509
Milwaukee Parental Choice Program Racine Parental Choice Program
Sources: (i) Various years of "MPCP Facts and Figures" and "PPSCP Facts and Figures," made available by the Wisconsin Department of Public Instruction, (ii) "Milwaukee and Racine Parental Choice Programs" by Kava (2013), and (iii) "Milwaukee Parental Choice Program: Descriptive Report on Participating Shcools, 2010-2011" by McShane, Kisida, Jensen, and Wolf (2012). The figures shown are in nominal dollars. "Year" refers to the fall of a school year (e.g., 1999 refers to the 1999-2000 school year). Voucher enrollment is based on the full-time-equivalent count of students done in September of each year. For the 2012-2013 year two MPCP reports were issued; we use numbers from the July 2014 report (the numbers are very similar in each report). Data from Racine is taken from the PPSCP Facts and Figures.
Table 1: Statistics on Choice Programs

(1) (2) (3) (4) (5)
Variables All Parishes Parishes w/ Schools Parishes w/o SchoolsParishes w/ Voucher Accepting Schools
Parishes w/ Schools not Accepting Vouchers
Voucher Revenue 246.7 335.1 0 898.5 0(100.10) (133.90) (0) (323.00) (0)
School Expenditures 1068 1450 0 1772 1259(131.50) (144.20) (0) (340.90) (101.80)
School Revenue 756.3 1027 0 1469 764.5(125.10) (152.70) (0) (377.60) (69.61)
Non-School Expenditures 816.1 822.7 797.7 798.4 837.2(66.13) (50.05) (212.90) (75.09) (66.90)
Non-school Revenue 1169 1293 826 1121 1394(83.98) (78.64) (217.30) (112.10) (102.90)
Operating Expenditures 1886 2276 797 2573 2100(157.90) (170.80) (212.90) (370.80) (158.20)
Operating Revenue 1930 2326 826 2595 2166(162.40) (176.90) (217.30) (380.90) (168.20)
Offertory Revenue 896.4 996.2 618.1 814.2 1104(71.67) (68.12) (184.00) (88.40) (90.09)
Observations 936 689 247 257 432
Table 2: Mean Financial Characteristics of Milwaukee Parishes, by Parish Type
Note: Standard errors are clustered at the parish level. Dollar amounts are in thousands of 2014 dollars. In columns 3 and 4, parishes with schools are grouped according to whether they ever received vouchers.

(1) (2) (3) (4) (5) (6) (7) (8)Voucher Revenue
School Expenditures
School Revenue
Non-School Expenditures
Non-school Revenue
Operating Expenditures
Operating Revenue
Offertory Revenue
Panel A: Raw CoefficientPotential Voucher 0.0323 0.0106 0.0163 -0.0048 -0.0085 0.0062 0.0084 -0.0053 Revenue (0.0111) (0.0102) (0.0104) (0.0024) (0.0037) (0.0107) (0.0105) (0.0022)
Panel B: Semi-Elasticity EstimatePotential Voucher 1194 392 601 -177 -313 230 310 -196 Revenue (410) (378) (383) (90) (138) (397) (388) (80)
Panel C: 2SLS Dollar-for-Dollar EffectsVoucher Revenue - 0.328 0.503 -0.148 -0.262 0.193 0.259 -0.164
(0.241) (0.200) (0.077) (0.108) (0.279) (0.259) (0.071)
Observations 936 936 936 936 936 936 936 936RHS Controls? Yes Yes Yes Yes Yes Yes Yes YesYear FEs? Yes Yes Yes Yes Yes Yes Yes YesParish FEs? Yes Yes Yes Yes Yes Yes Yes Yes
Table 3: Effects of Vouchers on Parish Outcomes, All Parishes
Notes: In each column, the coefficients in Panels A and B are alternate ways of expressing results from a single regression, while Panel C shows the results from a 2SLS regression. The coefficients in Panel A are from regressions on potential voucher revenue in a parish's community. The coefficients in Panel B adjust the Panel A coefficients by the average amount of potential voucher spending in communities with a voucher program. These coefficients can be interpreted as semi elasticities; they suggest the effect of going from no voucher program to an average-sized voucher program. The coefficients in each column of Panel C use potential voucher spending as an instrumental variable; they show how a dollar of extra voucher revenue, generated via a policy change, affects other church outcomes. Standard errors in parentheses are clustered at the parish level. Potential voucher revenue is calculated by applying voucher eligibility and value rules in each year to families with children living in census tracts with centroids that are within two miles of each parish in 1999. Dollar amounts are in thousands of 2014 dollars. All regressions include total allegations of abuse in a parish and the controls for neighborhood characteristics summarized in Appendix Table 1, which are calculated using people living in census tracts with centroids that are within two miles of each parish. If no such tract is available, characteristics of the closest census tract are used.

(1) (2) (3) (4) (5) (6)Non-School Expenditures
Non-school Revenue
Offertory Revenue
Non-School Expenditures
Non-school Revenue
Offertory Revenue
Potential Voucher Revenue X Parish with School -188 -352 -218 -404 -627 -293(91) (139) (80) (279) (266) (169)
Potential Voucher Revenue X Parish with no School 102 645 351 5 230 200 (176) (235) (152) (197) (283) (133)
Lead Potential Voucher Revenue X Parish with School - - - 23 -129 -82(108) (127) (66)
Lead Potential Voucher Revenue X Parish with no School - - - 116 578 229(173) (266) (108)
Wald test statistic [F(1,70)] 2.628 16.660 11.850 1.961 12.150 8.637P-value 0.110 0.0001 0.001 0.166 0.0009 0.004Observations 936 936 936 812 812 812R-squared 0.915 0.948 0.979 0.918 0.951 0.982Notes: In each column, the coefficients are from the same regression. These estimates are semi-elasticity estimates as in Panel B of Table 3; the reported coefficient takes the raw coefficient and standard error on potential voucher revenue and multiplies them by the average amount of potential voucher spending in communities with a voucher program. These coefficients thus suggest the effect of going from no voucher program to an average-sized voucher program. Standard errors in parentheses are clustered at the parish level. The Wald test is a test that the two Potential Voucher Revenue coefficients in a given regression are equal. The last three columns include a set of lead potential voucher revenue varaibles constructed using the voucher rules from two years in the future.
Table 4: Effects of Vouchers on Parish Outcomesby Presence of a School: Semi-Elasticity Estimates

(1) (2) (3) (4) (5)Baseline Log Outcome Time Trends Time Trends Raw Data
Dependent Variable: Actual Voucher RevenuePotential Voucher Revenue 1236 4.967 580 675 1236 (424) (1.224) (200) (161) (424)
Dependent Variable: Non-School ExpenditurePotential Voucher Revenue -181 -0.323 -215 -217 -166 (86) (0.111) (79) (71) (86)
Dependent Variable: Non-School RevenuePotential Voucher Revenue -176 -0.300 -132 -235 -206 (79) (0.095) (111) (116) (128)
Dependent Variable: Offertory RevenuePotential Voucher Revenue -176 0.327 -83 -82 -166 (79) (0.093) (56) (55) (73)
RHS Controls? Yes Yes Yes Yes YesYear FEs? Yes Yes Yes Yes YesParish FEs? Yes Yes Yes Yes YesTime Trends? None None Parish ZIP Code None
Table 5: Further Robustness Results
Notes: Each coefficient is from a separate regression. The sample is parishes with schools. Coefficients are semi-elasticity coeficients that suggest the effect of going from no voucher program to an average-sized voucher program. Standard errors in parentheses are clustered at the parish level. The first column reports baseline results for the sample of parishes with schools. The second column logs the dependent variable. The third column adds parish trends and the fourth column ZIP-code level trends. The last column does not adjust the dependent variable for outliers.
Semi-Elasticities

(1) (2) (3) (4) (5)
BaselineLog Outcome
(× 100)† Time Trends Time Trends Raw Data
Dependent Variable: Actual Voucher RevenuePotential Voucher Revenue 0.0327 0.013 0.0153 0.0178 0.0327 (0.011) (0.003) (0.005) (0.004) (0.011)
Dependent Variable: Non-School ExpenditureVoucher Revenue -0.146 -0.026 -0.372 -0.348 -0.124 (0.075) (0.013) (0.127) (0.106) (0.069)
Dependent Variable: Non-School RevenueVoucher Revenue -0.210 -0.024 -0.216 -0.394 -0.154 (0.094) (0.008) (0.172) (0.181) (0.078)
Dependent Variable: Offertory RevenueVoucher Revenue -0.142 -0.027 -0.136 -0.136 -0.123 (0.062) (0.009) (0.084) (0.076) (0.051)
RHS Controls? Yes Yes Yes Yes YesYear FEs? Yes Yes Yes Yes YesParish FEs? Yes Yes Yes Yes YesTime Trends? None None Parish ZIP Code None†Coefficients are 2SLS coeficients that suggest the effect of an additional dollar voucher revenue. The exception is the log-outcome coefficients, which are multiplied by 100 for readibility.
Each coefficient is from a separate regression. The sample is parishes with schools. Standard errors in parentheses are clustered at the parish level. The first column reports baseline results for the sample of parishes with schools. The second column logs the dependent variable. The third column adds parish trends and the fourth column ZIP-code level trends. The last column does not adjust the dependent variable for outliers
Table 6: Further Robustness Results2SLS

(1) (2) (3) (4)Parish Closure Parish Closure Parish Merger Parish Merger
Potential Voucher -0.0061 -0.0051 -0.0074 -0.0096 Revenue (0.0034) (0.0011) (0.0022) (0.0016)
Observations 1337 1337 1193 1193RHS Controls? Yes No Yes NoYear FEs? Yes Yes Yes YesParish FEs? Yes Yes Yes Yes
Table 7: Hazard Regressions on Parish Mergers
Notes: Estimates are coefficients from Cox proportional hazard models with time-varying covariates. Dollar amounts are in thousands of 2014 dollars. The first 2 columns estimate the conditional likelihood that an open parish is closed in a given period. The last 2 columns estimate the conditional likelihood that an open parish is involved in a merger in the current period. Standard errors in parentheses are produced through 200 bootstrap replications.

(1) (2) (3) (4) (5)Parishes w/
Parishes w/ Parishes w/ Schools Parishes w/oVariable: All Parishes Schools Voucher Schools No Vouchers Schools
Population share: White, age 5-9 4.865 4.994 3.931 5.627 4.504(0.22) (0.21) (0.32) (0.20) (0.60)
Population share: White, age 10-14 5.109 5.216 4.103 5.877 4.81(0.24) (0.21) (0.36) (0.19) (0.68)
Population share: White, age 15-17 3.218 3.262 2.534 3.696 3.093(0.15) (0.15) (0.26) (0.13) (0.42)
Population share: White, age 18-19 2.12 1.739 1.373 1.957 3.183(0.12) (0.08) (0.12) (0.09) (0.29)
Population share: Black, age 5-9 1.037 1.073 2.005 0.519 0.938(0.18) (0.23) (0.51) (0.15) (0.30)
Population share: Black, age 10-14 1.04 1.057 1.957 0.522 0.993(0.19) (0.23) (0.53) (0.14) (0.33)
Population share: Black, age 15-17 0.631 0.65 1.161 0.346 0.576(0.11) (0.14) (0.31) (0.09) (0.19)
Population share: Black, age 18-19 0.382 0.361 0.692 0.164 0.438(0.07) (0.08) (0.18) (0.05) (0.13)
Population share: Other, age 5-9 0.962 1.004 1.65 0.62 0.843(0.10) (0.12) (0.22) (0.07) (0.20)
Population share: Other, age 10-14 0.834 0.865 1.402 0.546 0.746(0.09) (0.10) (0.19) (0.07) (0.18)
Population share: Other, age 15-17 0.448 0.464 0.77 0.281 0.404(0.05) (0.06) (0.11) (0.04) (0.10)
Population share: Other, age 18-19 0.311 0.283 0.486 0.161 0.391(0.04) (0.04) (0.08) (0.02) (0.09)
Population share: Hispanic, age 5-9 1.082 1.109 2.041 0.555 1.005(0.17) (0.20) (0.42) (0.09) (0.32)
Population share: Hispanic, age 10-14 0.942 0.95 1.75 0.474 0.921(0.14) (0.17) (0.36) (0.08) (0.29)
Population share: Hispanic, age 15-17 0.522 0.516 0.969 0.246 0.537(0.08) (0.10) (0.20) (0.05) (0.16)
Population share: Hispanic, age 18-19 0.347 0.317 0.595 0.151 0.432(0.05) (0.06) (0.13) (0.03) (0.11)
Unemployment rate 4.532 4.452 5.772 3.667 4.756(0.22) (0.25) (0.44) (0.20) (0.46)
Median family income 73,728 74,120 60,550 82,193 72,633(2173) (2532) (3759) (2423) (4345)
Educational attainment: less than high school 14.29 14.23 20.3 10.62 14.46(0.97) (1.11) (2.02) (0.77) (1.99)
Educational attainment: some college 28.31 28.51 27.61 29.05 27.76(0.44) (0.44) (0.85) (0.47) (1.15)
Educational attainment: college or higher 26.44 26.13 19.43 30.12 27.31(1.32) (1.54) (1.74) (1.90) (2.61)
Marital status: married 50.12 51.3 44.21 55.52 46.82(1.50) (1.30) (1.96) (1.19) (4.41)
Marital status: separated 1.398 1.385 1.906 1.074 1.434(0.10) (0.11) (0.19) (0.09) (0.23)
Marital status: widowed 6.37 6.789 6.366 7.041 5.2(0.20) (0.22) (0.36) (0.26) (0.31)
Marital status: divorced 9.883 10.18 11 9.688 9.059(0.23) (0.25) (0.31) (0.33) (0.48)
Share born abroad 6.329 6.404 9.545 4.535 6.118(0.62) (0.70) (1.48) (0.41) (1.32)
Share not speaking English at home 12.14 12.14 19.25 7.905 12.13(1.27) (1.45) (3.11) (0.64) (2.67)
Observations 936 689 257 432 247
Table A1: Mean Community Characteristics of Milwaukee Parishes, by Parish Type